


- Investigation of sparking electro discharge machining for fabricating silicon carbide reinforced Al7050 alloy-based composite through stir casting
B.R. Senthil Kumara,*, R. Sivakumarb, M. Chrispin Dasc and V. Muthuramand
aProfessor, Department of Aeronautical Engineering, Nehru Institute of Engineering and Technology, Coimbatore, 641105
bProfessor, Department of Civil Engineering, E.G.S. Pillay Engineering College, Nagapattinam 611002, Tamilnadu, India
cAssociate Professor, Department of Mechanical Engineering, St. Joseph’s Institute of Technology, OMR, Chennai
dProfessor, Department of Mechanical Engineering, Vels Institute of Science, Technology and Advanced Studies (VISTAS), ChennaiThis article is an open access article distributed under the terms of the Creative Commons Attribution Non-Commercial License (http://creativecommons.org/licenses/by-nc/4.0) which permits unrestricted non-commercial use, distribution, and reproduction in any medium, provided the original work is properly cited.
This research investigates the application of spark electro-discharge machining for fabricating a stir-cast composite reinforced with silicon carbide, based on the Al7050 alloy. Employing a response surface methodology with a central composite design, the study explores 20 combinations of control parameters to investigate their collective influence. Specifically, it focuses on understanding how three key machining parameters—current, pulse-on time, and pulse-off time—affect material removal rates, electrode wear, and surface roughness. A novel teaching-learning-based optimization strategy, integrating response surface methodology with grey relational analysis, is utilized to optimize multiple responses. The optimized parameters derived through response surface methodology are a current of 10 amps, a pulse-on time of 6 µsec, and a pulse-off time of 5 µsec, resulting in significant improvements. These optimized settings correspond to material removal rates, electrode wear rates, and surface roughness values of 0.01074 g/min, 0.0040 g/min, and 4.9395 µm, respectively. Additionally, the teaching-learning-based optimization method employs grey relational analysis initially to rank the input factors. With the optimized process variables obtained using GRA-TLBO—8.48 amps for current, 6.22 µsec for pulse-on time, and 3.34 µsec for pulse-off time—the material removal rate, electrode wear rate, and surface roughness are further enhanced to 0.01159 g/min, 0.00408 g/min, and 3.7202 µm, respectively
Keywords: Al7050, Ceramics processing, RSM, MCDM, GRA-TLBO.
In the production of goods, most engineering sectors require materials with outstanding qualities, including high resistance to corrosion and wear, low weight, affordability, and strong strength. However, finding a single material with all these qualities is challenging. Hence, composite materials were developed to address this crucial need [1]. A composite material consists of reinforcement and a matrix phase. In recent decades, researchers have increasingly focused on aluminium matrix composites (AMCs) due to their key properties, including low density compared to other lightweight alloy-based composites, excellent castability, and affordability. These exceptional attributes have led to widespread use of ceramic particulate-embedded AMCs in the automobile and aerospace sectors for various applications, such as cylinder liners, air intake valves, bumpers, pistons, spoilers, engine blocks, drive shafts, disc brakes, etc [2-4].
In this study, Al7050 alloy is chosen as the matrix phase due to its high strength, low density and high thermal stability. In addition, owing to its good thermal conductivity, Al7050 alloy materials are used in high temperature applications [5]. Desired technological properties of the particles embedded AMCs largely dependent on the type of ceramic reinforcing particles and its quantity added. Extensively used ceramic particulates are TiC, MoS2, SiC, Gr, ZrB2, B4C, Al2O3, etc. Among these, SiC has pulled several researchers attention due to its inherent excellent characteristics such as good wetting ability, high strength and wear resistance at elevated temperatures, economical, excellent corrosion resistance and less chemical reactivity [6]. These excellent desired aspects in SiC induced us to consider as the reinforcing particles in this study to augment the properties of base material. Several researchers have discussed that the optimal wt% of reinforcement for composite material fabrication is 15 wt% [7].
Although, various manufacturing methods are available to synthesize particulates embedded AMCs, there exist some drawbacks such as poor dispersion of reinforcing constituents in the matrix, expensive fabrication and difficult to attain net shape [8]. Stir cast fabrication methodology found to be appropriate to synthesize composites and it has various benefits such as high production, good dispersion of particulates owing to stirring at higher rpm, ease to attain components closer to the required form and most economical relative to other fabrication methods [9, 10].
The effective applications of composites are limited as a result of excessive tool wear and machining cost in conventional material removal processes. This negative phenomenon is mainly associated to the presence of reinforcing parts in the base material [11]. Therefore, alternate machining techniques are necessary to machine composites with good accuracy and surface quality. Several non-contact machining processes such as water jet machining, electro-chemical machining, electro-discharge machining (EDM) and laser beam machining have been experimented to machine composite materials. Among them, EDM (non-contact thermal process) found as the promising method to machine harder material like ceramics, titanium, tungsten carbide, nickel based alloys and composites with desired accuracy and surface finish [12, 13]. It is also renowned that achieving high machining efficiency in EDM along with less surface waviness and electrode erosion are challenging when composite materials as specimen. Therefore, it is needed for multi-characteristics optimization system to satisfy the conflicting objectives (viz., maximum MRR, minimum electrode wear and surface roughness) at a time.
Previous studies have conducted extensive sensitivity analysis and optimization of process variables to enhance the performance metrics of Electrical Discharge Machining (EDM) on various tougher and higher-strength materials [14-19]. For instance, researchers investigated process factors including current, electrode polarity, spark off-time, and sparking time during the EDM of Al7050-B4C composites. According to experimental results, positive polarity minimized tool erosion and surface waviness and produced the highest rate of workpiece material ablation compared to negative polarity [14]. In the case of the Al/TiC/B4C hybrid composite, an examination of electrical independent factors such as gap voltage, spark duration, and pulse current was conducted. The findings showed that pulse current strongly affected all performance parameters (MRR, hole dilation, and tool erosion rate) in a linear fashion with progressive variations in current levels [15]. The efficacy of EDM was assessed using a combination of overcut, form tolerances, and taper, focusing on the quality of machined holes. Surprisingly, it was demonstrated that spark off-time significantly contributed to hole quality metrics in relation to discharge current, sparking duration, and flushing force [16]. Feasibility studies conducted by several researchers [17, 18] on composite materials revealed that the reinforcing components in the matrix reduced matrix phase deterioration and inhibited effective sparking. Additionally, the impact of increasing the weight percentage of SiC in the Al-SiC composite's performance characteristics during machining was investigated. It was shown that while electrode wear increased, the rate of material erosion reduced as the quantity of reinforcement in the matrix phase increased [6].
Response surface methodology (RSM) was exploited to understand the interaction between independent process variables and output metrics during machining of Magnesium (Mg) alloy. The process effect analysis showed direct proportional relationship for surface roughness and tool erosion with increase in pulse on and off duration [19]. From the above discussions, it is clear that current, spark on duration and pulse interval have significant impact on EDM performance metrics and showed large variations in the responses during different levels of operating conditions. Hence, it is essential to control and optimize the most influencing variables to get the desired outcomes (i.e., Maximum MRR and Minimum EWR & SR). These kind of opposite nature objectives problems falls under multi-criteria decision making (MCDM) problems.
EDM process variables can be optimized using different optimization techniques like Taguchi [20], RSM [6], Grey relational analysis (GRA) [4, 21], TOPSIS [22], TLBO [23, 24], Firefly and Cuckoo Search Algorithms [25], etc., From the previous research on EDM process variable optimization, it is apparent that TLBO algorithm is efficient and better MCDM method to solve problems with less computational effort and time. Moreover, TLBO is known to exhibit robustness in various optimization scenarios, including noisy or uncertain objective functions [26].
Based on a thorough review of the literature, it is evident that among the various combinations of ceramic reinforcements and aluminium alloy matrices, Al/SiC is one of the most significant Aluminum Matrix Composites (AMCs). It possesses appealing mechanical, thermal, and physical properties, rendering it suitable for the production of high-stress components. The potential applications of Al/SiC in various technical sectors can be greatly enhanced by producing high-quality components. EDM is often employed for machining harder materials like composites, and previous studies have primarily focused on optimizing EDM process parameters using techniques such as Taguchi, RSM, GRA, GA, etc.However, there are limited examples of multi-response optimization in diesinking EDM of composites based on Al7050. Specifically, the application of hybrid optimization techniques, such as GRA-TLBO, for multi-objective optimization of diesinking EDM process parameters on Al7050-15SiC, has not been explored previously.
Thus, the stir casting method is employed in this study to synthesize Al7050/15SiC, and diesinking EDM is utilized to investigate the machinability of the resulting composite. RSM is employed to develop a quadratic regression model of MRR, EWR, and SR. Subsequently, the desirability function technique is applied to optimize these conflicting responses. The process parameters are further refined using a unique hybrid optimization technique called GRA-TLBO to achieve the desired outcomes. GRA-TLBO offers promising results in controlled experimental settings, its effectiveness in industrial environments hinges on factors such as equipment compatibility, material characteristics, and operational constraints. Additionally, the robustness and reliability of the optimized parameters need validation across diverse production scenarios to ensure consistent performance. Finally, a confirmatory experimental test is conducted to assess the effectiveness of both RSM and GRA-TLBO..
Base alloy and reinforcement
In this work, Al7050 alloy is considered as the matrix material and the ingots are procured from Perfect Aluminium Alloys, Coimbatore, India. To enhance the material characteristics of Al7050 alloy, Silicon carbide (SiC) of average particle size 35 μm is selected as the reinforcement particulates and it is purchased from Covai Metal Mart, Coimbatore, India. SiC has properties such as good thermal conductivity, low cost, excellent chemical resistance and high wettability with the matrix material [37]. Similarly, Al7050 alloy possess characteristics such as high strength, good wear resistance, low density and excellent corrosion resistance. It has been extensively used to produce aircraft structures and automotive components like fuselage, engine casing, turbine casing, etc [5].
Fabrication and Mechanical testing of Al7050-15SiC
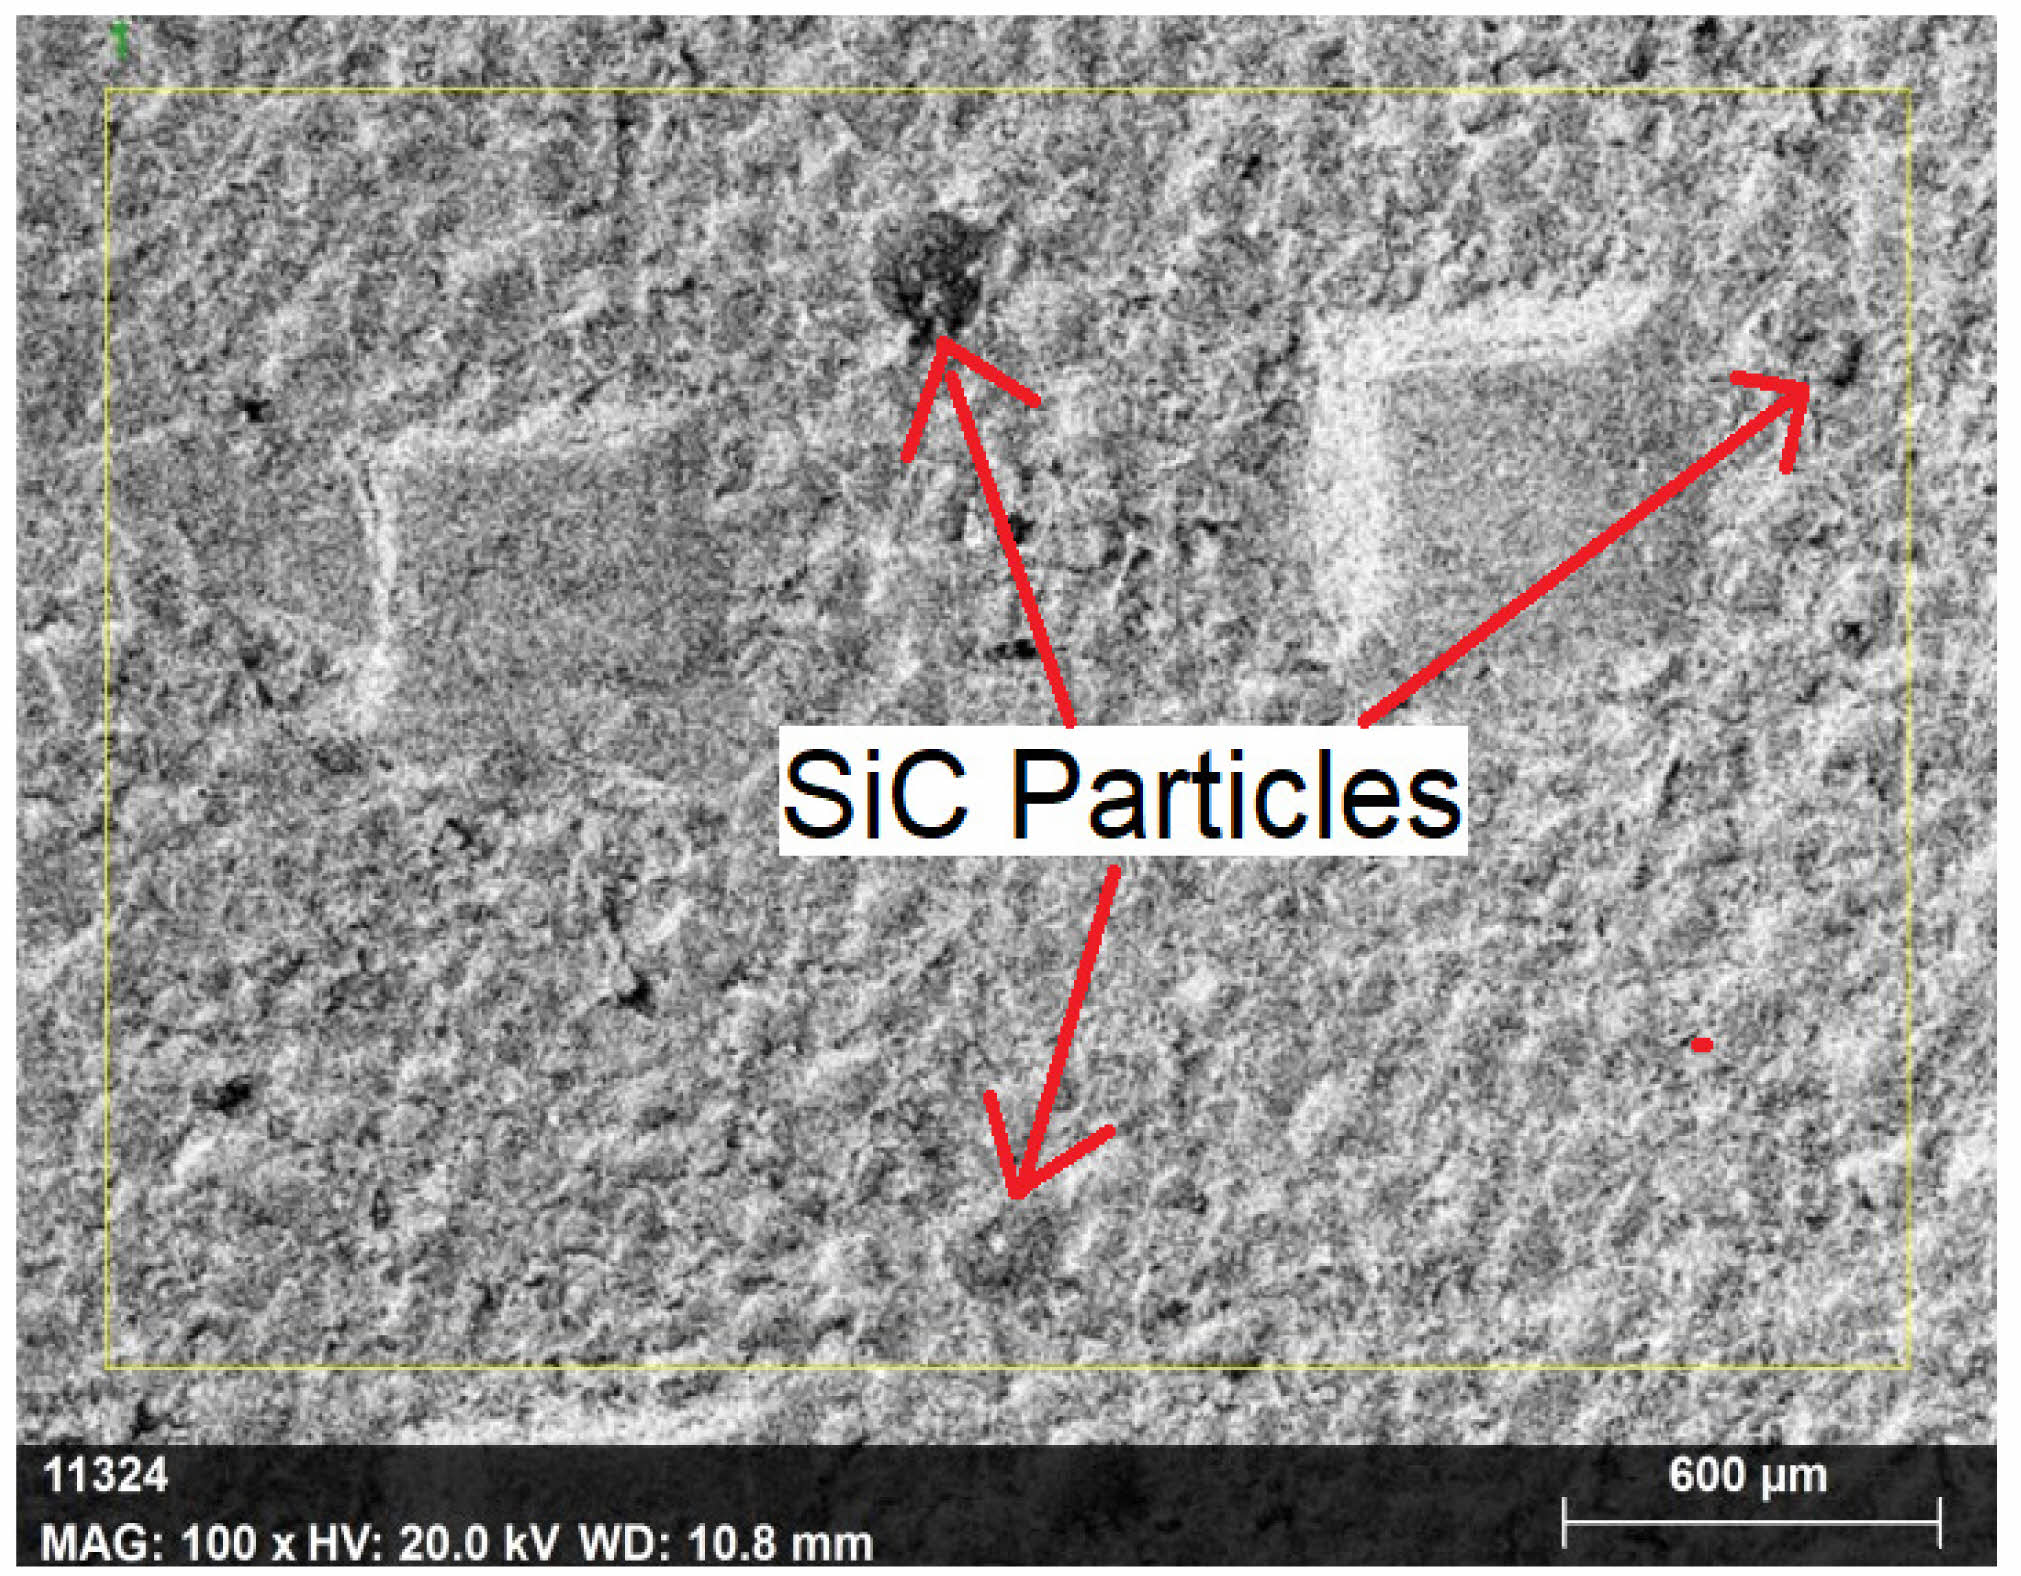
Al7050-15SiC cast specimen is produced for EDM experimentation through bottom pouring stir cast method. Initially, Al7050 alloy ingots are melted at 800 oC in a furnace using graphite crucible and the reinforcing particulates i.e., 15 wt% SiC is preheated simultaneously at 400 oC to remove away the moisture content. This preheat treatment of reinforcement is done to enable good bonding between the matrix material and SiC. Then, the heated strengthening particulates are poured in to the matrix melt and stirred at 650 rpm for 10 mins. High speed mechanical stirring action is opted in this work in order to facilitate even spread of reinforcements in Al7050 alloy. Finally, the composite mixture is poured in to a pre-heated die and permitted to solidify. The dispersion of SiC in the Al7050 matrix alloy is analyzed using a scanning electron micrograph of the produced composite, as depicted in Fig. 1, before embarking on the machinability investigation of Al7050-15SiC. The results reveal that the reinforced SiC particles are uniformly distributed throughout the matrix phase, suggesting a positive influence on the mechanical properties of the resulting composite.
According to ASTM E10 and ASTM E8 standards, Brinell hardness and tensile tests are conducted to evaluate the impact of 15 wt% SiC in Al7050 alloy. Al7050-15SiC demonstrates a hardness of 118 BHN and a maximum tensile strength of 269 MPa, respectively. In comparison to standard Al7050 alloy, the synthesized composite exhibits a 73% increase in hardness and a 62% increase in strength. The enhanced hardness and strength values of Al7050-15SiC can be attributed to the SiC elements in the Al7050 matrix that bear load under loading conditions. A similar observation was reported in reference [38].
Experimental setup
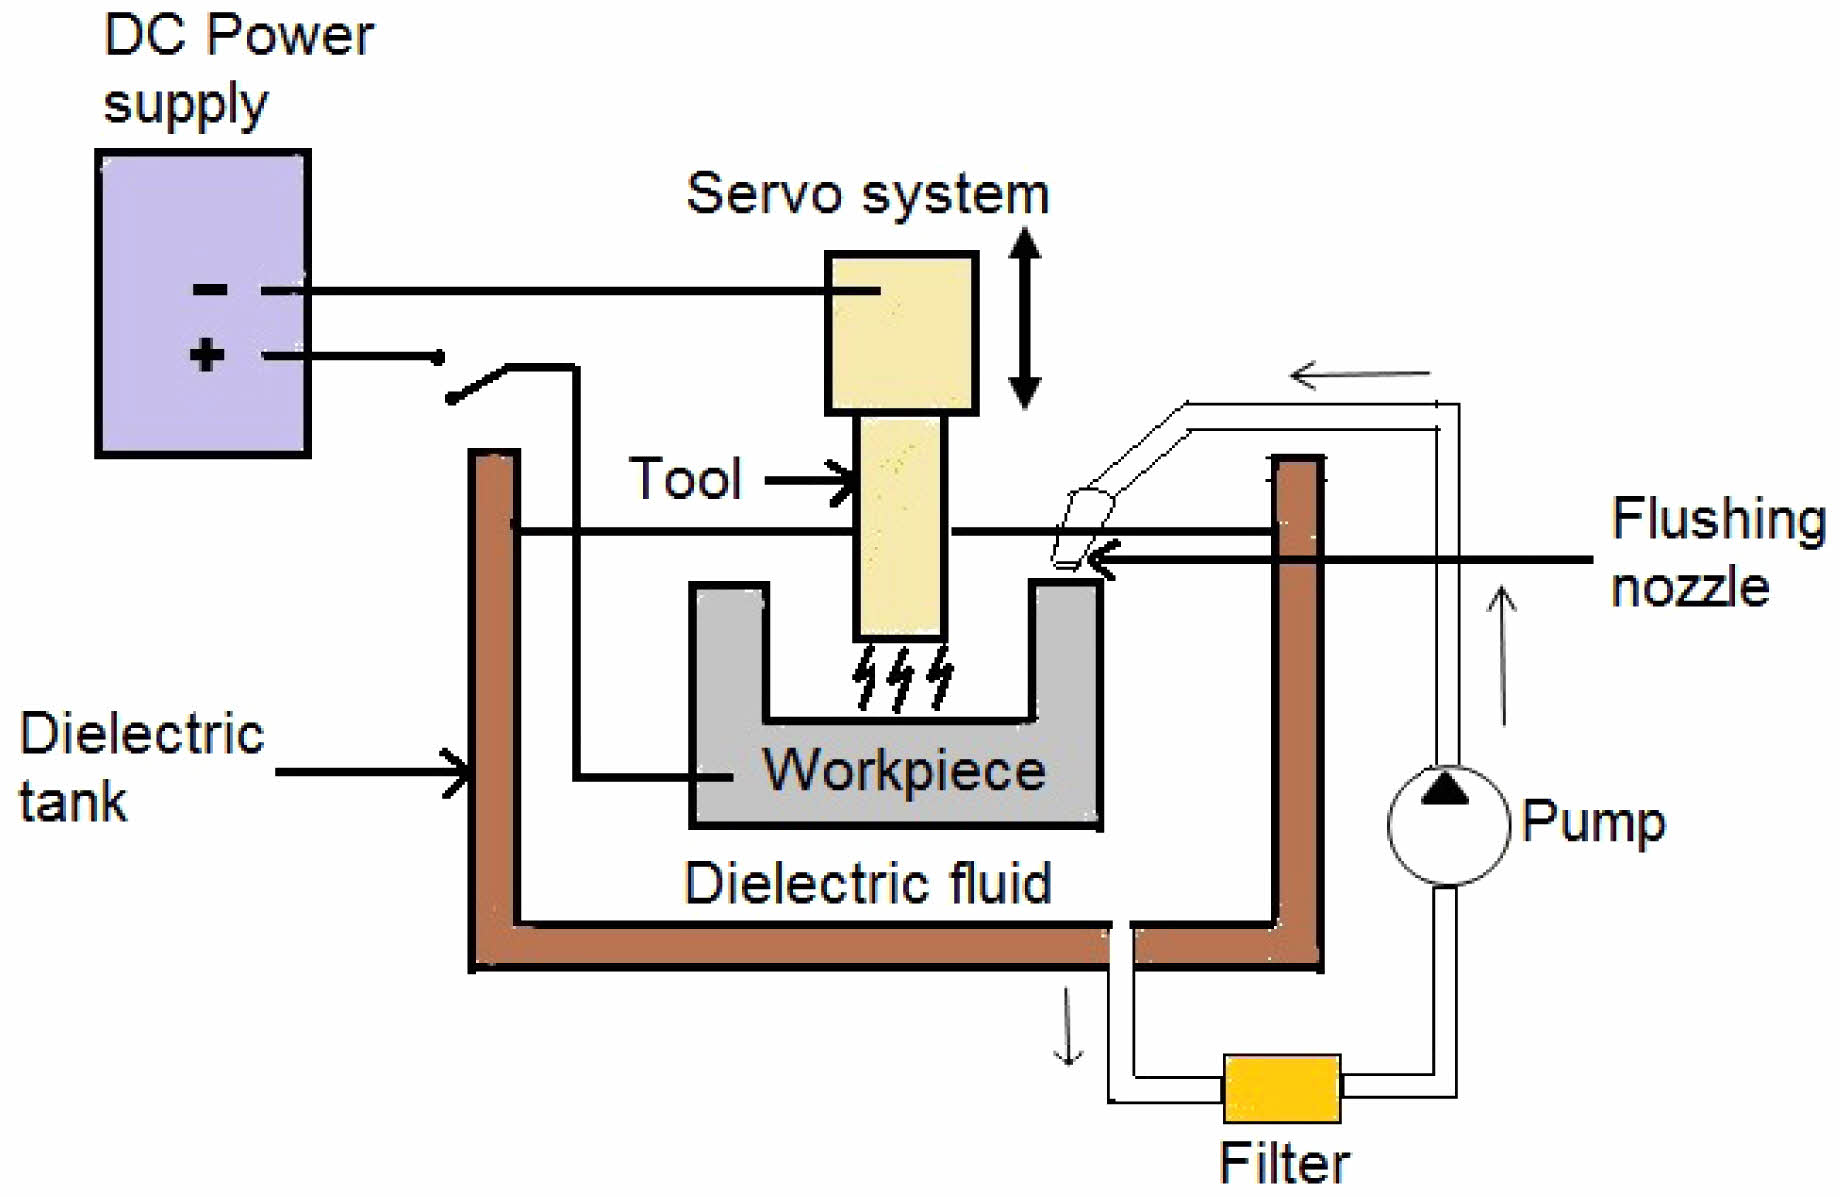
Al7050-15SiC composite is machined under a variety of processing conditions. The line diagram of the EDM process is explained in Fig. 2 and is utilised in the experimental work with an ELEKTRA PLUS Spark EDM PS 50 ZNC series machine.Copper electrode of length 20 mm and 3 mm diameter is used to produce through holes in this study. It is important to note that good electrical conductivity and less wear are the important characteristics of any tool material. Among commonly used tool materials such as brass, aluminium, copper and graphite, copper has the above said properties as inherent characteristics. Also, copper electrode produces high material removal from the work piece along with good surface quality [17].
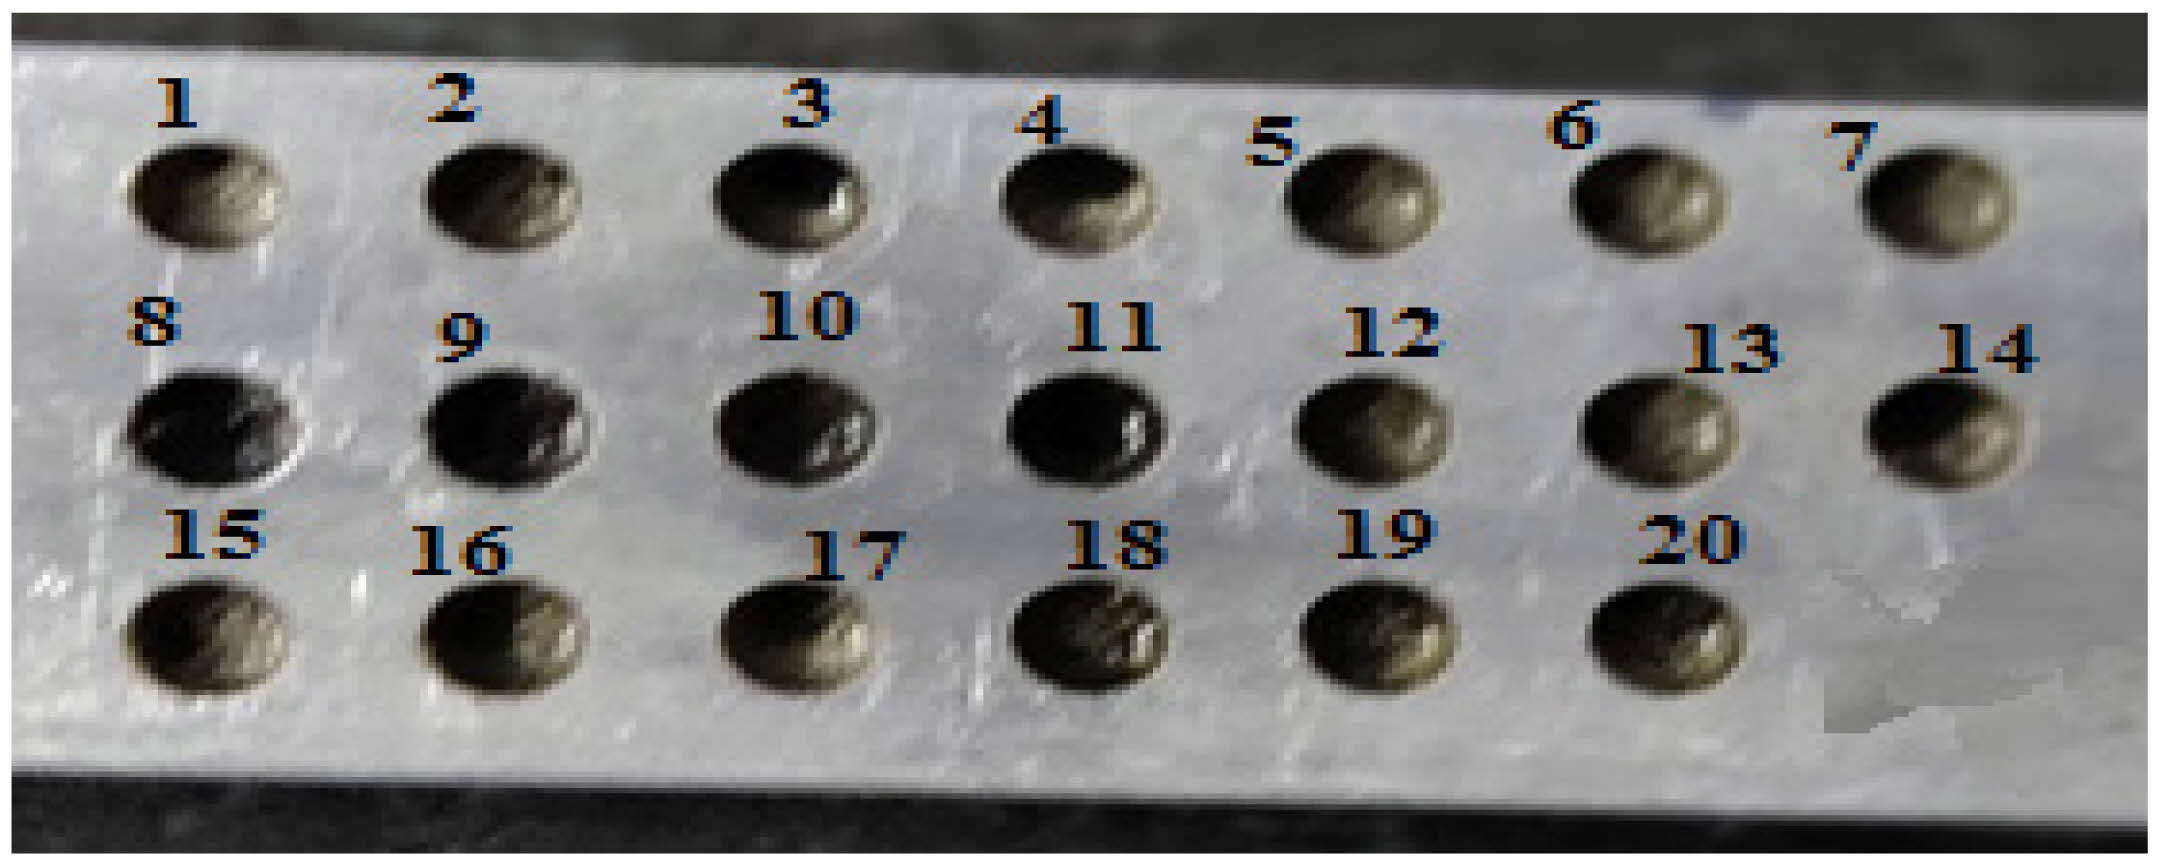
Numerous electrical and non-electrical factors, including electrode shape, pulse interval, open discharge voltage, flushing pressure, polarity, discharge current, and more, have an impact on the Electrical Discharge Machining (EDM) process. However, assessing how each of these factors affects performance traits can be challenging. Therefore, in this study, the important electrical parameters that have shown notable variations in output characteristics are I (current), Pon (pulse on-time), and Poff (pulse off-time) [38]. The dielectric tank dimensions are 800 × 500 × 350 mm, and the EDM machine used in this study has a load capacity of 3 KVA. Fig. 3 illustrates the machined Al7050-15SiC composite.
Experimental design for machining Al7050 based composite
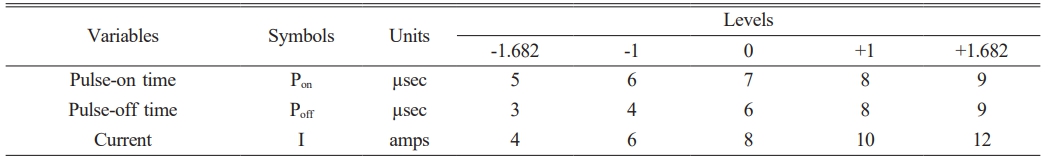
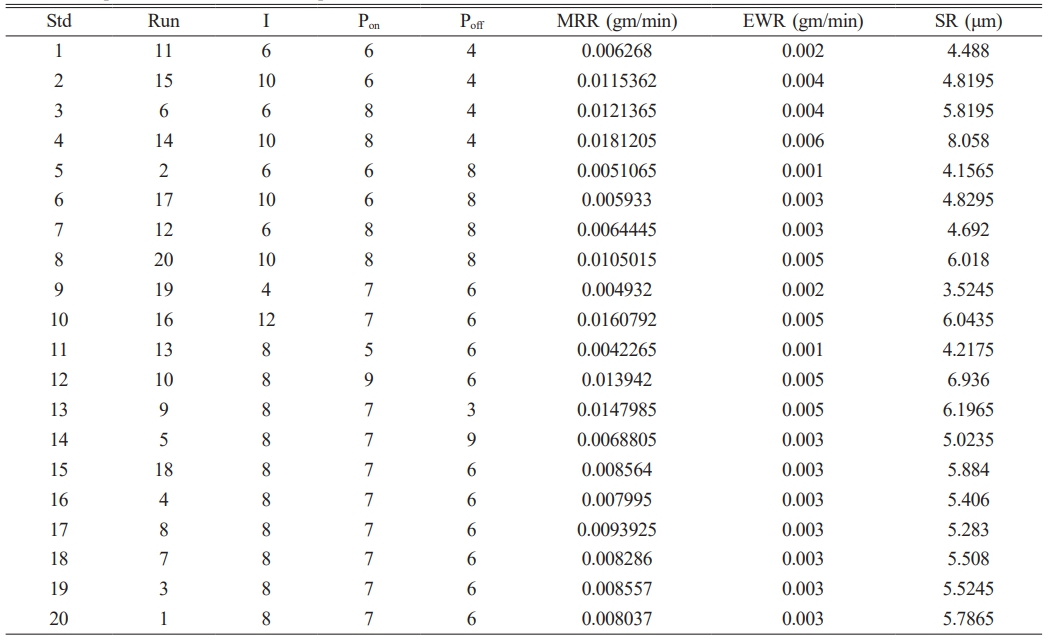
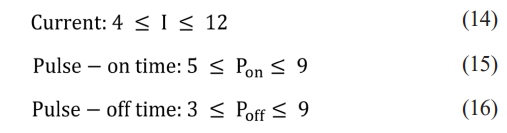
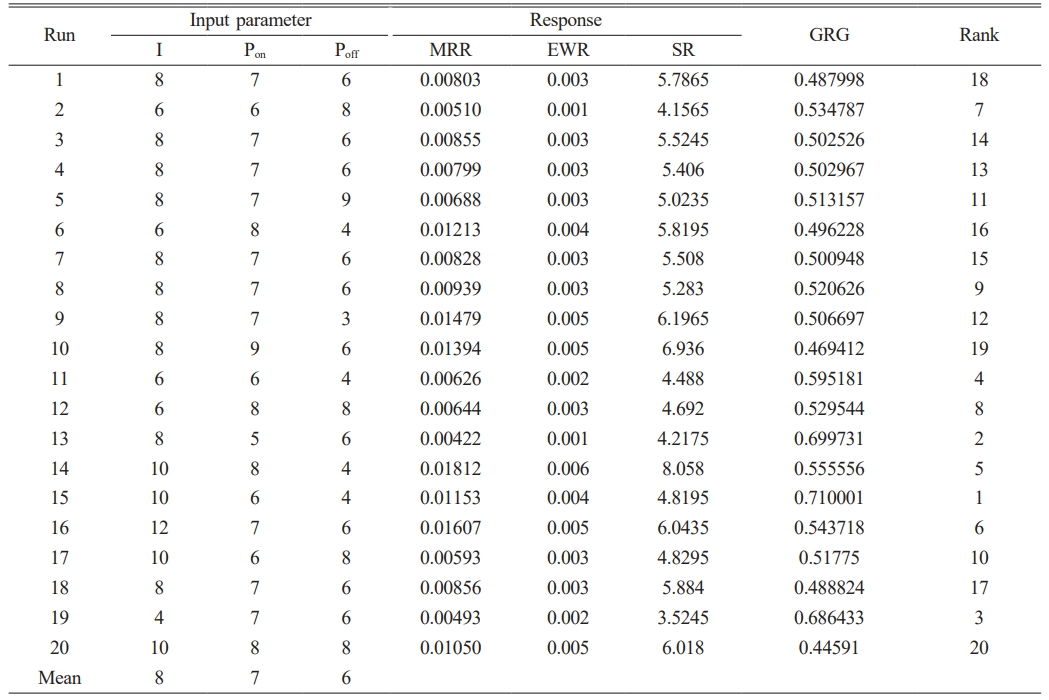
In this investigation, we employ the RSM central composite design methodology to structure our experimental trials. Utilizing the Design Expert program, we generate 20 runs, with the number of trials dictated by the process parameters and the predefined ranges chosen for the study. These ranges are determined based on both the capacity of the machining equipment and preliminary trials conducted on the Al7050-15SiC composite. Notably, we observe that the ablation of workpiece material remains relatively unaffected when discharge current values are below 4 amps. Conversely, we disregard current levels surpassing 12 amps to ensure stable machining and mitigate excessive tool wear. To identify optimal settings for spark interval and pulse length, we select a broad range depending on the machine's capacity. Specific details regarding the range and levels of the process variables are provided in Table 1. Pulse-on time influences MRR by determining the duration of electrical discharge, affecting the amount of material removed per pulse. Pulse-off time regulates the interval between pulses, impacting EWR by allowing for electrode cooling and debris removal. Current controls the intensity of the electrical discharge, affecting both MRR and EWR. Optimization involves adjusting these variables to balance MRR, EWR, and surface roughness for efficient machining of the composite material. Each experimental run includes a combination of eight factorial points (± 1 levels), six star points (± 1.68 levels), and six center points. Additionally, we conduct six replication runs using mid-level machining settings to evaluate the repeatability of the EDM process. Throughout randomized tests, we carefully consider the influence of various EDM technique factors on performance metrics such as material ablation rate, tool electrode degradation rate, and surface irregularities. Furthermore, Table 2 presents additional combinations of process factors alongside their corresponding measured responses.
Methods for evaluating machining metrics
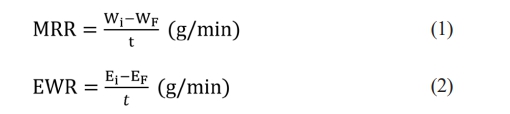
Ra, EWR and MRR are used to compute the process' machinability. Eqs. (1)-(2) depict the formula used to calculate MRR and EWR.
where,
Wi- Weight of the workpiece prior to machining
WF- weight of the workpiece post-machining
Ei - Weight of the electrode prior to machining
EF - weight of the electrode post-machining
t - Machined time
The weight loss of the workpiece throughout the time required to create a through hole is analyzed to estimate the material removal rate from the Al7050-15SiC for each combination of parameters [39]. Similarly, the weight loss of the electrode during the machining process is utilized to calculate the electrode erosion rate, and a surface roughness tester is employed to examine the interior surface quality of the created holes.
Response Surface Methodology
RSM numerical technique is acclimated to analyze correlation among dependent variable and the response metrics with the aid of mathematical model. The interactions and higher order impacts of process variables on the metrics (responses) can be evaluated and graphically projected as three dimensional surface plots through quadratic form of mathematical expression. A standard polynomial RSM mathematical expression having second order is depicted below in Eq. (3).

where,
Ri= Response, D0 = Constant, Di, Dii and Dij = Regression constants of linear, quadratic and interaction terms respectively and xi = Process variables.
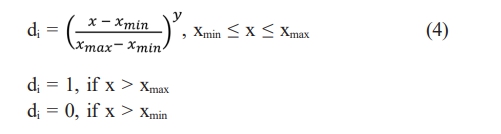
This study investigates the effects of machining parameters on MRR, EWR, and SR, such as pulse current, spark duration, and sparking period. Moreover, the ANOVA (analysis of variance) test is utilized to verify the suitability of the performance models that were built. Ultimately, utilizing a numerical optimization tool—the desirability function technique of RSM—multiple-response optimization is carried out to achieve the desired outcomes, including a greater MRR, a limited quantity of EWR, and superior surface quality. Using this method, measured metric terms are converted into a unit-less number called a desirability value, which ranges from 0 to 1. When the response value or any of the process variables is outside of the desired range, the desirability value will be zero. Eqs. (4) and (5) illustrate how the desirability function is divided into two desirable objectives, a maximum and a minimum, based on the nature of the output performance characteristics. Next, using Eq. (6), the composite desirability value is computed by adding the desirability values of each response.
For maximum response criteria, desirability function di is represented as follows:
For miniumum response criteria, desirability function di is represented as follows:
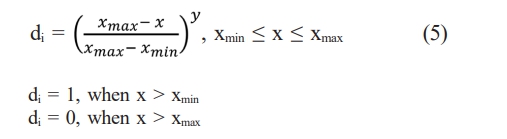
when, y - weight, x - predicted response and n - number of response
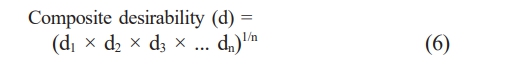
The optimized parameter levels are identified as the set of process parameters that exhibit the highest composite desirability value. Furthermore, there is no meaningful constraint dictating that the composite desirability value should be close to 1 [40]. It merely indicates the separation between the optimized value of the responses and the highest and lowest values of the measured performances.
|
Fig. 1 SEM Micrograph of Al7050-15SiC. |
|
Fig. 2 Line diagram of EDM process. |
|
Fig. 3 Machined workpiece. |
Regression Modeling of EDM performance characteristics and checking its adequacy
As a function of independent variables like current, spark on time and discharge off time, a Response Surface Methodology based regression expression for material ablation rate, electrode erosion rate and SR has been built using the measured experimental data. In addition, through analysis of variance, the prediction effectiveness of developed metrics equation is verified and the results are discussed in the subsequent sections.
Adequacy verification of the developed response models
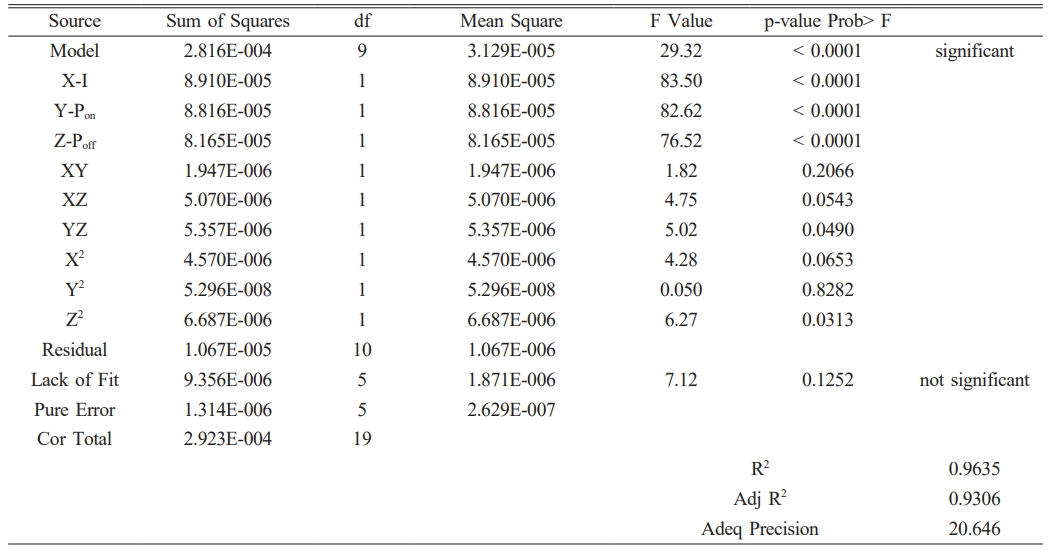
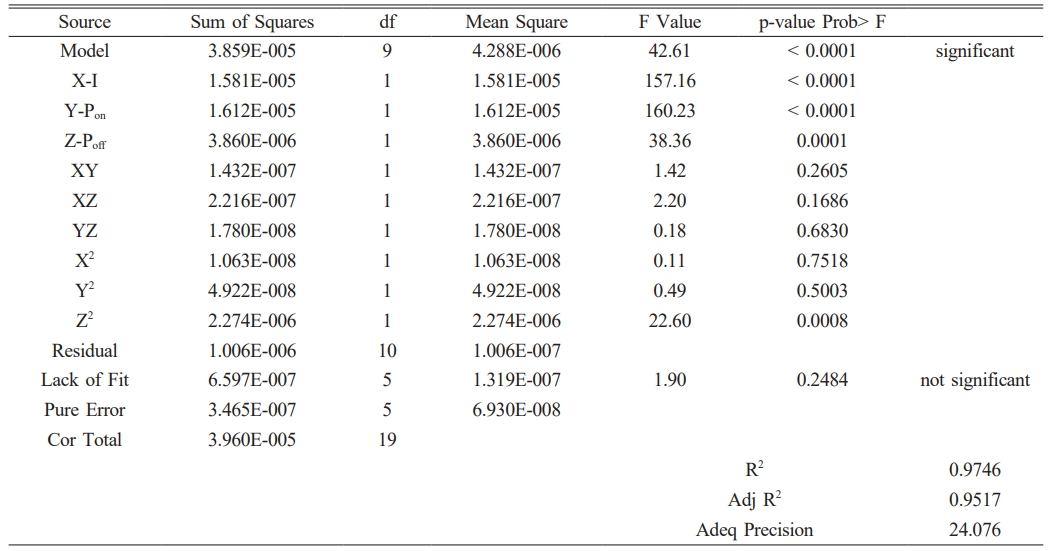
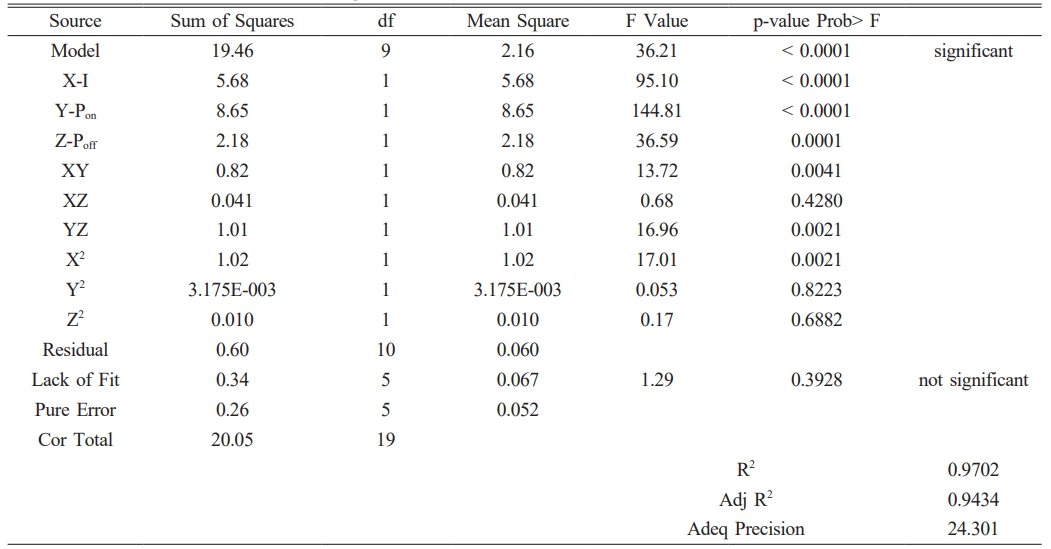
Surface roughness (SR), electrode degradation rate, and material ablation rate are all predicted using the quadratic model suggested by the fit summary approach. Tables 3-5 present the material ablation rate, electrode degradation rate, and SR ANOVA test results, respectively. The F-ratio values obtained for material ablation rate (MRR), electrode erosion rate (EWR), and surface roughness (SR) are 29.32, 36.21, and 42.61, respectively. These F-ratio values indicate the significant nature of the established performance models, primarily due to the uncertainty effect, which has a probability of 0.01%. An evaluation at a 95% confidence level of the p-value provides further evidence of the models' appropriateness. If the p-value is less than or equal to 0.05, the model is considered statistically significant. The ANOVA findings unequivocally demonstrate that all of the response models' p-values—MRR, EWR, and SR—are less than 0.05. This confirms the suitability and accuracy of the second-order response models developed using response surface methodology (RSM) for making minimally error-prone response predictions.
Because their p-values are less than 0.05, the ANOVA test results on the MRR data indicate that X (I), Y (Tonne), Z (Toff), YZ, and the quadratic term of Z are the key factors influencing MRR. For EWR, the significant adjustable factors include variables X, Y, Z, and Z2. Lastly, the ANOVA results for SR suggest that the important factors are X, Y, Z, XY, YZ, and X2. Table 4
Mathematical expression of MRR, EWR and SR
The succeeded second order mathematical equation for actual factors of material ablation rate, electrode erosion rate and surface roughness are shown in Eq. (7)-(9) respectively.
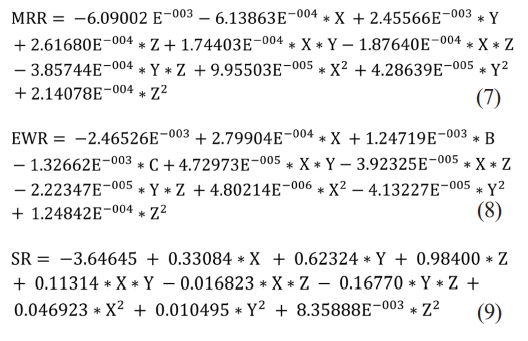
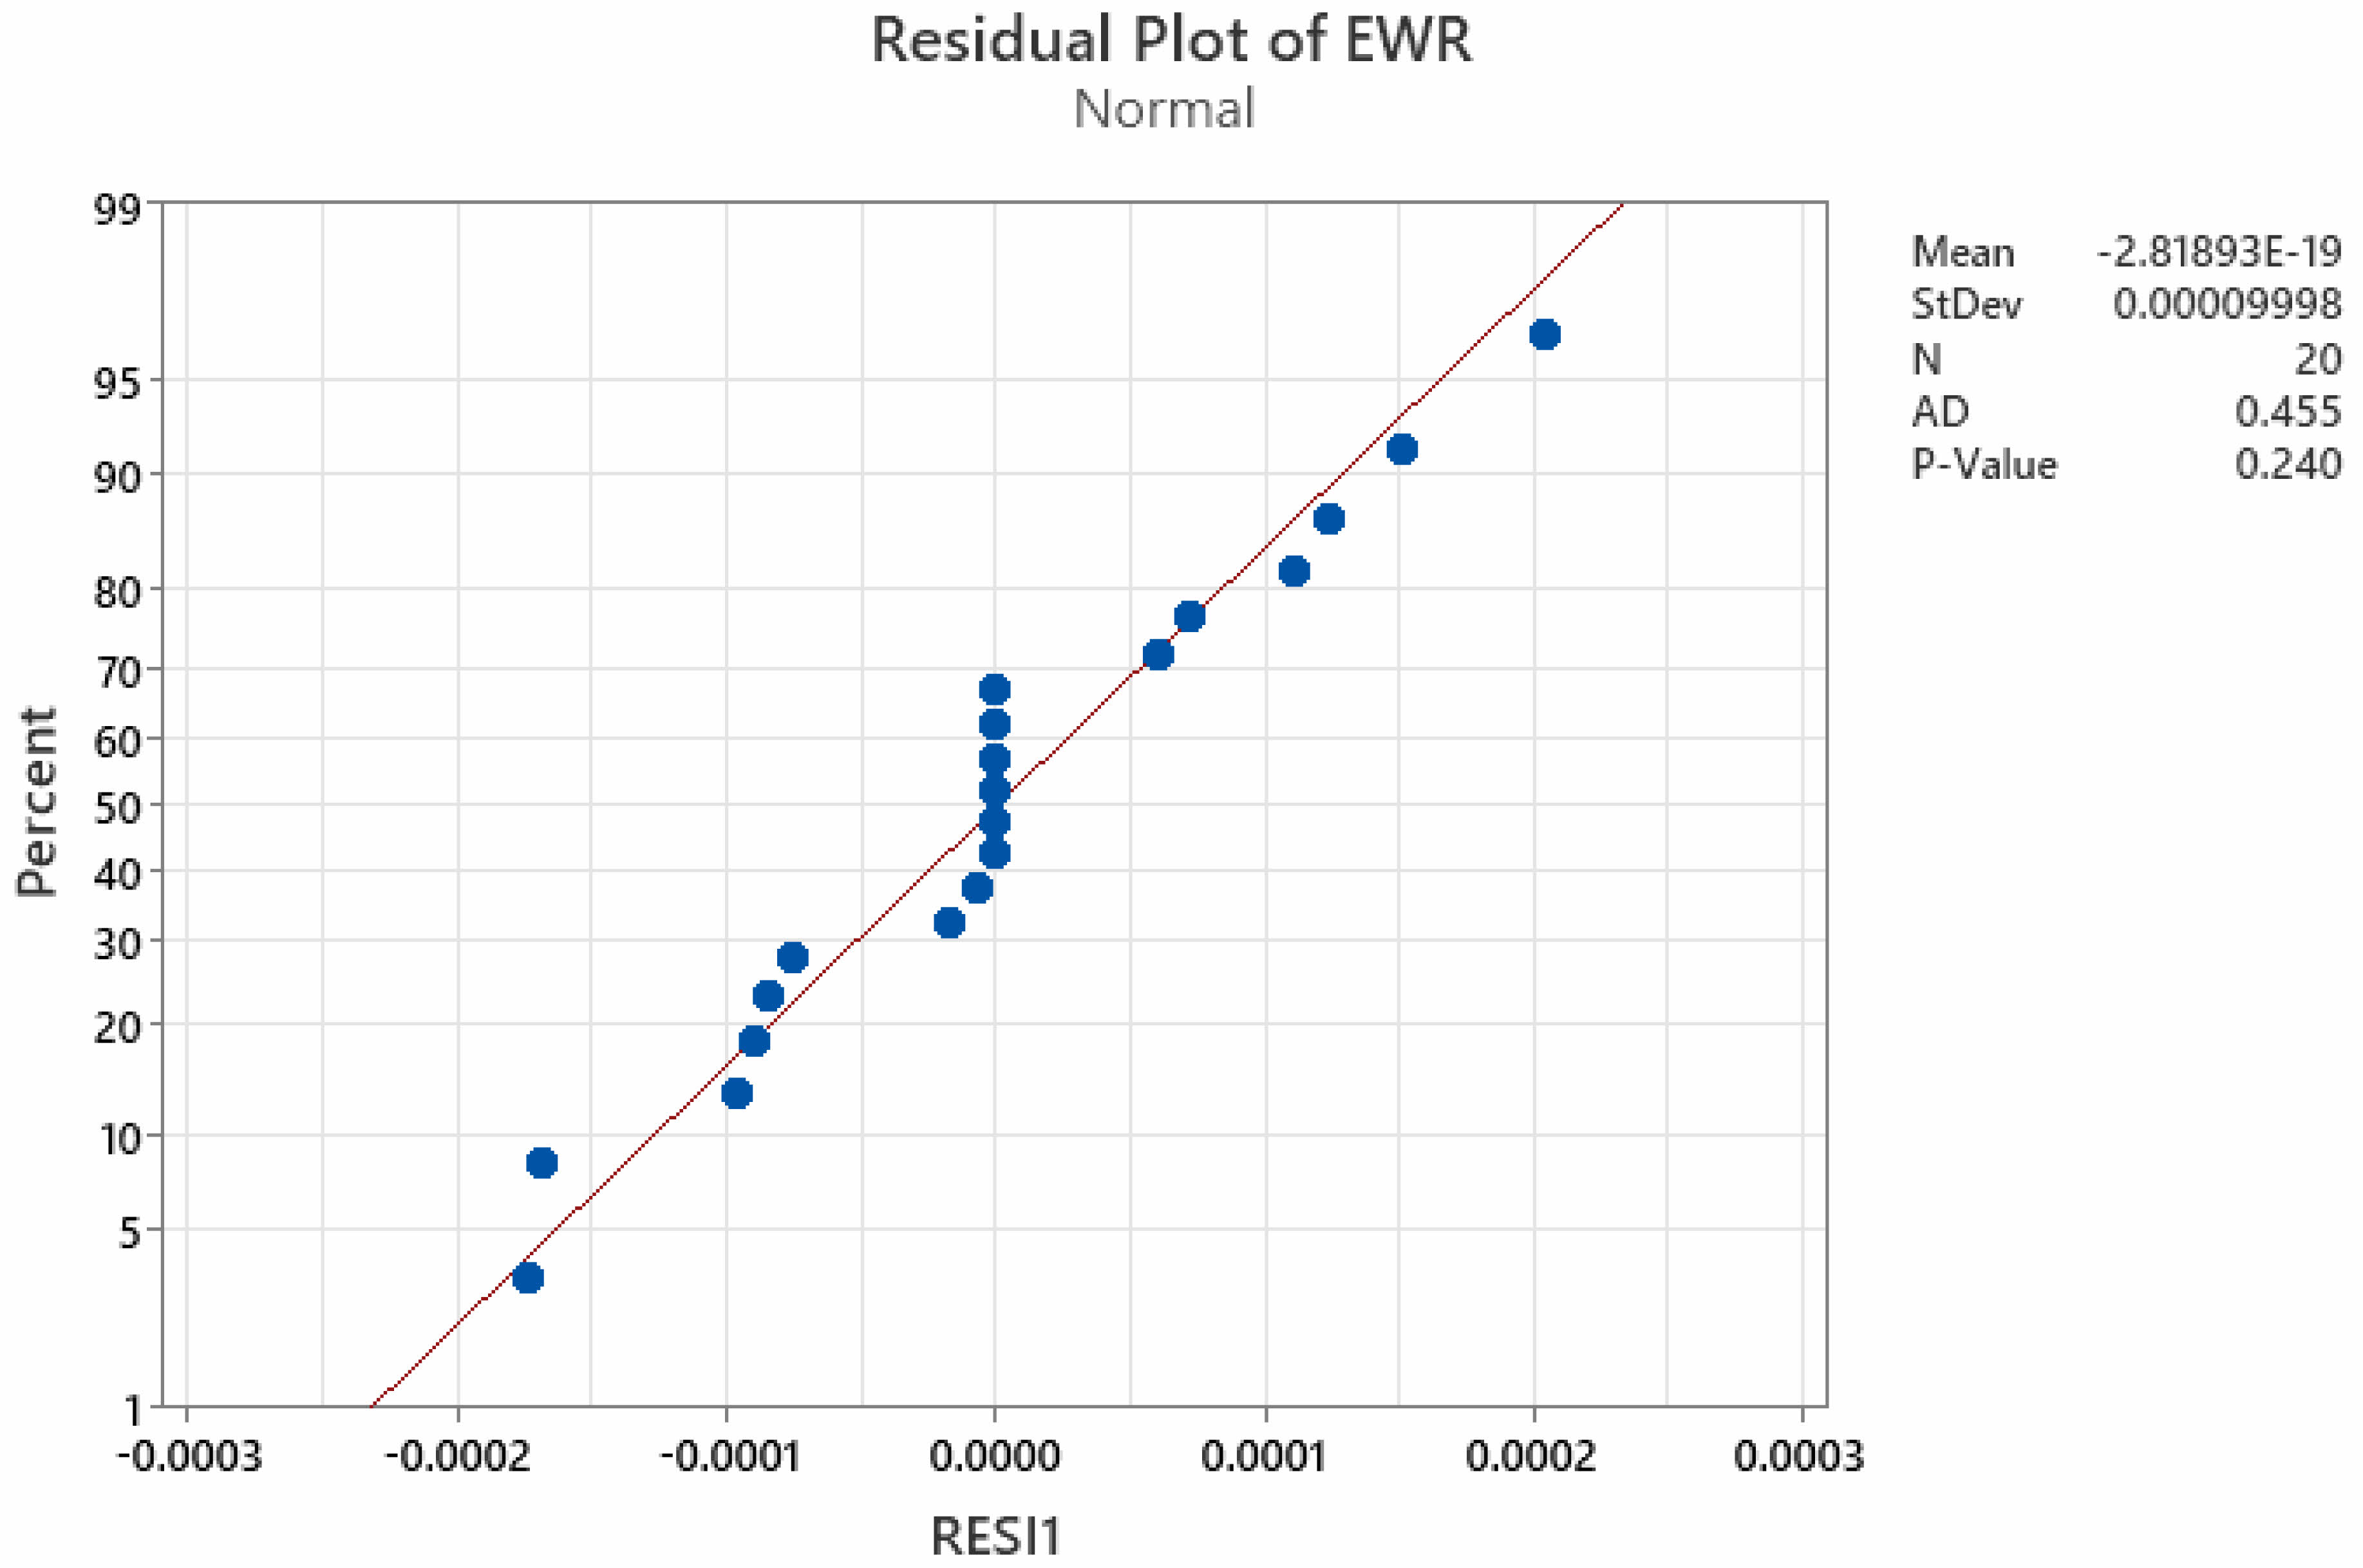
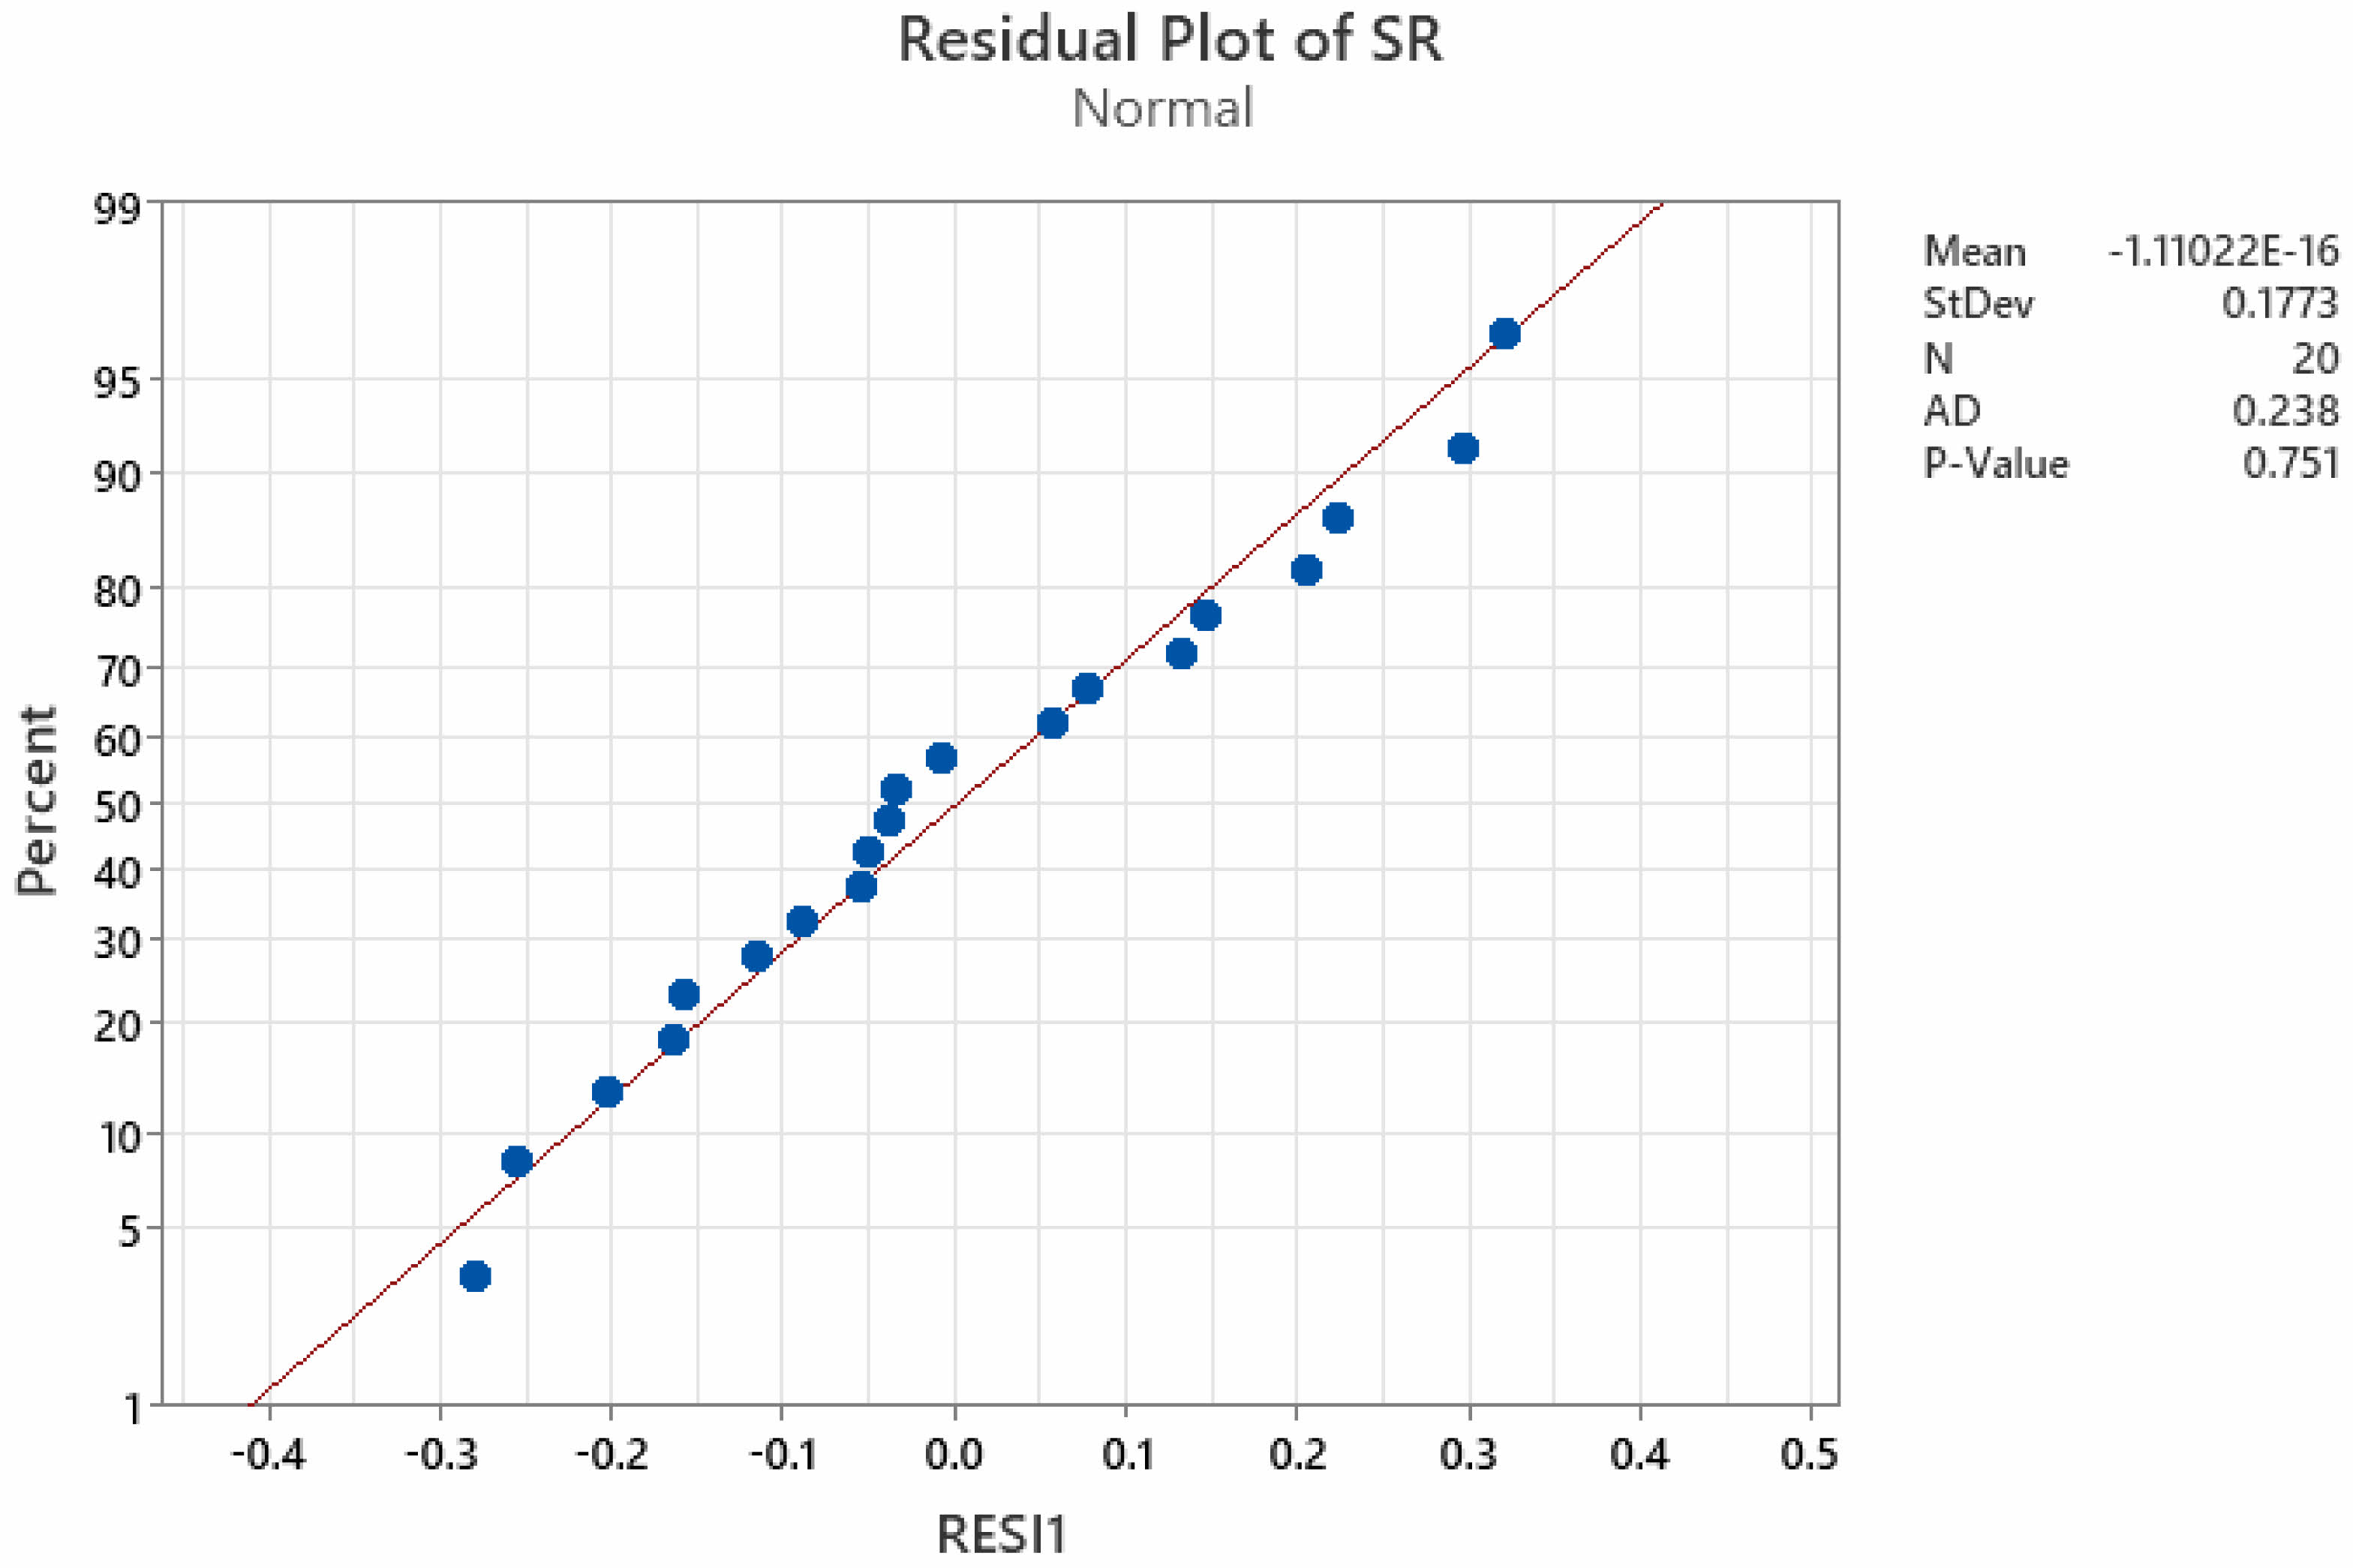
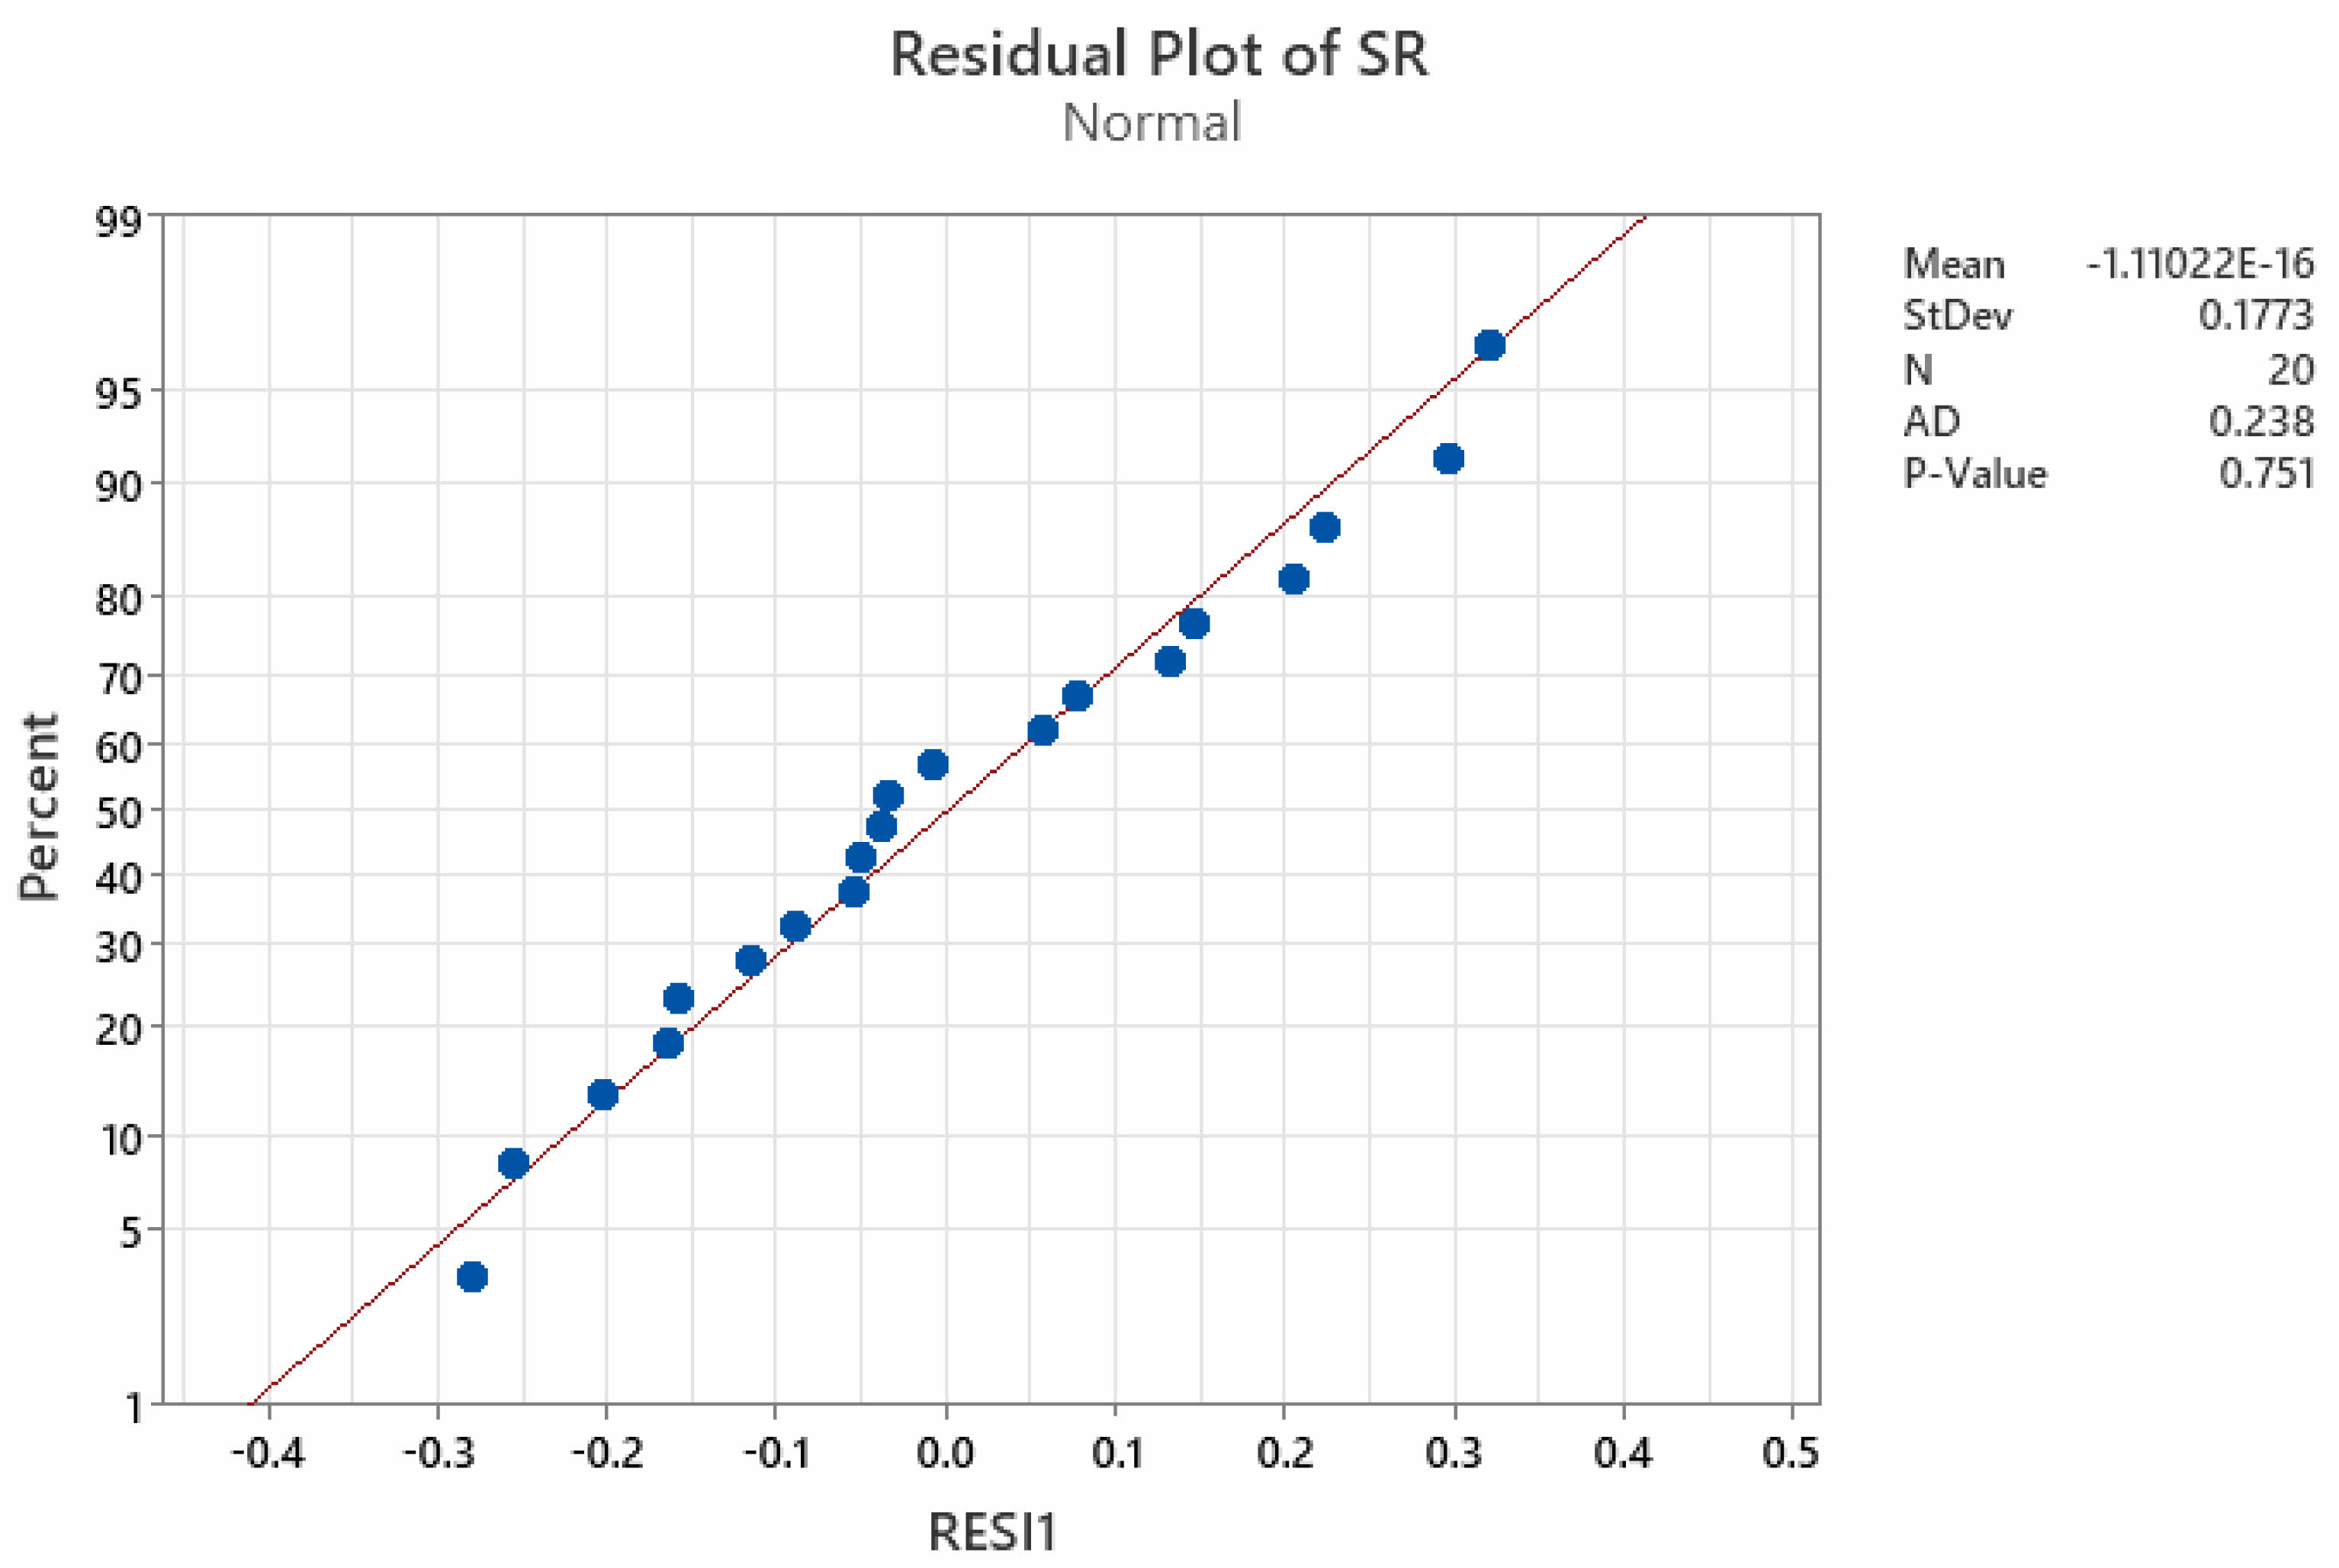
The residuals of the created MRR, EWR, and SR models are assessed for normality using the Anderson-Darling (AD) normality test, as illustrated in Fig. 4-6. The p-value of the AD statistic test is observed to exceed the confidence threshold (0.05). This unequivocally demonstrates that the established models are sufficient for predicting values with minimal error and that the residuals of the MRR, EWR, and SR models follow a normal distribution. Fig. 5
Furthermore, the degree of fitness between the expected and actual experimental values has also been assessed using a different measure, namely the coefficient of determination, or R2. The R2 value represents the ratio of the overall variations in the experimental findings to the variations explained by the generated model. R2 ranges from 0 to 1, where a value closer to 1 indicates an excellent match between the experimental response values and the anticipated response values of the created regression model. The resulting R2 values are 0.9635, 0.9746, and 0.9702 for the rate of material ablation, tool erosion, and hole interior surface roughness, respectively. This clearly demonstrates a strong association between the dependent qualities and the EDM process factors.
Examination of the impact of EDM process variables on responses
In this study, the effects of variations in current, spark duration, and discharge interval duration on MRR, EWR, and SR are examined using three-dimensional response surface graphs. While the third process variable is kept at a constant level, two process variables are altered during the investigation to observe their impact on the outcomes. These response surface plots provide the most comprehensive insight into response variations across different operational conditions.
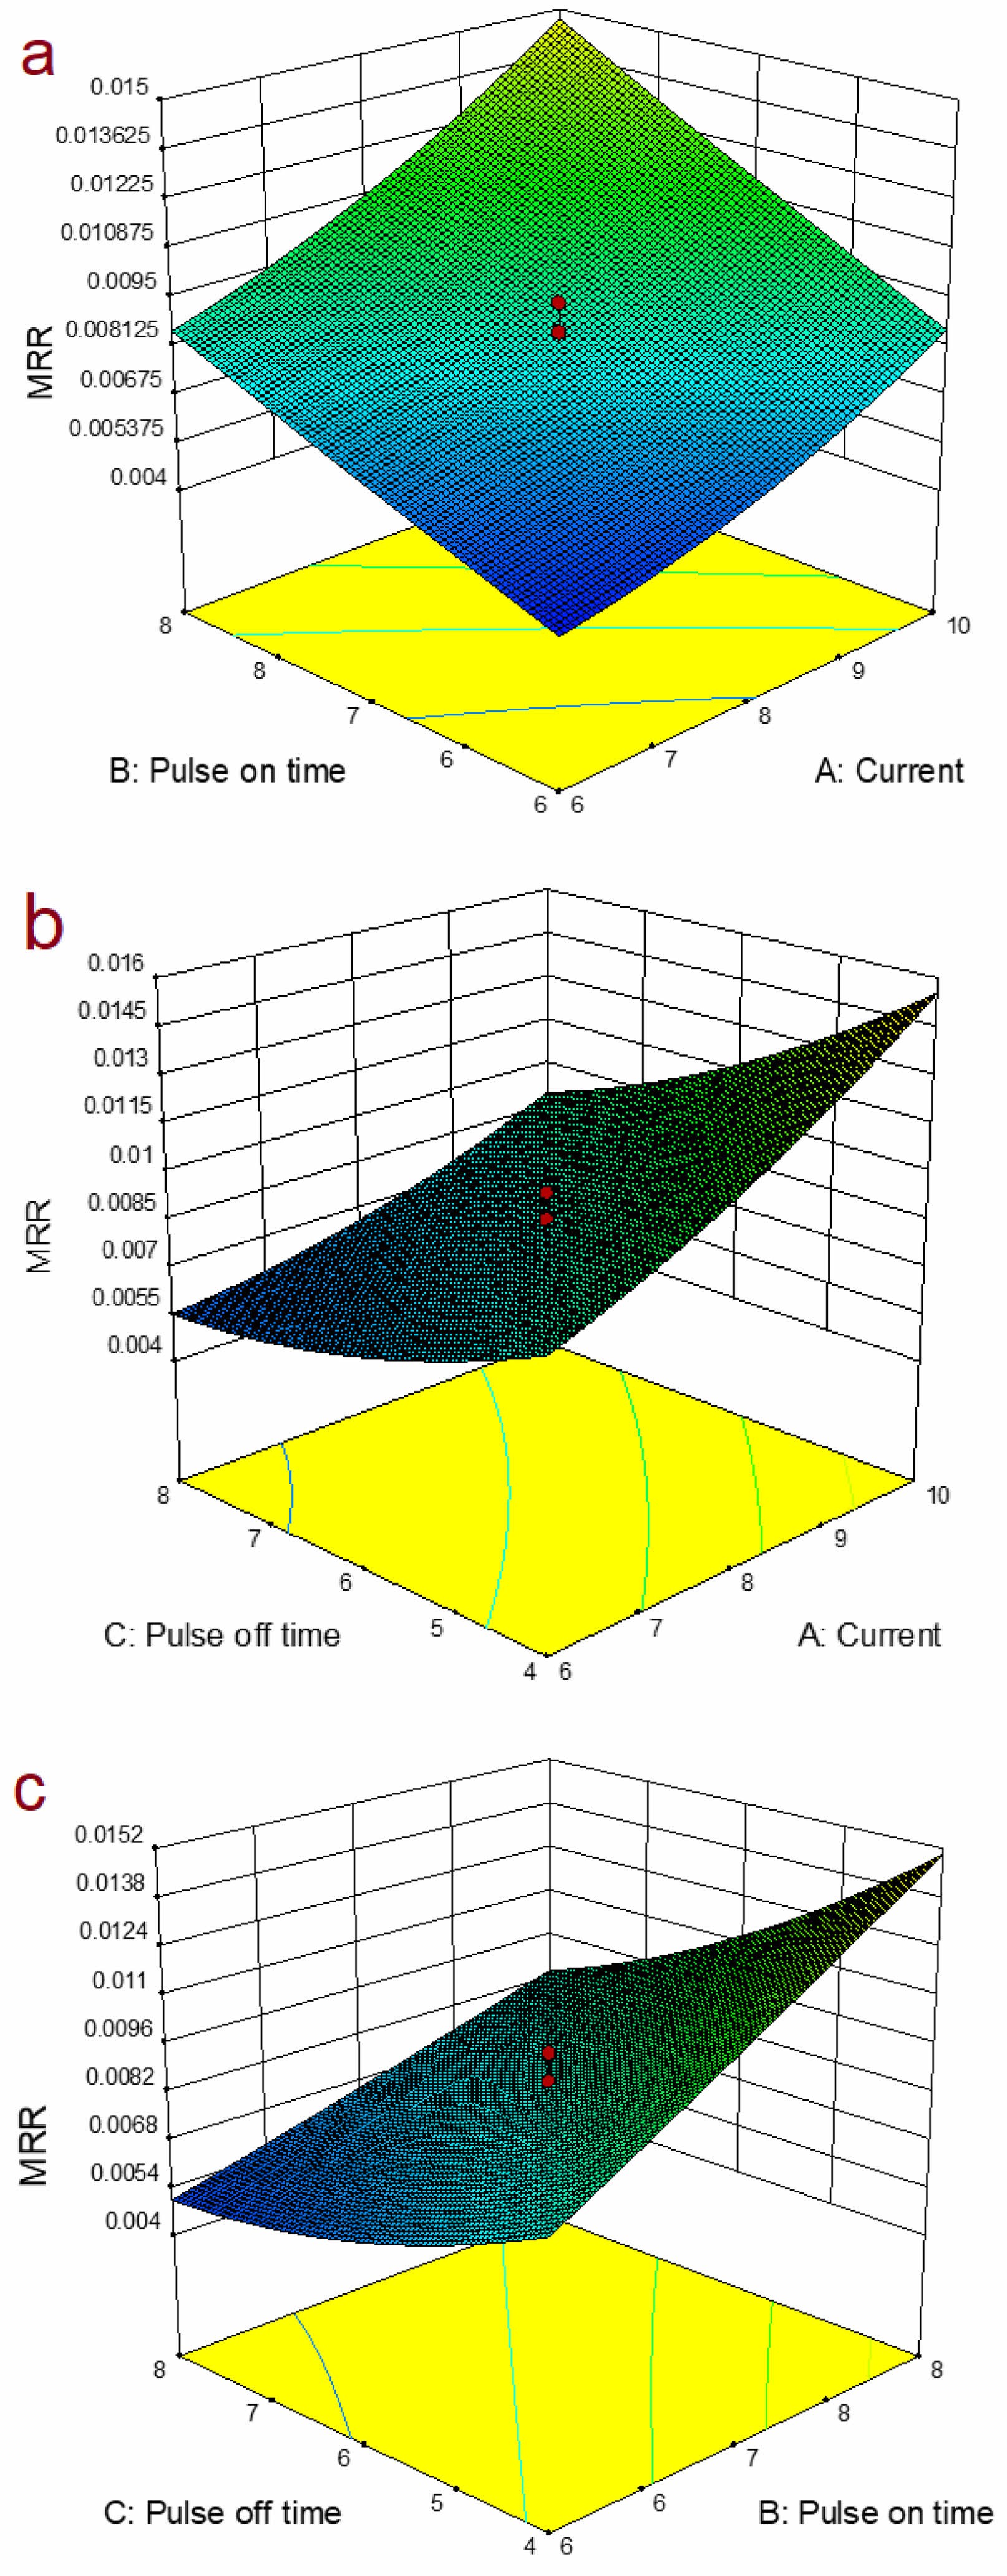
Influence of independent controllable variables on MRR
Figure 7a illustrates the interaction plot depicting the influence of pulse current (I) and pulse-on time (Pon) on the material removal rate (MRR). It is evident that MRR exhibits a direct proportional relationship with pulse current for all values of Pon. This relationship can be attributed to the higher concentration of thermal energy between the electrodes resulting from the increased energy of the sparks. Consequently, higher current levels lead to increased melting and vaporization compared to lower current levels. Similarly, an increasing trend in MRR is observed as sparking time increases. This trend is primarily attributed to the longer duration of heat energy penetration into the workpiece. Fig. 7b displays the interaction effects of current and pulse interval on MRR. It is apparent that as the pulse interval increases, there is a decrease in material removal from the workpiece. This phenomenon can be attributed to the lower number of sparks generated and significant heat dissipation between subsequent sparks. Similar findings were reported in previous studies [14, 41]. The interaction plot between Pon and Poff on MRR, depicted in Fig. 7c, indicates that at low pulse interval levels, an increase in sparking time (Pon) significantly enhances MRR.
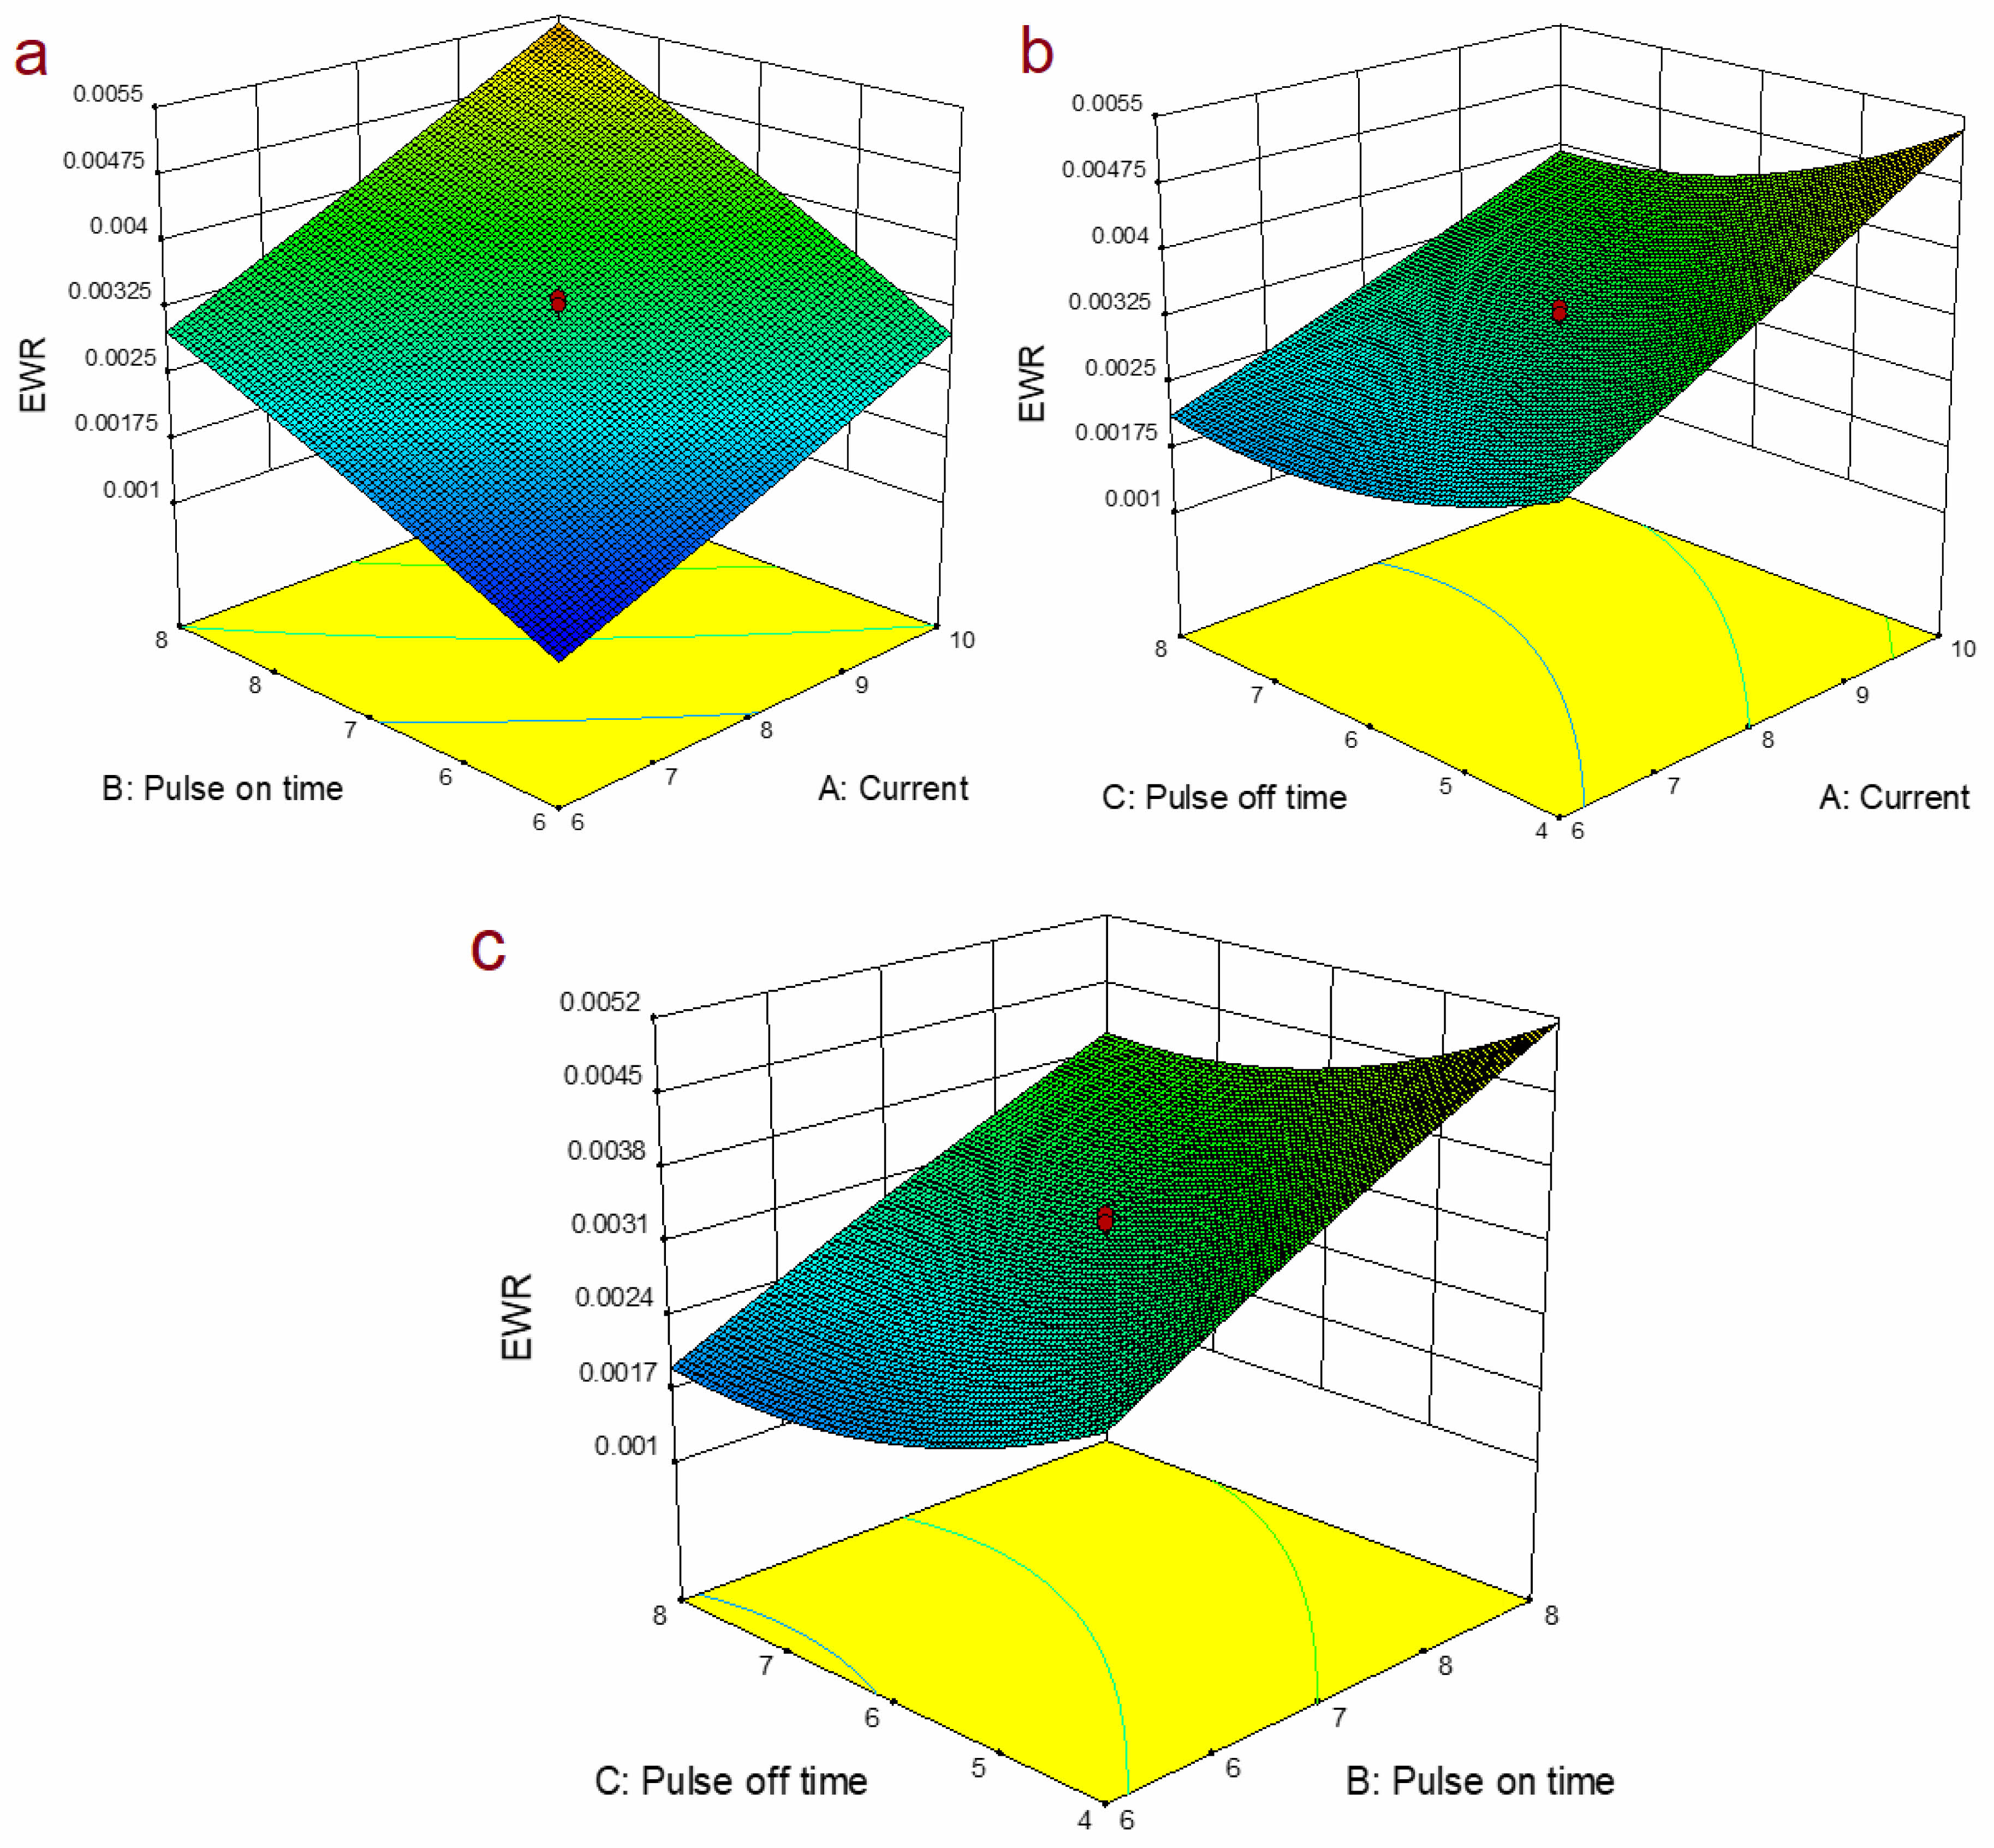
Influence of independent controllable variables on EWR
Figure 8a elucidates the impact of pulse-on duration and pulse current on electrode wear rate (EWR). It is observed that there is a direct correlation between the material loss of the electrode and both the pulse duration and current. This leads to significant tool wear under high current conditions, attributed to the movement of charged particles between the electrodes with increasing current. Moreover, longer pulses result in increased electrode material loss due to prolonged operating times, which soften the electrode material and contribute to wear.The surface plot depicting the influence of current and pulse interval on EWR is presented in Fig. 8b. It is evident that an increase in pulse interval leads to a decrease in the electrode wear rate. This phenomenon is associated with the duration allowed for the electrode to cool down between pulses. Additionally, there is a slight increase in EWR at higher levels of pulse off-time, which may be attributed to the higher energy required to reopen the plasma channel.Figure 8c illustrates the interaction between Pon and Poff on EWR. It is evident that the electrode experiences greater weight loss at maximum Pon and minimum Poff compared to other operating conditions.
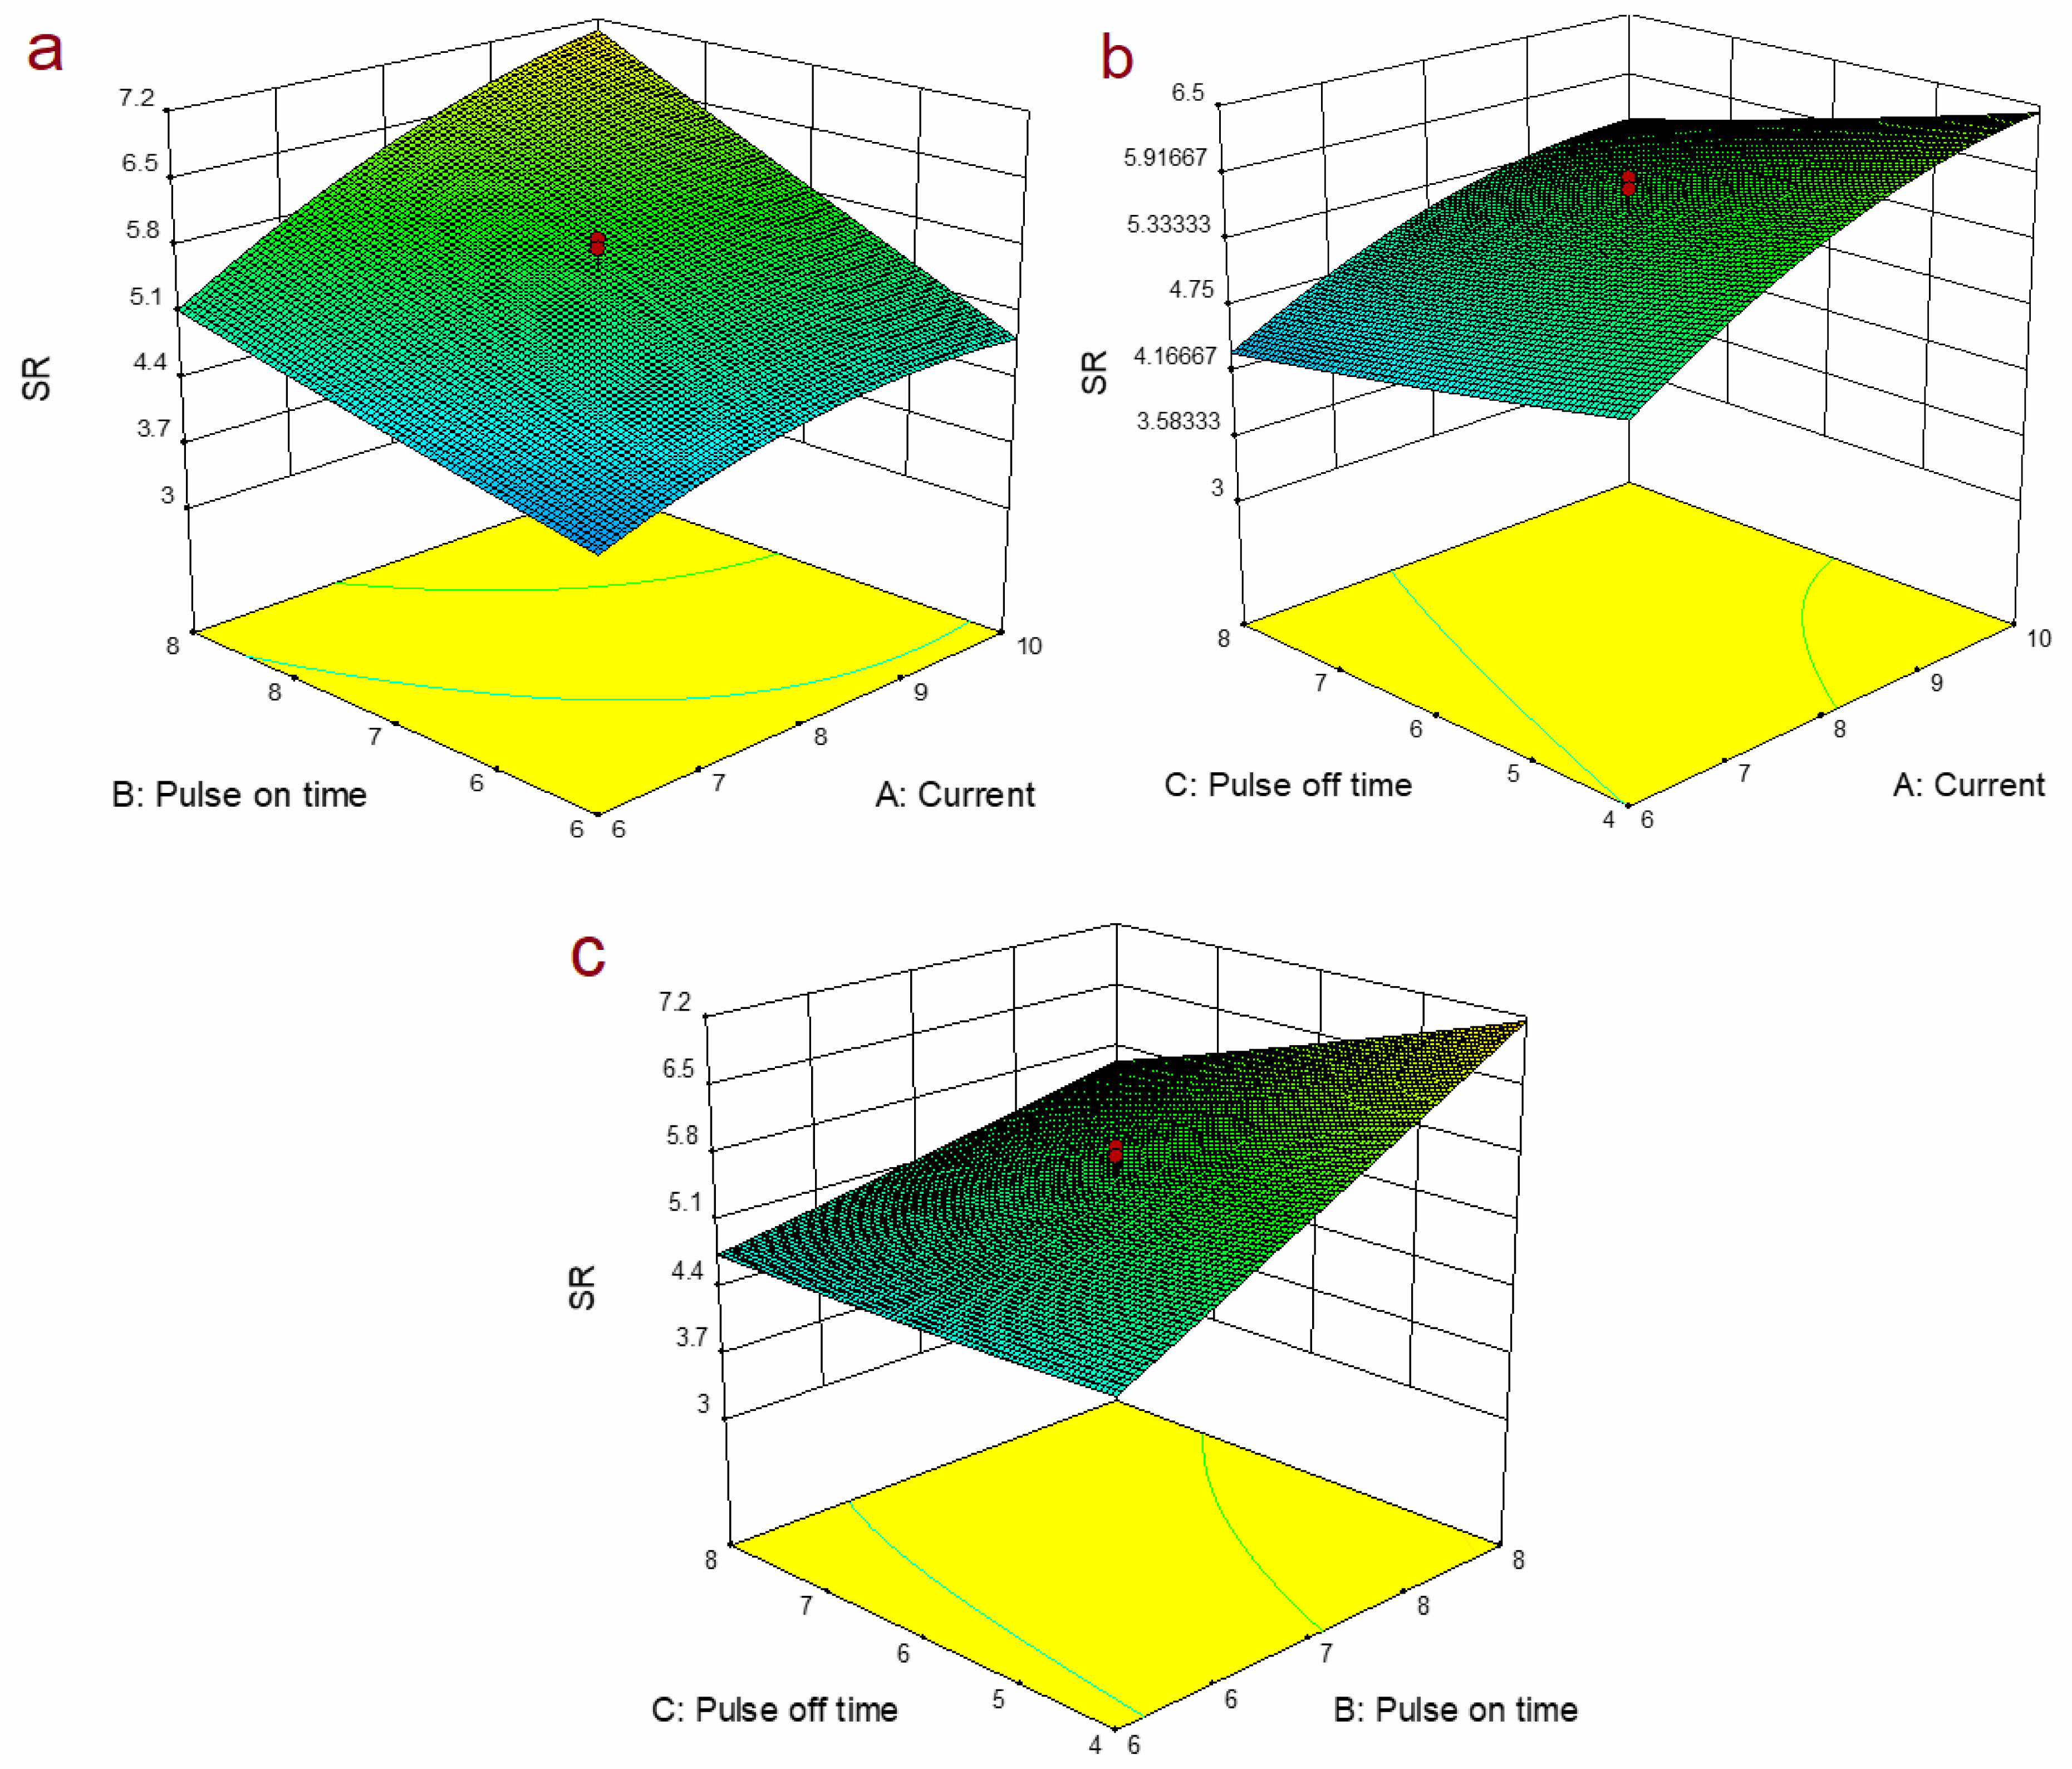
Influence of independent controllable variables on SR
Figure 9a illustrates how surface roughness increases progressively as current and spark duration increase. The formation of deeper and larger craters on the hole wall surface primarily stems from the intensity of the emitted energy. Fig. 9b illustrates the influence of current and pulse off time on surface roughness, clearly indicating a trend of decreasing surface roughness as Poff increases.This phenomenon can be attributed to good particle removal and reduced thermal energy intensity with longer pulse intervals.The surface plot of surface roughness in relation to Pon and Poff is displayed in Fig. 9c.
Optimization with equal importance to all output characteristics (i.e., MRR, EWR and SR)
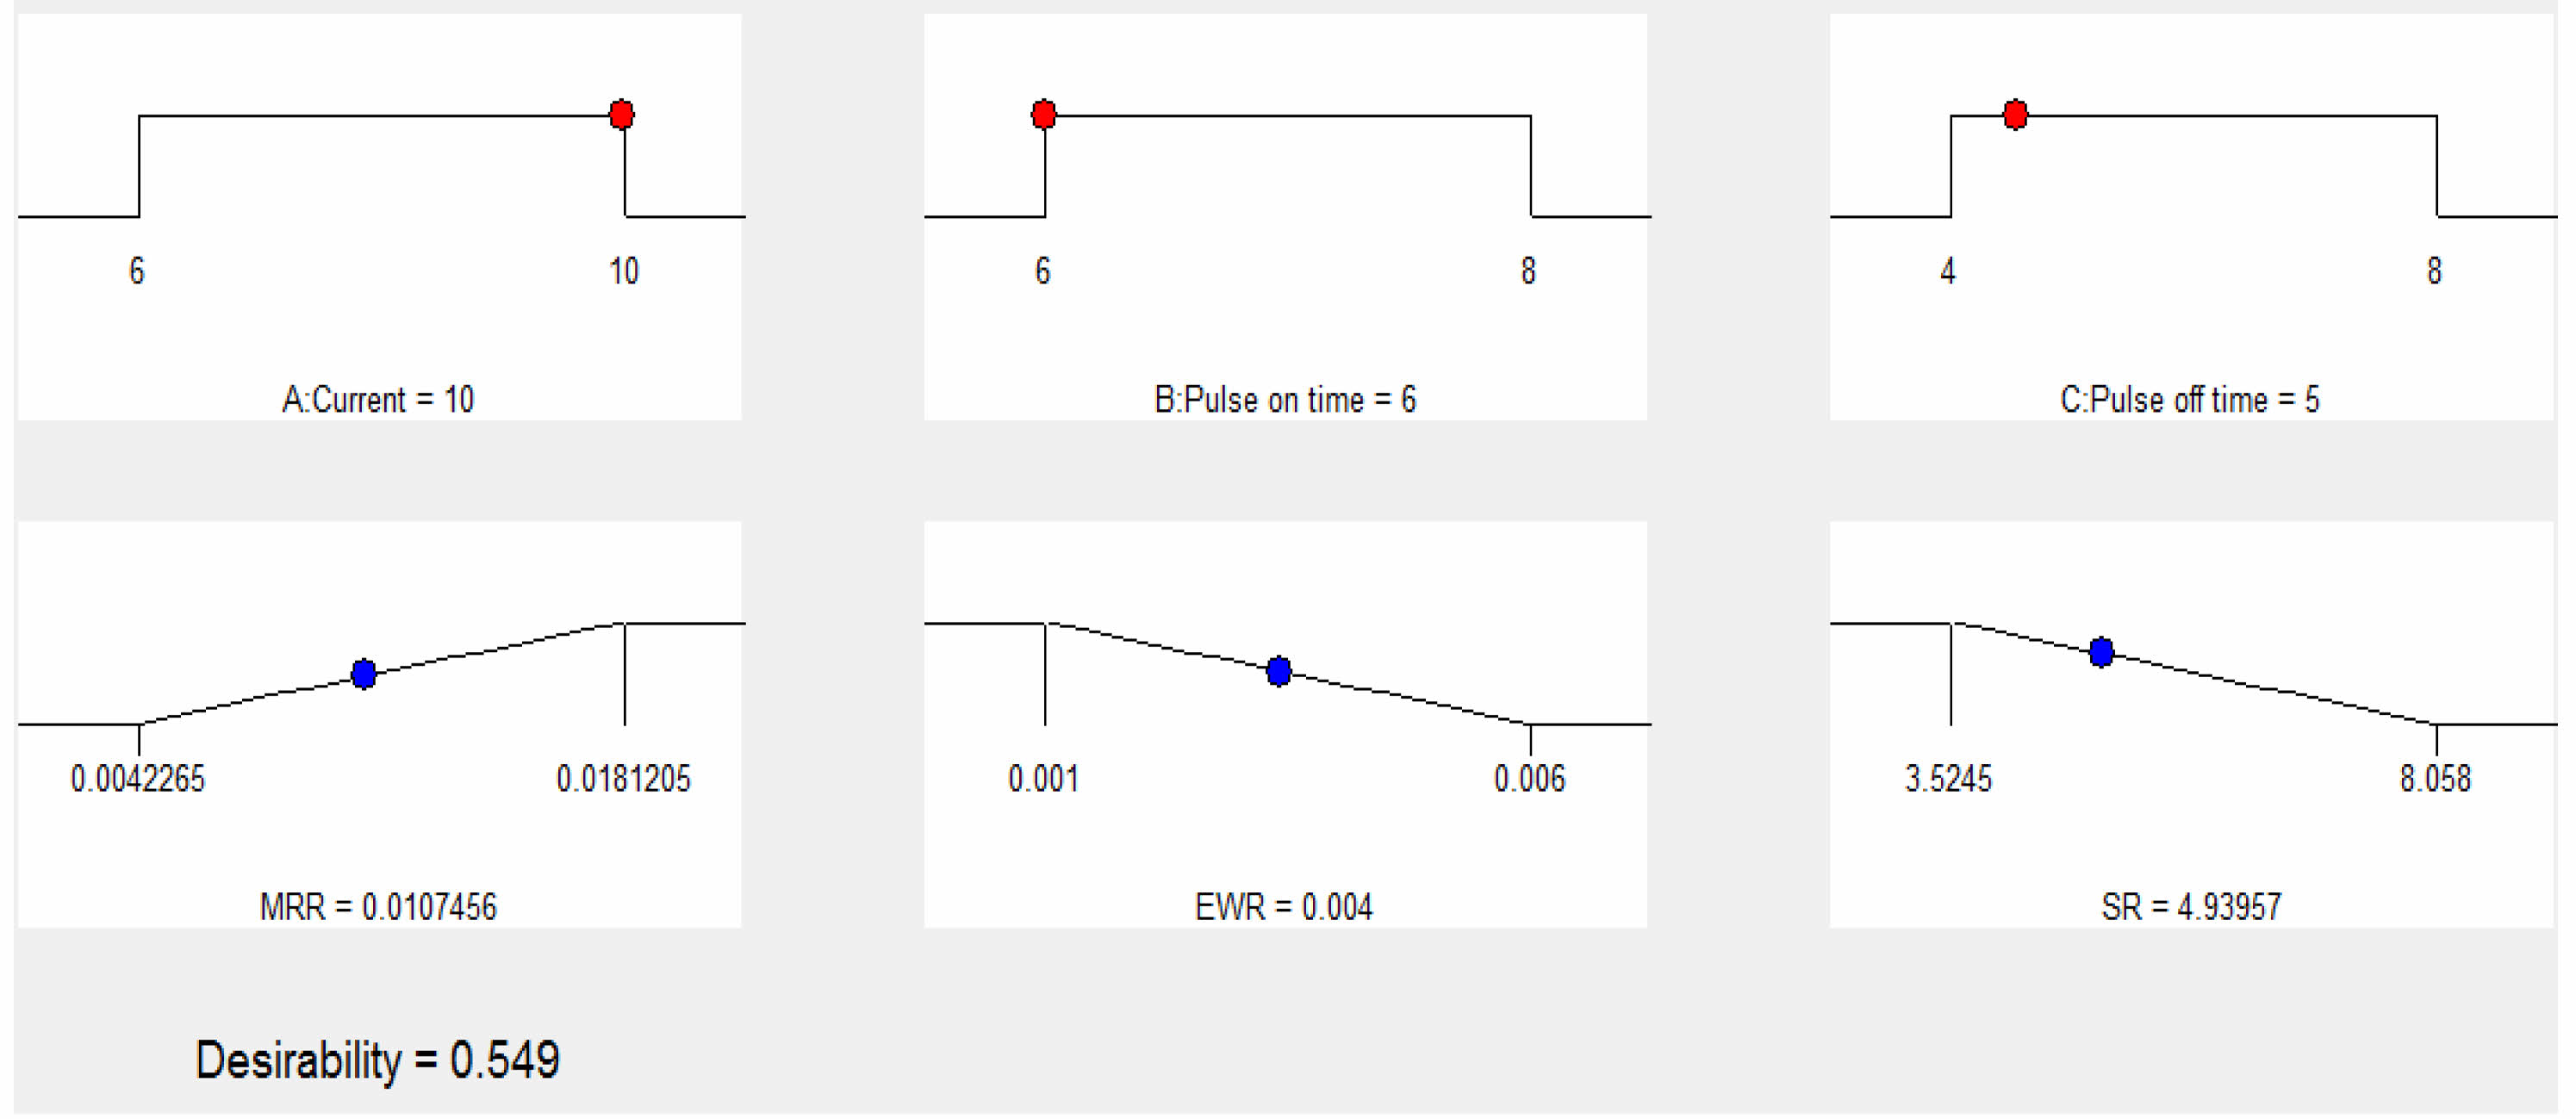
The developed second order regression expressions in Eq. (4)-(6) are utilized for the optimization of multi-response using desirability function approach. In this case maximization criteria are opted for MRR. Whereas, minimization has been chosen for the electrode wear and SR. Also, equal weightage is given for all the three responses. The independent parametric condition with maximum composite desirability is viewed as optimal level of parameters. In this study, the obtained ideal parameter levels are I - 10 A, Pon - 6 μs, Poff - 5 μs with desirability value of 0.549 and it is depicted in Fig. 10.
Hybrid GRA-TLBO algorithm
The development of the hybrid optimization method GRA-TLBO stemmed from the desire to harness the complementary strengths of Grey Relational Analysis (GRA) and Teaching-Learning-Based Optimization (TLBO) algorithms. GRA focuses on analyzing relationships between multiple factors, offering insights into system behavior and identifying influential variables. TLBO, on the other hand, excels in exploring and exploiting search spaces to find optimal solutions. This integration allows for a comprehensive evaluation of parameter interactions and their impact on performance. GRA-TLBO operates without requiring complex mathematical models, making it suitable for non-linear and complex optimization problems. Its ability to explore and exploit the search space efficiently ensures the identification of optimal parameter combinations, leading to improved performance attributes.
Because of the possibility of discrepancy between the enhanced performance of one element and the needs of another, multi-response optimisation is complex. For multi-response optimisation, the Grey Relational Analysis (GRA) is used in many engineering contexts. This method simplifies several goals into a single goal function, which makes problem solving easier. Through the ensuing advancements, the GRA is carried out.
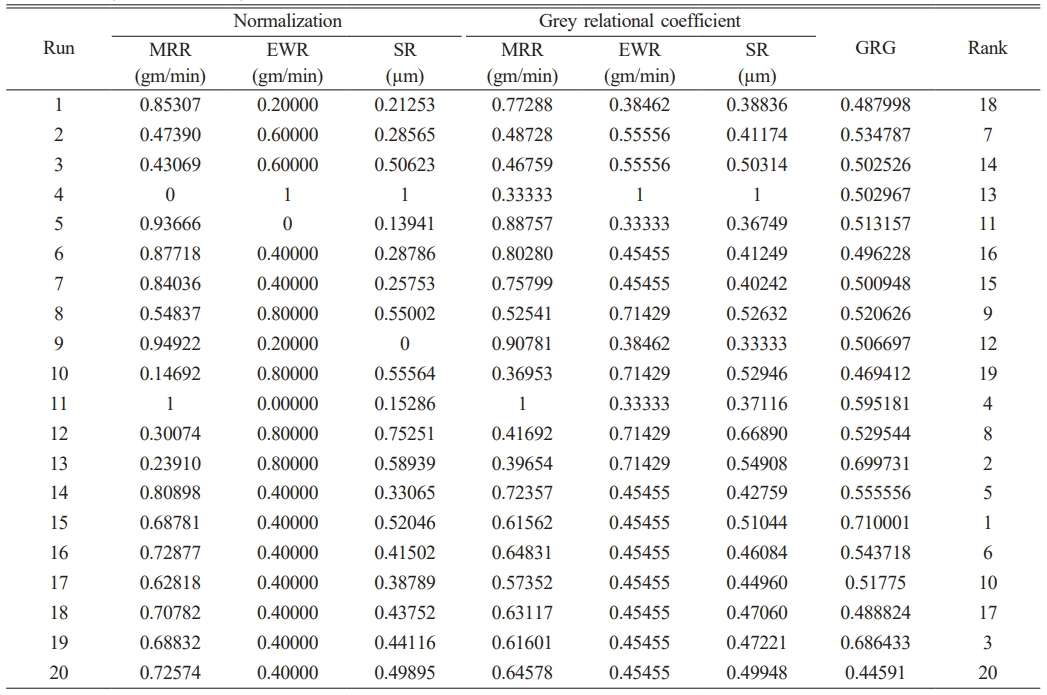
Step 1: Subsequent equations are used to normalise the experimental output parameters.,
Normalization for higher-the-better,
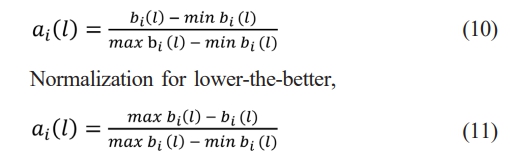
where "i" is the experimental number and "l" is the comparability sequence, and "ai (l)" is the normalised value for the acquired response. The lowest value of ai (l) for the lth response is represented by min ai (l) and the greatest value by max ai (l) for the lth response.
Step 2: The slated normalised experimental response and the actual response are correlated, as determined by the grey relational coefficient, or GRC. Eq. (12) is utilised to compute the value of GRC.
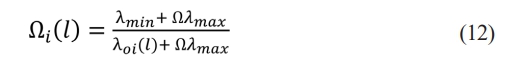
where (k) is a GRC, λmin (least deviation sequence) is the lowest value of λ (k), and λmax (highest deviation sequence) is the highest value of λoi (l). where i.e. λoi (l) = |gi (l) ― xi (l)|, ℅ is a unique coefficient which sustains between 0 and 1 (usually assumed as Ω = 0.5).
Step 3: Eq. 13 is used to calculate the Grey Relational Grade.
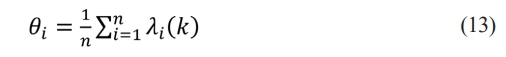
where, θi GRG of ith trial, n is a number of trials and, φi (k) is a GRC.
In the framework of GRA, the highest GRG is ranked highest, while the lowest GRG is ranked lowest. Table 6 shows the calculated GRG values for each of the 20 experimental run orders.
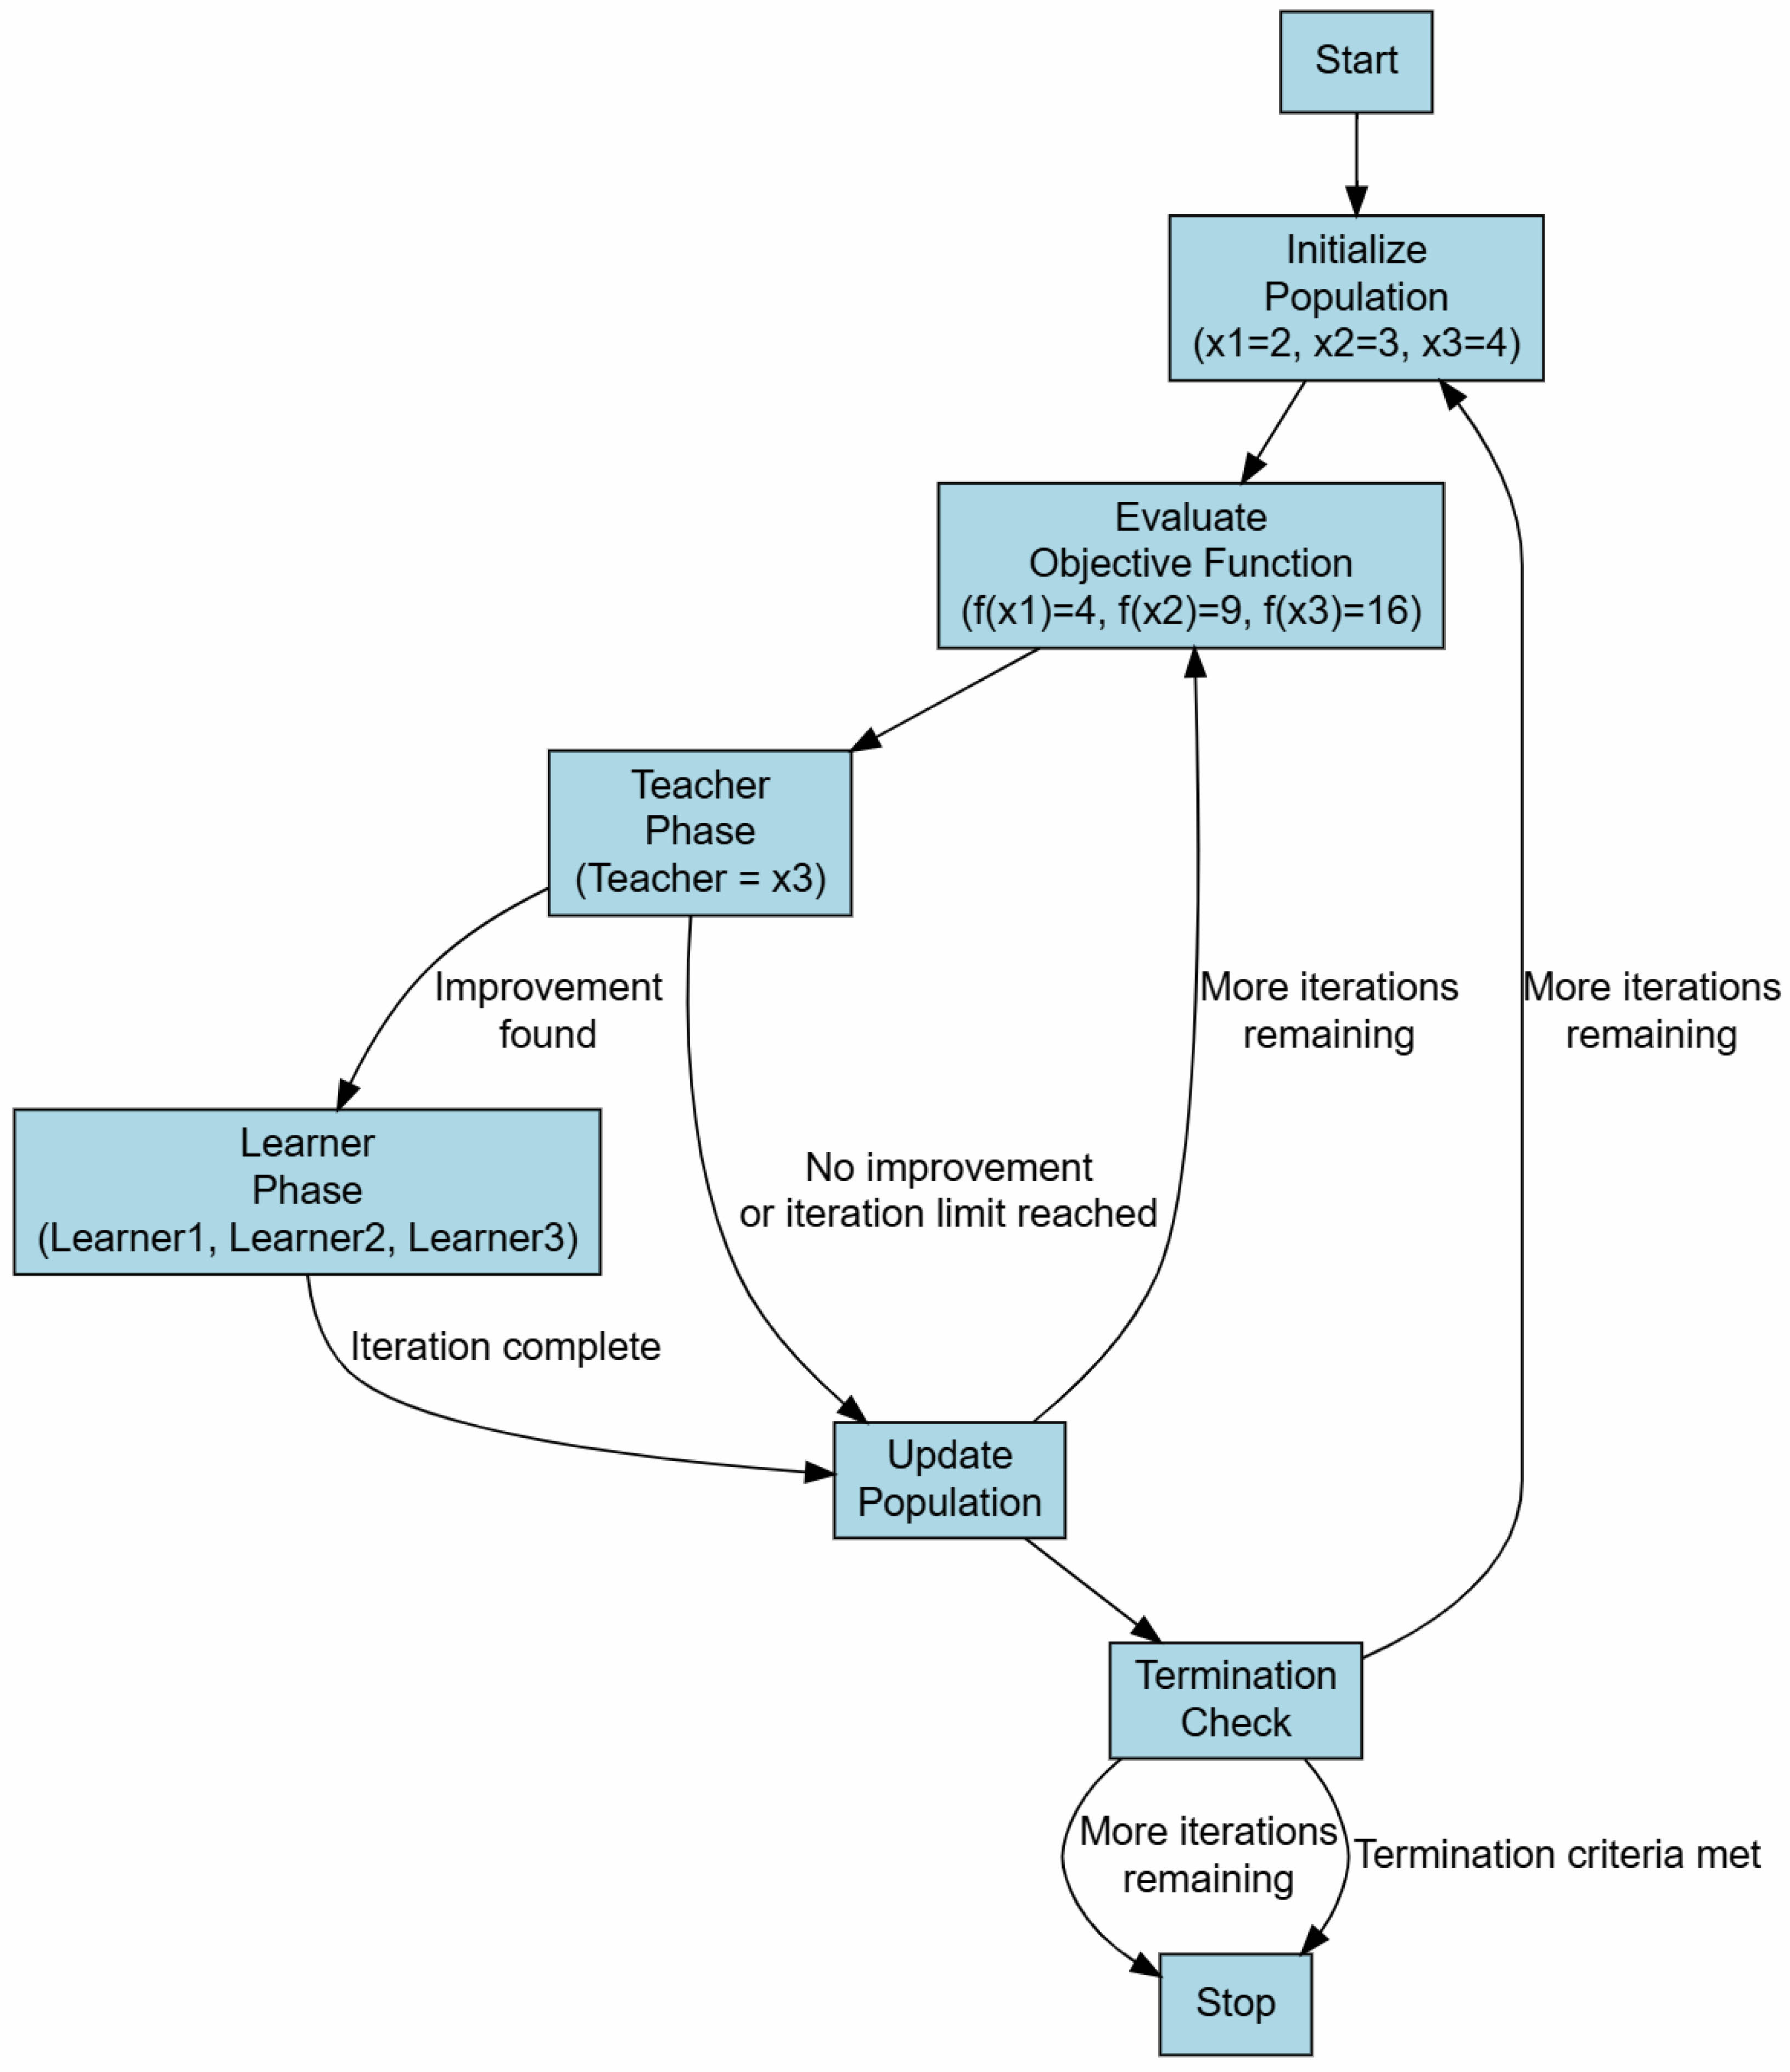
TLBO calculations emulate the teaching-learning process observed in classrooms. Students initially learn from the teacher during the teacher phase, and then they share that knowledge with one another during the learner phase. With apparent productivity, this technique is utilized to separate complex, nonlinear, and linear issues. Here, GRG values calculated from the GRA method is utilized to reduce the complexity of the process. The main goals of this work are, respectively, to increase material ablation rate and decrease electrode erosion rate and surface roughness. The detailed steps of TLBO algorithm are delineated in Fig. 11 [25].
Parameters bounds
Step 1: Select the size of the population (number of experiments), Np = 20
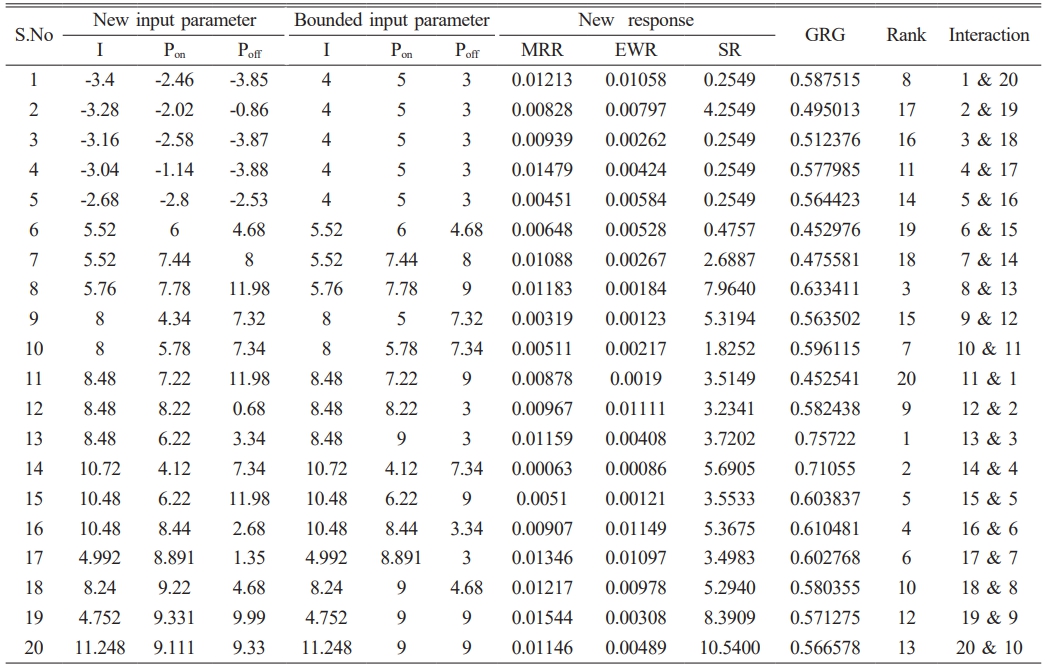
Step 2: Using Grey Relational Grading, the developed design matrix should be ranked as delineated in Table 8. Table 7
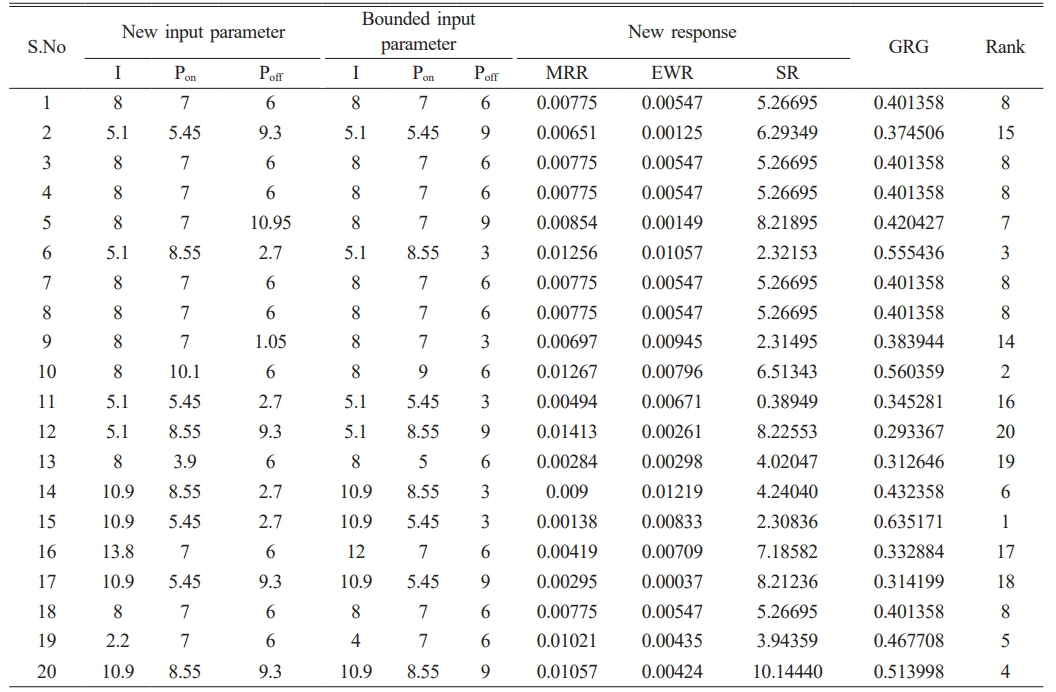
Step 3: Creation of new solution in teacher phase is delineated in Table 9. Using Eq. (17), new input parameters are obtained and which in turn bounded within the range as delineated in Eq. (14)-(16).
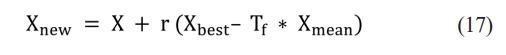
where, Xnew is the new solution, Xbest is the teacher, Tf is the teaching factor and the value should be either 1 or 2, r is the random number and it should range between 0 and 1 and Xmean is the mean of population, X is the current solution.
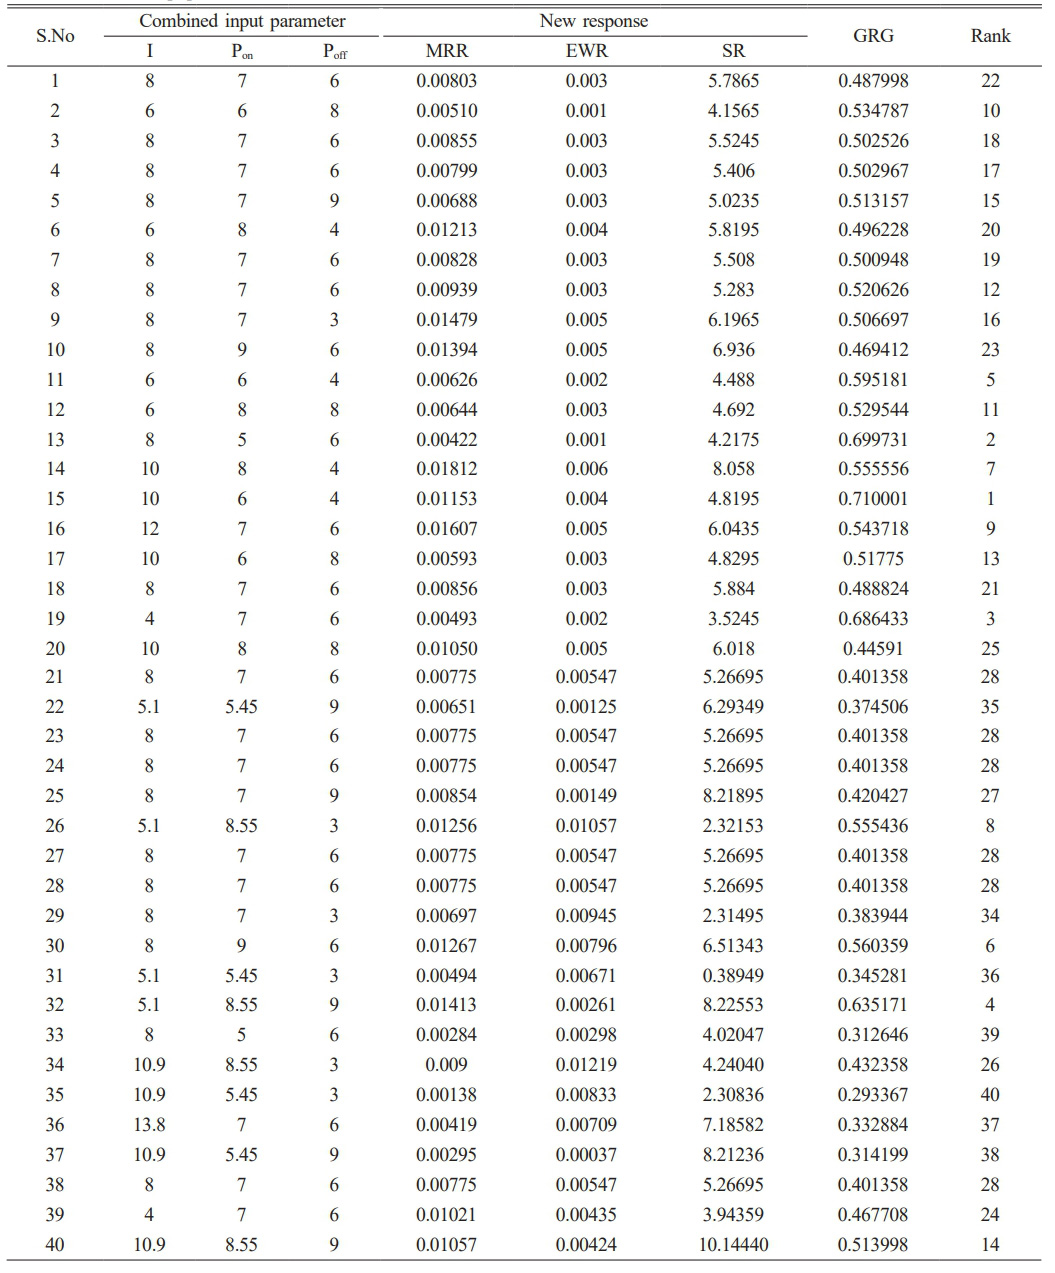
Step 4: The combined population (Table 10) is obtained by combining old responses with the bounded new input responses.
Step 5: The GRG is used to optimise the rankings from 1 to 20, which make up 50% of the higher-level rankings [42, 43]. Table 11 lists the rankings from 1 to 20 obtained from the teacher phase.
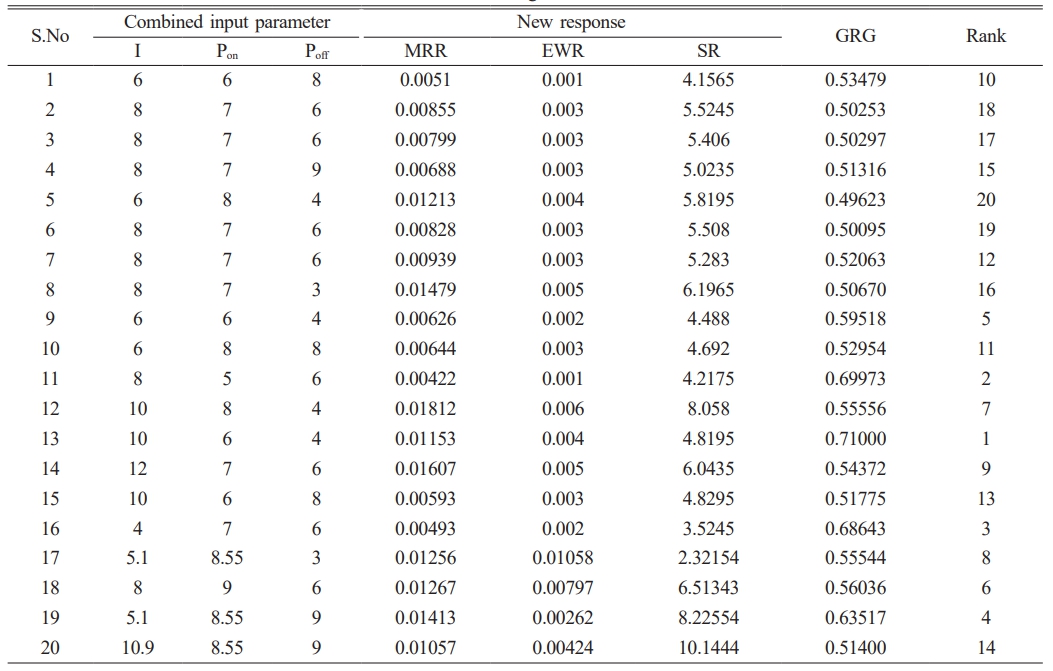
Step 6: Learner phase - Table 12 outlines the development of new process factors and objective values following interaction amongst the students, who were randomly selected from the population.
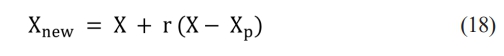
where, Xp is partner solution.
Here, GRG values calculated from the GRA method is utilized to reduce the complexity of the process.
Based on the top ranking generated following the interaction between parameters, the TLBO technique was used to identify the global input optimum condition from the learner phase.
Verification test
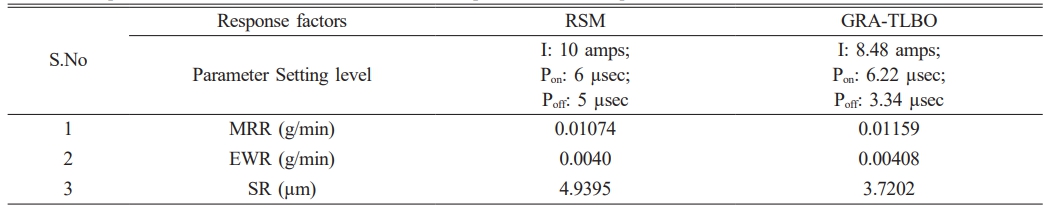
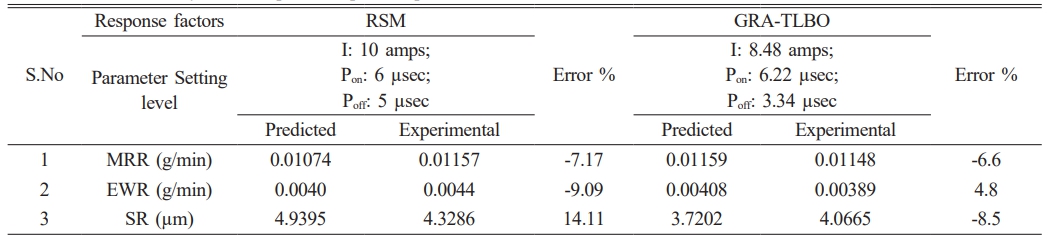
Table 13 presents the optimised parameter settings obtained through response surface methodology (RSM) and grey relational analysis combined with teaching-learning-based optimisation (GRA-TLBO) with the goal of maximising material removal rate (MRR) while minimising electrode wear rate (EWR) and surface roughness (SR). Confirmatory experiments were conducted for the final optimal factors to evaluate the accuracy of both RSM and GRA-TLBO, as illustrated in Table 14. The error percentages obtained for RSM and GRA-TLBO are ±14% and ±8.5%, respectively. This suggests that the novel hybrid technique, GRA-TLBO, demonstrates greater reliability in predicting the desired responses compared to the desirability function approach of RSM.
Scanning electron microscopy analysis
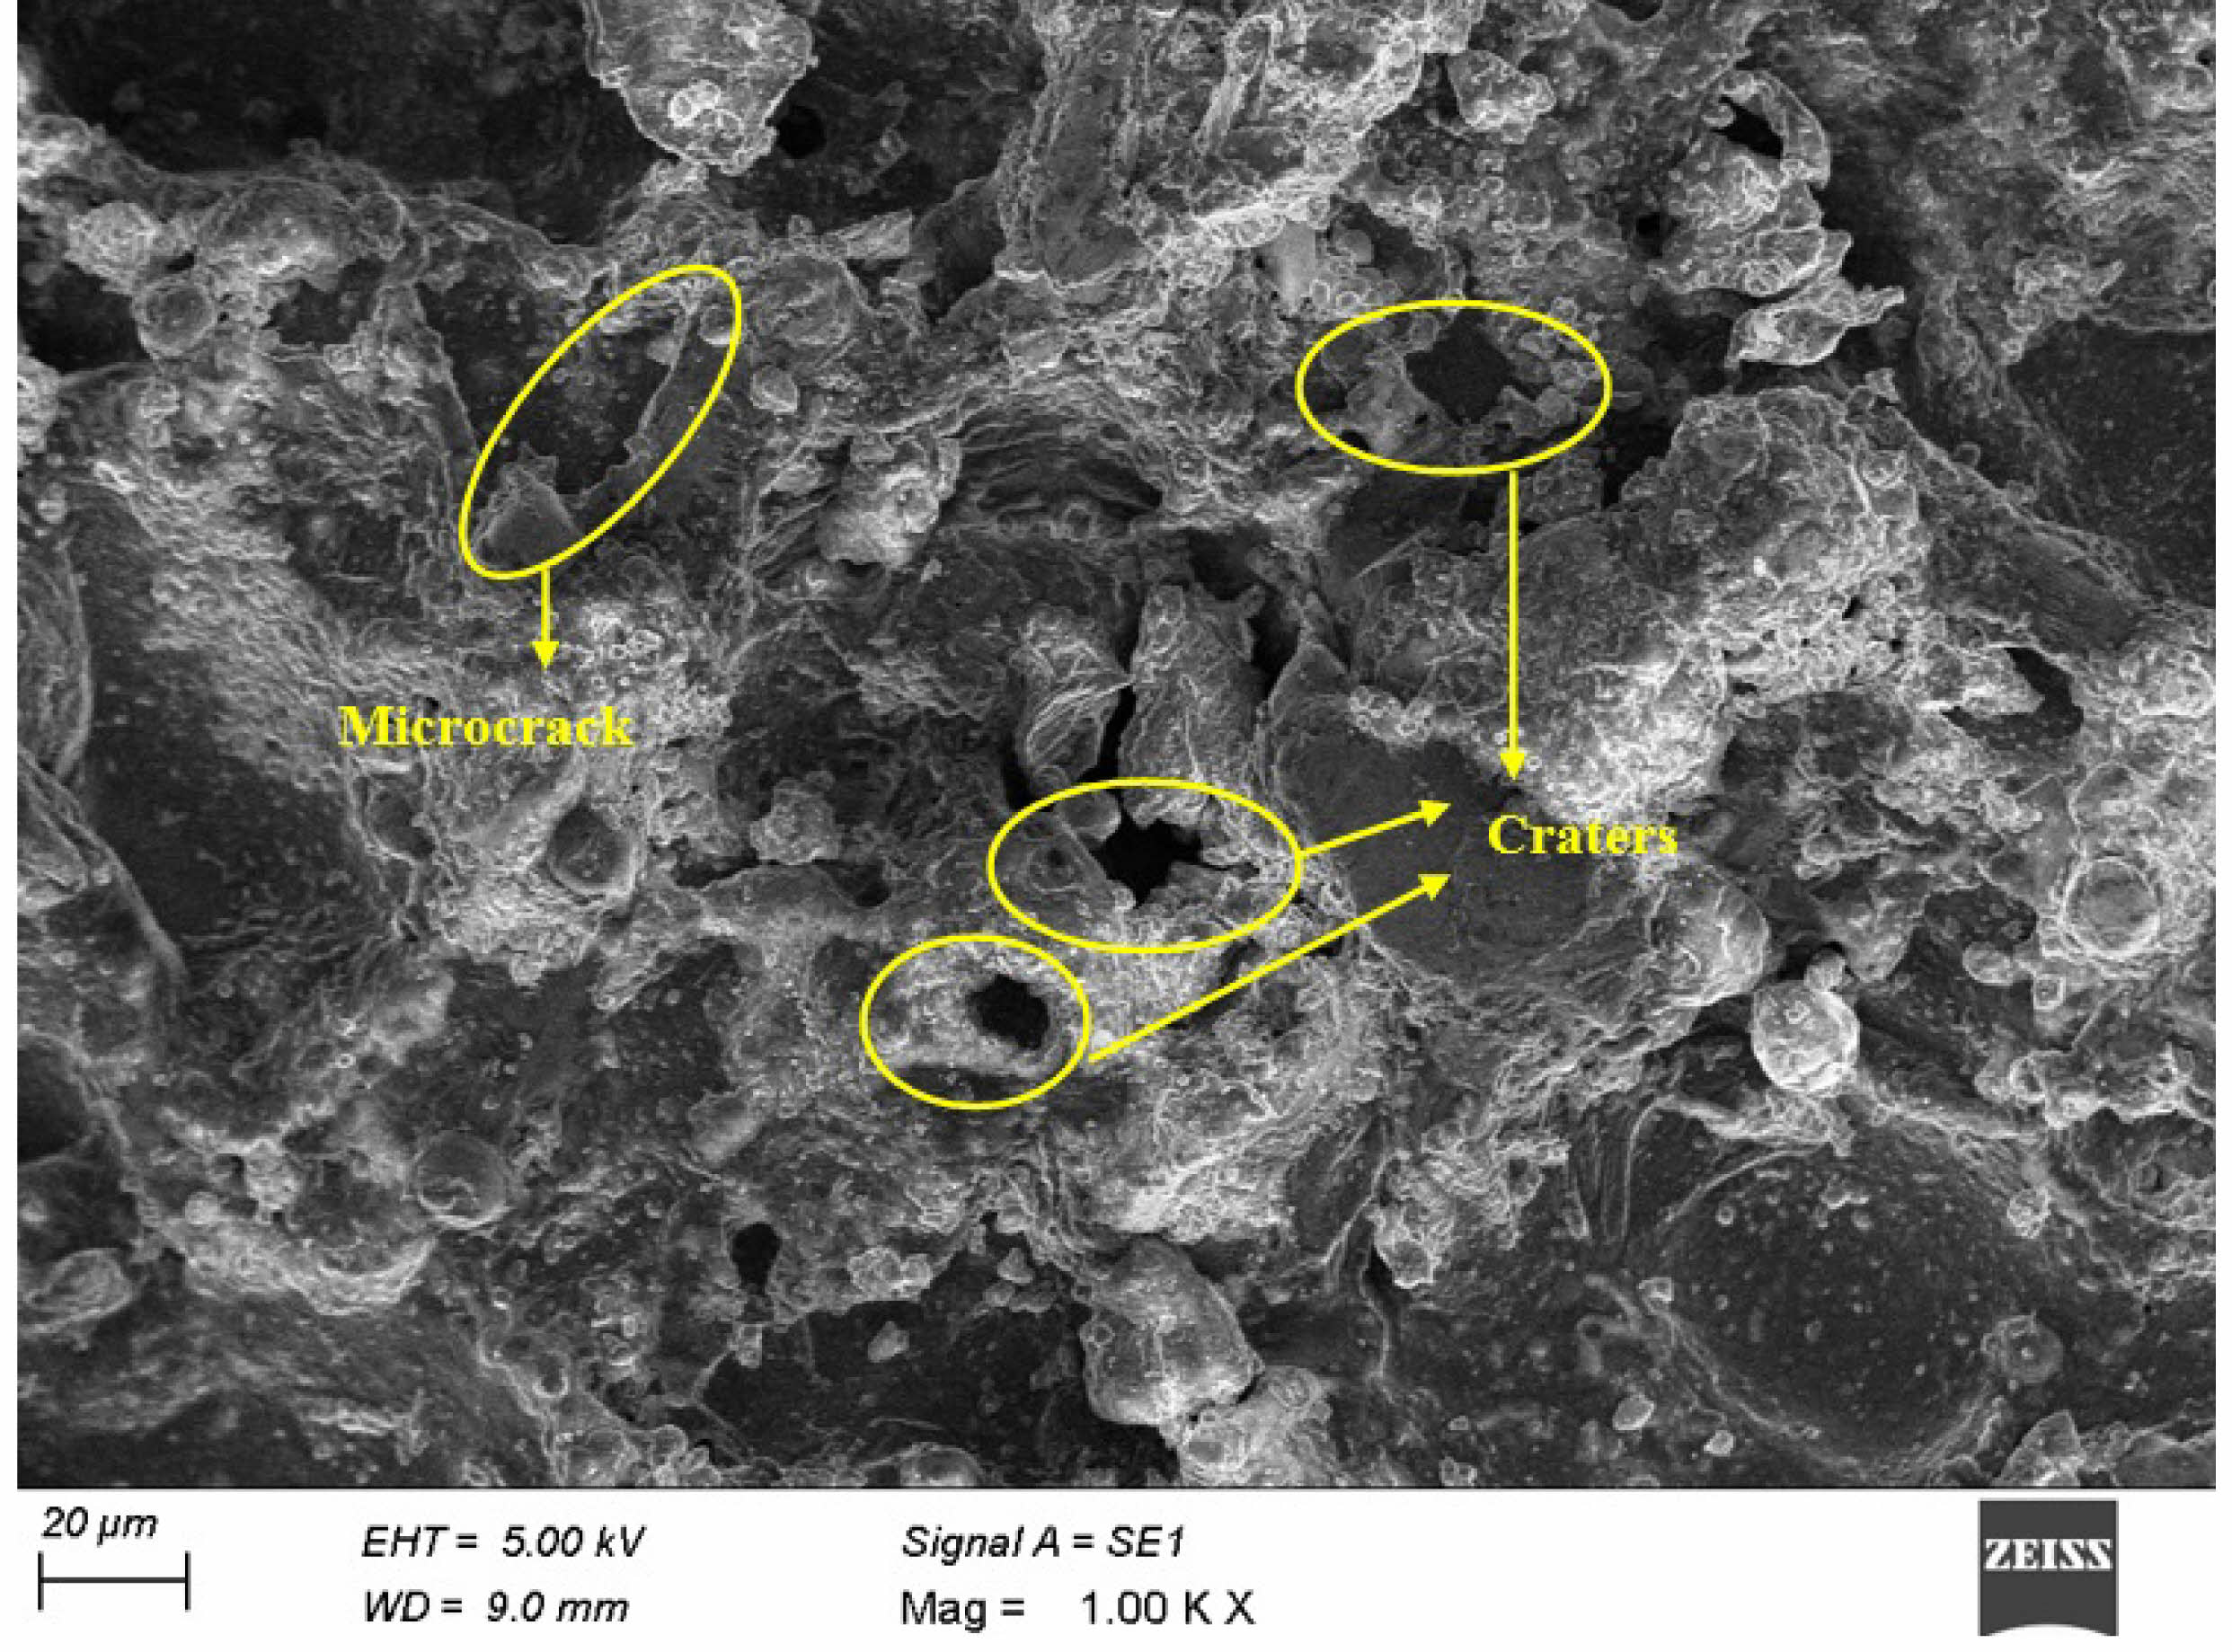
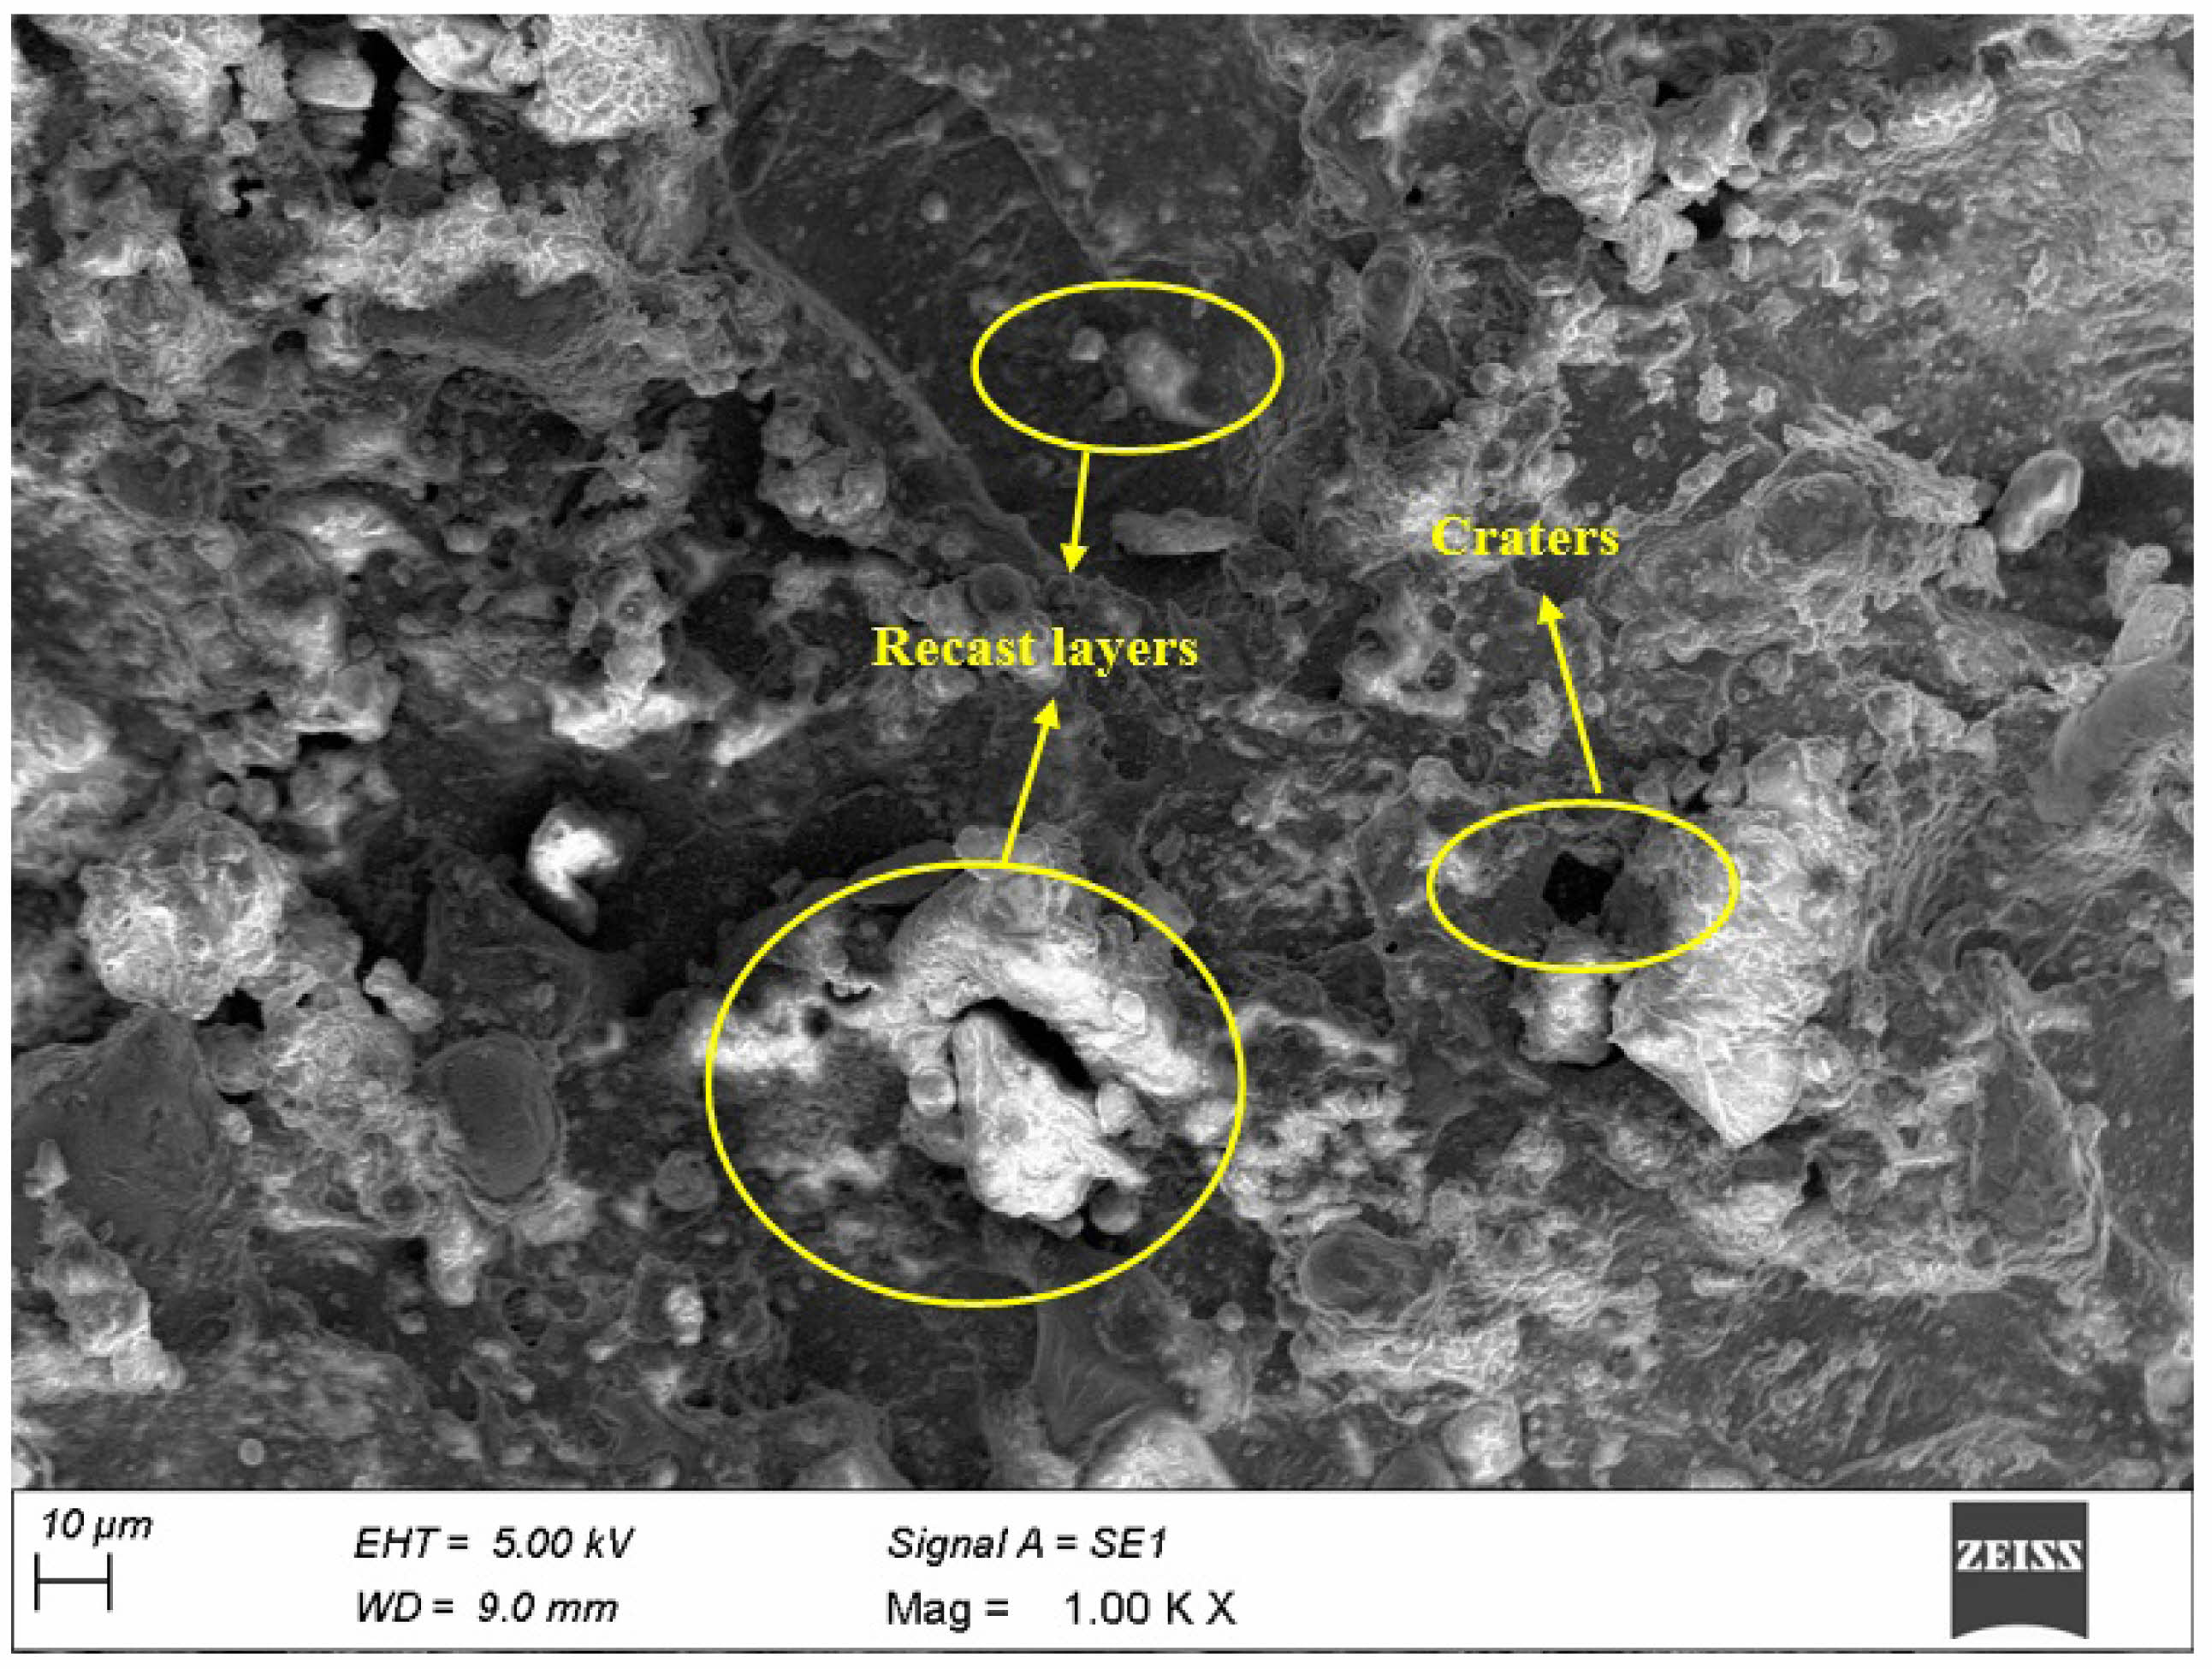
The FESEM image depicting the surface after modification using the optimal values determined by the RSM method and GRA-TLBO is presented in Figs. 12 and 13, respectively.
It is evident from Fig. 12 that as the current increases, the surface roughness (SR) also increases, leading to the emergence of craters, porosity, and other surface defects. Additionally, due to SiC's low conductivity, the presence of SiC contributes to the formation of a recast layer, where residual silicon components remain. The primary cause of surface craters and debris generation during milling is the elevated temperature. Although elevated temperatures in EDM are unavoidable, they can be mitigated by applying regulated current for the appropriate pulse duration. As depicted in Fig. 13, the surface finish was superior with the regulated current value derived using the GRA-TLBO algorithm compared to the value derived from RSM optimization.
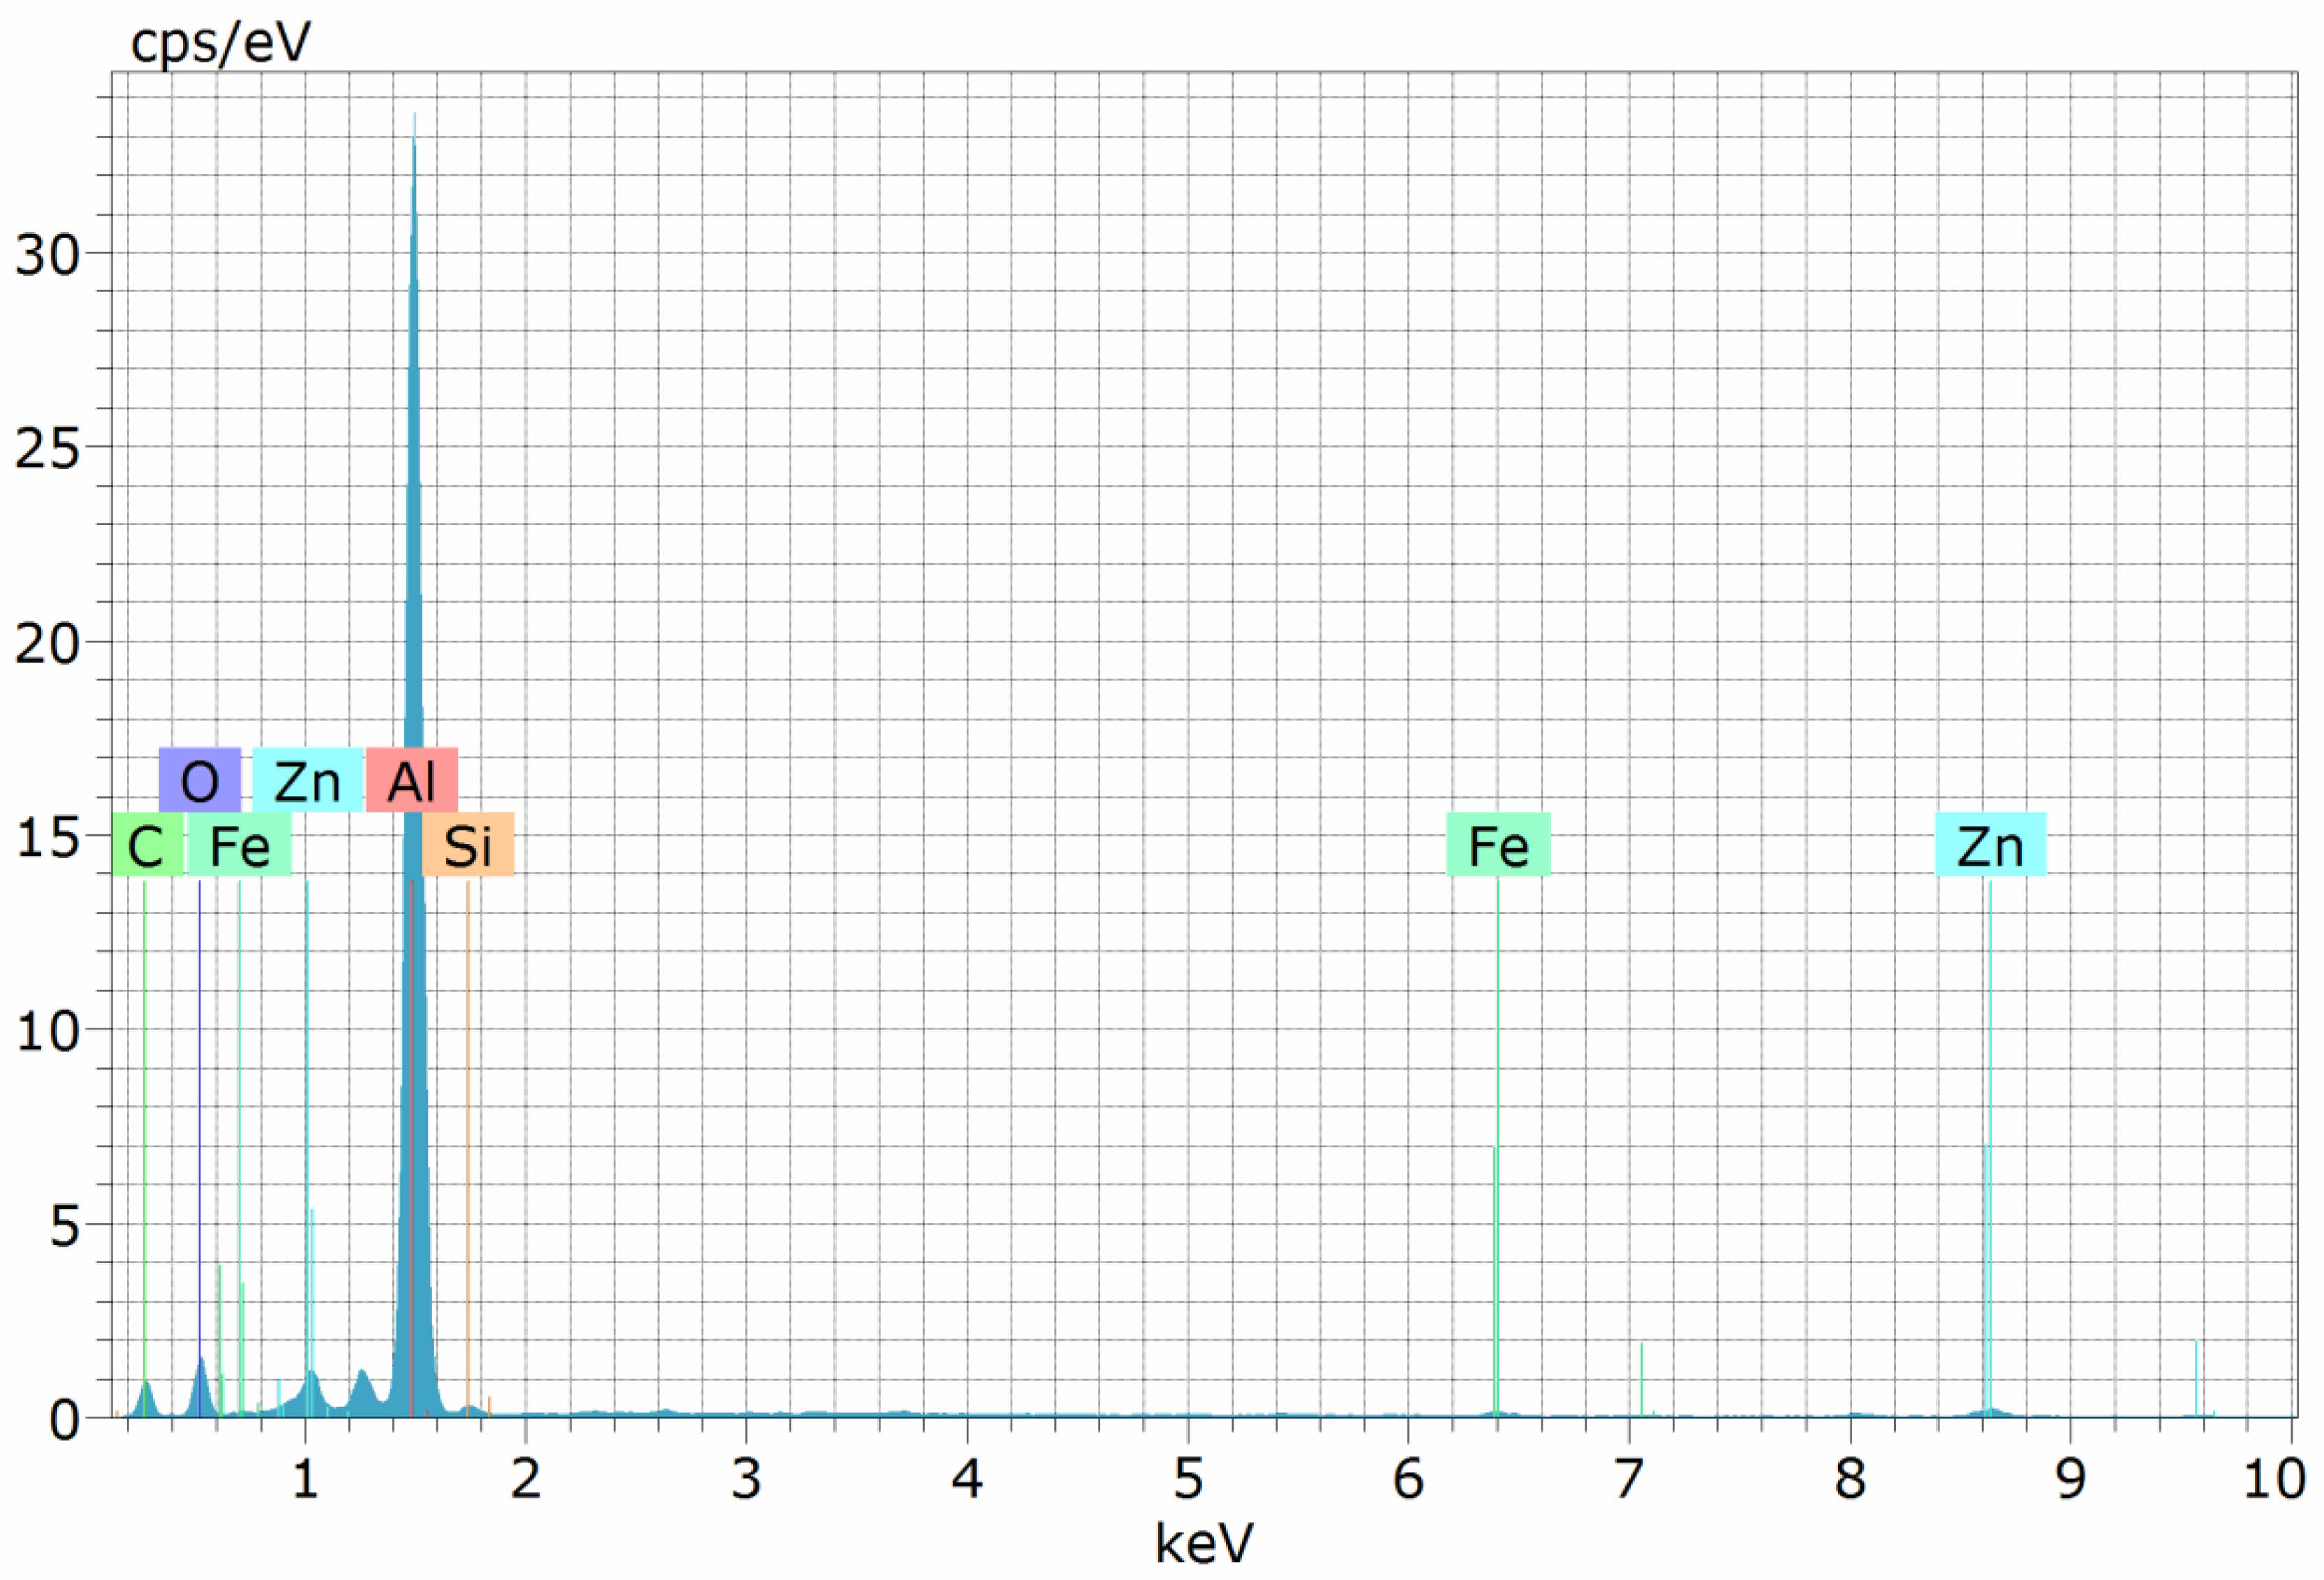
To confirm the presence of reinforcement (SiC) in the matrix phase, energy dispersive spectrometer (EDS) measurements are performed on Al7050-15SiC prior to machining, as depicted in Fig. 14. The graph illustrates that the reinforcing components, Si and C, follow the chemical constituents of Al7050, namely Al, Zn, and Fe. This indicates that SiC particles are indeed present in the Al7050 alloy matrix.
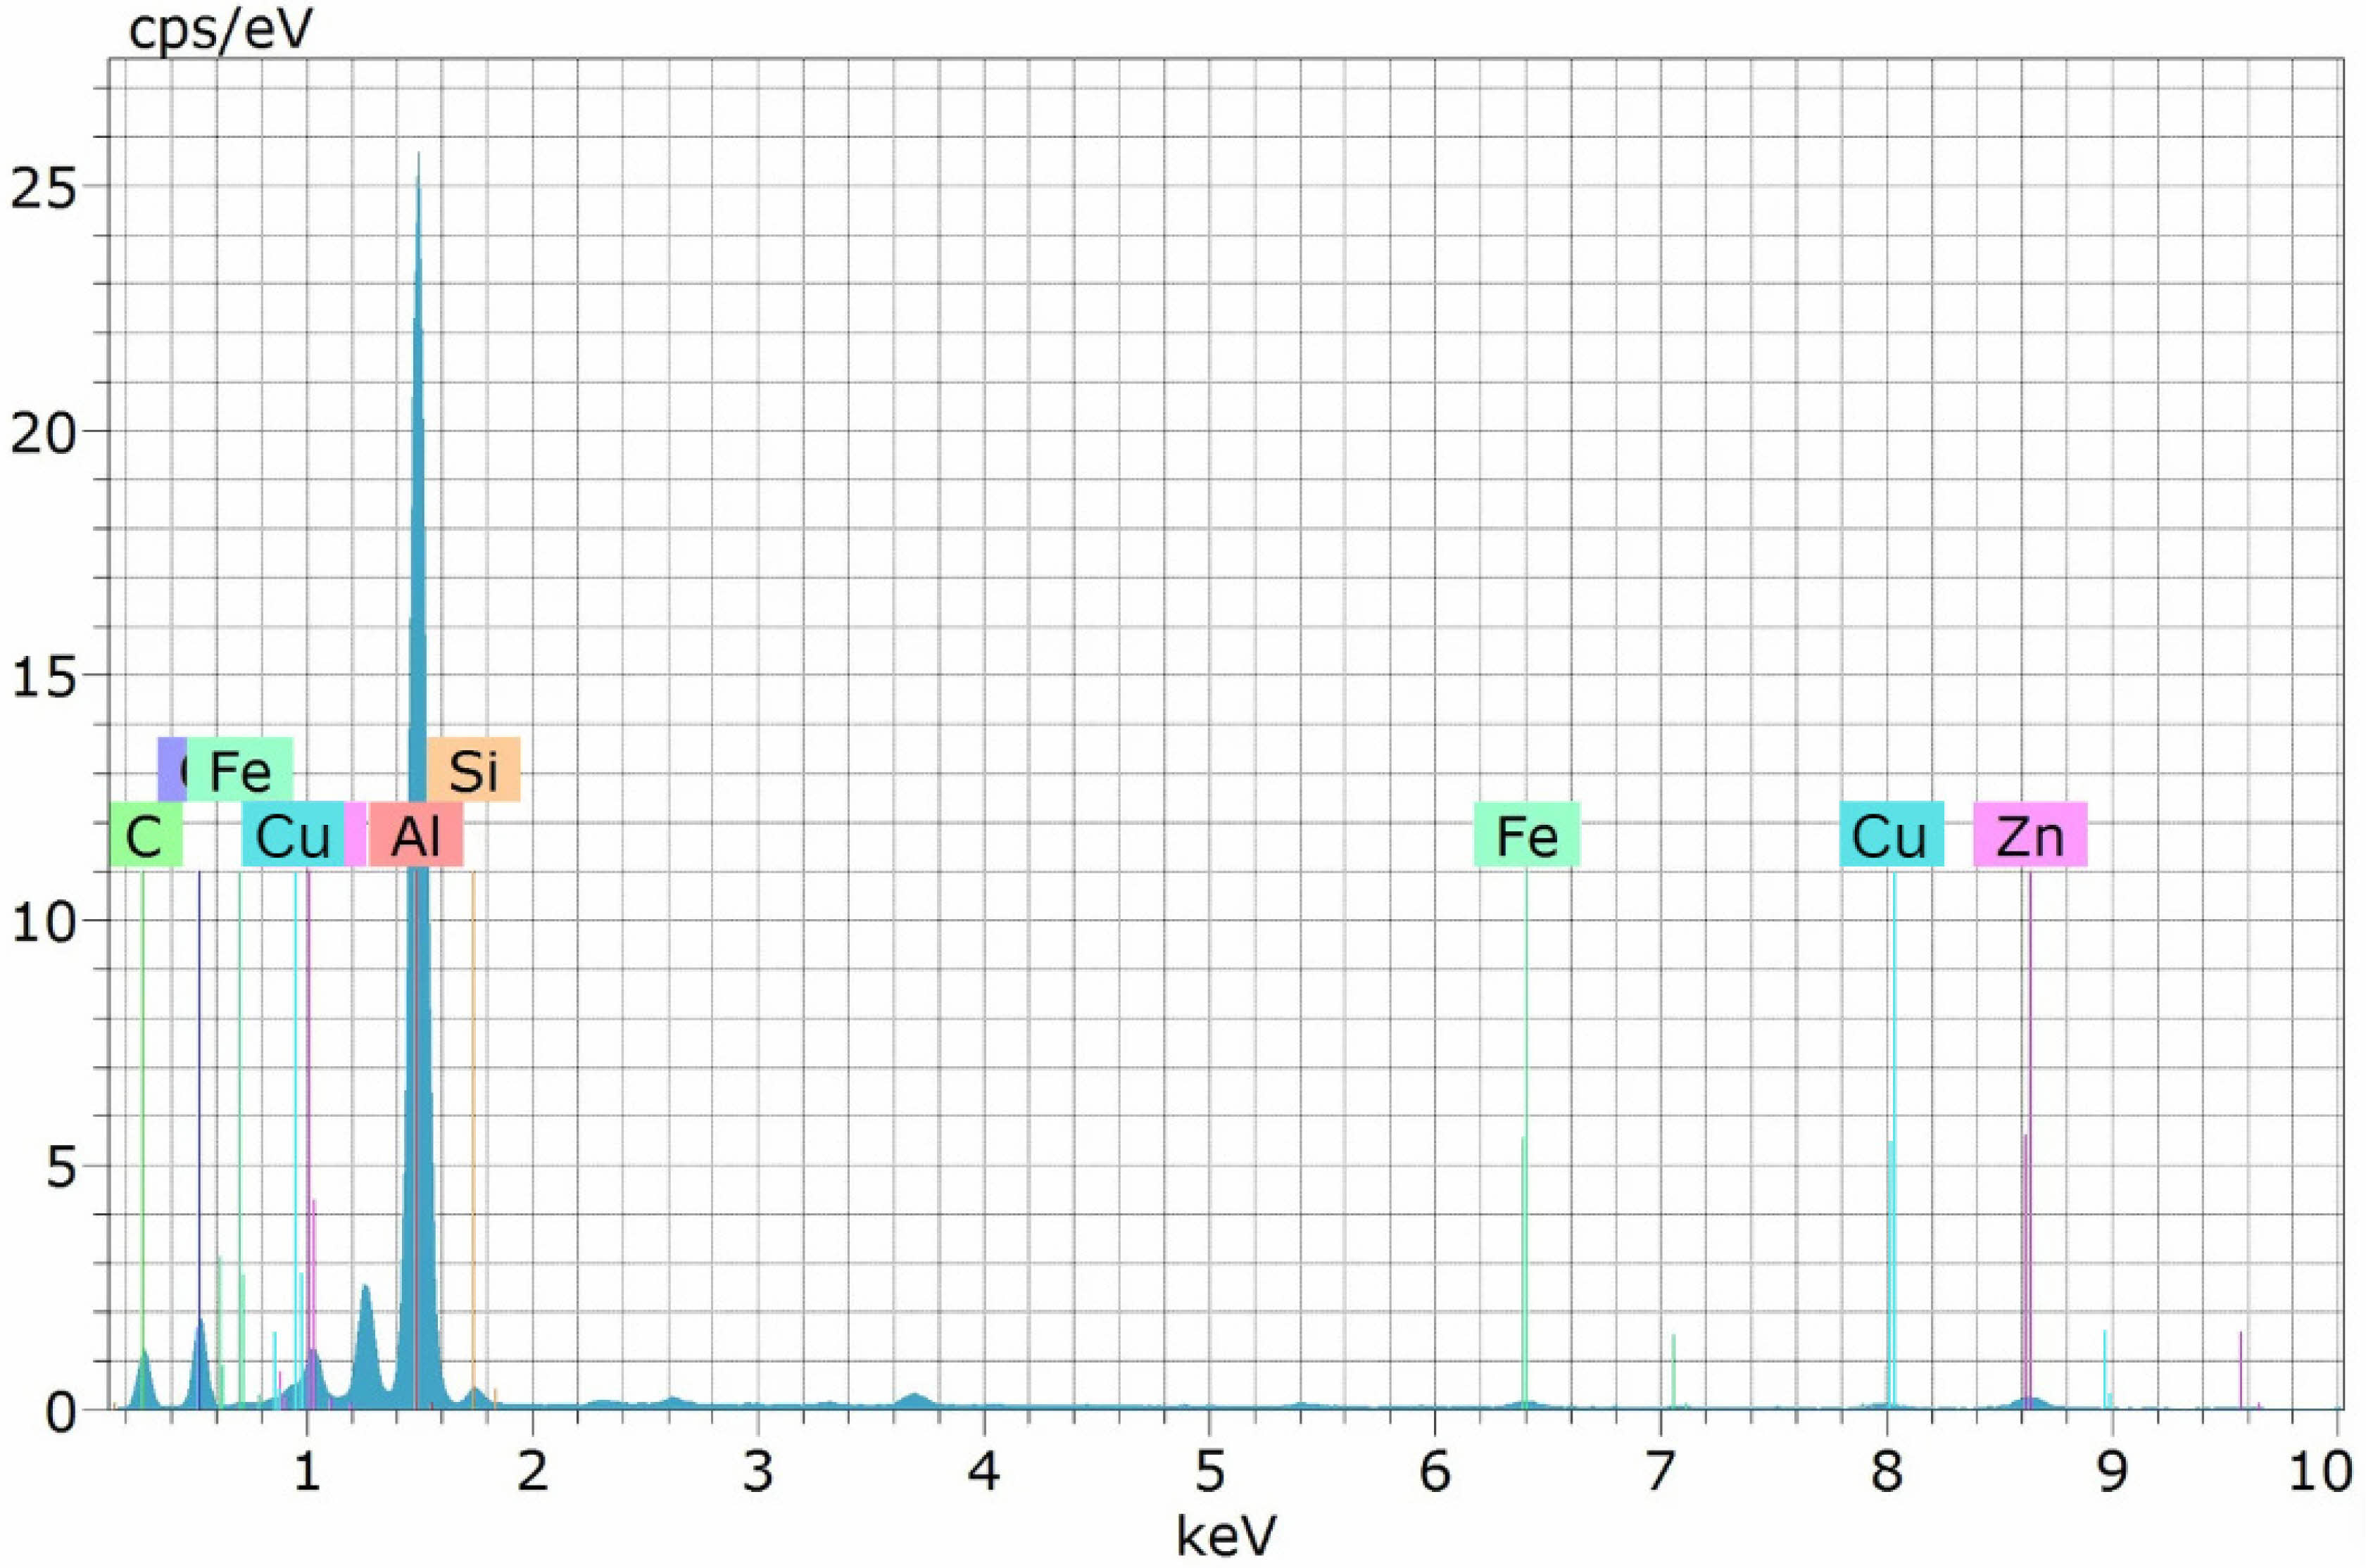
Furthermore, to assess the impact of machining on the fabricated composite, the hole created using the optimized factors determined by GRA-TLBO is subjected to examination, with the resulting EDS graph presented in Fig. 15. It is evident that, aside from the constituents of the matrix and reinforcement material, minor peaks of Cu element are detected. This occurrence can be attributed to the transfer of eroded material from the copper electrode to the machined surface during the machining process. Additionally, it is noteworthy that during low pulse off-time, unflushed materials within the machining zone solidify on the machined surface, forming a recast layer, a phenomenon also documented in [44]. Moreover, there is a slight increase in the peak level of carbon element in Fig. 15 compared to the C element in Fig. 14. This phenomenon may result from the breakdown of the dielectric medium at high temperatures.
|
Fig. 4 Residual plot of MRR. |
|
Fig. 5 Residual plot of EWR. |
|
Fig. 6 Residual plot of SR. |
|
Fig. 7 urface graph for a) MRR vs I and Pon, b) MRR vs I and Poff, c) MRR vs Pon and Poff. |
|
Fig. 8 Surface graph for a) EWR vs I and Ton, b) EWR vs I and Toff, c) EWR vs Ton and Toff. |
|
Fig. 9 Surface graph for a) SR vs I and Ton, b) SR vs I and Toff, c) SR vs Ton and Toff. |
|
Fig. 10 ptimized parameter levels for maximum MRR, minimum EWR and SR. |
|
Fig. 11 TLBO algorithm steps [25]. |
|
Fig. 12 FESEM micrograph of Al7050-15SiC machined using optimized factors from RSM. |
|
Fig. 13 FESEM micrograph of Al7050-15SiC machined using optimized factors from GRA-TLBO. |
|
Fig. 14 EDS graph of Al7050-15SiC before machining. |
|
Fig. 15 EDS graph of Al7050-15SiC after machining. |
In this study, the machinability investigation was conducted using the diesinking EDM technique, and the Al7050-15SiC composite was effectively manufactured utilizing the stir cast method. Experimental runs with various combinations of process variables, including current, pulse-on time, and pulse-off time, were created using the central composite design of RSM. Initially, the process variables were optimized using the desirability function technique to simultaneously fulfill the goals of maximum MRR, minimal EWR, and SR. Subsequently, a new hybrid optimization method called GRA-TLBO was developed to select the best process parameters that would yield the required performance attributes. Confirmatory studies were conducted to ascertain the predictive accuracy of GRA-TLBO and RSM. The key findings from this investigation are listed below.
• The significant terms in the MRR ANOVA findings were A (I), B (Pon), C (Poff), BC, and the quadratic term of C. Similarly, the most important controllable factors for EWR were variables A, B, C, and C². For SR, the essential parameters were A, B, C, AB, BC, and A².
• As the pulse current and sparking time increased gradually, the response surface graphs demonstrated a rising trend for MRR, EWR, and SR. Conversely, a declining trend was observed for MRR, EWR, and SR as the pulse off duration increased.
• The optimized parameters achieved using the desirability function technique of RSM were I at 10 amps, Pon at 6 µsec, and Poff at 5 µsec. The corresponding values of MRR, EWR, and SR were 0.01074 g/min, 0.0040 g/min, and 4.9395 µm, respectively.
• Grey Relational Grading (GRG) was utilized in the initial step of the TLBO algorithm to rank the input factors. The optimized process variables obtained by GRA-TLBO were I at 8.48 amps, Pon at 6.22 µsec, and Poff at 3.34 µsec. Furthermore, the performance metrics associated with the optimized factors for GRA-TLBO were as follows: MRR measured at 0.01159 g/min, TWR at 0.00408 g/min, and SR at 3.7202 µm.
• Confirmatory trials were conducted to assess the efficacy of the developed models. It was found that the GRA-TLBO technique exhibited superior predictive capability for the responses, with a lower error percentage of ±8.5%, compared to RSM, which had an error percentage of ±14%.
• The EDS graph of the unmachined Al7050-15SIC composite revealed the constituents of the matrix material and reinforcement. Conversely, the EDS graph of the machined surface of Al7050-15SIC exhibited minor peaks of Cu element in addition to the constituents of the matrix and reinforcement phases.
Limitations
The computational complexity of GRA-TLBO require significant computational resources and time, potentially hindering real-time application. Moreover, the generalizability of optimized parameters across different operational conditions and material types needs validation. Additionally, practical constraints such as equipment limitations, material availability, and environmental factors may impact the feasibility of implementing optimized parameters. Thorough testing and validation in industrial environments are crucial to ensure that the optimized parameters translate into tangible improvements in performance, reliability, and cost-effectiveness.
Future Prospects of this work
This research reveals that the GRA-TLBO optimization technique proves highly effective in identifying optimal values for EDM process parameters, thereby enhancing machining performance. The proposed approach holds promise for addressing multi-objective problems encompassing additional responses like geometrical tolerances and dimensional accuracy. Additionally, the GRA-TLBO optimization technique offers ideal parameters to meet industrial requirements and shows potential application across a variety of conventional and nonconventional machining processes, such as drilling, milling, electrochemical machining, abrasive jet machining, wire-electrical discharge machining, etc.
- 1. M.O. Bodunrin, K.K. Alaneme, and L.H. Chown, J. Mater. Res. Technol. 4 (2015) 434-445.
-

- 2. N. Ravikumar, R. Vijayan, and R. Viswanathan, J. Ceram. Process. Res. 24[1] (2023) 142-152.
-
- 3. L. Selvarajan, C.S. Narayanan, and R. Jeyapaul, J. Adv. Manuf. Syst. 14 (2015) 259-272.
-
- 4. K.R. Kumar, K.K. Dama, and V.V. Satyanarayana, J. Ceram. Process. Res. 24[3] (2023) 439-445.
-
- 5. M. Imran, and A.R.A. Khan, J. Mater. Res. Technol. 8 (2019) 3347-3356.
-
- 6. S.S. Thakur, S.K. Pradhan, D. Mehrotra, and S. Sehgal, Aust. J. Mech. Eng. 22 (2024) 998-1023.
-
- 7. R. Jojith, and N. Radhika, Part. Sci. Technol. (2018) 1-13.
- 8. S.S. Ganesh, and A. Jegan, J. Ceram. Process. Res. 24[3] (2023) 486-494.
-
- 9. T. Satish Kumar, R. Subramanian, S. Shalini, and P.C. Angelo, Forsch. Im Ingenieurwesen/Eng. Res. 79 (2015) 123-130.
-
- 10. J.J. Moses, I. Dinaharan, and S.J. Sekhar, Trans. Nonferrous Met. Soc. China (English Ed. 26 (2016) 1498-1511.
-
- 11. K.T. Chiang, Int. J. Adv. Manuf. Technol. 37 (2008) 523-533.
-
- 12. J. Vora, Y. Shah, S. Khanna, V.K. Patel, M. Jagdale, and R. Chaudhari, J. Manuf. Mater. Process. 7 (2023) 111.
-
- 13. M. Sai Krupa, N. Dileep Kumar, R. Suresh Kumar, P. Chakravarthy, and K. Venkateswarlu, Ceram. Int. 39 (2013) 9567-9574.
-
- 14. P. Kumar, and R. Parkash, Mach. Sci. Technol. 20 (2016) 330-348.
-
- 15. K. Ponappa, K.S.K. Sasikumar, M. Sambathkumar, and M. Udhayakumar, Surf. Rev. Lett. 26 (2019).
-
- 16. A.K. Pandey, G.D. Gautam, and J. Brazilian Soc. Mech. Sci. Eng. 40 (2018).
-
- 17. D. Doreswamy, A.M. Bongale, M. Piekarski, A. Bongale, S. Kumar, D.Y. Pimenov, K. Giasin, and K. Nadolny, Materials (Basel). 14 (2021) 1-18.
-
- 18. P. Sivaprakasam, J. Udaya Prakash, and P. Hariharan, Int. J. Ambient Energy. 43 (2022) 584-589.
-
- 19. S. Parsana, N. Radadia, M. Sheth, N. Sheth, V. Savsani, N.E. Prasad, and T. Ramprabhu, Arch. Civ. Mech. Eng. 18 (2018) 799-817.
-
- 20. M. Kolli, D. Aruri, S. Gadakary, and S. Kosaraju, E3S Web Conf. 309 (2021) 6-11.
-
- 21. M. Bhaumik, and K. Maity, World J. Eng. 18 (2021) 50-57.
-
- 22. A.K. Bodukuri, and E. Kesha, Int. J. Adv. Technol. Eng. Explor. 8 (2021) 735-752.
-
- 23. V.P. Srinivasan, P.K. Palani, and S. Balamurugan, Ceram. Int. 47 (2021) 19153-19168.
-
- 24. V.P. Srinivasan, C. Sandeep, C. Shanthi, A.B.H. Bejaxhin, R. Anandan, and M. Abisha Meji, Adsorpt. Sci. Technol. 2022.
-
- 25. A.R. Udhayakumar, and S. Satish Kumar, Trans. Can. Soc. Mech. Eng. 46 (2022) 503-523.
-
- 26. R. Chaudhari, A. Kevalramani, J. Vora, S. Khanna, V.K. Patel, D.Y. Pimenov, and K. Giasin, Micromachines. 13 (2022) 1-19.
-
- 27. P. Haja Syeddu Masooth, G. Bharathiraja, V. Jayakumar, and K. Palani, Mater. Res. Express. 9 (2022).
-
- 28. V.P. Srinivasan, S.R. Rai, G. Aruljothi, K. Nitish, and G. Kalusuraman, AIP Conf. Proc. 2527 (2022).
-
- 29. A.K. Singh, D. Singhal, and R. Kumar, Mater. Today Proc. 26 (2019) 2839-2844.
-
- 30. M.H. Raza, A. Wasim, M.A. Ali, S. Hussain, and M. Jahanzaib, Int. J. Adv. Manuf. Technol. 99 (2018) 3017-3034.
-
- 31. P. Sadagopan, and B. Mouliprasanth, Int. J. Adv. Manuf. Technol. 92 (2017) 277-291.
-
- 32. R. Khanna, A. Kumar, M.P. Garg, A. Singh, and N. Sharma, J. Ind. Eng. Int. 11 (2015) 459-472.
-
- 33. S.S. Sidhu, A. Batish, and S. Kumar, Proc. Inst. Mech. Eng. Part B J. Eng. Manuf. 227 (2013) 1679-1692.
-
- 34. S. Gopalakannan, and T. Senthilvelan, J. Int. Meas. Confed. 46 (2013) 2705-2715.
-
- 35. S.S. Habib, Appl. Math. Model. 33 (2009) 4397-4407.
-
- 36. A. Kotlapati, and S.S. Hiremath, J. Micromanufacturing. (2022) 251659842211231.
-
- 37. A. Uğur, E. Nas, and H. Gökkaya, Int. J. Mech. Sci. 186 (2020) 105875.
-
- 38. S. Suresh Kumar, M. Uthayakumar, S. Thirumalai Kumaran, P. Parameswaran, and E. Mohandas, Int. J. Mater. Prod. Technol. 53 (2016) 86-97.
-
- 39. A.P. Dwivedi, and S.K. Choudhury, Mater. Manuf. Process. 31 (2016) 1844-1852.
-
- 40. A. Ramaswamy, A.V. Perumal, and J. Brazilian Soc. Mech. Sci. Eng. 42 (2020).
-
- 41. V.S. Sreebalaji, and K. Ravi Kumar, Int. J. Comput. Mater. Sci. Surf. Eng. 6 (2016) 244-262.
-
- 42. A.K. Singh, N. Kumar, and S. Srivastava, Int. J. Comput. Netw. Inf. Secur. 11 (2019) 36-42.
-
- 43. C.P. Mohanty, M.P. Satpathy, S.S. Mahapatra, and M.R. Singh, Sadhana - Acad. Proc. Eng. Sci. 43 (2018) 1-18.
-
- 44. D.G. Mohan, S. Gopi, V. Rajasekar, K. Krishnan, D.G. Mohan, S. Gopi, L. Selvarajan, R. Rajavel, B. Prakash, D.G. Mohan, S. Gopi, A.A. Alloys, U. Taguchi, L. Selvarajan, R. Sasikumar, D.G. Mohan, P. Naveen Kumar, and V. Muralidharan, Mater. Today Proc. 27 (2019) 0-31.
-
 This Article
-
2025; 26(2): 323-341
Published on Apr 30, 2025
- 10.36410/jcpr.2025.26.2.323
- Received on Mar 25, 2024
- Revised on Jun 22, 2024
- Accepted on Jul 4, 2024
Services
Shared
Correspondence to
- B.R. Senthil Kumar
-
Professor, Department of Aeronautical Engineering, Nehru Institute of Engineering and Technology, Coimbatore, 641105
Tel : 9345451066 Fax: 9345451066 - E-mail: senthilramanseetha60@gmail.com
Clean-Energy Research Institute(CRI), Hanyang University, 222, Wangsimni-ro, Seongdong-gu, Seoul, 04763, Korea
E-mail: jcpr@hanyang.ac.kr