


- Mechanical and microstructural performance of engineered geopolymer cementitious composites embedded with activated slag
S. Kavipriya*, K. Pradeep and S. Southamirajan
Department of Civil Engineering, Kongunadu College of Engineering and Technology, Trichy, Tamil Nadu, India
This article is an open access article distributed under the terms of the Creative Commons Attribution Non-Commercial License (http://creativecommons.org/licenses/by-nc/4.0) which permits unrestricted non-commercial use, distribution, and reproduction in any medium, provided the original work is properly cited.
A study was undertaken to calculate the efficacy of Engineered Geopolymer Cementitious Composites (EGCC) mixes with incorporation of activated slag and sisal fibers. Four different Composition of Concrete such as Slag Concrete (SC), Composite Concrete (CC), Green Concrete (GC), and Geopolymer Concrete (GPC) were cast and tested for their mechanical properties such as workability, compressive strength, and young’s modulus. Also, microstructural performance of these concrete compositions was studied using SEM and XRD. In Slag Concrete (SC) 30% clinkers, 70% activated slag was incorporated. In Composite Concrete (CC) 30% clinkers, 35% flyash, 35% activated slag was mixed. In Green Concrete (GC) 50% flyash and 50% activated slag was added. And in Geopolymer Concrete (GPC) 100% flyash was mixed into the concrete. The mixed compositions were activated by adding alkaline activator solution. All the concrete compositions were compared with Normal Concrete (NC) specimens. And the mixed cementitious concrete specimens were blended with 50% coarse aggregate and 50% Recycled Coarse Aggregate (RCA). Quarry Rock Dust (QRD) was used as fine aggregate in all composites. The test results reveal that within the examined concrete compositions, Composite Concrete (CC) with 30% clinkers, 35% flyash, 35% activated slag exhibit excellent workability and strength characteristics.
Keywords: Activated slag, Composite concrete, Engineered geopolymer cementitious composites, Green concrete, Geopolymer concrete, Quarry rock dust, Recycled coarse aggregate, Slag concrete.
Cement is the largest source of emissions from decomposition of carbonates is a binding material that has been used since ancient times [10]. But it was following World War II that the production of cement accelerated rapidly worldwide, with current levels of global production equivalent to more than half a tonne per person per year [1, 2]. Global cement production has increased more than 30-fold since 1950 and almost 4-fold since 1990, with much more rapid growth than global fossil energy production in the last 2 decades [12]. Since 1990 this growth is largely because of rapid development in China, where cement production has grown by a factor of more than 11, such that 74 % of global growth in cement production since 1990 occurred in China [18, 19]. There are two aspects of cement production that result in emissions of CO2 [3].
First is the chemical reaction involved in the production of the main component of cement, clinker, as carbonates (largely CaCO3, found in limestone) are decomposed into oxides (largely lime, CaO) and CO2 by the addition of heat [20].
The use of slag cement has demonstrated long-term performance enhancements allowing designers to reduce the environmental footprint of concrete while ensuring improved performance and increased durability [15].
The benefits of using slag cement include: Improved workability. Easier placeability and finishability [5]. The primary components of iron and steel slag are limestone (CaO) and silica (SiO2). Other components of blast furnace slag include alumina (Alsub > 2O3) and magnesium oxide (MgO), as well as a small number of sulfur (S), while steelmaking slag contains iron oxide (FeO) and magnesium oxide (MgO) [2-4]. Blast furnace slag is a nonmetallic coproduct produced in the process [11]. It consists primarily of silicates, aluminosilicates, and calcium-alumina-silicates [29]. The molten slag, which absorbs much of the sulfur from the charge, comprises about 20 percent by mass of iron production [7, 8].
The QRD is a calcium-rich waste material of the rock crushing industry that is produced as a cloud of unwanted dust during the manufacturing process of coarse aggregates [12]. A portion of this unwanted waste is often used on-site as a filling material for the quarry pits [13]. This waste can be effectively used as a construction material to preserve the environment and natural resources [15]. The recycled aggregate concrete (RAC) is widely applied in existing engineering, due to the great economy and environmental protection. The QRD has been used as a partial replacement of sand in GPC and mortars. The consumption of QRD in concrete is recommended mainly in the regions where the sand is not available in abundant quantity [17]. The suitability of QRD to be used as a sand replacement material shows superior mechanical properties of concrete such as compressive, tensile, and flexural strengths. The complete replacement of sand with QRD gave superior compressive strength properties [16].
RCA are mainly derived from crushing and processing of previously used concrete structural elements [9]. RCA contain bricks, tiles, metals, and other mixed materials such as glass, wood, paper, plastic, and debris along with crushed concrete [21].
The swelling of these fibers is related to their moisture regain value. Plant fibers with high moisture regain have low porosity, which does not appear to change significantly with swelling due to moisture absorption [25]. Indirect drying causes greater reduction in density, strength, and rigidity of these fibers as compared with direct drying, indicating that the molecular arrangement is less ordered in indirectly dried fibers [22, 23]. The spiral angle around the fiber axis is 20-25 degrees.Sisal fiber of diameter 21.5 × 10⁻³ cm shows elastic strain of 8.7%. These fibers are more compressible in the transverse direction than in the longitudinal direction [30]. Sisal fibers fade rapidly when exposed to sunlight because of the presence of lignin [27].
FA particles are very fine and mostly spherical in shape with varying diameters. As the FA is generated by the combustion of coals obtained from different origins, the physical and chemical characteristics of FA show a wide variation, however, most of the FA available is pozzolanic in nature [28]. Depending upon the type of coal used, the amount of calcium and amorphous alumino silicate phases present in FA vary. The four methods commonly used for additional core analysis are Scanning electron microscopy (SEM), X-ray diffractometry (XRD), Cathodoluminescence (CL), X-ray fluoroscopy (XF) [29]. These methods provide important extensions to thin section analysis and can be tied closely to log response and productivity [30].
Materials
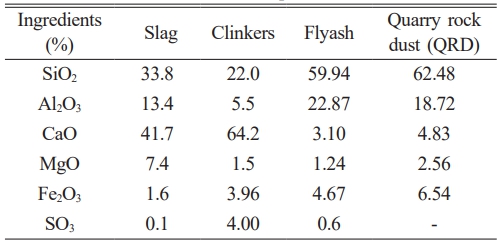
Table 1 shows the chemical composition obtained via an X-ray fluorescence test. Slag (IS 12089 -1987), OPC Clinkers (Type II in ASTMC 150), Flyash (IS 3812-1 -2003), Quarry Rock Dust (IS 383-1970) and Gypsum (IS1290 -1973).OPC Clinkers clinkers 43 grade (Type II in ASTM C150), IS 269:2015, Slag (IS 455 -2015), flyash (IS 3812-1 -2013) are used. As per IS: 383-1970, since the fineness modulus of Quarry Rock Dust (QRD) is 2.87, it is classified as medium sand type of Zone II with specific gravity 2.64 and bulking of sand 22%. The tests for Recycled Coarse Aggregate (RCA) as per IS 383-2016, the gradation test was conducted as of IS2386 Part I, Fineness Modulus of Recycled Coarse Aggregate is 6.32, the maximum size of aggregates lies between 10 to 4.75 mm. Specific mass of the dry aggregate of Quarry Rock Dust is 2.64 g/cm3, coarse aggregate is 2.84 g/cm3 and Recycled Coarse Aggregate is 2.79 g/cm3. Water absorption after 24 hours for QRD is 2.1%, Coarse Aggregate is 1.2% and Recycled Coarse Aggregate is 4.7%. Aggregate crushing value as per ASTM D 5821, IS2386 Part-IV is 60% and RCA is 37%. Aggregate impact value as per (IS 2386:Part IV) for coarse aggregate is 55%, RCA is 33%. Flakiness Index as per (IS 2386-1 1963) is 14% and RCA is 15.5%. Elongation Index as per (IS 2386-1 1963) is 16.5% and RCA is 17.6%.
Concrete production
Five concrete samples were produced with different replacement rates: 100% OPC clinkers (Normal Concrete-NC), Slag-70%, Clinker-30% (Slag Concrete-SC), Flyash-
35%, Slag-35%, Clinker-30% (Composite Concrete-CC), Flyash-50%, Slag-50% (Green Concrete-GC) and Flyash-100% (Geopolymer Concrete-GPC) based on volume. Gravel composition and the percentage of replacement was determined by the mass fraction retained in each sieve of the granulometric characterization test. In the concrete mix, the mortar content was about 60% and the consistency used for all specimens were set at 100 10 mm.
3% of gypsum was added to all concrete specimens.To compensate the water absorption of the recycled coarse aggregate additional water content with 10% was added to all specimens, so that the effective w/c ratio of samples containing the recycled aggregate will be higher. And 50% of activator solution,a combination of sodium hydroxide and sodium silicate was added to all specimens. This helps to activate the slag and flyash to improve the strength and durability properties.
Recycled coarse aggregates were wetted for 30 minutes, since this aggregate absorbs more than 80% of its absorption capacity during this interval. Water was added until the aggregate surface was totally covered and then left to to retain in SSD-Saturated Surface Dry Condition.
Remaining water was added into the concrete to maintain uniform homogeneity. Additional 10% of water content with respect to volume of concrete was added. The concrete samples were kept in a ambient temperature condition until the tests were performed. OPC clinkers, flyash, slag, QRD, recycled coarse aggregate were added to a concrete mixer and mixed for 5 minutes. Then this dry mix was mixed with 50% activator solution with 3% gypsum. 1% of sisal fibers were mixed into the concrete. The activator solution was prepared one day earlier before concreting.
The M30- mix design parameters considered to synthesis alkaline activator solution were:
i) 10M of sodium hydroxide
ii) Ratio of source material to alkaline solution as 2.5
iii) Ratio of Na2SiO3 to NaOH was considered as 1.5
iv) 100% activator solution was added to green concrete and geopolymer concrete specimens.
v) 50% activator solution was added to slag concrete and composite concrete.
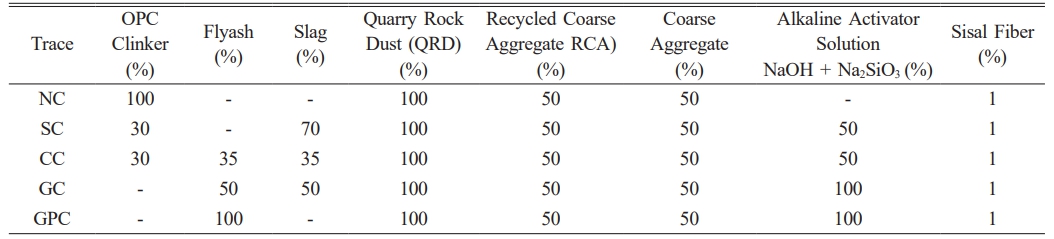
In Slag Concrete, specimens were cast with Slag-70%, Clinker-30%, Composite Concrete blends with flyash-35%, slag-35%, and clinker-30%, Green Concrete cast with flyash-50%, slag-50% and Geopolymer Concrete blends with 100% flyash. Table 2 Table 3 Table 4
|
Table 2 Percentage mix ratio of Normal concrete (CC), Slag Concrete (SC), Composite Concrete (CC), Green Concrete (GC), and Geopolymer Concrete (GPC). |
|
Table 3 Mix Composition of Normal concrete (CC), Slag Concrete (SC), Composite Concrete (CC), Green Concrete (GC), and Geopolymer Concrete (GPC) as per IS IS:10262-1982. |
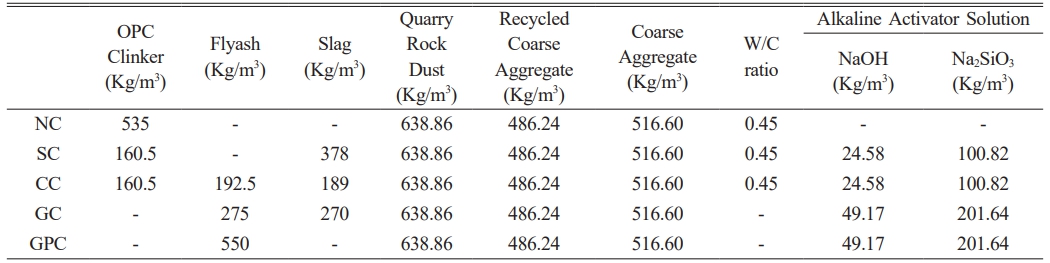
*Additionally 27.50 Kg/m3 of water was added to all specimens. |
Experimental Investigation
Fresh Concrete Investigation
Slump Test
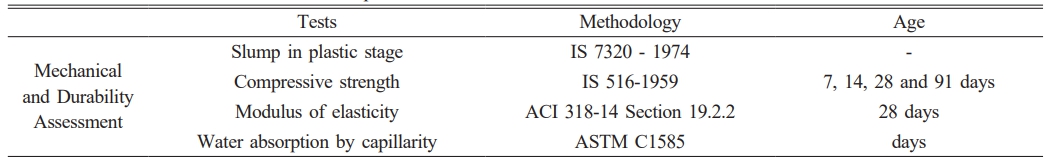
Slump of concrete was carried out using slump cone and the test was performed as per IS 7320-1974. All the freshly prepared concrete mixes were tested for workability using the standard slump cone apparatus [17]. The slump was filled with freshly mixed Concrete and was compacted using tamping rod by giving blows in four layers. The top of the cone was leveled off and lifted vertically up and the slump was immediately measured. Fresh concrete was prepared with OPC Clinkers and filled in slump cone and slump was measured [19]. Similarly concrete was prepared using slag 70%, and clinkers 30% and the slump was measured by tamping the concrete in four layers. 50% of activator solution was added into the concrete and remaining water was mixed with concrete. Next Composite concrete slump was measured with 30% clinkers, 35% flyash and 35% of slag. In this mix also 50% activator solution was added into the mix remaining was filled with water and the concrete was mixed and the slump was measured. Green concrete no clinkers were added, 50% flyash and 50% slag was mixed into the concrete. 100% of activator solution was added into the mix. Finally, geopolymer concrete was prepared with 100% flyash and 0% of clinkers. Here also the mix was done using 100% of activator solution and the slump was measured. In all concrete specimens the gypsum was added by 3%. Additionally, 1% of sisal fibers were added into the concrete specimens and 10% of addition water content was used to blend the concrete.
Strength Investigation
Modulus of Elasticity
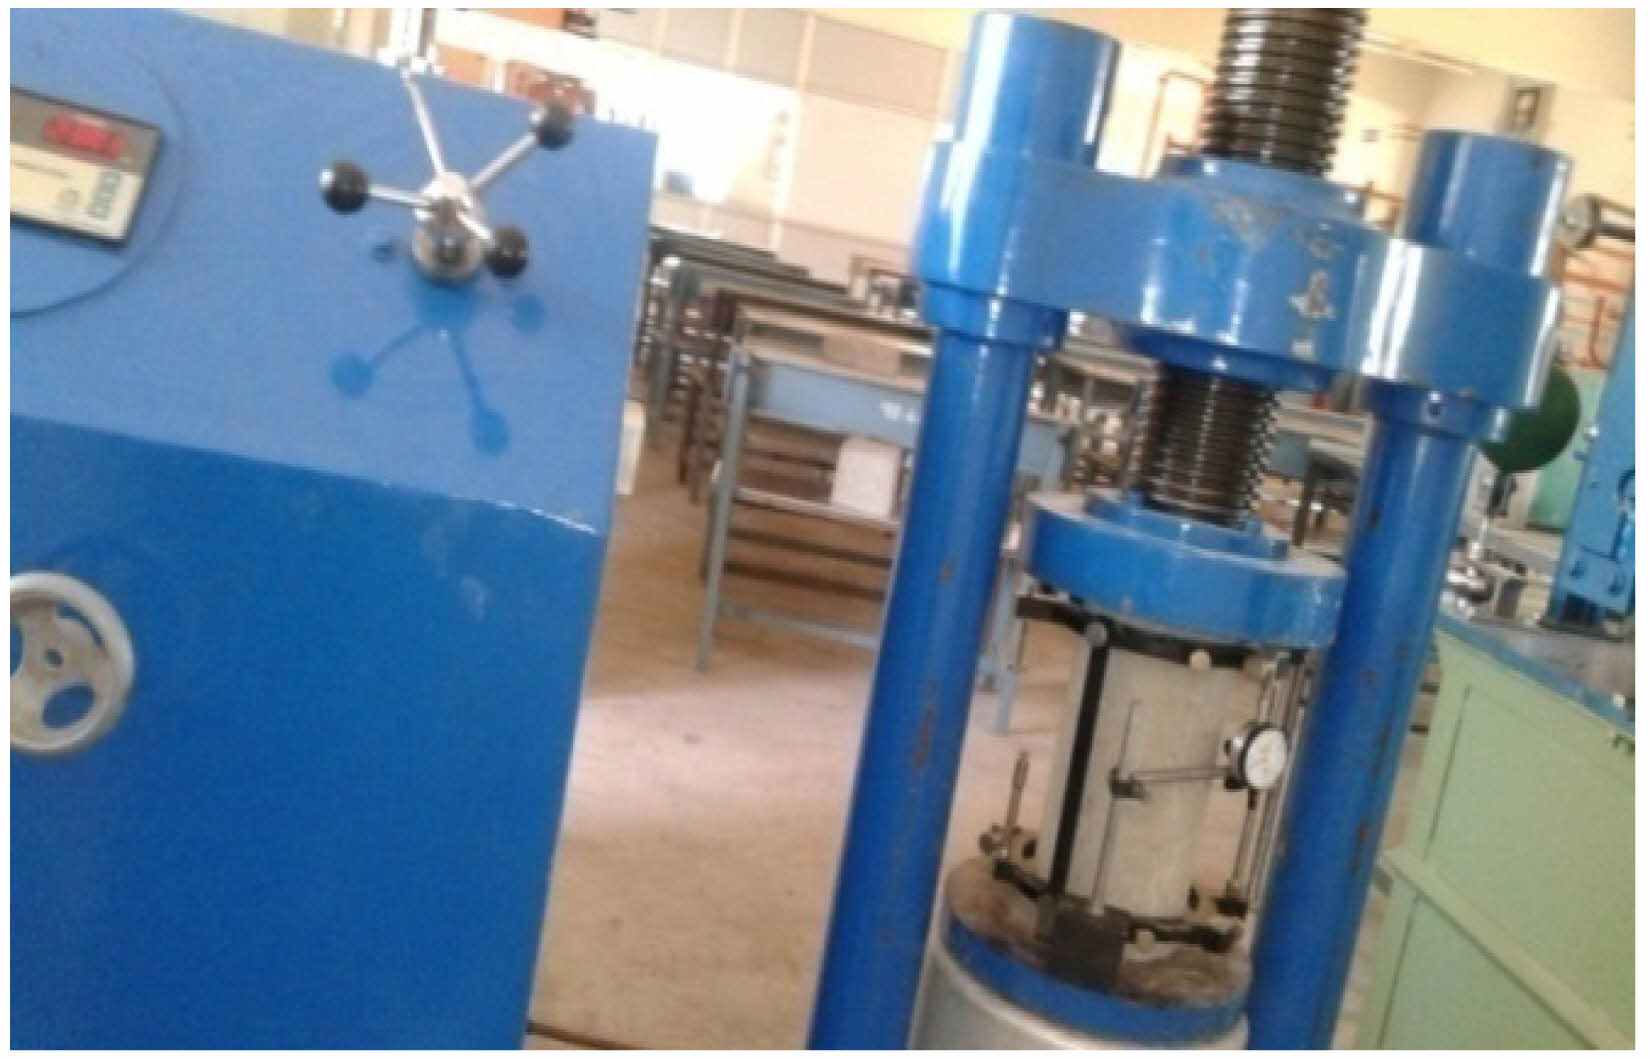
The specimens were loaded in axial Compression Testing Machine (CTM) of capacity 2000KN Longitudinal Compressometer consisting of two frames with tightening screws held by two spacer rods, one pivot rod with pivot screws, one tension spring with ball chain complete with one dial gauge 0.002 × 10 mm was used for testing. Two lines were marked at a distance of 200 mm apart [24]. The specimen was kept on a level surface and the compressometer was inserted from top with two spacer rods in tightened position. The specimen was then tightened with tightening screws mounted with top and bottom frames on the compressometer over the marking at 200 mm apart [24, 25]. Again, the loading was applied at the same rate until an average stress of (C+1.5) kg/sq.cm was reached and dial gauge reading was taken by maintaining the load for a minute. The load was again reduced gradually and the readings were taken at 1.5 kg/sq.cm. Once again, the load was applied and compressometer readings were taken at ten equal intervals up to an average stress of (C+1.5) kg/sq.cm [25]. The loading and unloading cycle were repeated until the overall strain difference between two consecutive trails was less than 5%. Fig. 1 indicates the Modulus of elasticity test set up.
Durability Investigation
Water Absorption in Capillarity
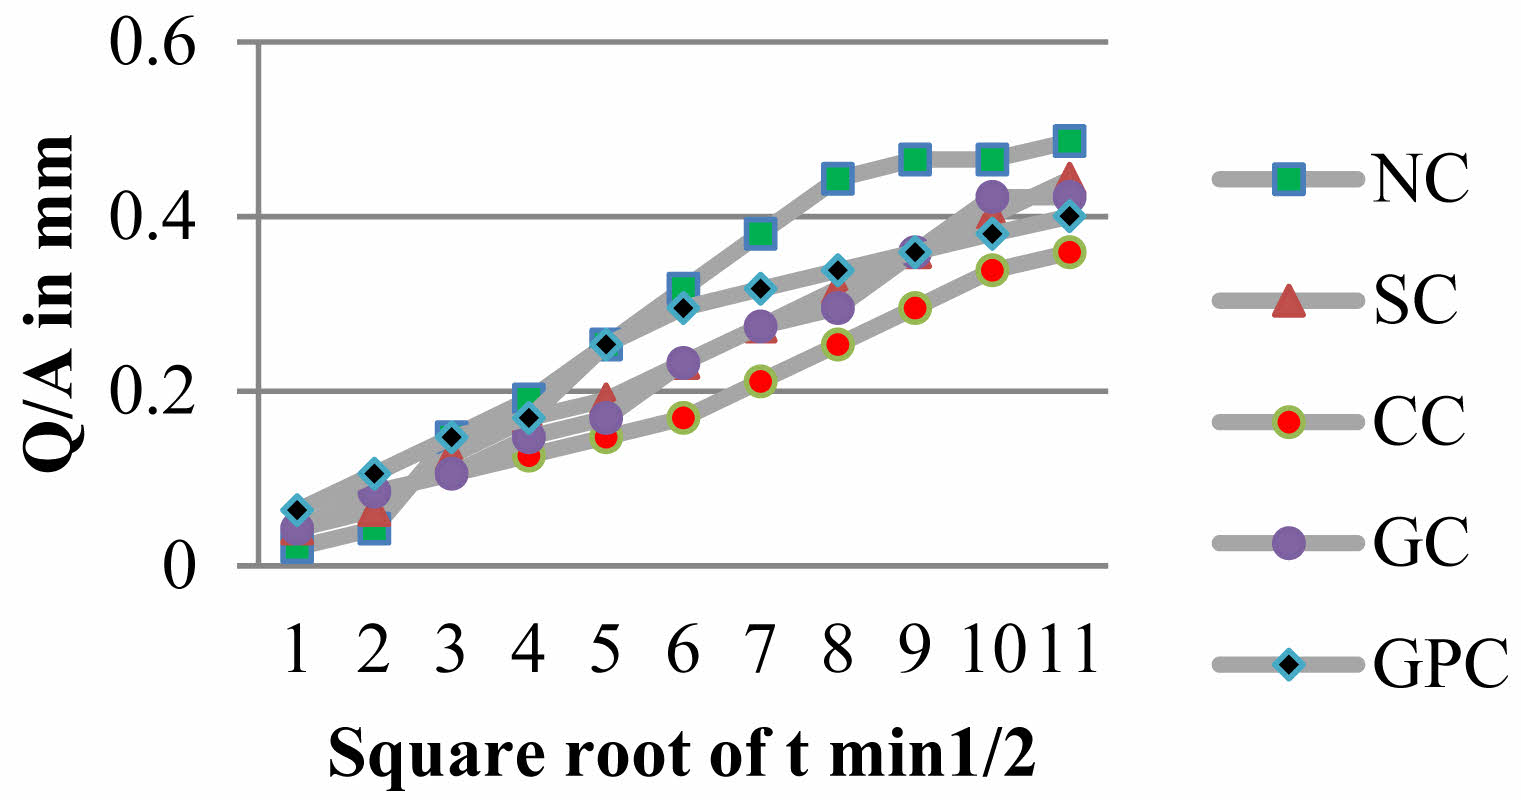
The measurement of rate of penetration of water into the pores of concrete by capillary suction is termed sorptivity [21]. This test determines the quality of concrete based on the surface pores of the concrete specimens. The cumulative volume of water penetrated per unit surface area of exposure was plotted against the square root of time of exposure, which results in a graph of straight line [22]. The slope of this straight line indicates the measure of the rate of movement of water through the capillary pores which is maintained at about 5 mm above the base of the specimens.
The lower parts of the sides of the specimen adjoining the inflow face were sealed with bituminous paint to preven absorption of water into the surface pores to achieve unidirectional flow [23]. At certain period, the mass of the specimens was measured using weighing balance, then the amount of water adsorbed was evaluated and normalized with respect to the cross-section area of the specimens exposed to the water at various times such as 1, 4, 9, 16, 25, 36, 49, 81, and 100 minutes [22, 23].
The sorpitivity Co-efficient (k) was obtained by using the equation,

Q = amount of water adsorbed (mm3)
A = cross-section of specimen that was in contact with water (mm2)
t = time in minutes
k = sorptivity coefficient of the specimen (mm/min1/2)
b = constant value
Fig. 2 Fig. 3 Fig. 4
|
Fig. 1 Modulus of Elasticity Specimen Test Setup. |
|
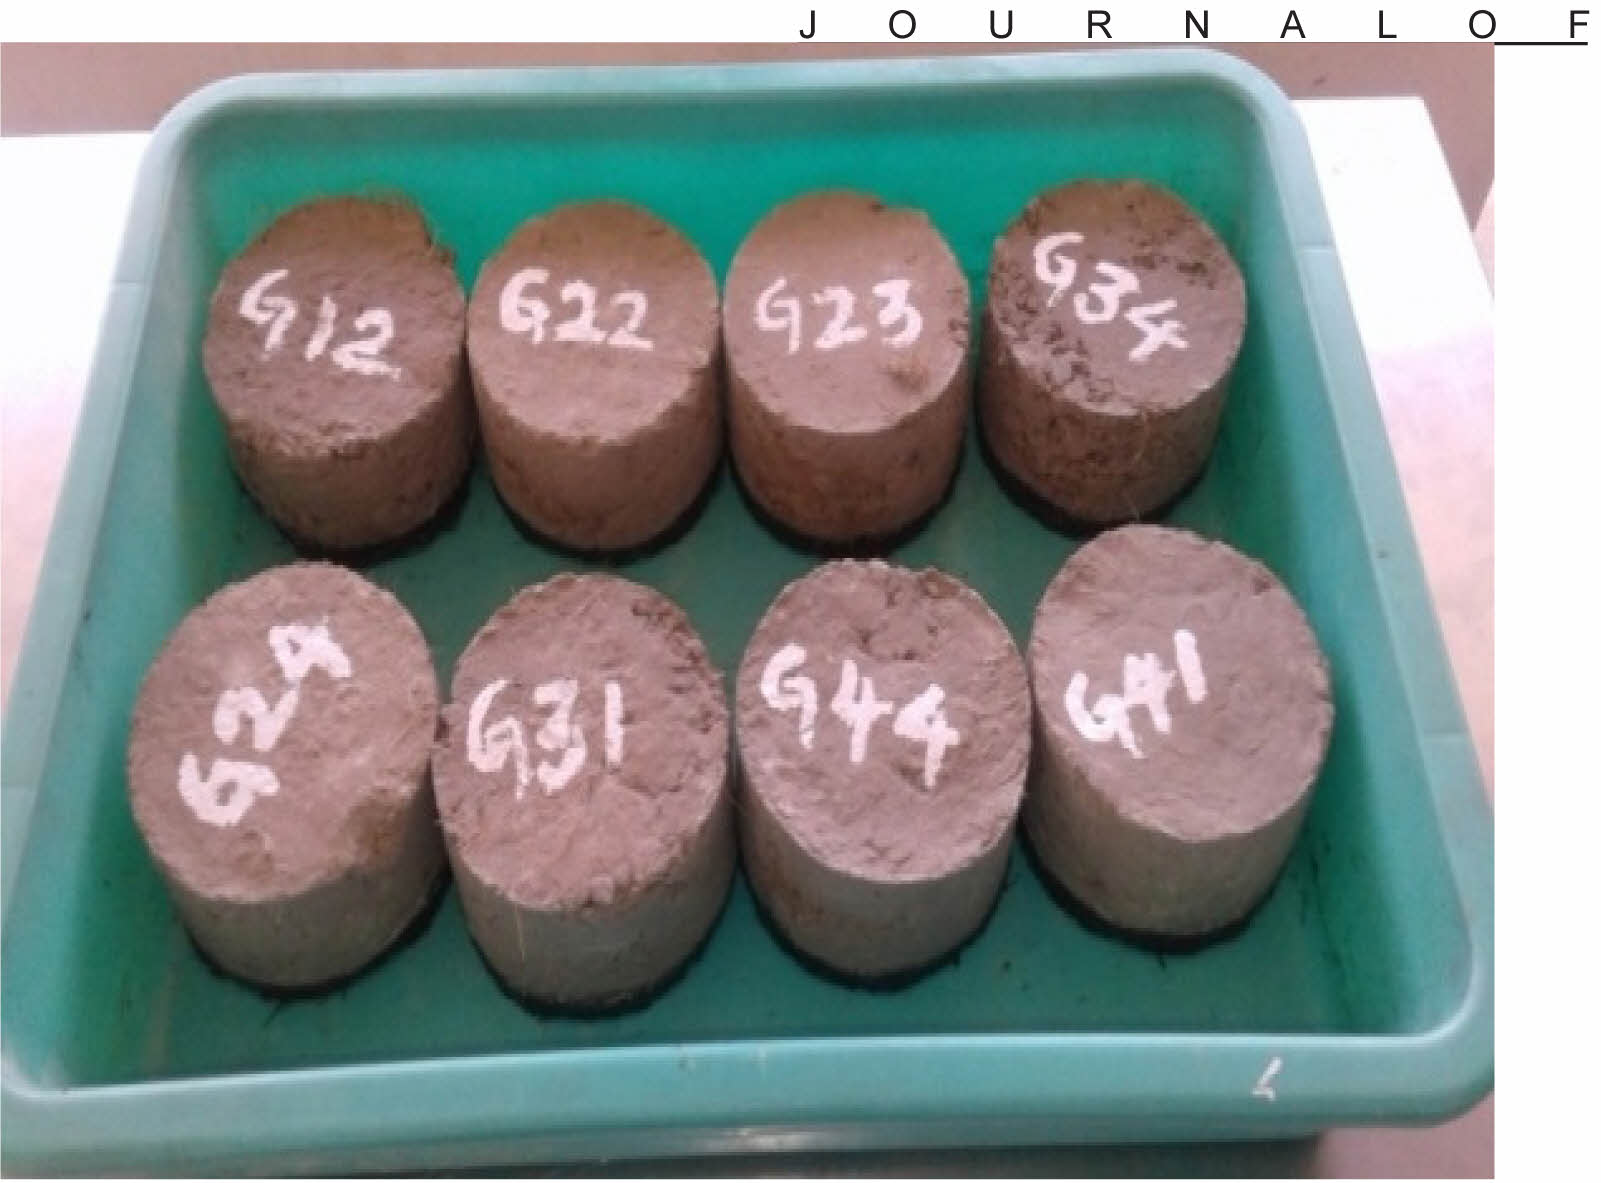
Fig. 2 Testing of Concrete Specimens for water absorption in Capillarity. |
|
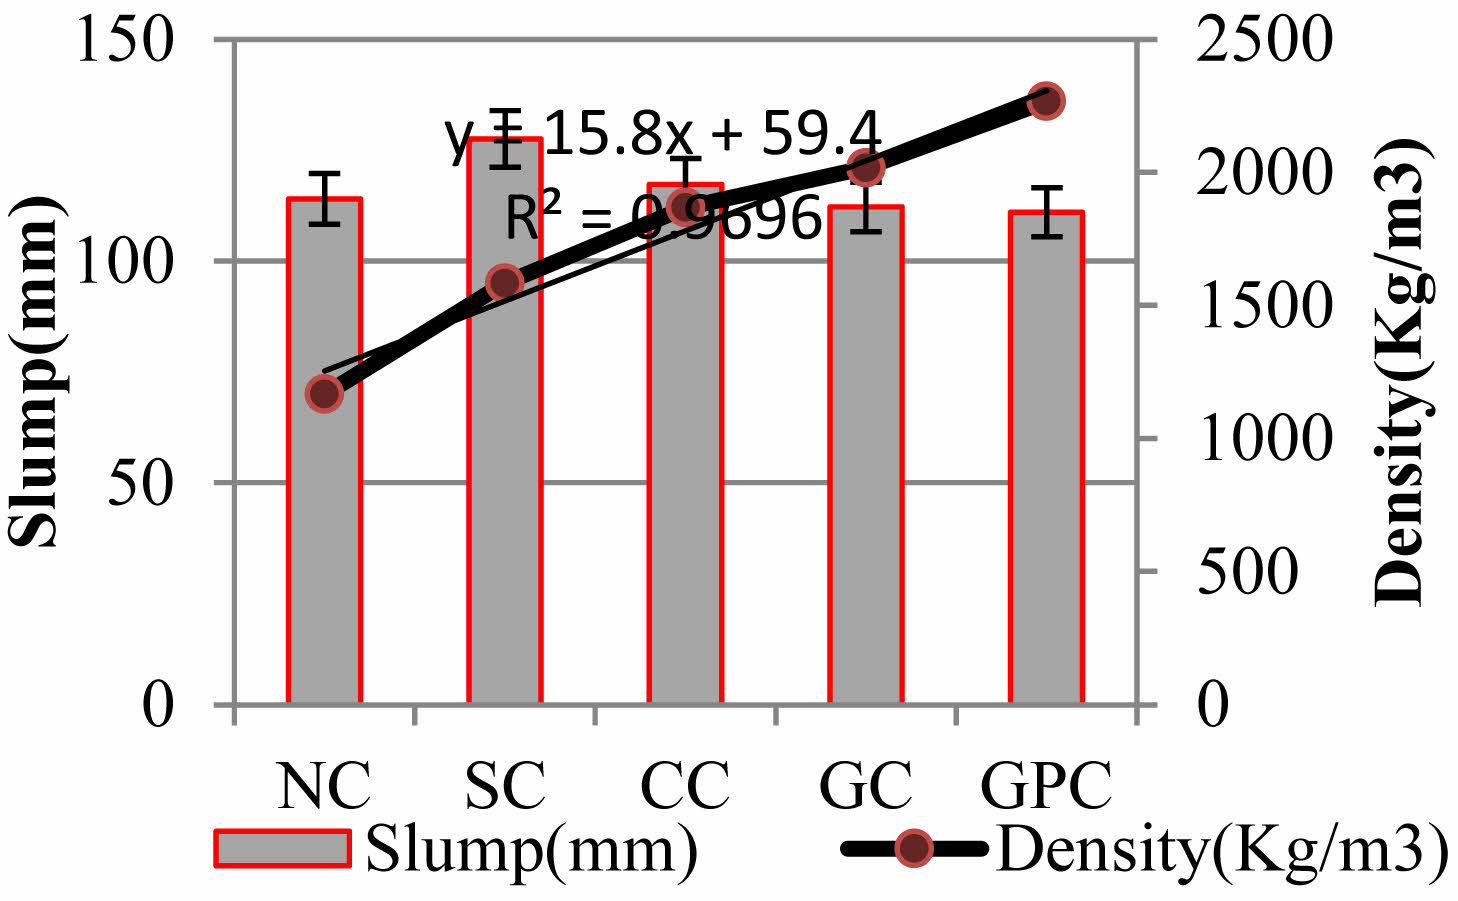
Fig. 3 Relation between Density and Slump of Concrete Specimens. |
|
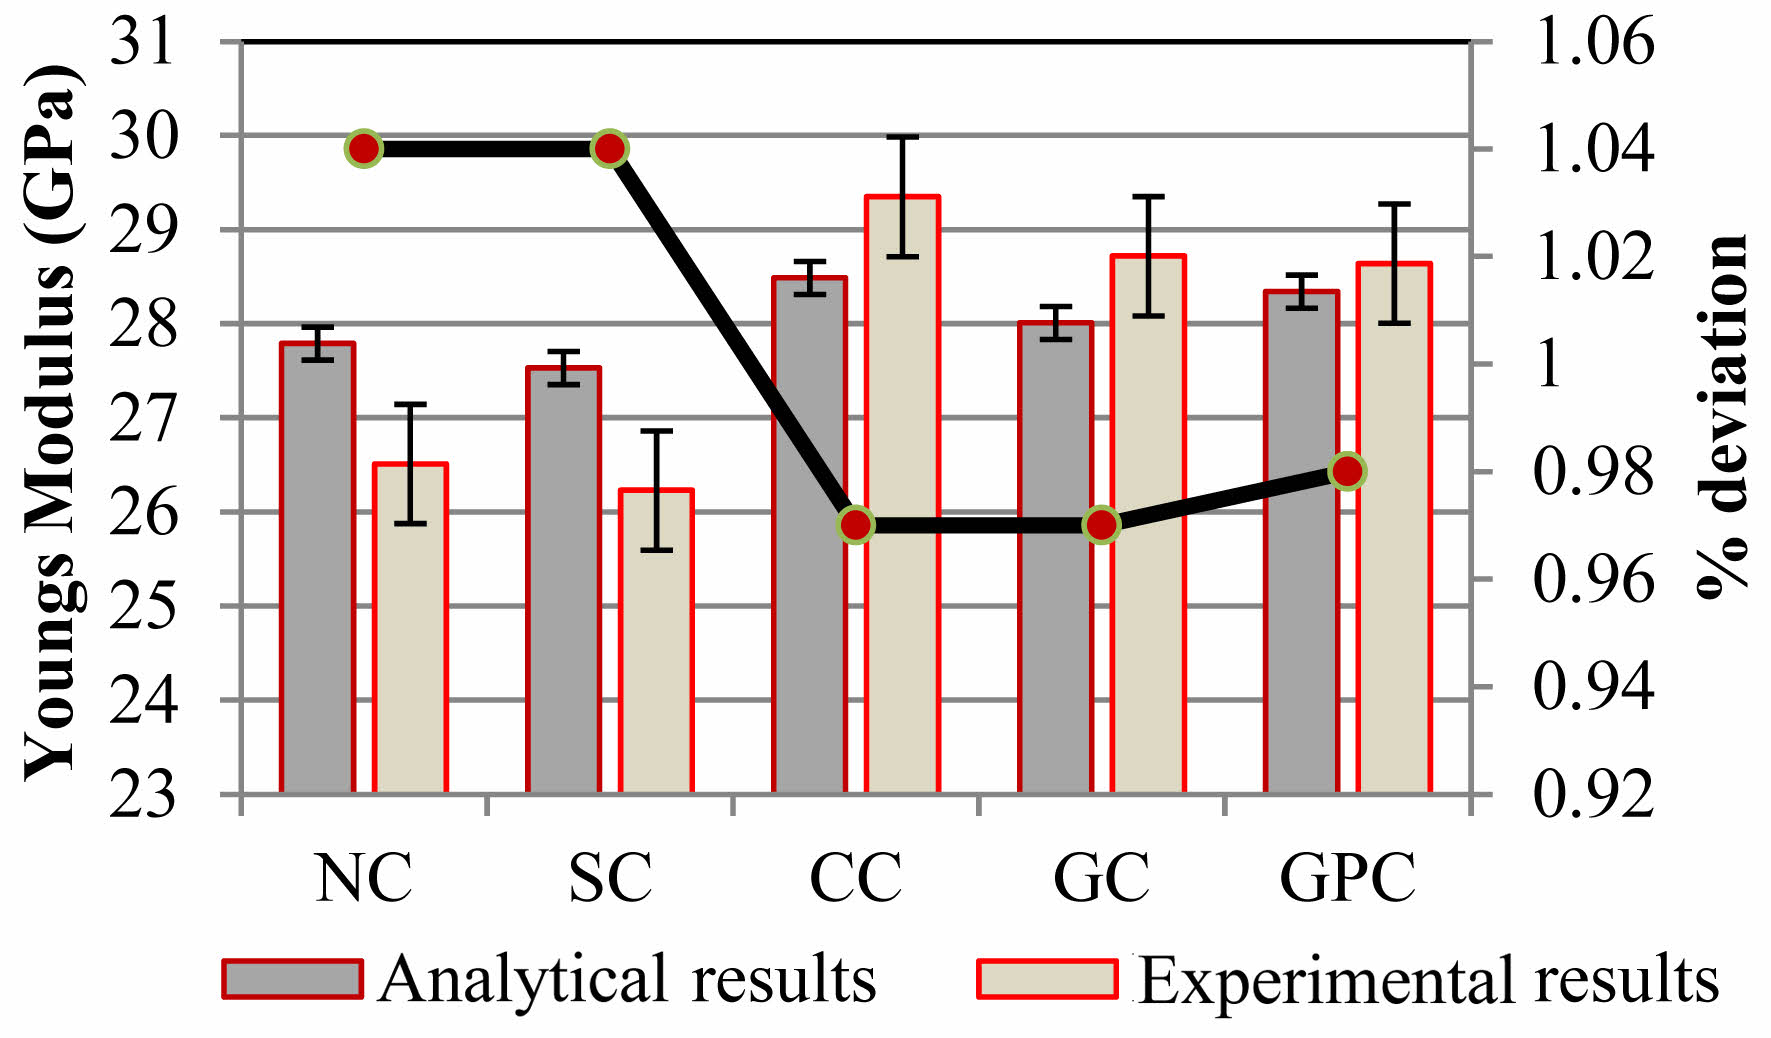
Fig. 4 Analytical and Experimental results of Young’s Modulus of Concrete Specimens. |
Microstructure Investigation
SEM
The SEM specimens to be tested were subjected to evaporativedrying by kept in vaccum chamber to eliminate all moisture content present inside the specimens. Since the availability of moisture content may intervene and disturb the signals of SEM and XRD [28].The samples were taken with size 1 cm × 1 cm and the samples were placed in a circular specimen mount. The specimens placed on the mould were surrounded with conductive carbon tape. The moulds were placed inside the SEM (Sample Specimen Mount Preparation) [29]. The specimens were subjected to electrical conductivity with different voltages and resolutions. The revealed images were studied and analysed. And inferences were drawn for all the mounted specimens [29, 30].
Fresh Concrete Results
Workability
As per the Indian Standard Code of Practice for Concrete Structures IS 456:2000, and IS10262: 2009, a slump of 100 to 150 mm is generally recommended for normal concrete [17-19]. Here quarry rock dust was added as fine aggregate and recycled coarse aggregate was included instead of coarse aggregate. And 1% sisal fibers were added into the mix. Hence slump of the cone gets decreased with 70 mm with w/c ratio 0.45. Thus slump gets reduced in additon of QRD and RCA. The slag concrete absorbs less water compared to normal concrete. The alkaline activator solution and the additional water added into the concrete increases the workability of concrete compared to normal concrete.Eventhough RCA and QRD absorbs more water in slag concrete the slump results with 95 mm. In composite concrete addition of slag percentage was reduced.Alkaline activator was added with 50%. The slump of this composite concrete was found to be 112 mm. In green concrete flyash and slag was mixed with 50% each and no clinkers were added. The mix was blended with 100% activator solution. The slump of the concret was found as 121 mm. And finally geopolymer concrete with 100% flyash and zero clinkers. The GPC was mixed with 100% activator solution and the slump was found to be 136 mm. When compared to normal concrete the slump of concrete was rated with increase in % of SC, CC, GC and GPC 35.71%, 60%, 72.85%, 94.28% respectively with respect to normal concrete.
Strength Results
Modulus of elasticity
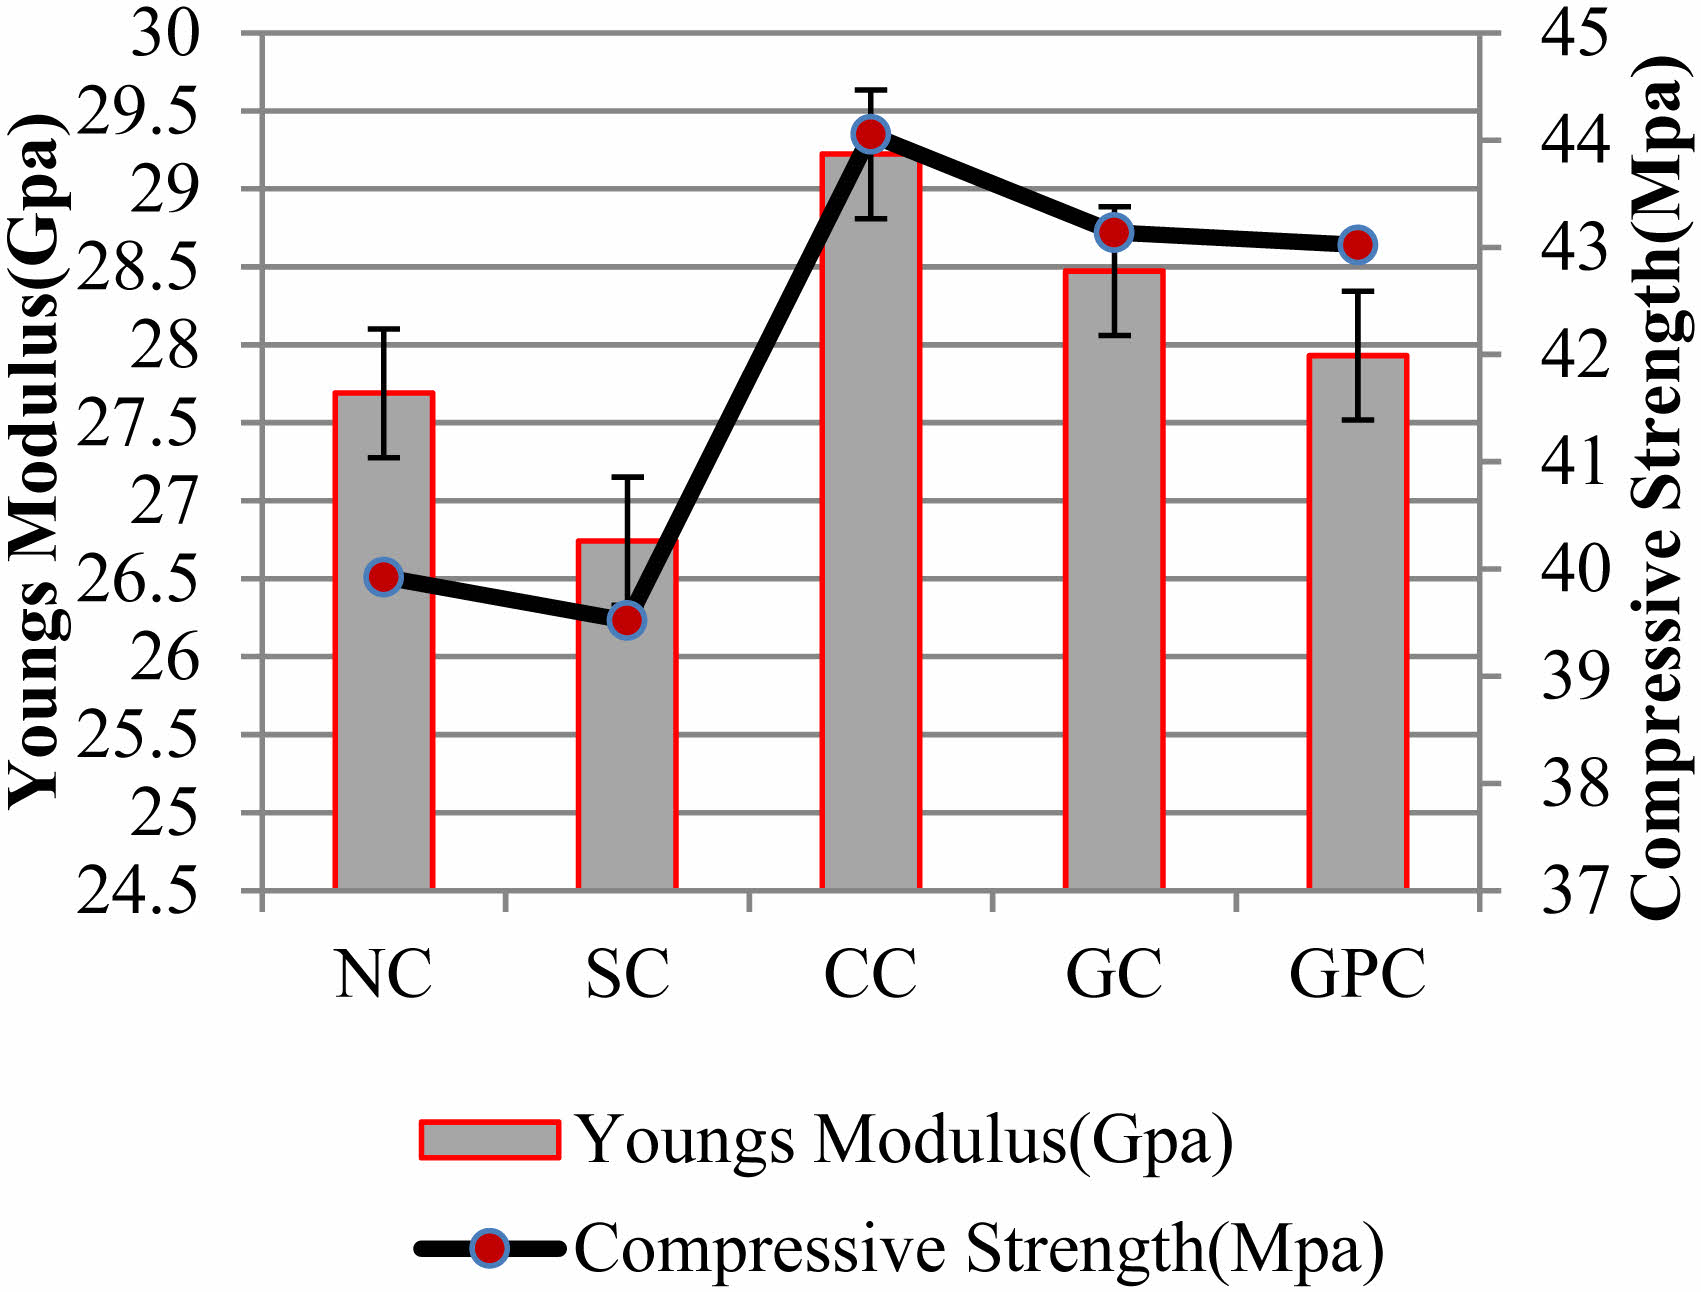
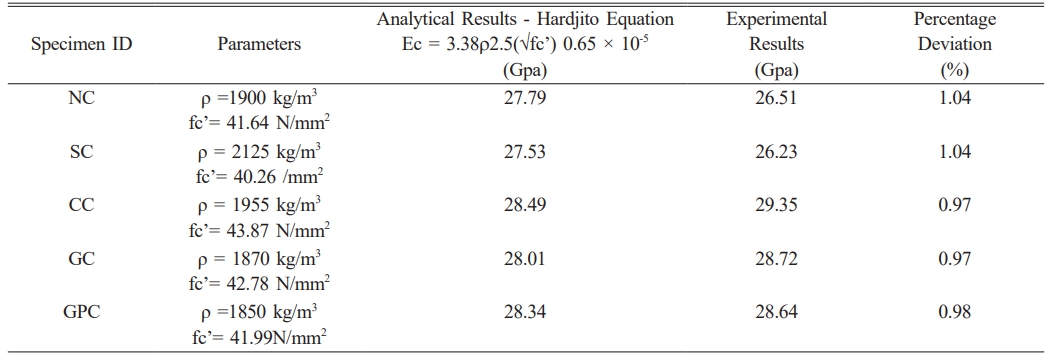
Table 5 illustrates the experimental and analytical test results of young’s modulus of concrete specimens. The test results shows that increase in compressive strength results with increase in young’s modulus of concrete specimens. But compared to density the influence of compressive strength as parameter affects the value of young’s modulus. Hardjito equation was used to evaluate the analytical results of concrete with compressive strength and density as parameters [24, 25]. Minimum percentage of deviation was found in both test results. Compared to normal and slag concrete, composite concrete, green concrete and geopolymer concrete shows less percentage of deviation in test results.
From test results it was found that the value of young’s modulus in composite concrete was high compared to all other specimens with 29.35 Gpa. Value of green concrete and geopolymer concrete was found to be 28.72 GPa and 28.64 Gpa respectively. Compared to normal concrete the value of young’s modulus of slag concrete was less which results with 26.23 Gpa. The value of normal concrete was 26.51 Gpa.
Fig. 5 represents the relation between young’s modulus and compressive strength. From the test results it was found that compressive strength is directly proportional to young’s modulus of concrete. When compressive strength of concrete gets reduced, the value of young’s modulus also gets reduced.
Durability Results
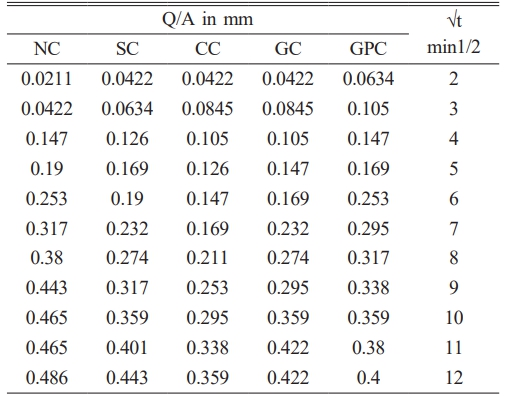
Water absorption in Capillarity
Table 6 represents thecomparison results of water absorption capacity of concrete specimens due to capillarity. The test result shows that normal concrete absorbs more water in capillarity compared to all other specimens. In this, slag concrete absorbs more water in capillarity compared to all other concrete specimens. In the time interval of 1, 2, 3, 4, 5, 6, 7, 8, 9, 10, 11, 12 mins, composite concrete absorbs less water compared to all other concrete specimens. Eventhough slag and QRD was added the water absorption capacity due to capillarity in all other concrete specimens gets reduced compared to normal concrete. Thus RCA, QRD, slag increases the water absorption percentage but the percentage gets reduced due to capillarity. Fig. 6 represents the water absorption percentage of all concrete specimens due to capillarity.
SEM Results
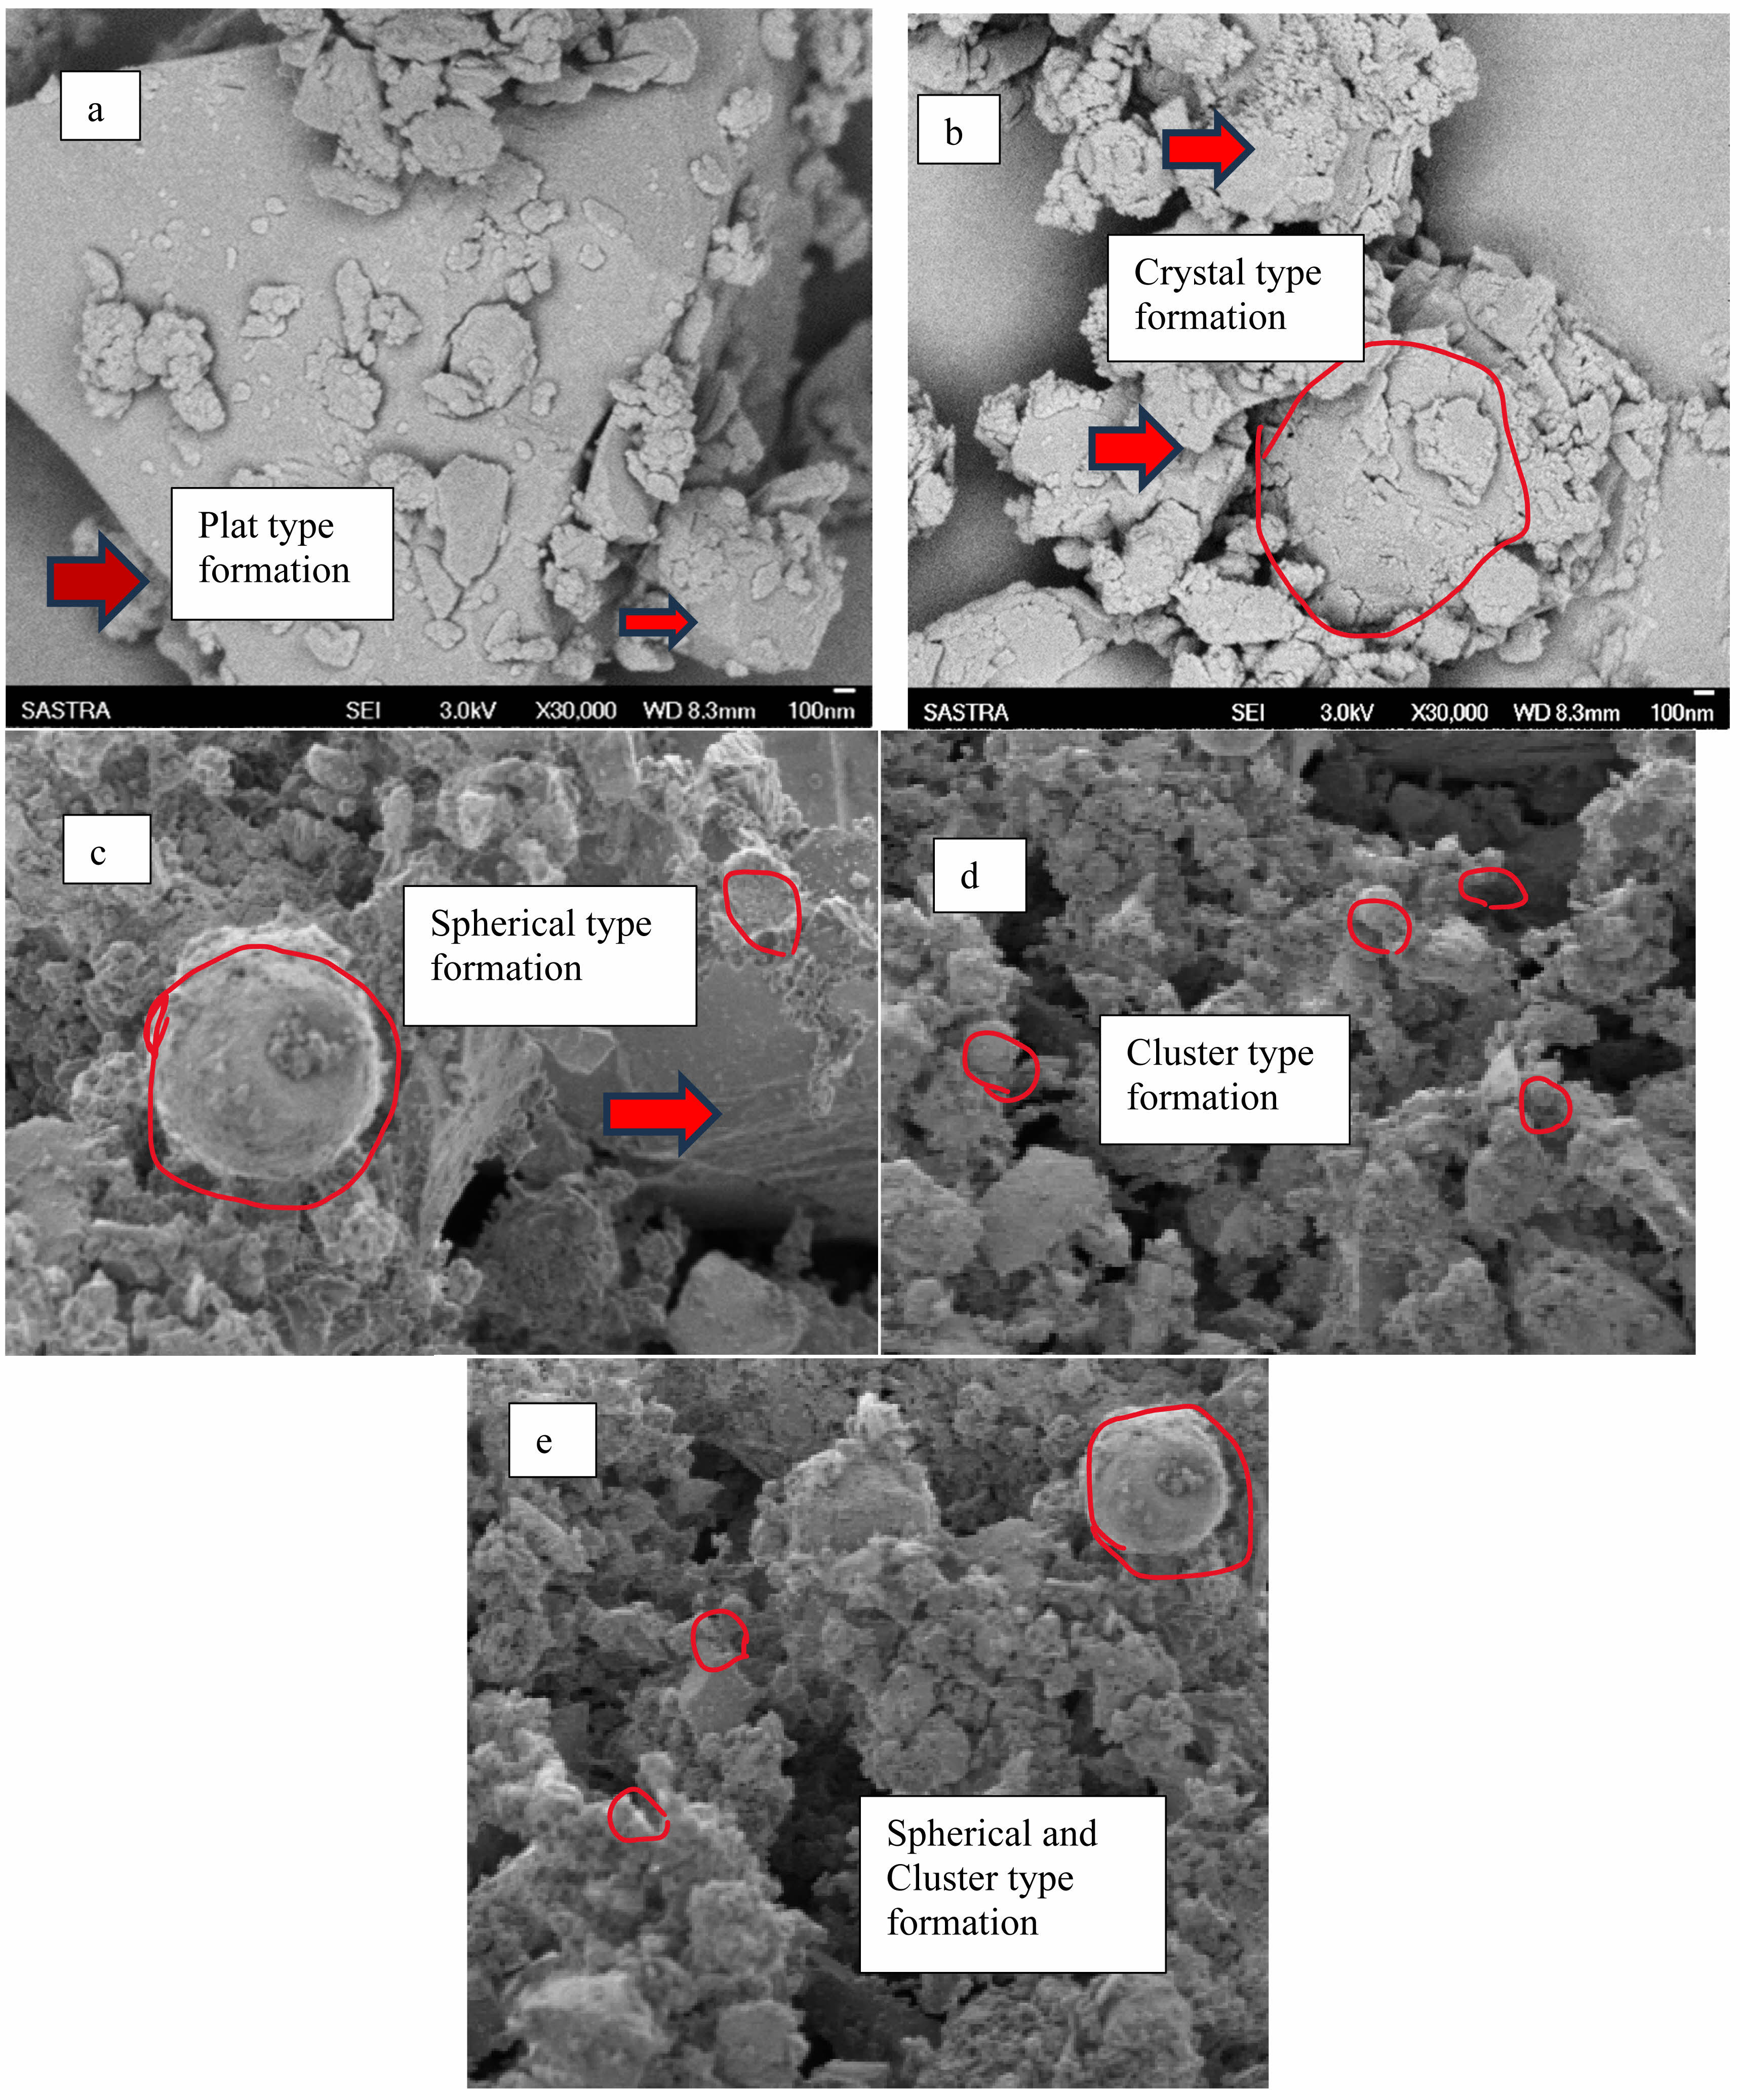
Through Scanning Electron Microscope (SEM) test it was found that the composition inside the Normal Concrete (NC) specimens were found to be compact, dense, thick and homogenous structure like a layer due to the formation of C-S-H gel with the effect of hydration process.
The composition of Slag Concrete (SC) specimens was found to be scattered and dispersed without any thickness in clustered shape; there was no homogeneity and formation of any layer as such in normal concrete specimens. Also, no bulge shape formation was found in slag concrete. Whereas in Composite Concrete (CC) macro size bulges were found due to the formation of Si-O-Al bonds with the effect of polymerization process and homogeneity layer was found due to hydration process of C-S-H gel. Many micro bulge shapes were found in green concrete (GC). No thickness of layer was found as such in normal concrete and composite concrete, due to absence of hydration process. In Geopolymer Concrete (GPC) bulges were found but less in size compared to composite concrete. No homogeneity layer was found in concrete specimens. Microstructure of geopolymer concrete was found to be dispersed and clustered. Fig. 7
|
Fig. 5 Relation between Young’s Modulus and Compressive Strength of Concrete Specimens. |
|
Fig. 6 Water absorption in Capillarity of Concrete Specimens. |
|
Fig. 7 Concrete Specimens observed through SEM. (a) Normal Concrete (b) Slag Concrete (c) Composite Concrete (d) Green Concrete (e) Geopolymer Concrete. |
|
Table 5 Comparison of analytical and experimental test results of Young’s Modulus. |
|
Table 6 Comparison of water absorption capacity of concrete specimens in capillarity. |
The slag concrete absorbs less water compared to normal concrete. Increase in percentage of slag reduces the strength and durability properties of concrete.Adding 70% of slag in concrete reduces the strength of concrete.And also reduces the workability properties of fresh concrete.Thus Slag concrete (SC) shows less workability and strength properties.Whereas addition of 35% of slag and 35% of flyash in Composite concrete (CC) increases the slump of concrete and strength of concrete. Also, slump gets reduced in additon of QRD and RCA.Increase in compressive strength increase with modulus of elasticity values.Thus Composite concrete (CC) results with high value of young’s modulus values.
Hardjito equation was used to evaluate the analytical results of concrete. Analytical and experimental values were compared, it was found that percentage deviation was less in all concrete specimens compared to Normal concrete (NC) and Slag concrete (SC).
The authors wish to acknowledge the Department of Civil Engineering, Kongunadu College of Engineering and Technology, Thottiam, Tamil Nadu for the facility and support extended for the research work.
- 1. S. Sridhar, S. Nandhakumar, M. Nallusamy, and R. Maguteeswaran, J. Ceram. Process. Res. 23[4] (2022) 498-502.
-

- 2. H. Kasagani and C. Rao, Cem.Wapno, Beton. 21 (2016) 361-372.
- 3. H.R. Pakravan, M. Latifi, and M. Jamshidi, J. Ind. Text. 45[5] (2016) 637-651.
-
- 4. P. Loganathan, R. Mohanraj, S. Senthilkumar, and K. Yuvaraj, Rev. Constr. 21[3] (2022) 678-691.
-
- 5. M. Kunieda and K. Rokugo, J. Adv. Concr. Technol. 4[1] (2006) 19-33.
-
- 6. T.H. Ahn and T. Kishi, J. Ceram. Process. Res. 16[1] 641-652.
- 7. M. Shivaperumal, R. Thirumalai, S. Kannan, and Y.K.S.S. Rao, J. Ceram. Process. Res. 23[3] (2022) 404-408.
-
- 8. A. Chitamber Ganesh, and Dr. M. Muthu Kannan, Int. Journal of Eng. & Tech. 7[4.5] (2018) 696-699.
- 9. Salmabanu Luhara, Ismail Luhar, and Rishi Gupta, Eur. Jour. of Env. and Civil Eng. Volume 26 [10] (2022) 4297-4345.
-
- 10. Khoa Tan Nguyen Namshik Ahn, Tuan, and Kihak Lee, Cons. and Buil. Mat. 106[1] (2016) 65-77.
-
- 11. Kamal Kishore and Nakul Gupta, Mat. Today Proc. 44[1] (2021) 58-62.
-
- 12. S. Kavipriya, S. Gowtham, and S. Kannan, Int. Jour.of Eng. and Adv. Technol. 9[6] (2020) 1-5.
-
- 13. S. Kavipriya, Int. Jour. of Rec. Technol. and Eng. 8[4] (2019) 1-6.
- 14. Faiz Uddin Ahmed Shaikh Inter. Journal of Sust. Built Env. 5[2] (2016) 277-287.
-
- 15. Blessen Skariah, Thomas, Jian Yang, and A. Bathiudeen, Cleaner Materials [3] (2022) 100195.
- 16. Sarah Sameer Hussein, and Prof. Dr. Nada Mahdi Fawzi, Jour.of Engg.,10 [27] (2021) 50-67.
-
- 17. S. Kavipriya, C.G. Deepanraj, S. Dinesh, N. Prakash. Lingeshwaran, and S. Ramkumar, Mat. Today Proc. 47[15] (2021) 5503-5507.
-
- 18. Ramamohana Reddy Bellum, Karthikeyan Muniraj, Sri Rama Chand Madduru Materialia [10] (2020) 100659.
-
- 19. E. Hewayde, M. Nehdi, E. Allouche, and G. Nakhla, Mag. of Conc. Res. 58[5] (2006) 321-331.
-
- 20. T. Vijaya Gowri, P. Sravana, and P. Srinivasa Rao, Int. Jour. of Res. in Eng. and Technol. 3[4] (2013) 227-238.
- 21. Sasi Rekha M. and Sumathy S.R., Global NEST Journal [2] 265-274.
- 22. P. Ashveenkumar, M. Preethi, and P. Prashanth, Int. Jour. of Eng. Science and Technol. 13[4] (2021) 57-64.
-
- 23. Bhavik kumar B. Patel, and Dr. Jayesh Kumar Pitroda, Inter. Jour. of Const. Res. in Civil Eng. 3[4] (2017) 121-131.
- 24. A. Chithambar Ganesh and Dr. M. Muthukannan, Inter. Jour. of Eng. & Technol. 7[4.5] (2018) 696-699.
-
- 25. María Eugenia Parron-Rubio, Francisca Perez-Garcia, Antonio Gonzalez-Herrera, Miguel José Oliveira, and Maria Dolores Rubio-Cintas, Materials 12[18] (2019) 2845.
-
- 26. Dr. N. Subramanian Concreting (2021) 1-7.
- 27. T. Noguchi, F. Tomosawa, K.M. Nemati, B.M. Chiaia, and A.P. Fantilli, ACI Structural Journal 106[5] (2009) 690-696.
- 28. B. Vakhshouri and S. Nejadi, Front. of Struct. and Civil Eng. 13 (2019) 38-48.
-
- 29. X.S. Shi, F.G. Collins, X.L. Zhao, and Q.Y. Wang, Jour. of Hazard. Mat. 237-238[30] (2012) 20-29.
-
- 30. M. Etxeberria, E. Vázquez, and A. Marí, Magazine of Concrete Research 58[10] (2006) 683-690.
-
- 31. D. Mythilia, R. Murugesanb, and S. Christian Johnson, J. Ceram. Process. Res. 25[4] (2024) 521-528.
-
- 32. Chi Zhang, J. Ceram. Process. Res. 25[4] (2024) 572-588.
-
- 33. P. Sudhaa, S. Ramesh, R. Jagadeesan, and K. Yuvaraj, J. Ceram. Process. Res. 25[1] (2024) 1-15.
-
- 34. Aurawan Rittidecha and Aekkasit Suthapintu, J. Ceram. Process. Res. 25[1] (2024) 22-27.
-
- 35. A. Manikandana and G.B. Bhaskar, J. Ceram. Process. Res. 25[2] (2024) 159-167.
-
 This Article
-
2025; 26(1): 1-8
Published on Feb 28, 2025
- 10.36410/jcpr.2025.26.1.1
- Received on Jun 12, 2024
- Revised on Oct 16, 2024
- Accepted on Dec 17, 2024
Services
- Abstract
introduction
materials and mix design
methodology
results and discussion
conclusions
- Acknowledgements
- References
- Full Text PDF
Shared
Correspondence to
- S. Kavipriya
-
Department of Civil Engineering, Kongunadu College of Engineering and Technology, Trichy, Tamil Nadu, India
Tel : 9942181201 Fax: 9942181201 - E-mail: kavipriyacivil2001@gmail.com
Clean-Energy Research Institute(CRI), Hanyang University, 222, Wangsimni-ro, Seongdong-gu, Seoul, 04763, Korea
E-mail: jcpr@hanyang.ac.kr