


- Investigation of nanostructures LiZnCu ferrite by auto combustion method
Saad Shakir Husseina,b and Emad K. Al-Shakarchia,*
aAl-Nahrain University, College of Science, Physics Department, Baghdad, Iraq
bAl-kitab University, College of Medical Technology, X-ray and Sonar Department, Kirkuk, IraqThis article is an open access article distributed under the terms of the Creative Commons Attribution Non-Commercial License (http://creativecommons.org/licenses/by-nc/4.0) which permits unrestricted non-commercial use, distribution, and reproduction in any medium, provided the original work is properly cited.
A nanostructure of Lithium-Zinc-Copper ferrite (LiZnCu-Ferrite) prepared experimentally by the auto-combustion method depends on different parameters. The auto-combustion method was operated at temperature (160 °C), which is suitable to prepare the required nanostructure ferrite phase. The dependent composition was [Li0.5-xZnxCuxFe2.5-xO4 at (x=0, 0.05, 0.15, 0.25, 0.35, and 0.45)]. A pre-firing at temperature (650 °C) was applied during the calcination process that was suitable to remove unwanted products. The sintering at temperature (800 °C) was suitable for a pelletized shape of ferrite samples. The X-ray diffraction (XRD) pattern showed a spinel structure of ferrite phase produced for all samples under study with the lattice constant in the range (8.345-8.368 Å) as a function of different (x). The crystallite size was in the range (18.41-30.27 nm) calculated by the Scherrer method. The transmission electron microscope (TEM) showed a production of nanorod in the size range (10-45 nm), and nanoparticles in the size range (10-40 nm). There is a coincidence between the results of XRD and TEM analysis. On the other hand, the scanning electron microscope (SEM) showed the surface morphology and the nature of grain size, which is a sign on the presence of nanostructure. It was agreed with the XRD analysis prepared in ferromagnetic materials.
Keywords: Auto-combustion method, Spinel structure, Nanostructure ferrites, Scherrer method.
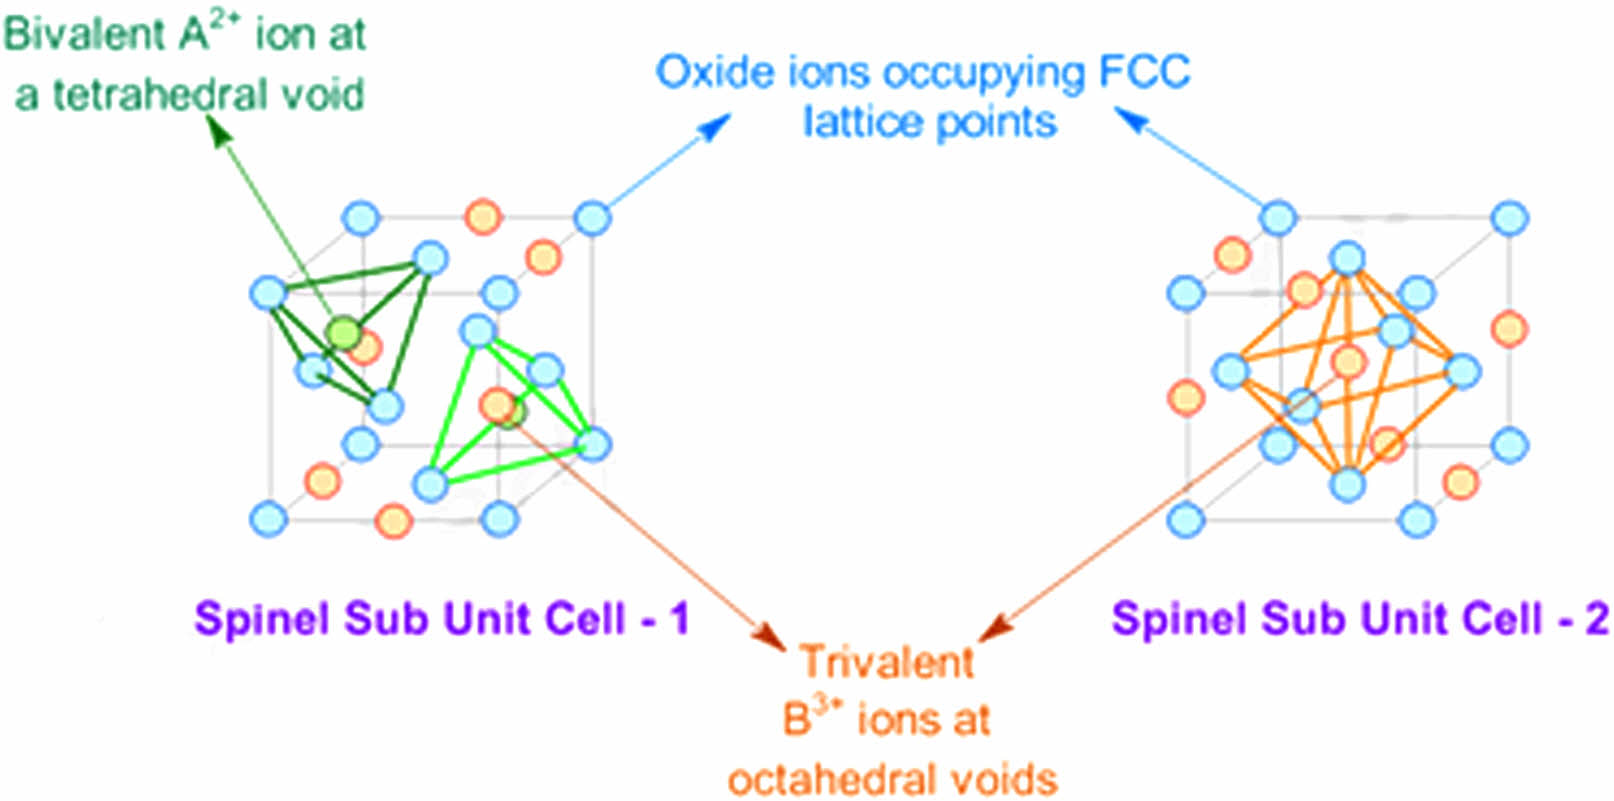
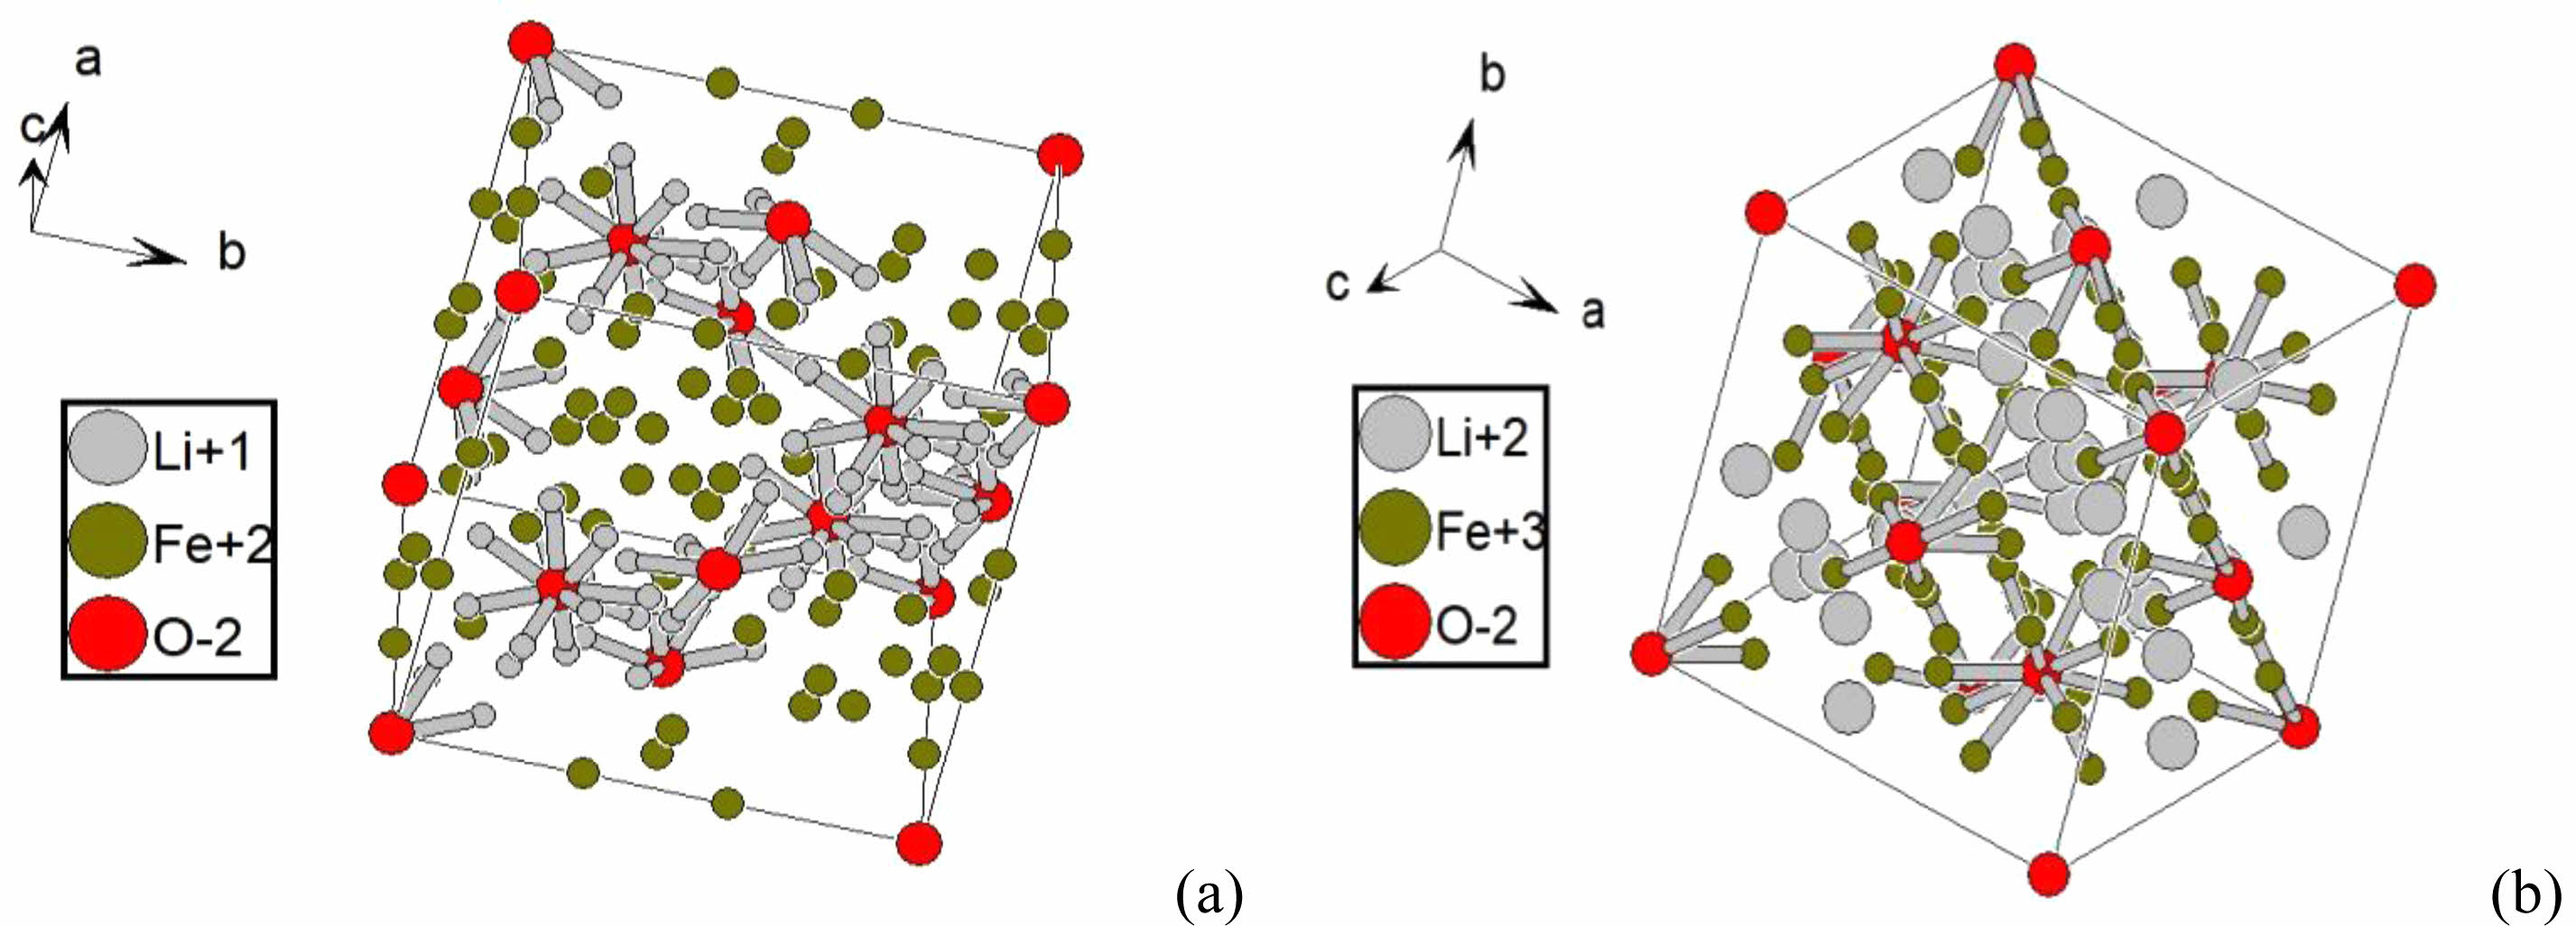
A ferrite is a useful magnetic material in different applications, such as radio frequency and microwave frequency. It can be used in transformers, inductors, antenna rods, memory chips, etc. The Ni, Zn, or Mn ferrites applied in transformer or electromagnetic cores are related to a low coercivity producing soft ferrites. The low losses at high frequencies are a reason to apply in the core of switched-mode power supply (SMPS) and RF transformers and inductors. The spinel ferrites are a distinct material that possesses both ferrimagnetic and semiconductor characteristics, hence qualifying as magnetic semiconductors [1]. The materials mentioned above have been widely used in various applications, such as recording heads, antenna shafts, loading coils, microwave devices, and core materials for power transformers in electronics and telecommunications [2-4]. Nano ferrites exhibit exceptional electrical and magnetic characteristics that distinguish them from materials with microstructures. These unique properties make them high suitable for integration into modern technologies and enable the development of innovative applications, including but not limited to ferro fluids [4], delivery of magnetic estate [5], high-density information storage [6], photo catalysis [7], and sensors of gas [8]. The spinel ferrite structure is mentioned in Fig. 1, it was describing a cubic close-packed structure of oxygen atoms, which 32 oxygen ions occupied a unit cell. The structure has two magnetic structures represented by tetrahedral and octahedral, with 64 positions of A-site and 32 positions of B-site respectively. The electrical neutrality of ferrite is related to 8 tetrahedral and 16 octahedral sites within the lattice. They are occupied by divalent or trivalent ions, so the unit cell contains eight formula AB2O4 units.
The difference between tetrahedral and octahedral is related to the distribution of divalent and trivalent Fe ions within a spinel structure. It can be defined by the formula (G1-αFeα)tet [GαFe2-α]oct O4, where G represents a divalent cation and where α represents the inversion degree and takes the value (0 < α < 1) [10]. The usual spinel structure with (α=1) has A-sites filled by divalent cations. In contrast, B-sites by trivalent cations, as indicated in Fig. 1. The inverse spinel structure with α = 0, B-sites will be occupied by divalent cations. The trivalent cations are distributed across A and B sites. The mixed spinel structure with (α=0-1), divalent and trivalent ions are filling a tetrahedral and octahedral sub-lattice positions [11]. The prior investigations on spinel nanostructure ferrite have been applied to several chemical processes. The most prominent techniques synthesis includes co-precipitation [12], sol-gel [13], microemulsion [14], hydrothermal [15], spray pyrolysis [16], reverse micelle [17], precursor [18], ceramic method [19], etc. A sol-gel auto-combustion method is a combination of two processes sol-gel and combustion methods, it has a great potential in preparation spinel ferrite nanomaterials [20]. The benefit of sol-gel combustion method used to increase the intensity of nanosized spinel ferrite powders. It was employed for the manufacture of more than 20 distinct spinel ferrite compounds like GFe2O4, where (G=Li, Zn, Cu, Mg, Mn, Cd, Ni, and Co) ions [21-33]. Recently, this method was applied to produce a spinel ferrite in 1D, and 2D nanostructures [34, 35]. They are beneficial in electronic products [36], biological applications [37], high-density magnetic [38], radar-absorbing materials [39], and magnetoelectric applications [40]. In this research, the sol-gel auto-combustion method was applied to prepare a ferrite compound like Li0.5-xZnxCuxFe2.5-xO4 at (x=0, 0.05, 0.15, 0.25, 0.35, and 0.45) with different conditions. The substation is regarding Li, and Fe ions, and studied the structural behavior.
|
Fig. 1 Indicate the spinel structure natural ferrite [9]. |
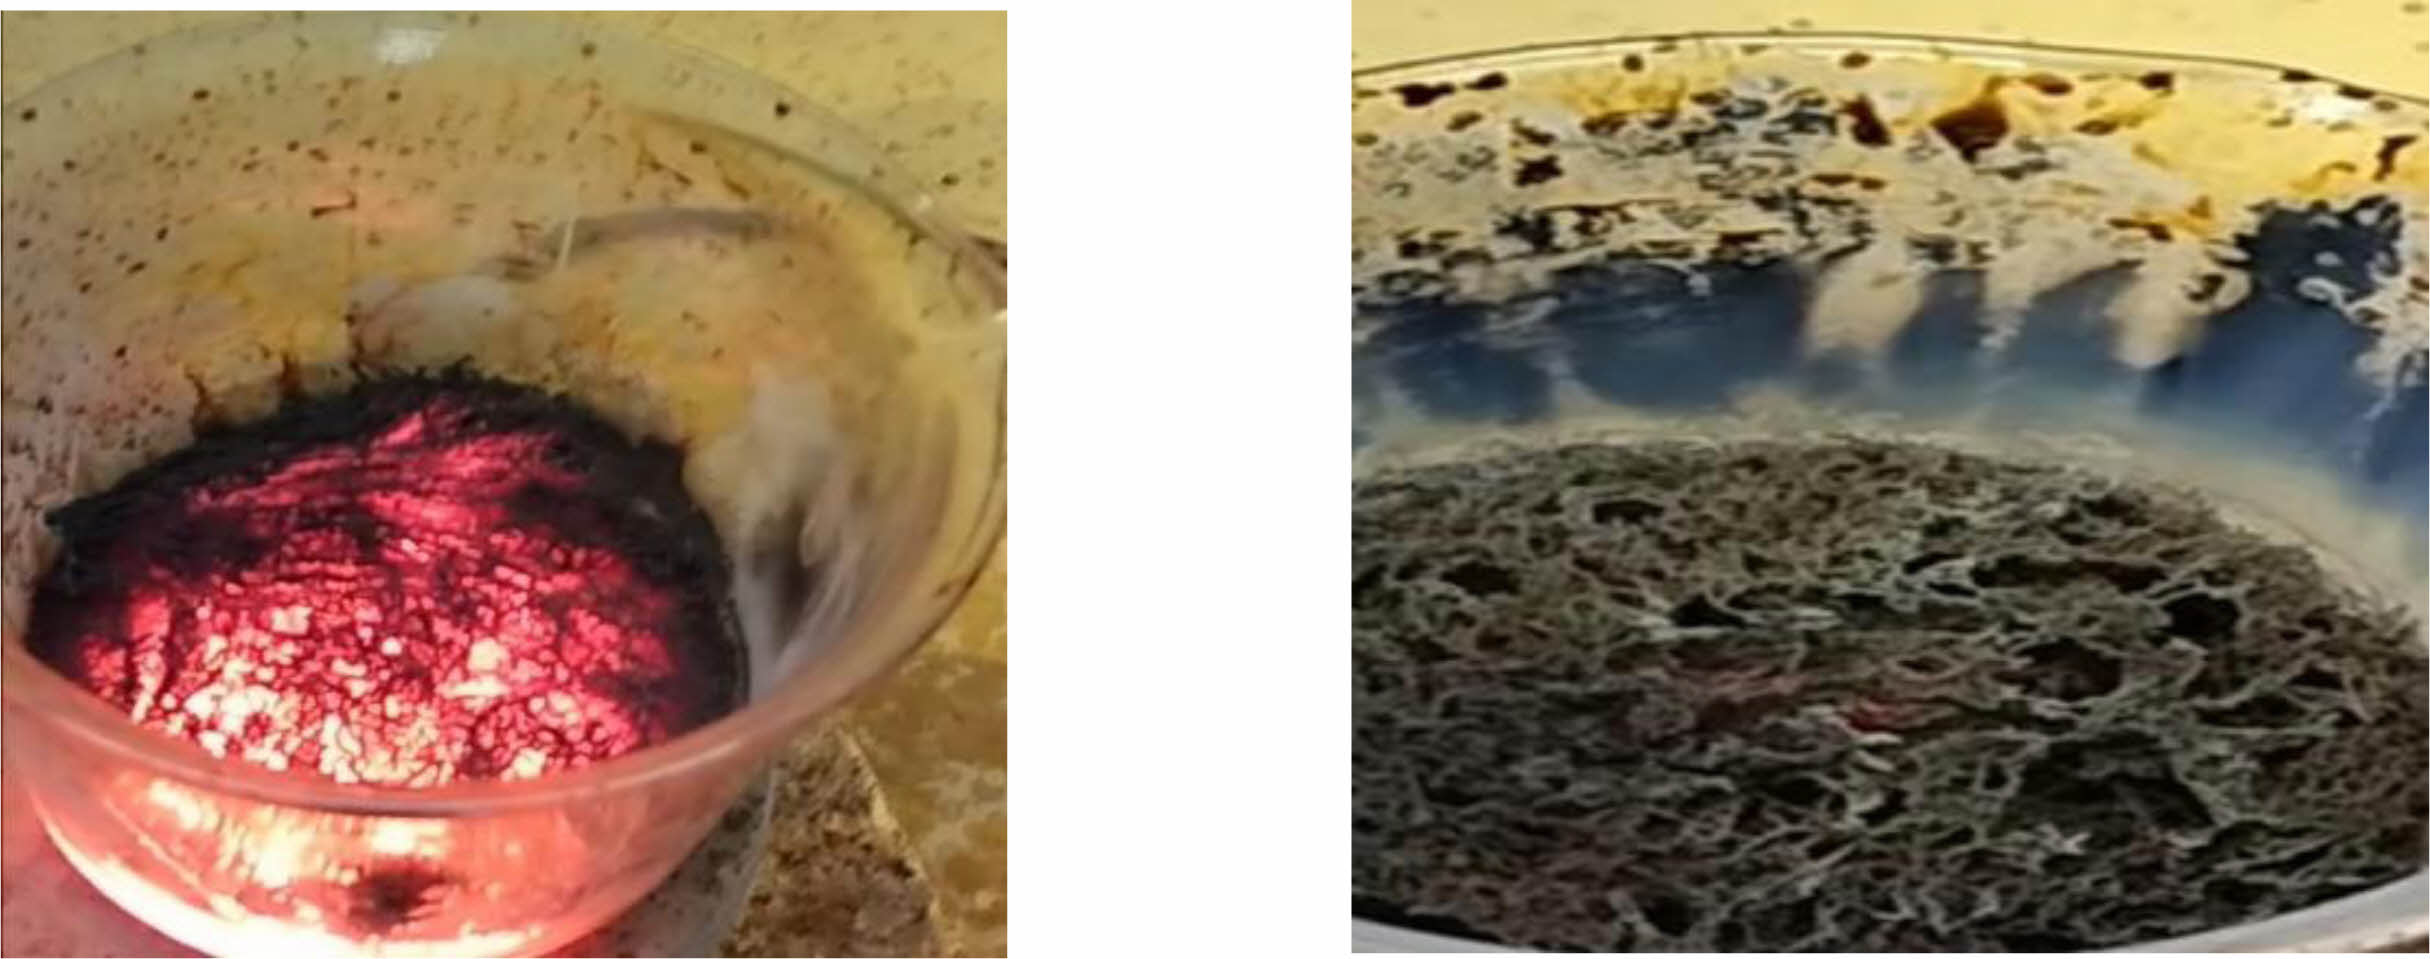
The sol-gel auto-combustion process entails xerogel exothermic and self-sustaining thermally-induced anionic redox reaction. This xerogel is derived from aqueous solution containing a necessary metal salts (the oxidizer) and an organic complexant (the reductant). The result of this reaction is formation of spinel ferrite [41]. Ferrites having the general formula Li0.5-xZnxCuxFe2.5-xO4 (x=0-0.45), they prepared at temperature (160 °C) by sol-gel auto-combustion technique. The samples are prepared using following pure compounds Li(NO3), Zn(NO3)2∙6H2O, Cu(NO3)2∙3H2O, and Fe(NO3)3∙9H2O as starting materials. A citric acid (C6H8O7∙H2O) used as a chelating agent. The molar ratio of nitrate to citric acid must be taken (1:3) [42]. The stoichiometric ratio of reagents are necessary to produce the ferrite phase. The valences of the reacting elements must satisfy the relation, and the ratio of oxidizer (N) to the fuel (U) must be equal (1) [43, 44]. They were mixed in a beaker with citric acid of (100 ml) distilled water on a magnetic stirrer for one hour to obtain homogeneity. During the stirring, ammonia solution NH3∙H2O was slowly added to the mixture to adjust the pH value at (7). The benefit of a hot plate magnetic stirrer at (90 °C) is a reason to evaporate a water. Then the solution will turn to gel, a continuum of heating and stirring tends to form a nearly dry gel, and the evolution of gases tends to agglomeration [45, 46], i.e , after the reaction involving all the components of ferrite passes through the sol phase at (120 °C). The components of H2O, CO2, and N2 are eliminated in the form of liberated gases, the reacting compound turns into a viscous gel that stores a very large chemical energy trapped inside the gel. This energy is increasing as the temperature increased until a temperature reached to (160 °C) that measured practically, and due to the presence of citric acid, which acts as fuel, the gel begins to self-combust in the form of an erupting volcano. The released chemical energy is very large, transforming the gel into an almost black nanopowder of LiZnCu ferrite. Therefore, the low temperature (160 °C/4hr) considered the most important features that distinguish the self-combustion sol-gel method over the rest of the other physical and chemical methods for preparing nanocomposites [47].
Then, a powder grinding in mortar and pestle is necessary to make the homogeneity of LiZnCu-nanopowders ferrite, as shown in Fig. 2. XRD was used to exam the powder that was calcined at temperature (650 °C/3hr) to remove all unwanted phase and producing a pure phase of cubic spinal LiZnCu-ferrite as obtained through XRD analysis. The benefits of sol-gel auto-combustion has various qualities, first, it possesses excellent chemical homogeneity. Second, it has superb crystallinity and product purity. Third, it produces a small and restricted particle sizes. Fourth, dopants may be easily added to the final product, and stoichiometry is simple to control. Fifth, it requires essential tools and a straightforward setup procedure. Sixth, a quick processing time and little use of external energy [48-50]. The particles size and their distribution are depending on the type of organic chelating agent (complexant), its ratio to the metal salt (oxidizer) must be equal (1) through the ratio oxidizer/reductant [41]. In addition, the pH value of the solution, ambient atmosphere, temperature, and additives such as NH4OH or NH4NO3 are used to modify the nature of the combustion reaction.
In this research, the nanostructure of LiZnCu-ferrite obtained using the direct self-combustion sol-gel method, so the ferrite phase was confirmed before the sintering process. The sintering temperature (800 °C) is useful to prepare a compacted ferrite sample, after pressing process the sample has high density and low pores size, this is benefit to get efficient properties for prepared sample [51, 52]. The sintering temperature (800 °C) is producing a powerful output in terms of absorption, attenuation, and magnetic permeability coefficients, as well as electrical permittivity, as discussed for the next research. This sintering temperature is smaller than that produced for the sample prepared by solid state reaction [53]. That is return to the production of nanostructure. That means as the particle size decreased the sintering temperature decreased [54].
|
Fig. 2 Combustion reaction of reactant producing LiZnCu ferrite. |
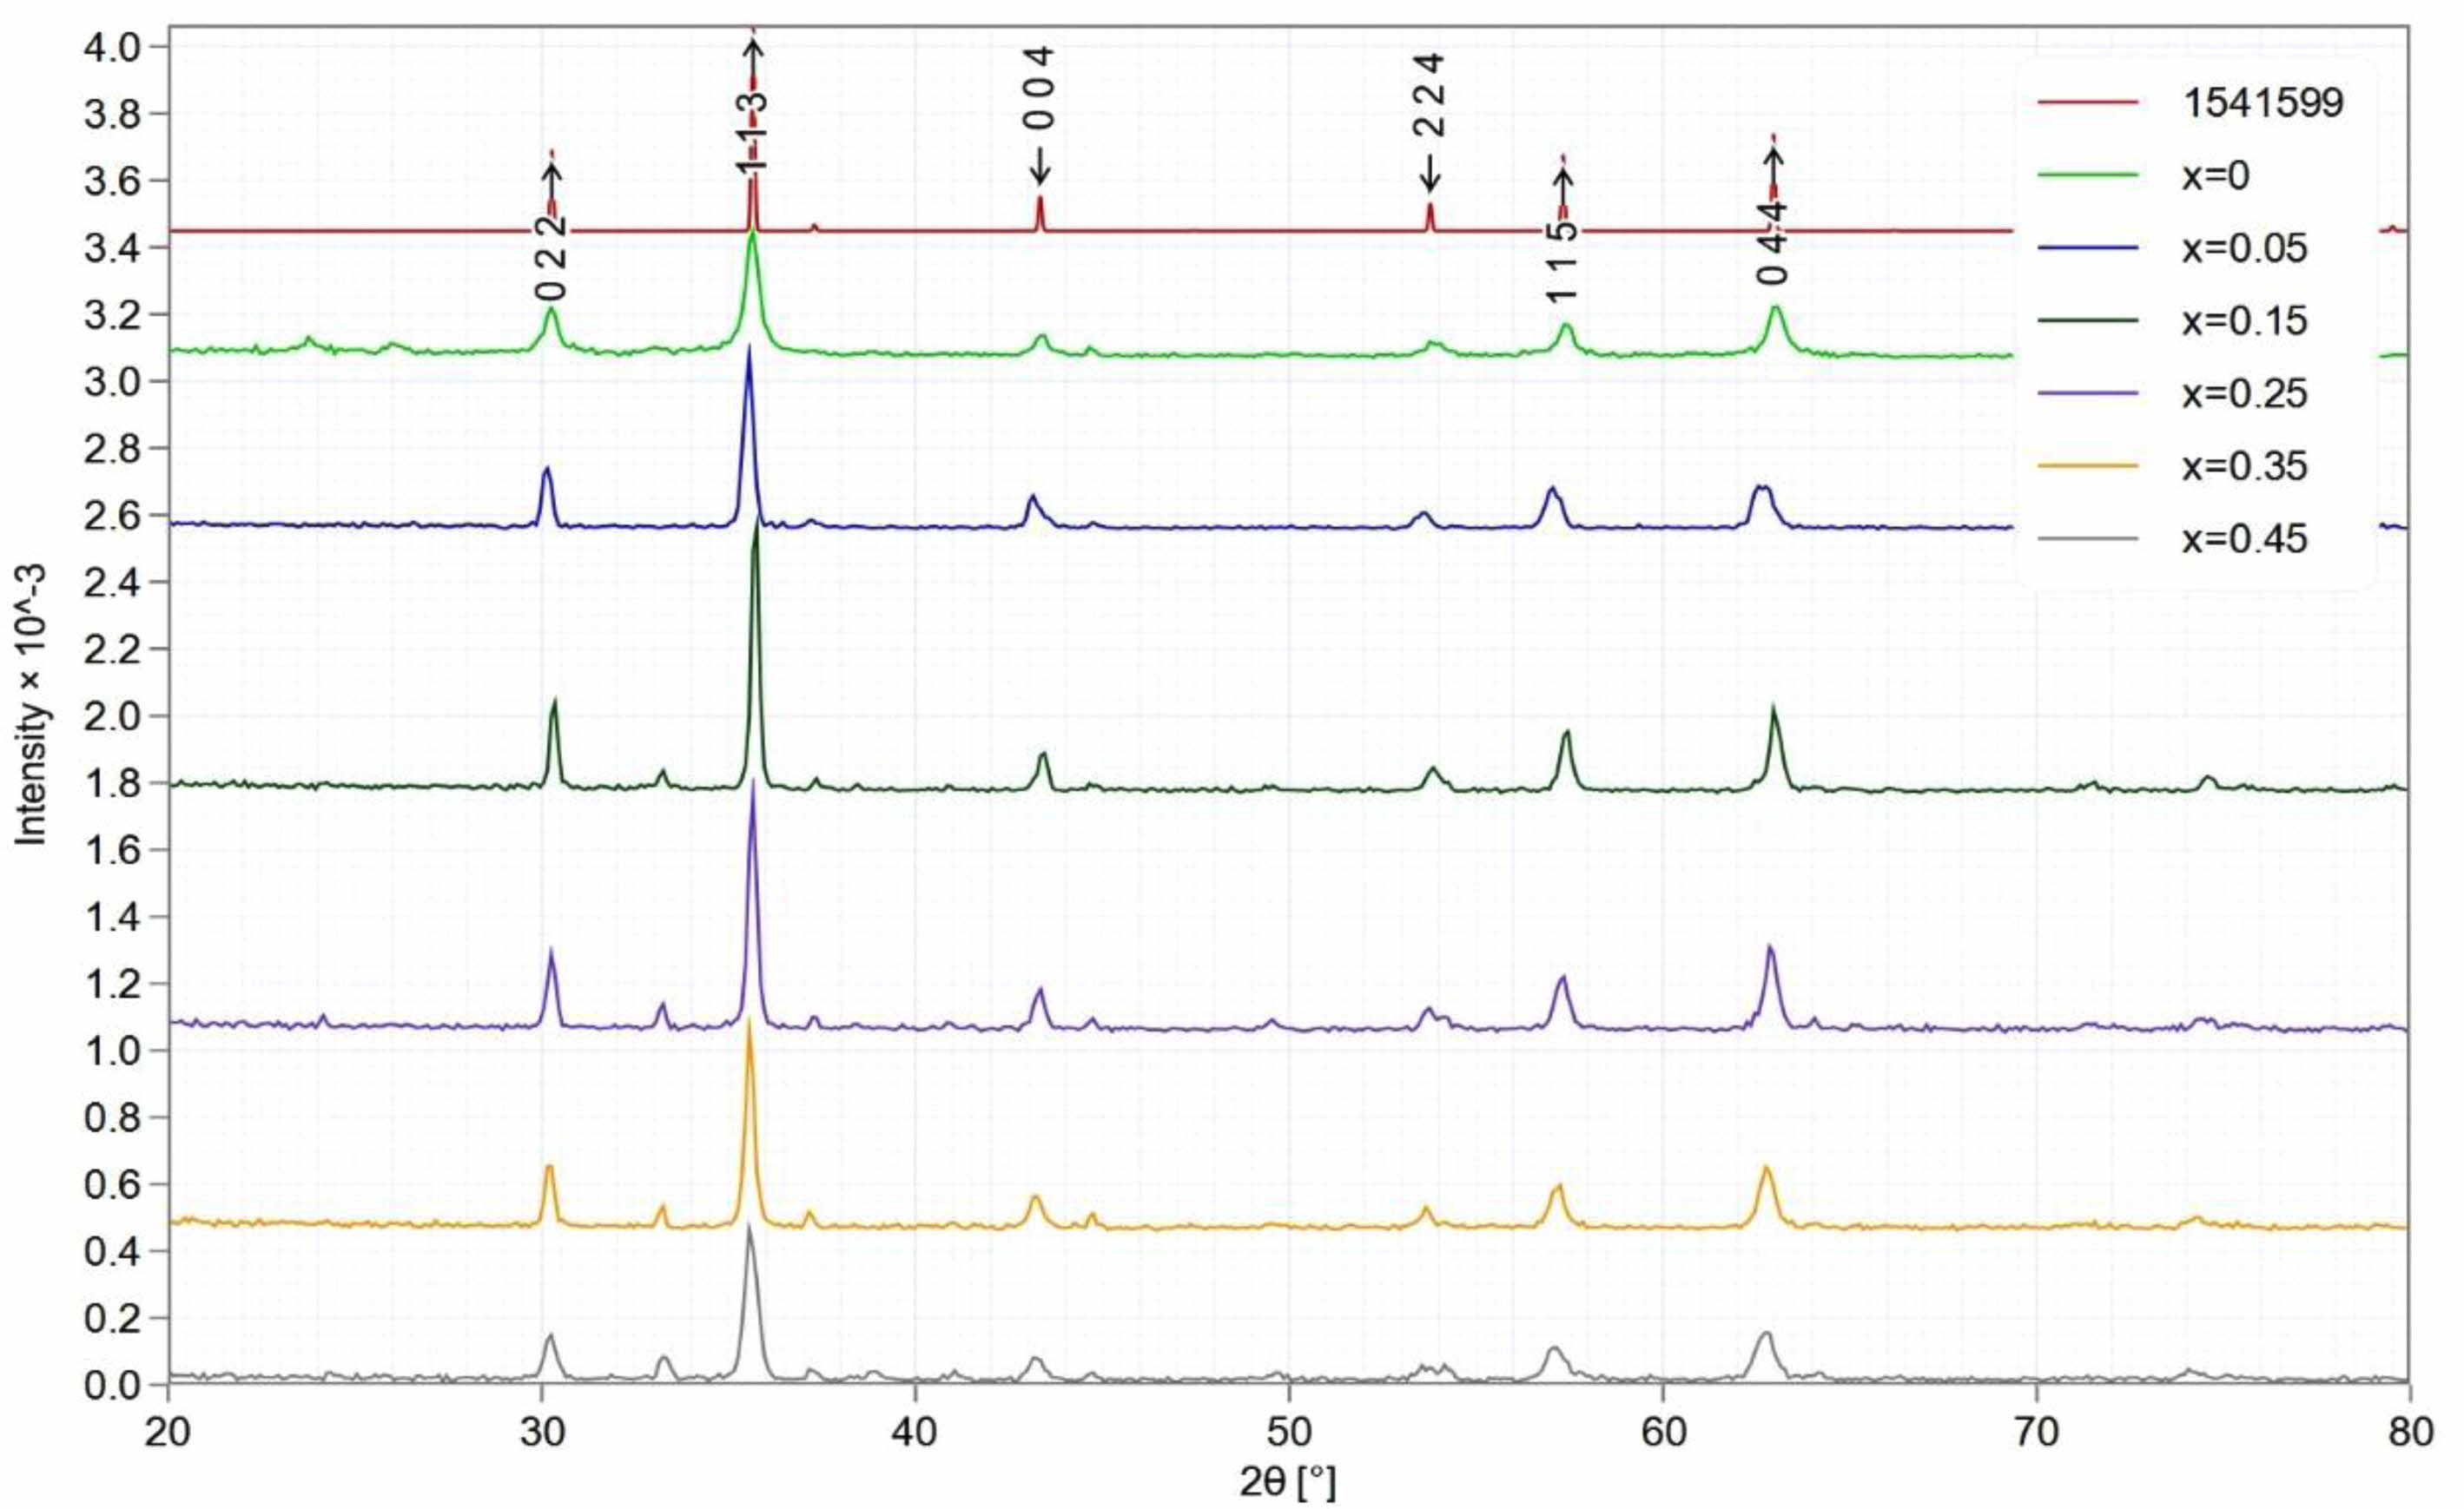
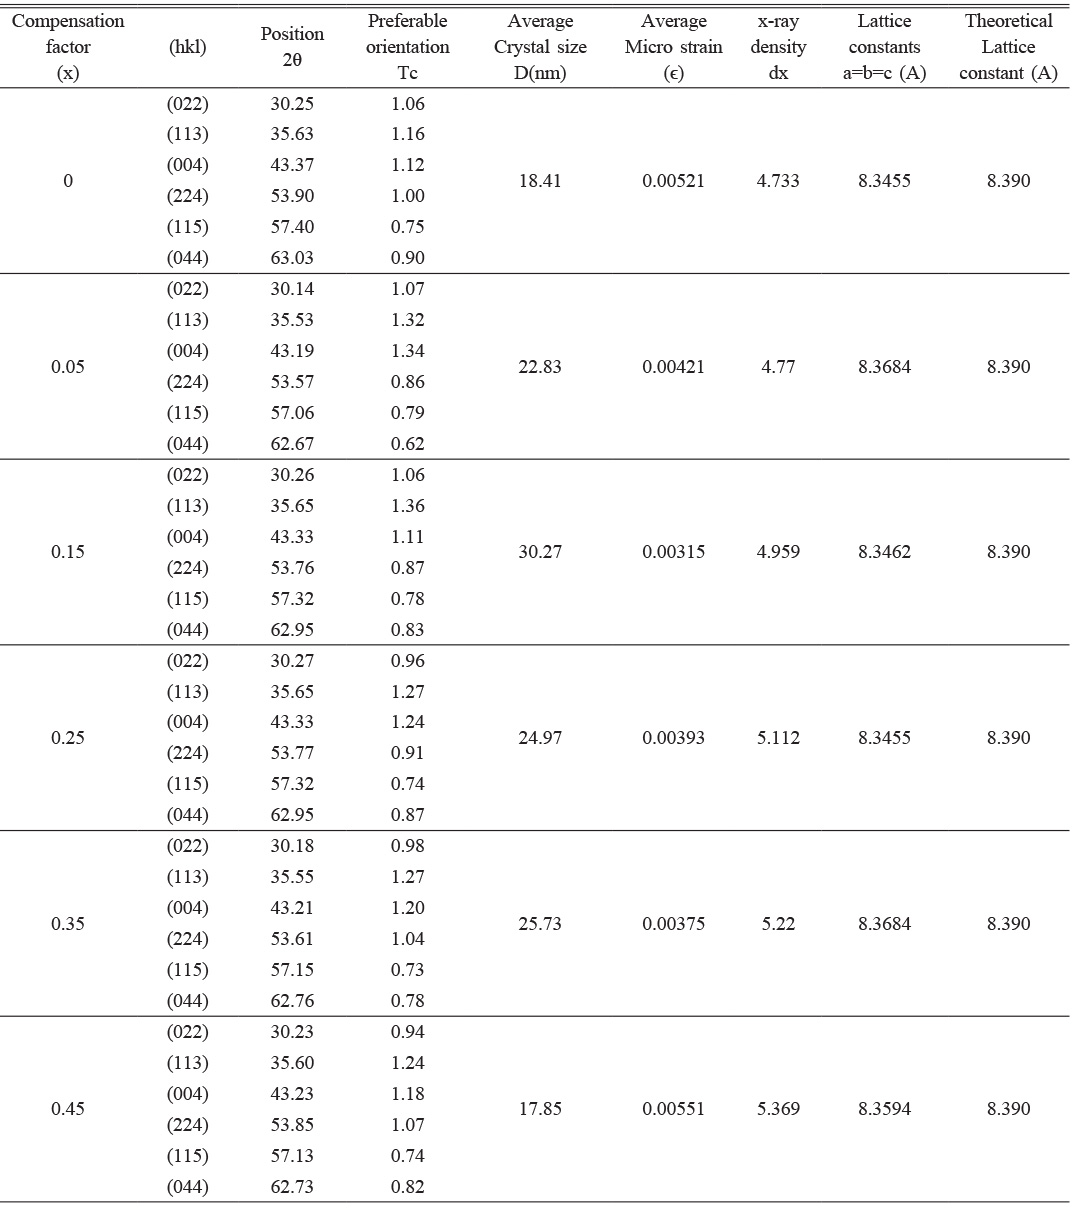
The results of X-ray diffraction analysis showed a single-phase spinel structure of the prepared Li-Zn-Cu-ferrite phase. A typical XRD pattern observed for each sample Li0.5-xZnxCuxFe2.5-xO4 at (x=0, 0.05, 0.15, 0.25, 0.35, and 0.45), as shown in Fig. 3. They found a good agreement with the JCPDS card (1541599). The diffracted peaks corresponding to planes (022), (113), (004), (224), (115), and (044) confirmed a cubic spinel structure. Most peaks were confirmed by Hamdi et al [43]. The output data of XRD analysis are mentioned in Tables 1 and 2. The lattice constants were in the range (a=8.34-8.36) depending on the x-value, they were analyzed by CrystDiff software directly. That was in agreement with Rasheed et al. [55]. The variation in the lattice constant related to compensation factor (x)of Cu, and Zn ions in structure with respect to Li, and Fe ions, then the variation in lattice constants might be attributed to excess in Zn, and Cu concentration. On the other hand, the balance in the valency is necessary to create the ferrite phase. The simulation of the XRD pattern at (x=0) by Endevour software is suitable to predicate the spinel unit cell and the probability of tetrahedron and octahedron including. The predicated spinel unit cell of ferrite structure is related to presence both ferric and ferrous, which are the reason to create the tetrahedral and octahedral structure, as mentioned in Fig. 4.
The predominant peak recorded in a plane (113), and the microstructural analysis represents the crystallite size (D) and the lattice strain (e). The calculation on six diffraction peaks were applied to find the average crystallite size (D) and the lattice strain (e) for prepared ferrite samples. The crystallite size (D) was determined by using the Debye-Scherrer method through the intercept with the y-axis [56], as mentioned in equation (1). The lattice strain determined by taking the tangent equation (2).
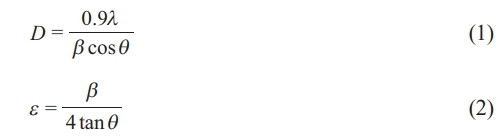
Where (λ=1.5406 Å) is the wavelength of the incident x-ray, (β) is the full width at half maximum in radians of the peak intensity, and (θ) is a diffracted angle. The results of Debye-Scherrer formula are mentioned in Table 1. The average crystallite size was in the range (17-30 nm) for all samples produced by the auto-combustion method. These result is smaller than the previous researches [57, 58] and approaches to Hamdi et al. [43], which depends on the preparation efficiency through the dependent conditions. The lattice strain is found in the range (3.15×10⁻³-5.51×10⁻³ nm), which is a function to the distortion appeared in the unit cell by the effect of x-ray source. It was higher than that recorded by Rathod et al. [58]. These values are a reason for the probability of lattice constants variation as mentioned in Table 1. The x-ray density (dx) of a diffracted ray was calculated by the following relation [59]
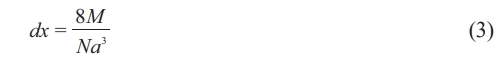
Where (M) is a molecular mass of the compound, (N) is Avogadro number, and (a3) is the conventional volume. There is a reversible proportion between the density (dx) and the conventional volume (a3). That means it is a function of filling factor per unit cell. On the other, hand the effect of substitution by Zn and Cu making the variation of (dx) with (M and a3) is more acceptable. The increase in (dx) is proportional to the ionic radii of substituted atoms like Zn and Cu.
The texture coefficient (Tc) is calculated to describe the following relation [60], as mentioned in Table 1. It is a function of preferable orientation.
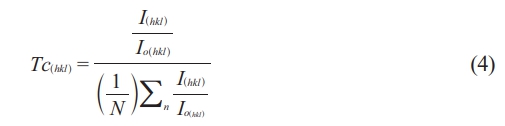
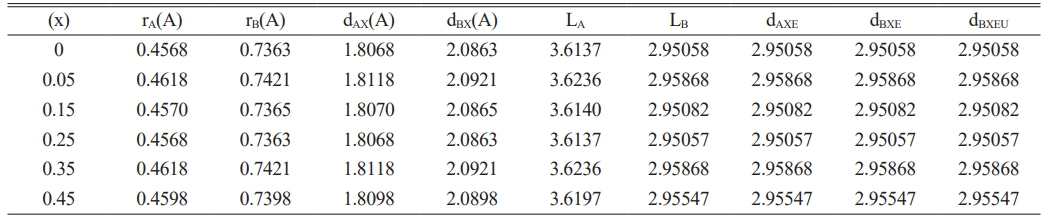
Where (N) is the total number of diffracted peaks observed and I(hkl) and Io(hkl) are the peaks intensities, and the standard of maximum intensity from the card (1541599) respectively. Normally, the crystalline phase is corresponding to all observed diffracted peaks, which were lower compared to the standard one. Except the peaks (113), and (044), which means the preferential orientation. That means the maximum number of grains are oriented by planes (113). The tetrahedral and octahedral ionic radii (rA, rB) in a cubic spinel structure [61] are given by the following equations:
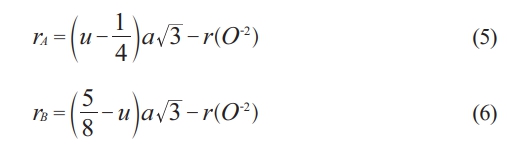
Where r(O-2) is the radius of oxygen ion (1.35 Å), and the ionic radii at a tetrahedral site (rA) are increasing slower than the ions in the octahedral site (rB). That is attributed to the cation redistribution due to the substitution by Cu, and Zn [62, 63].
On the other hand, the bond length (dAX) and (dBX) for tetrahedral and octahedral sites is given by the following equation measured in Angstrom [61].
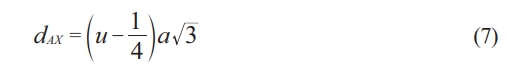
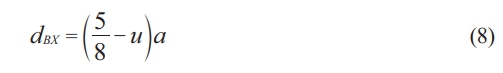
The lattice constant (a) and oxygen ion parameter (u) are vital in perfect spinel ferrite. The perfect spinel ferrite happened with a predetermined value of (u=3/8).The parameter (x) is a function to the ionic radii, which affects the value of lattice constants, and likewise, the bond length of octahedral and the tetrahedral sublattices. Normally, the ionic radii of cations are (Li1+=0.6, Zn2+=0.74, Cu2+=0.73, Fe2+=0.76, and Fe3+=0.64 nm), which are directly proportional to lattice constants according to equations (5-8). As shown in Table 1, when (x) increased 10%, the lattice constant change to the highest value (8.368 Å) due to the change in cations radii. When the value of (x) increased 50%, and due to the concentration of Li and Fe decreases, while the concentration of Zn and Cu increased, the lattice constant goes to lowest value (a=8.345 Å) depending on the change in ionic radii of substitutions. Normally, the lattice constant limited in the range (8.345-8.368 Å) throughout the change of (x). this behavior is agreement with the previous research [64].
The observed changing in lattice constant is also corresponding to the change in the bonds length of tetrahedral (dAX) and octahedral (dBX) structure, as seen in Table 2. The following equations are providing the hopping length (LA and LB), which pertain to tetrahedral and octahedral sites, respectively [61].
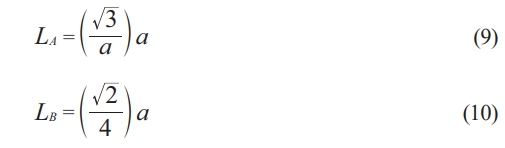
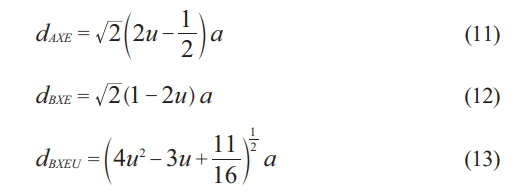
From Table 2, it is evident that LA and LB are related to the lattice constant. Then if (LA˃LB), the electron hopping is less between ions at tetrahedral and octahedral sites than that between octahedral and octahedral sites. The tetrahedral edge (dAXE), shared and unshared octahedral edge (dBXE), and (dBXEU) are determined using the following formula.
All the above parameters appeared in Table 2, they showed the variation associated with a lattice constant (a) that is attributed to cation redistribution. Normally, the ferrite material showed a magnetic moment of anti-parallel spins between Fe3+ ions at tetrahedral sites and Li1+, Zn2+, or Cu2+ ions at octahedral sites. Then the structural analysis demonstrated the grain size change as the substation ratio increased. The corresponding changes were seen in a strain, lattice constant, hopping length, and octahedral and tetrahedral structure.
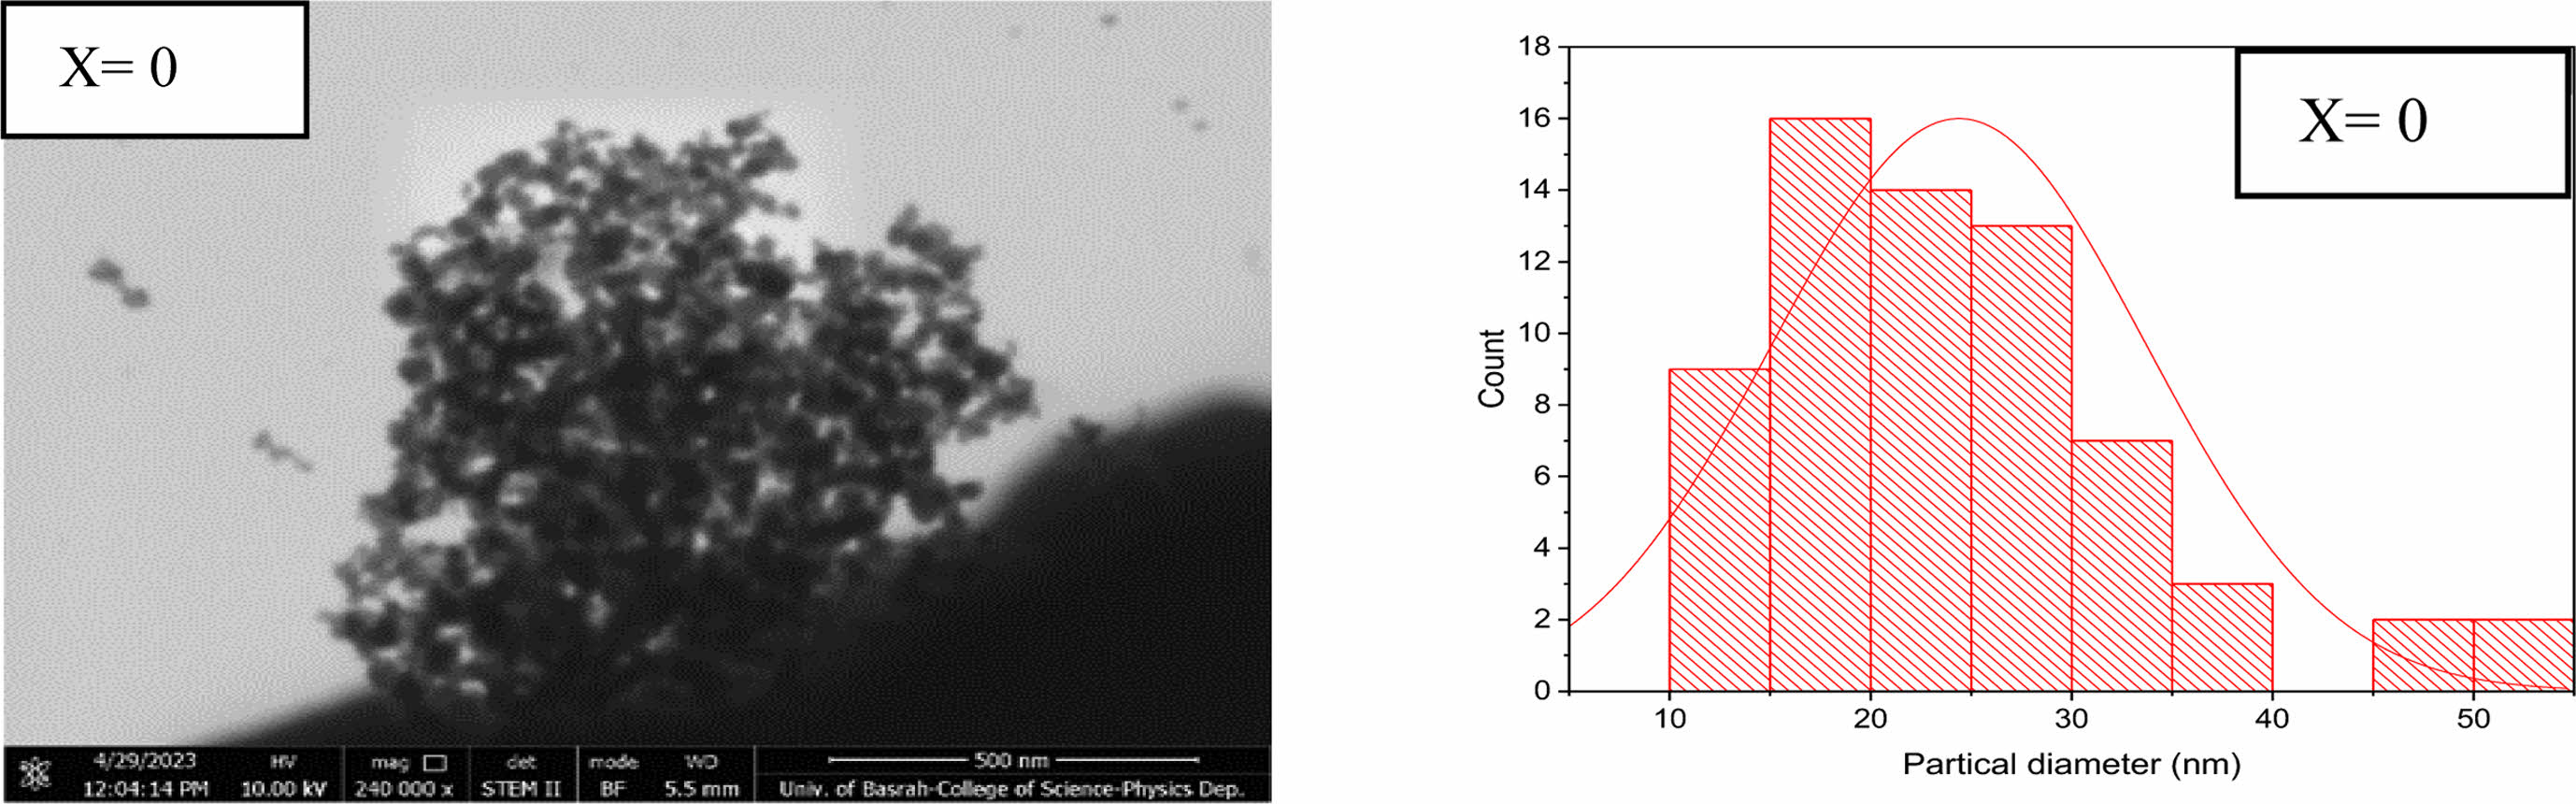
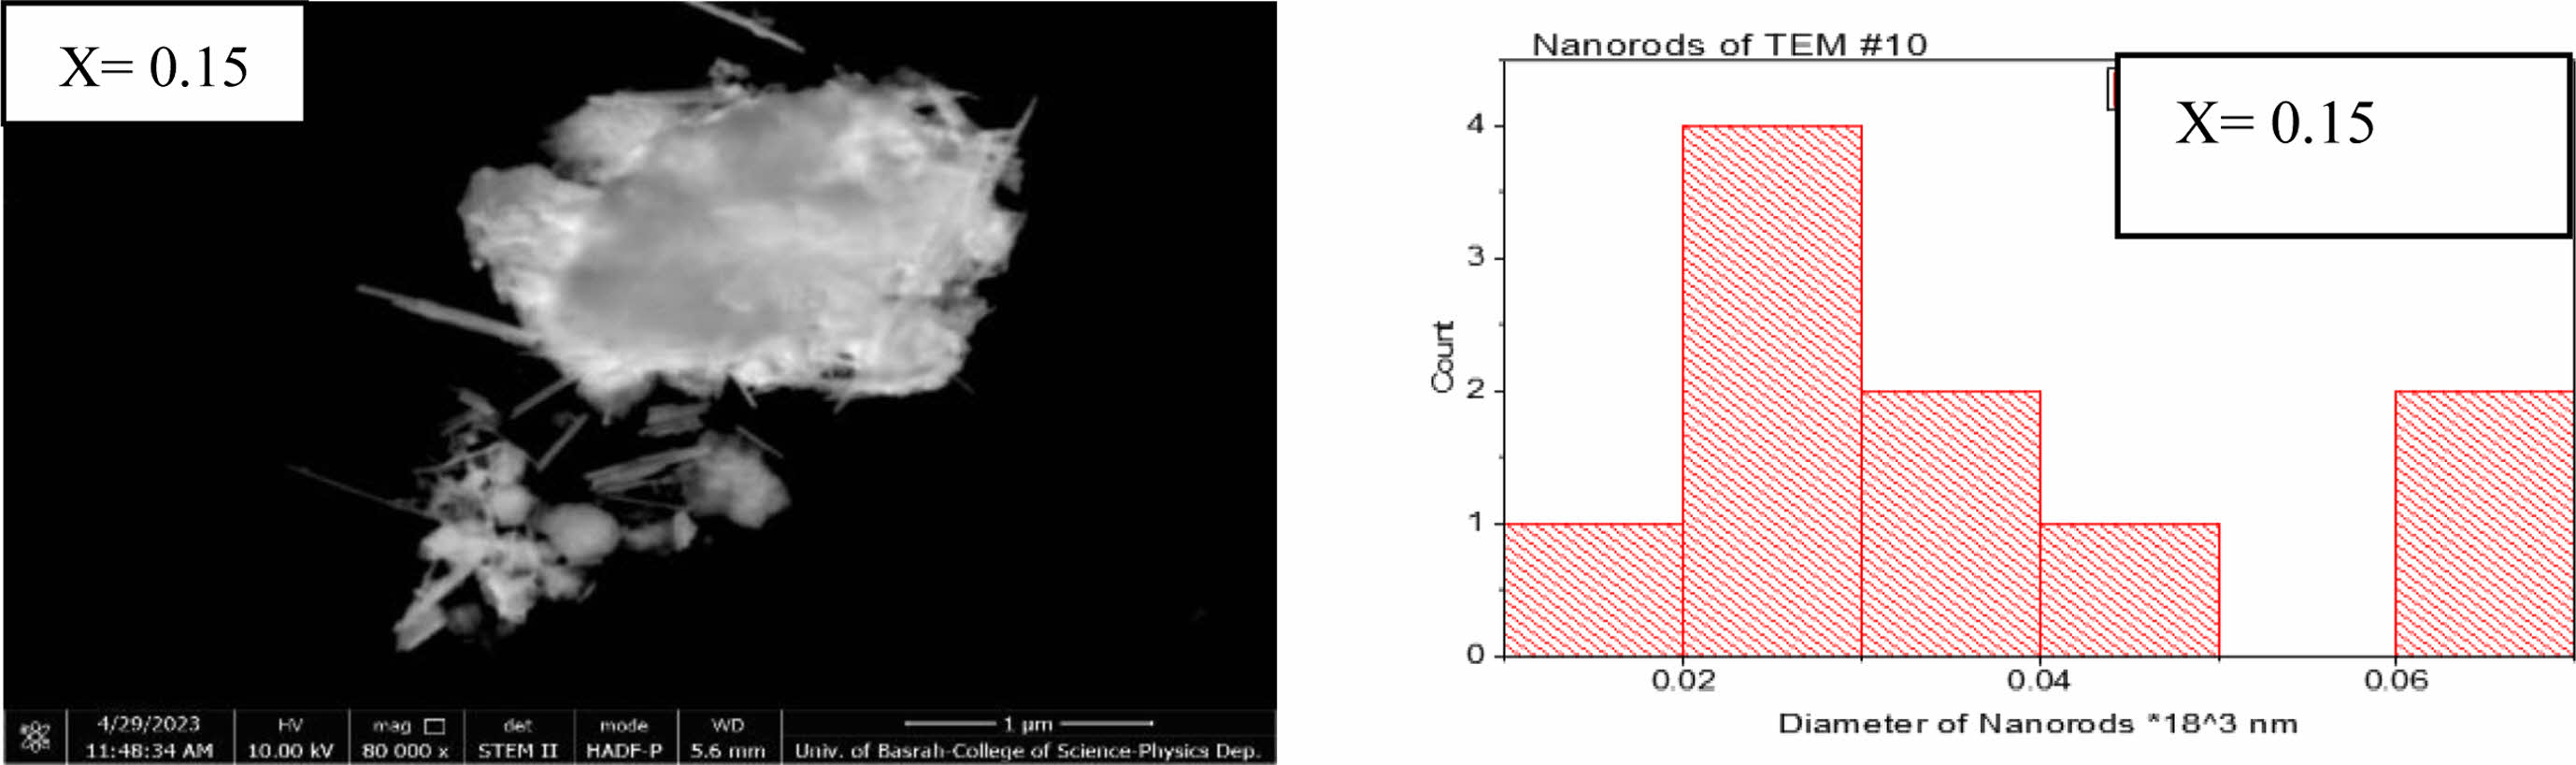
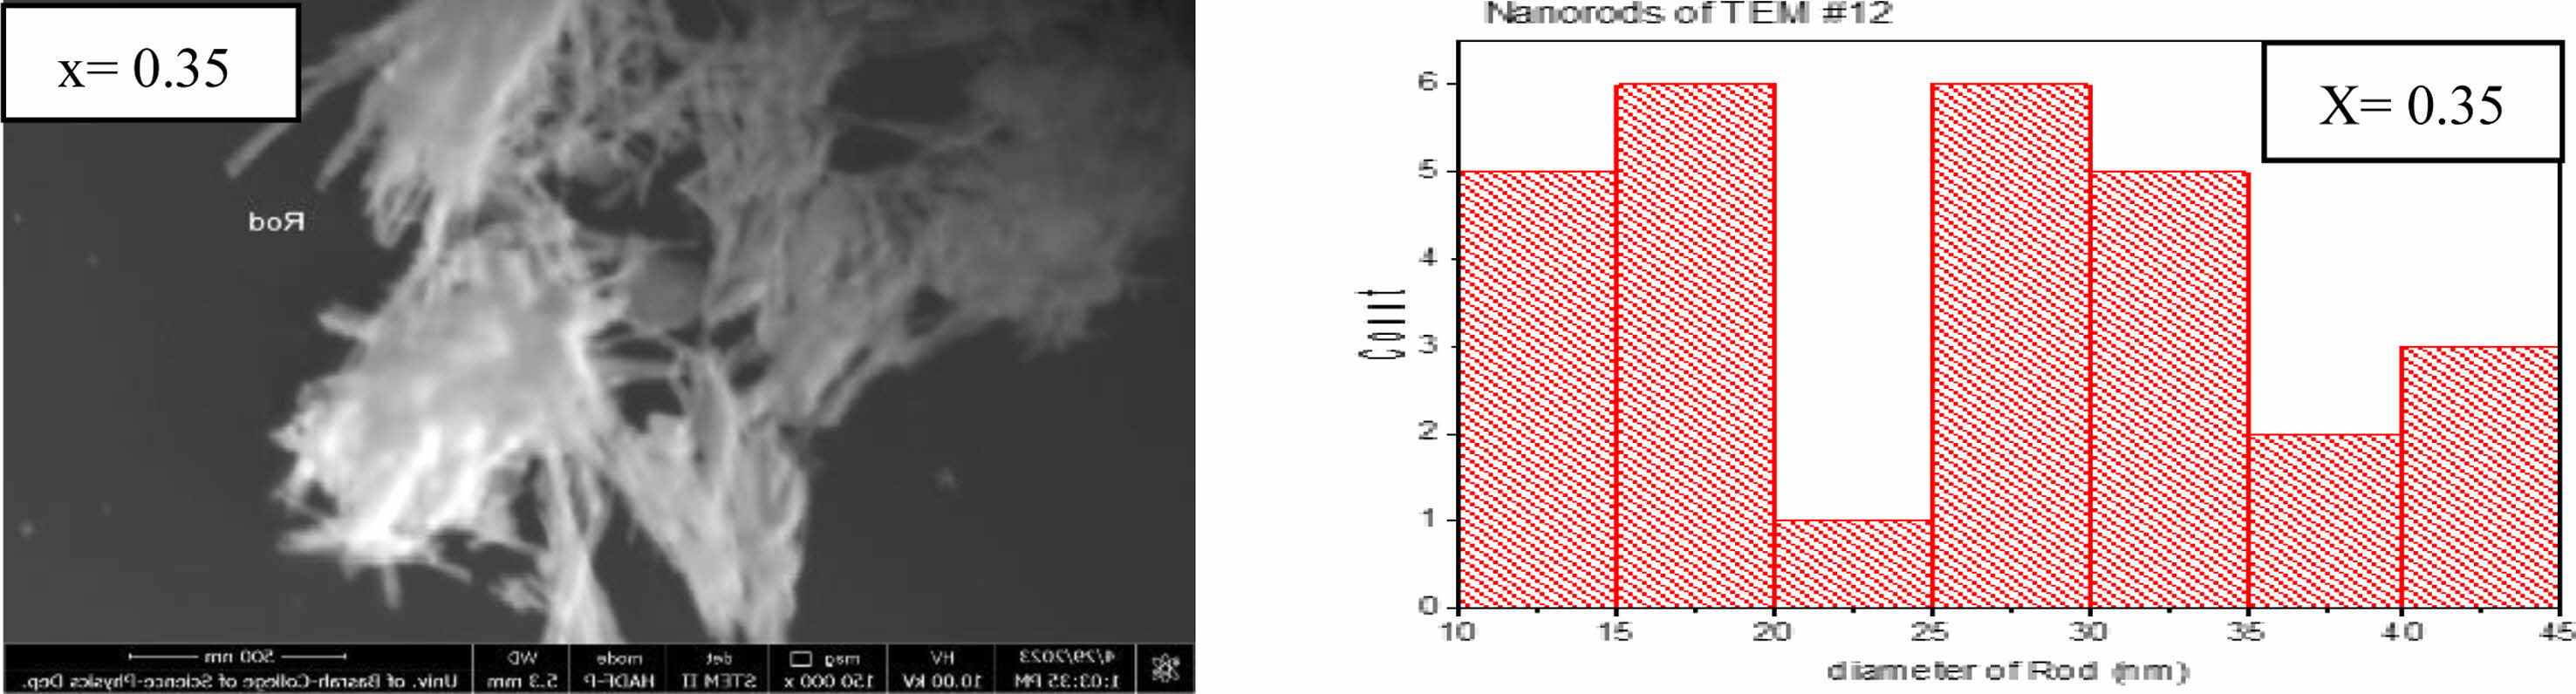
The transmission electron microscope analysis (TEM) was investigated to find the particle size distribution and their shapes. Three different shapes were recognized by nanoparticles, nanorods, and nanopins as shown in Figs. 5-7 for the composition Li0.5-xZnxCuxFe2.5-xO4 for (x=0, 0.15, and 0.35). The predominant particles size and shape mentioned in Fig. 5, the most dominant nanoparticle size is in the range (15-20 nm) with spherical shape as shown in a histogram in Fig. 5. The agglomerations of spherical nanoparticles, nano pins, and nanorods were observed. Whereas the predominant nanoparticles, nanopins at (x=0.15) appeared in Fig. 6. The most predominant diameter of nanorods is about (20-30 nm) as mentioned in a histogram shape of Fig. 6. On the other hand, the predominant nanorods at (x=0.35) are in the range (10-45 nm) as mentioned in Fig. 7. The most probable ratio of nanorods are in the range (15-20, and 25-30 nm) mentioned in a histogram of Fig. 7. The average nanostructure distribution mentioned in a range (20-23 nm) for all shape appeared. The substitution by Zn, and Cu gives the possibility of staying a small tetrahedral site less than the octahedral site [53, 61, 65]. There is a high possibility of occupancy octahedral (B) site by substituted ions.
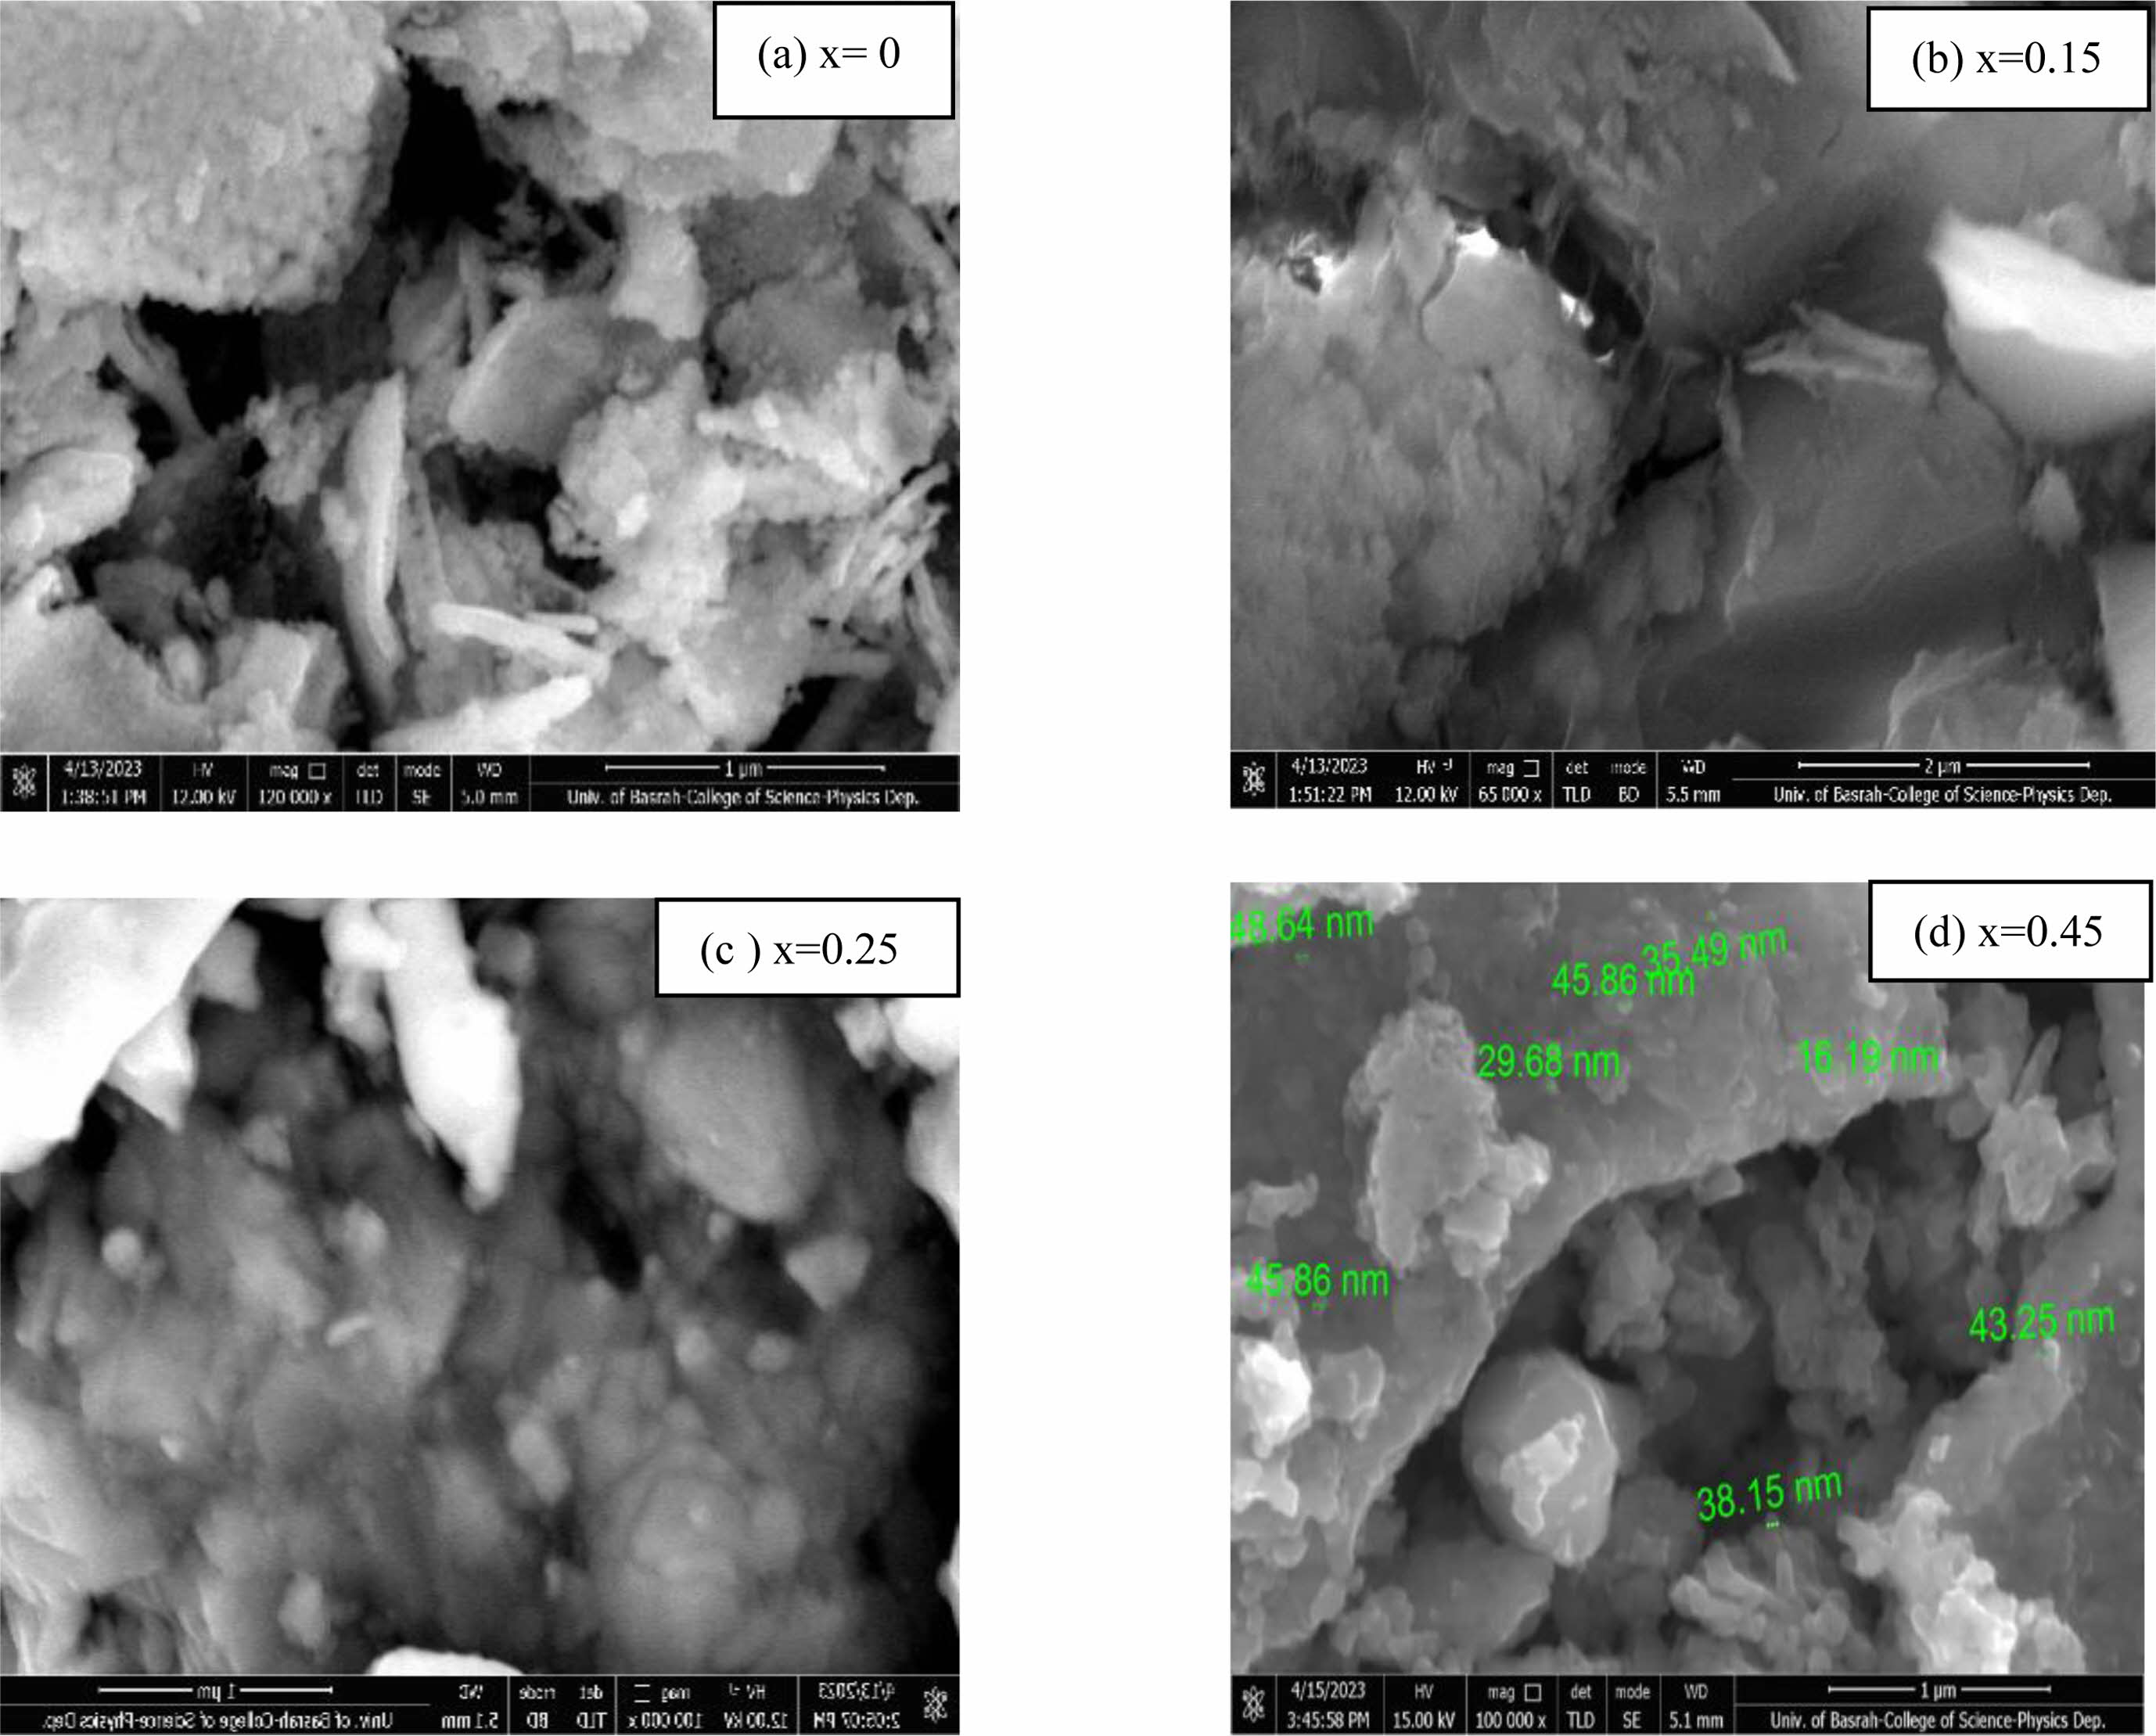
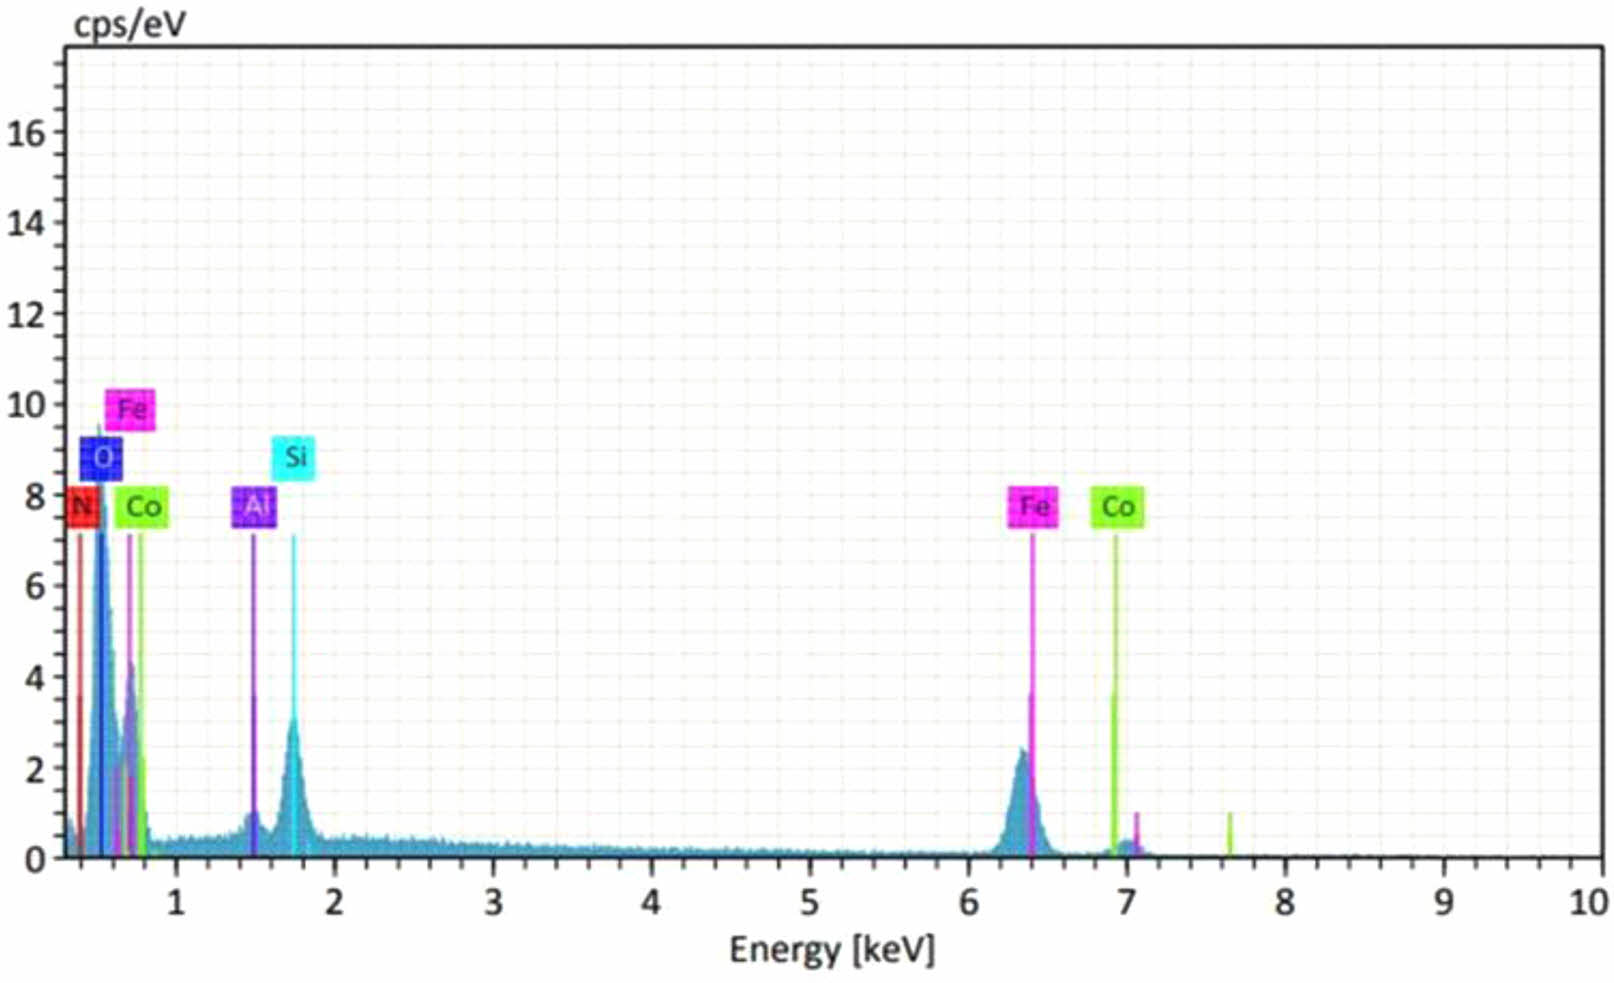
The scanning electron microscope SEM images are shown in Fig. 8 for different values of (x=0, 0.15, 0.25, and 0.45) respectively. According to the surface morphology, there are nanoparticles as a nanosphere appeared by non-homogenous distribution of the nanoparticles except Fig. 8d, which has high resolution. The presence of dark color behind the nanospheres showed the absence of nanostructure. The average grain size was about (35 nm), where the maximum and minimum grain sizes were (48.64 nm) and (16.19 nm) respectively. The results showed a good agreement with the output of XRD data [1]. The EDX analysis used to confirm the ionic ratio of the ferrite composition Li0.5-xZnxCuxFe2.5-xO4 as mentioned in Fig. 9. It was clear the correct elemental ratio mentioned in the peaks with the theoretical values. That emphasizes the success of the preparation conditions of the sol-gel auto-combustion method.
|
Fig. 3 XRD for Li0.5- xZnxCuxFe2.5-xO4 (x=0, 0.05, 0.15, 0.25, 0.35, and 0.45) ferrite. |
|
Fig. 4 The predicated unit cell of pure Li-ferrite by the presence of ferric and ferrous. |
|
Fig. 5 ndicate the nanoparticles shapes at (x=0) and the histogram distribution shape, the bar length (500 nm). |
|
Fig. 6 Indicate the nanoparticles and nanpins shape at (x=0.15) and histogram distribution at a bar length (1 µm). |
|
Fig. 7 Indicate the nanorods shape at (x=0.35) and histogram distribution at a bar length (1 µm). |
|
Fig. 8 The SEM images for different substitution ratio and different bar length (a) 1 μm, (b) 2 μm, (c) 1 μm, and (d) 1 μm. |
|
Fig. 9 The EDX analysis showed the elemental substitution ratio in Li0.5-xZnxCuxFe2.5-xO4 ferrite. |
There is a single phase of lithium-zinc-copper ferrite nanostructures in a chemical formula Li0.5-xZnxCuxFe2.5-xO4
at (x=0, 0.05, 0.15, 0.25, 0.35, and 0.45). It was successfully prepared by sol gel auto-combustion method. The appearance of predominate single phase and forming nanoparticles, nanopins, and nanorods are approved during the success of preparation method. There is a good agreement to produce a spinal structure at low temperature (160 °C). Since the grain size is a main variable that links XRD, and SEM. Then a grain size was calculated by XRD analysis using Scherrer equation method, where the average crystallite size for all LiZnCu-ferrite ranged between (18.41-30.27 nm). The width of the peak can also be observed, for the pattern of XRD, the sharper peaks is return to microstructure whereas the widen peaks is related to nanostructure. That is investigated from the peak width in the spectrum. SEM tests showed the presence of high homogeneity in the grain size distribution of the produced powder, whose diameter ranged between (16.19-48.64 nm). On the other hand, the sol gel auto-combustion method showed by using TEM analysis, the presence of active nanostructures like nanoparticles, whose diameter ranges between (10-40 nm), and nanorods, whose diameter ranges between (10-45 nm) The calculation on the XRD pattern showed the distances between cations and anions and bond angles confirmed the presence of pure tetrahedral and octahedral geometry.
This research is a part of Ph.D. project done at Al-Nahrain University/College of science/Physics department. There is a scientific collaboration with Dr. Mazin A. Mahdi from University of Basrah/College of Science/Department of Physics/Nanotechnology laboratory. He helped us in the analysis of nanostructures for all sample under study. This collaboration is a part of complement specialties between Iraqi universities to perform a perfect research.
- 1. S.M. Chavana, M.K. Babrekar, S.S. More, and K.M. Jadhav, J. Alloys and Compd. 507 (2010) 21-25.
-

- 2. J.D. Adam, L.E. Davis, G.F. Dionne, E.F. Schloemann, and S.N. Stitzer, IEEE Transactions on Microwave Theory and Techniques 50[3] (2002) 721-737.
-
- 3. J. Kulikowski, J. Magn. Magn. Mater. 41(1-3) (1984) 56-62.
-
- 4. V.G. Harris, A. Geiler, Y. Chen, S.D. Yoon, M. Wu, A. Yang, Z. Chen, P. He, P.V. Parimi, X. Zuo, C.E. Patton, M. Abe, O. Acher, and C. Vittoria, J. Magn. Magn. Mater. 321 (2009) 2035-2047.
-
- 5. Y. Qu, H. Yang, N. Yang, Y. Fan, H. Zhu, and G. Zou, Mater. Lett. 60 (2006) 3548-3552.
-
- 6. Kasapoglu, B. Birs, A. Baykal, Y. Koseoglu, and M.S. Toprak, Cent. Eur. J. Chem. 5[2] (2007) 570-580.
-
- 7. S.W. Cao, Y.J. Zhu, G.F. Cheng, and Y.H. Huang, J. Hazard. Mater. 171 (2009) 431-435.
-
- 8. Y.L. Liu, Z.M. Liu, Y. Yang, H.F. Yang, G.L. Shen, and R.Q. Yu, Sens. Actuators B 107 (2005) 600-604.
-
- 9. T.T. Ahmed, I.Z. Rahman, and M.A. Rahman, J. Mater. Process. Technol. 153-154 (2004) 797-803.
-
- 10. X. Zeng, Z. Hou, J. Ju, L. Gao, J. Zhang, and Y. Peng, Mater. 15[2422] (2022) 1-10.
-
- 11. M. Mouallem-Bahout, S. Bertrand, and O. Pena, J. Solid State Chem. 178 (2005) 1080-1086.
-
- 12. I.H. Gul, W. Ahmed, and A. Maqsood, J. Magn. Magn. Mater. 320 (2008) 270-275.
-
- 13. S. Zahi, M. Hashim, and A.R. Daud, J. Magn. Magn. Mater. 308 (2007) 177-182.
-
- 14. A. Kosak, D. Makovec, A. Znidarsic, and M. Drofenik, J. Eur. Ceram. Soc. 24 (2004) 959-962.
-
- 15. M. Suhail, Z.N. Kadhim, and A.H. Al-Mowali, Al-Kitab J. for Pure Science 6[1] (2022) 14-29.
-
- 16. A. Takayama, M. Okuya, and S. Kaneko, Solid State Ion. 172 (2004) 257-260.
-
- 17. S. Thakur, S.C. Katyal, and M. Singh, J. Magn. Magn. Mater. 321 (2009) 1-7.
-
- 18. P.P. Sarangi, S.R. Vadera, M.K. Patra, and N.N. Ghosh, Powder Technol. 203 (2010) 348-353.
-
- 19. J. Li, X. Zhao, and A. Xia, J. Ceram. Process. Res. 24[5] (2023) 894-898.
-
- 20. S.T. Aruna and A.S. Mukasyan, Curr. Opin. Solid State Mater. Sci. 12 (2008) 44-50.
-
- 21. B.S. Randhawa, H.S. Dosanjh, and N. Kumar, J. of Radioanal. Nucl. Chem. 274[3] (2007) 581-591.
-
- 22. S.P. Lee, Y.J. Chen, C.M. Ho, C.P. Chang, and Y.S. Hong, Mater. Sci. Eng. B 143 (2007) 1-6.
-
- 23. A. Sutka, G. Mezinskis, A. Pludons, and S. Lagzdina, Energetika 56[3-4] (2010) 254-259.
- 24. A. Sutka, K.A. Gross, G. Mezinskis, G. Bebris, and M Knite, Phys. Scr. 83 (2011) 025601-6.
-
- 25. A.A. Thant, S. Srimala, P. Kaung, M. Itoh, O. Radzali, and M.N.A. Fauzi, J. Aust. Ceram. Soc. 46[1] (2010) 11-14.
- 26. P.K. Nayak, Mater. Chem. Phys. 112 (2008) 24-26.
-
- 27. M.K. Shobana, V. Rajendran, K. Jeyasubramanian, and N.S. Kumar, Mater. Lett. 61 (2007) 2616-2619.
-
- 28. M.M. Mallapur, P.A. Shaikh, R.C. Kambale, H.V. Jamadar, P.U. Mahamuni, and B.K. Chougule, J. Alloys and Compd. 479 (2009) 797-802.
-
- 29. Z. Yue, J. Zhou, L. Li, X. Wang, and Z. Gui, Mater. Sci. Eng. B 86 (2001) 64-69.
-
- 30. J. Azadmanjiri, H.K. Salehani, M.R. Barati, and F. Farzan, Mater. Lett. 61 (2007) 84-87.
-
- 31. Z. Yue, J. Zhou, L. Li, Hongguo Zhang, and Zhilun Gui, J. Magn. Magn. Mater. 208 (2000) 55-60.
-
- 32. R.K. Selvan, C.O. Augustin, L.J. Berchmans, and R. Saraswathi, Mater. Res. Bull. 38 (2003) 41-54.
-
- 33. A. Moutaouaffiq, M. Belhajji, A. Rjeb, S. Sayouri, D.S. Houssaini, and T.D. Lamcharfi, J. Ceram. Process. Res. 23[5] (2022) 570-582.
-
- 34. L. Guo, X. Shen, X. Meng, and Y. Feng, J. Alloys and Compd. 490 (2010) 301-306.
-
- 35. N. Gupta, A. Verma, S.C. Kashyap, and D.C. Dube, Solid State Commun. 134 (2005) 689-694.
-
- 36. J. Azadmanjiri, Mater. Chem. Phys. 109 (2008) 109-112.
-
- 37. J.D. Taher and S.A. Salem, Al-Kitab J. for Pure Science 4[1] (2020) 27-40.
-
- 38. R. Shukla, R.S. Ningthoujam, S.S. Umare, S.J. Sharma, S. Kurian, R.K. Vatsa, A.K. Tyagi, and N.S. Gajbhiye, Hyperfine Interact. 184 (2008) 217-225.
-
- 39. J.C. Aphesteguy, A. Damiani, D. DiGiovanni, and S.E. Jacobo, Phys. B: Condens. Matter 404 (2009) 2713-2716.
-
- 40. M. Atif, M. Nadeem, R. Grossinger, and R.S. Turtelli, J. Alloys and Compd. 509 (2011) 5720-5724.
-
- 41. A. Sutka and G. Mezinskis, Front. Mater. Sci. 6[2] (2012) 128-141.
-
- 42. R. Seniz and A. Kushan, J. Ceram. Process. Res. 24[4] (2023) 736-741.
-
- 43. N. Hamdi, L. Bessais, and W. Belam, Open Chem. J. 7 (2020) 44-54.
-
- 44. A.C.F.M. Costa, M.R. Morelli, and R.H.G.A. Kiminami, J. Mater. Synth. Process. 9[6] (2001) 347-352.
-
- 45. M. Sertkol, Y. Koseoglu, A. Baykal, H. Kavas, and M.S. Toprak, J. Magn. Magn. Mater. 322 (2010) 866-871.
-
- 46. L. Yu, S. Cao, Y. Liu, J. Wang, C. Jing, and J. Zhang, J. Magn. Magn. Mater. 301 (2006) 100-106.
-
- 47. D. Bokov, A.T. Jalil, S. Chupradit, W. Suksatan, M.J. Ansari, I.H. Shewael, G.H. Valiev, and E. Kianfar,Synthesis and Application ID 5102014 (2021) 1-21.
-
- 48. A.C.F.M. Costa, M.R. Morelli, and R.H.G.A. Kiminami, J. Mater. Sci. 42 (2007) 779-783.
-
- 49. M. George, A.M. John, S.S. Nair, P.A. Joy, and M.R. Anantharaman, J. Magn. Magn. Mater. 302 (2006) 190-195.
-
- 50. A.S. Mukasyan, P. Epstein, and P. Dinka, Proceedings of the Combustion Institute 31 (2007) 1789-1795.
-
- 51. J. Yang, Y. Fan, H. Tan, W. Liu, Y. Kuang, X. Yang, M. Cao, and J. Li, Materials (Basel) 16[16] (2023) 5682.
-
- 52. A. Wahi, N. Muhamad, A.B. Sulong, and R.N. Ahmad, J. Jpn. Soc. Powder Powder Metallurgy 63[7] (2016) 434-437.
-
- 53. Y.C. Lee, H.J. Hsu, I.Y. Huang, H.J. Shih, and C. Pithan, J. Ceram. Process. Res. 24[6] (2023) 992-1000.
-
- 54. N. Ismiati and D. Darwis, J. Phys.: Conf. Ser. 1763 (2021) 0120941-4.
-
- 55. S. Rasheed, H.S. Aziz, R.A. Khan, A.M. Khan, A. Rahim, J. Nisar, S.M. Shah, F. Iqbal, and A.R. Khan, Ceram. Int. 42 (2016) 3666-3672.
-
- 56. SK.K. Muswareen, K. Venkatarao, and S. Cole, Phys. Chem. Res. 11[2] (2023) 241-251.
-
- 57. M. Airimioaei, C.E. Ciomaga, N. Apostolescu, L. Leontie, A.R. Iordan, L. Mitoseriu, and M.N. Palamaru, J. Alloys and Compd. 509 (2011) 8065-8072.
-
- 58. V. Rathod, A.V. Anupama, V.M. Jali, V.A. Hiremath, and B. Sahoo, Ceram. Int. 43[16] (2017) 14431-14440.
-
- 59. P.P. Hankare, K.R. Sanadi, R.S. Pandav, N.M. Patil, K.M. Garadkar, and I.S. Mulla, J. Alloys and Compd 540 (2012) 290-296.
-
- 60. P.A. Nwofe, K.T.R. Reddy, G. Sreedevi, J.K. Tan, I. Forbes, and R.W. Miles, Energy Procedia 15 (2012) 354-360.
-
- 61. A. Anugraha, V.K. Lakshmi, G.S. Kumar, T. Raguram, and K.S. Rajni, IOP Conf. Ser.: Mater. Sci. Eng. 577 (2019) 0120591-10.
-
- 62. N.M. Deraz and A. Alarifi, J. Anal. Appl. Pyrolysis 97 (2012) 55-61.
-
- 63. Y. Zhang, Y. Yang, D. Chen, C. Chen, and Y. Meng, J. Ceram. Process. Res. 24[2] (2023) 342-347.
-
- 64. A. Moutaouaffiq, A.D. Seddik, A. Rjeb, M.N. Bennani, M. Naji, and S. Sayouri, J. Ceram. Process. Res. 24[6] (2023) 954-962.
-
- 65. A.M. Kumar, P.A. Rao, M.C. Varma, G. Choudary, and K.H. Rao, J. Mod. Phys. 2 (2011) 1083-1087.
-
 This Article
-
2024; 25(3): 323-331
Published on Jun 30, 2024
- 10.36410/jcpr.2024.25.3.323
- Received on Dec 3, 2023
- Revised on Jan 30, 2024
- Accepted on Feb 2, 2024
Services
- Abstract
introduction
experimental
results and discussion
conclusion
- Acknowledgements
- References
- Full Text PDF
Shared
Correspondence to
- Emad K. Al-Shakarchi
-
Al-Nahrain University, College of Science, Physics Department, Baghdad, Iraq
Tel : 009647714762006 E-mail: emad.abbas@nahrainuniv.edu.iq - E-mail: emad.abbas@nahrainuniv.edu.iq
Clean-Energy Research Institute(CRI), Hanyang University, 222, Wangsimni-ro, Seongdong-gu, Seoul, 04763, Korea
E-mail: jcpr@hanyang.ac.kr