- Mechanical performance of mono and hybrid synthetic fibers engineered cementitious composites with silica fume
K. Yuvaraja,*, M. Sakthivelb, M. Dhivakar Karthickc, T. Pradeepd, M. Veerapathrane and S. Gowthamb
aDepartment of Civil Engineering, K.S. Rangasamy College of Technology, Tiruchengode, Tamil Nadu, India
bDepartment of Civil Engineering, Kongunadu College of Engineering and Technology, Trichy, Tamil Nadu, India
cDepartment of Civil Engineering, Erode Sengunthar Engineering College, Erode, Tamil Nadu, India
dDepartment of Civil Engineering, Kongu Engineering College, Erode, Tamil Nadu, India
eDepartment of Civil Engineering, Dr. N.G.P Institute of Technology, Coimbatore, Tamil Nadu, IndiaThis article is an open access article distributed under the terms of the Creative Commons Attribution Non-Commercial License (http://creativecommons.org/licenses/by-nc/4.0) which permits unrestricted non-commercial use, distribution, and reproduction in any medium, provided the original work is properly cited.
An attempt was undertaken to elevate the efficacy of Engineered Cementitious Composites (ECC) mixes by inclusion of silica fume alongside mono fiber and hybrid fiber in this study. Totally, six mixes were prepared with low modulus and high modulus fiber. The initial three mixtures consist of mono fiber engineered cementitious composites (MFECC), incorporating Poly Vinyl Alcohol (PVA), Polypropylene (PP), and Glass fiber, each with a 2% volume fraction. The remaining three mixtures were formulated as hybrid fiber engineered cementitious composites (HFECC), combining PVA (1%) and PP (1%), PP (1%) and Glass (1%), and lastly, PVA (1%) and Glass (1%). In addition, all six mixtures were consistently maintained with a fixed composition comprising 40% silica fume, 30% fly ash, 80% M-sand, a water-to-binder ratio of 0.35, and 1% superplasticizer. The findings suggest that within the examined compositions, MFECC reinforced with 2.0% PVA fiber and HFECC reinforced with 1% PVA fiber and 1% glass fiber exhibit more significant strength characteristics than other mixtures.
Keywords: Engineered cementitious composite, Silica fume, Synthetic fibers, Mechanical properties.
Over the past few decades, researchers have been introduced to diminish crack width by incorporating Engineered Cementitious Composites (ECC) containing a range of fibers, including natural fibers [1-3] and synthetic fibers [4-6], at a volume fraction (Vf) of less than 2.0%. In its early stages of use, this material was primarily employed for repair and retrofitting purposes, driven by its exceptional characteristics, which encompass high-performance attributes, versatile processing capabilities, and its inherent isotropic nature [7]. The composite materials can effectively incorporate reinforcement through the inclusion of randomly dispersed short fiber. The incorporation of fiber aims to mitigate the damage sustained by concrete exposed to seismic forces [8]. To mitigate potential microstructural damage, ECC were typically formulated using synthetic fibers [9]. The mixing process for ECC closely resembles that of cement concrete. The primary goal of ECC is to enhance toughness and malleability [10].
The substantial efforts and technical strategies have been actively employed to enhance the ECC. Diverse fibers have been combined to create a novel hybrid ECC, and the utilization of PVA fiber has notably improved its mechanical properties [11, 12]. This practice of incorporating multiple types of fiber into a mixture is referred to as fiber hybridization. The resulting hybrid amalgamation capitalizes on the advantages of each individual fiber, resulting in significantly heightened maximum potency and deformation capacity compared to a mono-fiber construction [13-16]. ECC serves a range of purposes beyond its traditional use, finding application in various infrastructure projects. Noteworthy applications encompass link slabs in bridges [17], dampers [18], retaining walls [19], beam-column joints [20], This diverse range of applications highlights ECC’s versatility and its increasing presence in contemporary infrastructure projects. In a conventional ECC mixture, the cement content typically reaches approximately 1000 kg/m3. This has raised concerns about the sustainability of ECC, given its association with significant greenhouse gas emissions, accounting for about 5% of the global total [21, 22]. In response, recent research initiatives have been dedicated to crafting an eco-friendly or “green” ECC, aiming to transform the material into a sustainable option. The incorporation of mineral admixtures into ECC not only enhances its mechanical properties but also reduces shrinkage [23-25].
The potential applications of ECC were poised for further expansion across various infrastructure sectors in the future. While mono fiber ECC has found use in various applications, certain limitations have become apparent, necessitating enhancements in ECC properties when using a single type of fiber [26, 27]. The introduction of hybridization in ECC, combining low modulus and high modulus fiber, has demonstrated substantial improvements in the mechanical properties of the ECC mixture [28-30]. Current research has delved into exploring the utilization of fly ash, silica fume, PVA fiber, PP fiber, and glass fiber within ECC. In addition, this study concentrates on the development of an innovative cementitious composite by integrating mono and hybrid fiber, aiming to enhance compressive strength, direct tensile strength, young’s modulus and impact toughness. Six distinct ECC mixtures were formulated, consisting of two categories: Mono-fiber ECC and Hybrid-fiber ECC. The Mono-fiber ECC blend contained a 2% volume fraction of PVA fiber, PP fiber, and glass fiber each. The Hybrid-fiber ECC mixtures were composed of three combinations: 1% PVA with PP fiber, 1% PP fiber with glass fiber, and 1% PVA fiber with glass fiber.
Materials
In this research project, OPC 53 grade cement, fly ash (FA) and silica fume (SF) as binding agent were used. Furthermore, to enhance the strength properties of ECC, synthetic fibers like PVA, PP, and Glass fibers were utilized as shown in Fig. 1. Chemical characteristics of cement, FA and SF were represented in Table 1, and also the mechanical characteristics of PVA, PP and glass fiber were tabulated in Table 2. M-sand was incorporated as the fine aggregate in this study, Further, physical characteristics of M-sand were determined, it exhibits specific gravity of 2.71 and fineness modulus of 2.46. To enhance the fresh state of ECC, the superplasticizer namely conplast SP 430 is used.
Mix proportions
This study employs two distinct ECC mix types: Mono Fiber ECC (MFECC) and Hybrid Fiber ECC (HFECC). The mix proportion of both mono and hybrid fiber ECC specimens was shown in Table 3. These mixtures vary in terms of their volume fractions. Specifically, MFECC1 contains PVA fibers at a volume fraction of 2.0%, MFECC2 incorporates PP fiber at a volume fraction of 2.0%, and MFECC3 includes glass fiber at a volume fraction of 2.0% respectively.
In order to improve the capacity for strain hardening, HFECC mixes were introduced, incorporating diverse combinations of fiber. HFECC1 comprises PVA and PP fiber, each at a volume fraction of 1%. HFECC2 combines PP and glass fiber, both at a volume fraction of 1%. In HFECC3, PVA and glass fiber were included at volume fraction of 1% respectively. The addition of silica fume was consistently incorporated into all the mixes at a fixed ratio of 0.4 [31].
Specimen preparation
The quantities of cement, fly ash, silica fume, and M-sand were carefully weighed and mixed for 5 minutes in a 560-liter electric mixer. Subsequently, conplast SP 430 and were introduced into the dry mix and thoroughly mixed for a duration of five to seven minutes. Finally, fibers were introduced into the wet mortar mix and allowed to disperse evenly for three to five minutes. Mixing for over fifteen minutes was employed to alleviate the thixotropic influence of the ECC mixture. The freshly prepared ECC mix was poured into mortar molds and cured at different ages. Comprehensive testing was conducted on the corresponding specimens after different ages of curing. The ECC specimen dimensions were presented in Table 4.
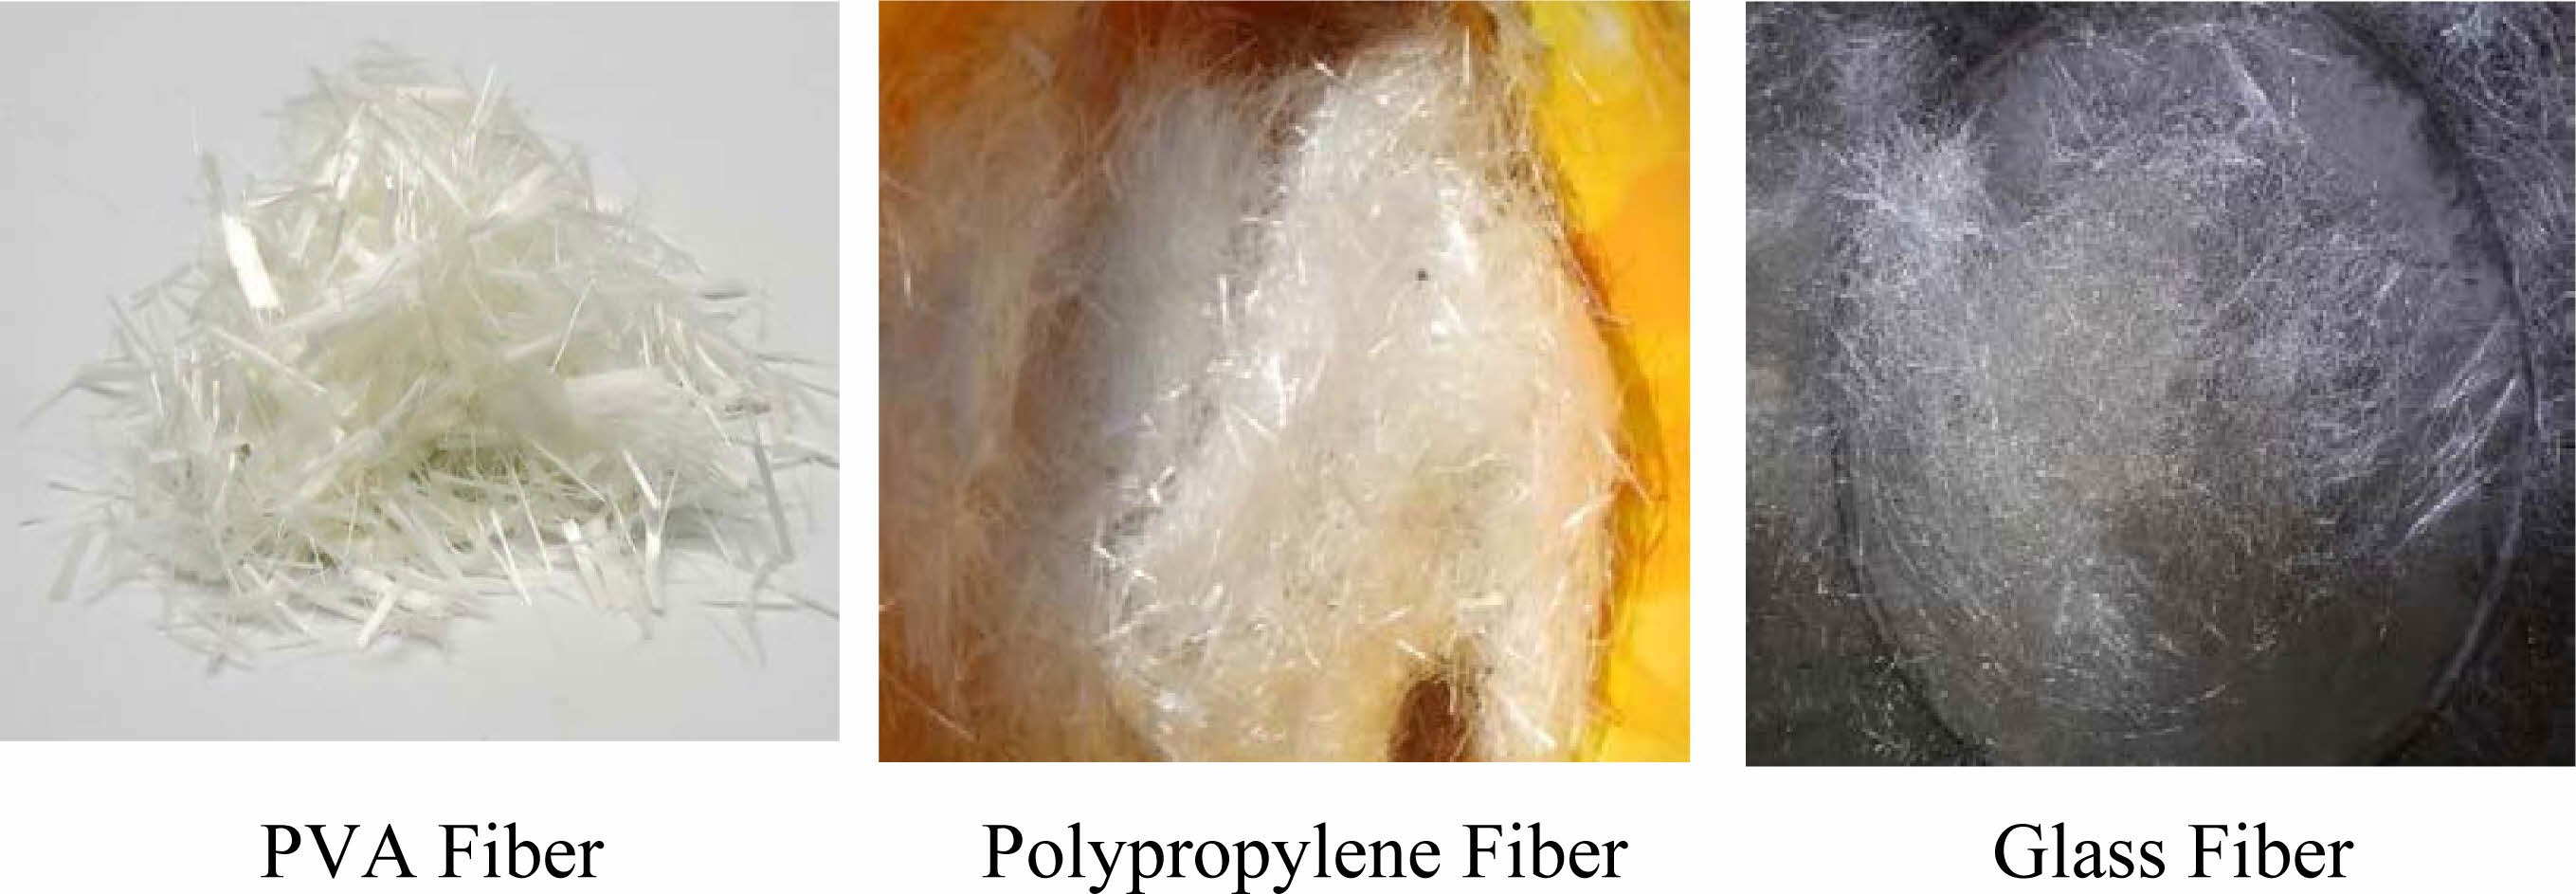
|
Fig. 1 Synthetic fibers. |
Compressive strength test
A combined total of 54 ECC mortar specimens, encompassing both mono and hybrid fiber types, were casted using molds. Three specimens from each mix were casted and subjected to hydration for curing periods of 7, 14, and 28 days Subsequently, these specimens were tested using a 2000 kN testing machine, as depicted in Fig. 2. The average compressive strength was determined by taking the mean value of these test results.
Direct tensile strength test
In the laboratory, dog bone specimens were fabricated, as shown in Fig. 3. A total of 54 dog bone both mono and hybrid fiber ECC specimens were casted for this study. Three specimens were cast from each mixture and subjected to hydration for curing periods of 7, 14, and 28 days. After completing the curing process, a 1000 kN universal testing machine was employed to test these specimens. The average direct tensile strength of both mono fiber ECC and hybrid fiber ECC specimens were determined by calculating the mean value of the test results.
Young modulus test
After 7, 14 and 28-day curing period, mono and hybrid fiber ECC specimens were utilized to calculate the Young’s modulus strength. A total of 54-cylinder mono and hybrid fiber ECC specimens were casted for this study. Three specimens were casted and subjected to hydration for curing periods of 7, 14, and 28 days, for each mixture. A dial gauge was inserted into the cylinder, a 200 mm gauge length compressometer was affixed to the specimen, and subsequently, the cylinder was placed inside the compression testing machine. The average Young’s modulus of both mono and hybrid fiber ECC specimens was determined by computing the mean value of the test results.
Impact toughness test
The both mono and hybrid fiber ECC mortar impact toughness was conducted, after 7, 14 and 28 days of curing. The test setup for ECC slab as depicted in Fig. 4. In order to assess the impact count for each mixture, a steel hammer rebound, suspended by a rope, was employed to impact the center of the slab from a height of 1.5 meters repeatedly until the slab reaches failure. These observations were then used to calculate the impact toughness of the both mono and hybrid fiber ECC slab.
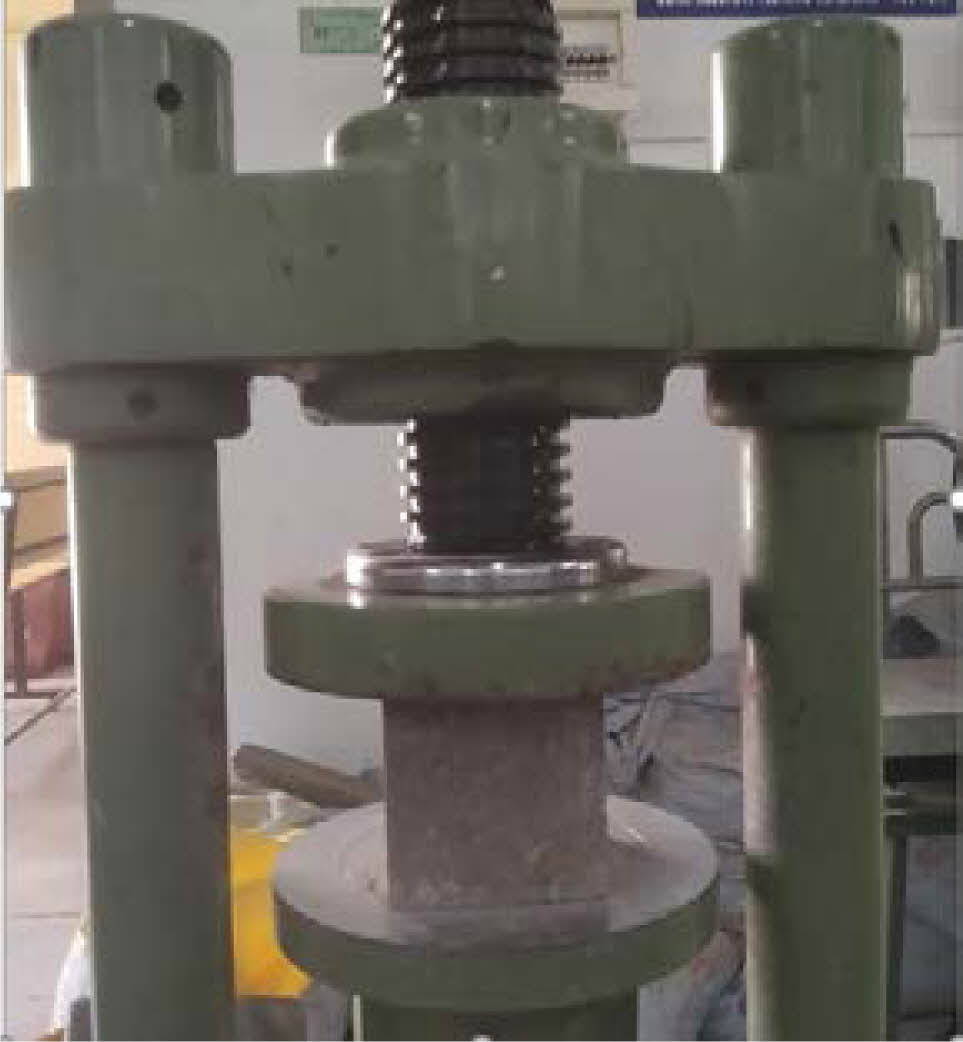
|
Fig. 2 ECC compression strength test setup. |
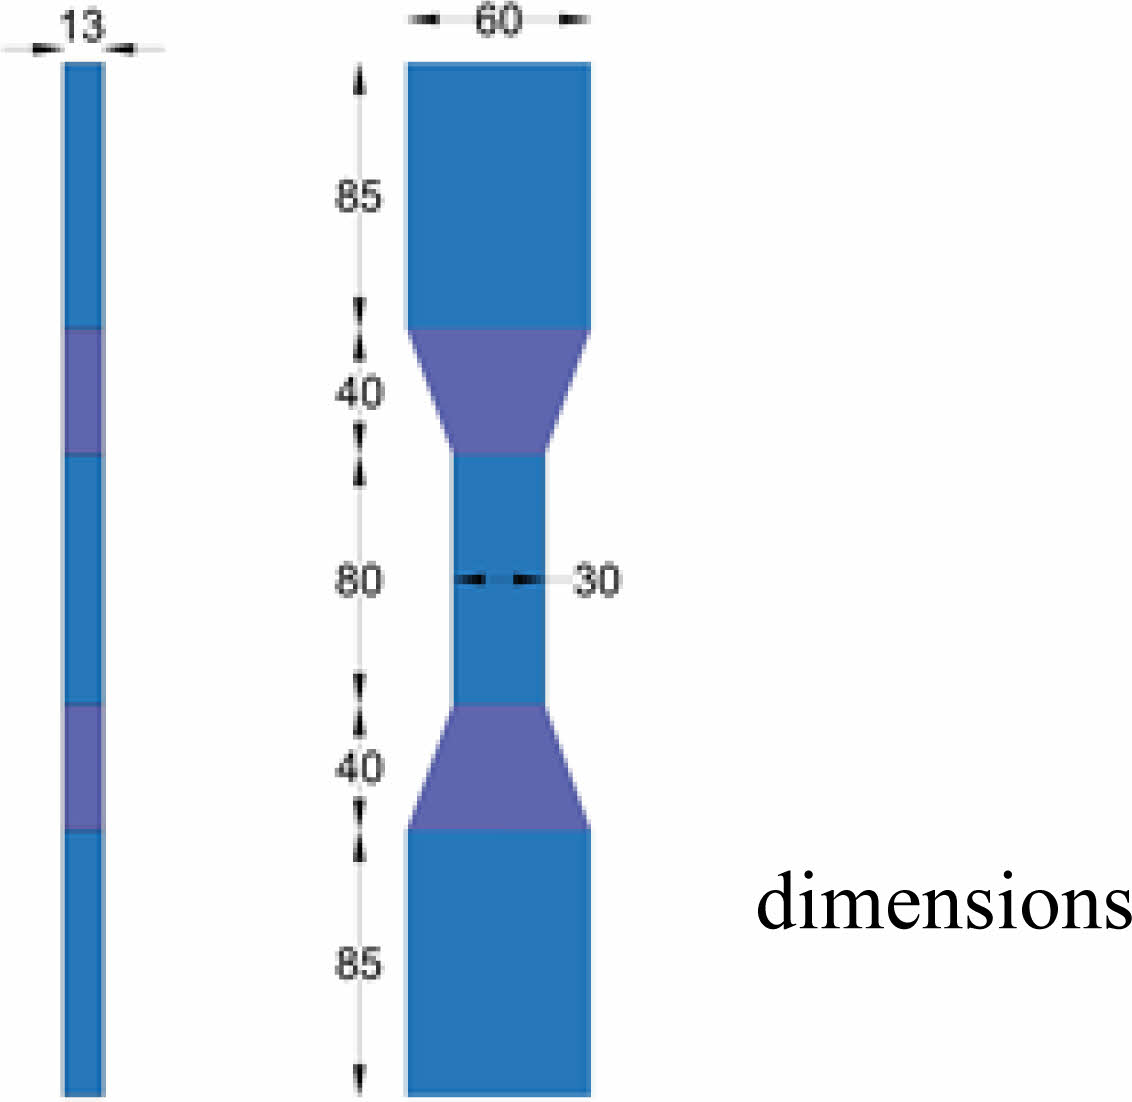
|
Fig. 3 Dog bone specimen dimensions. |
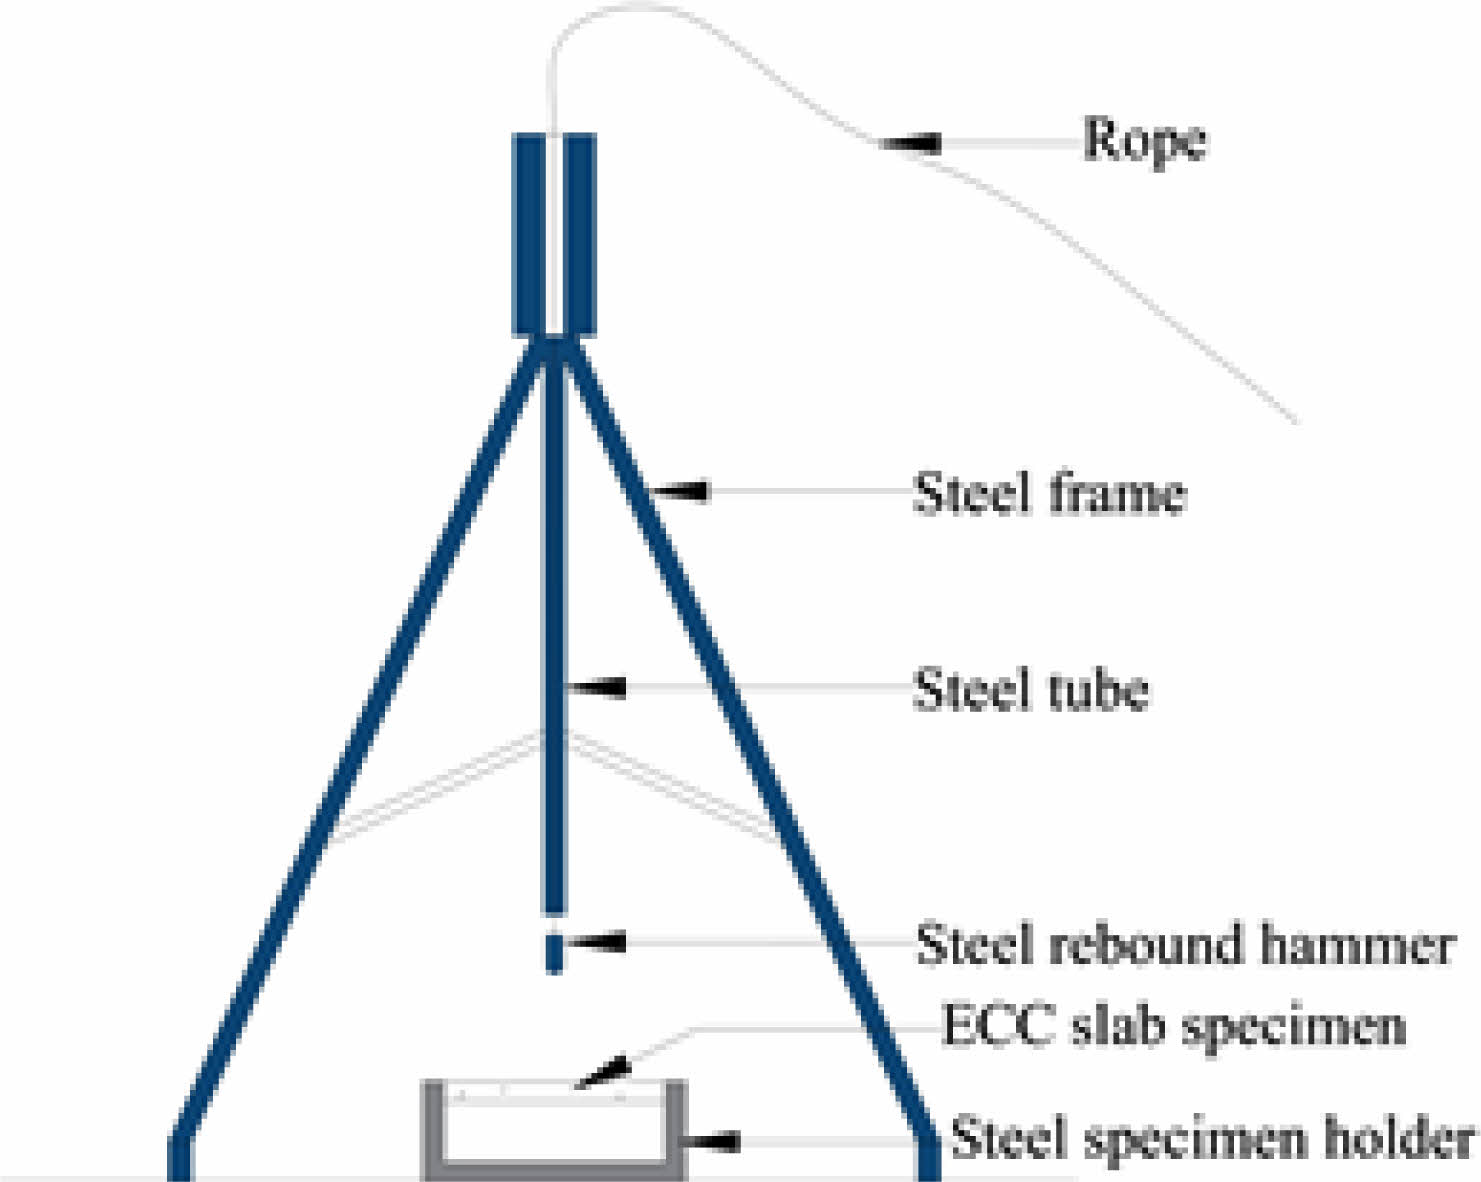
|
Fig. 4 Impact toughness ECC slab test setup. |
Compressive strength (CS)
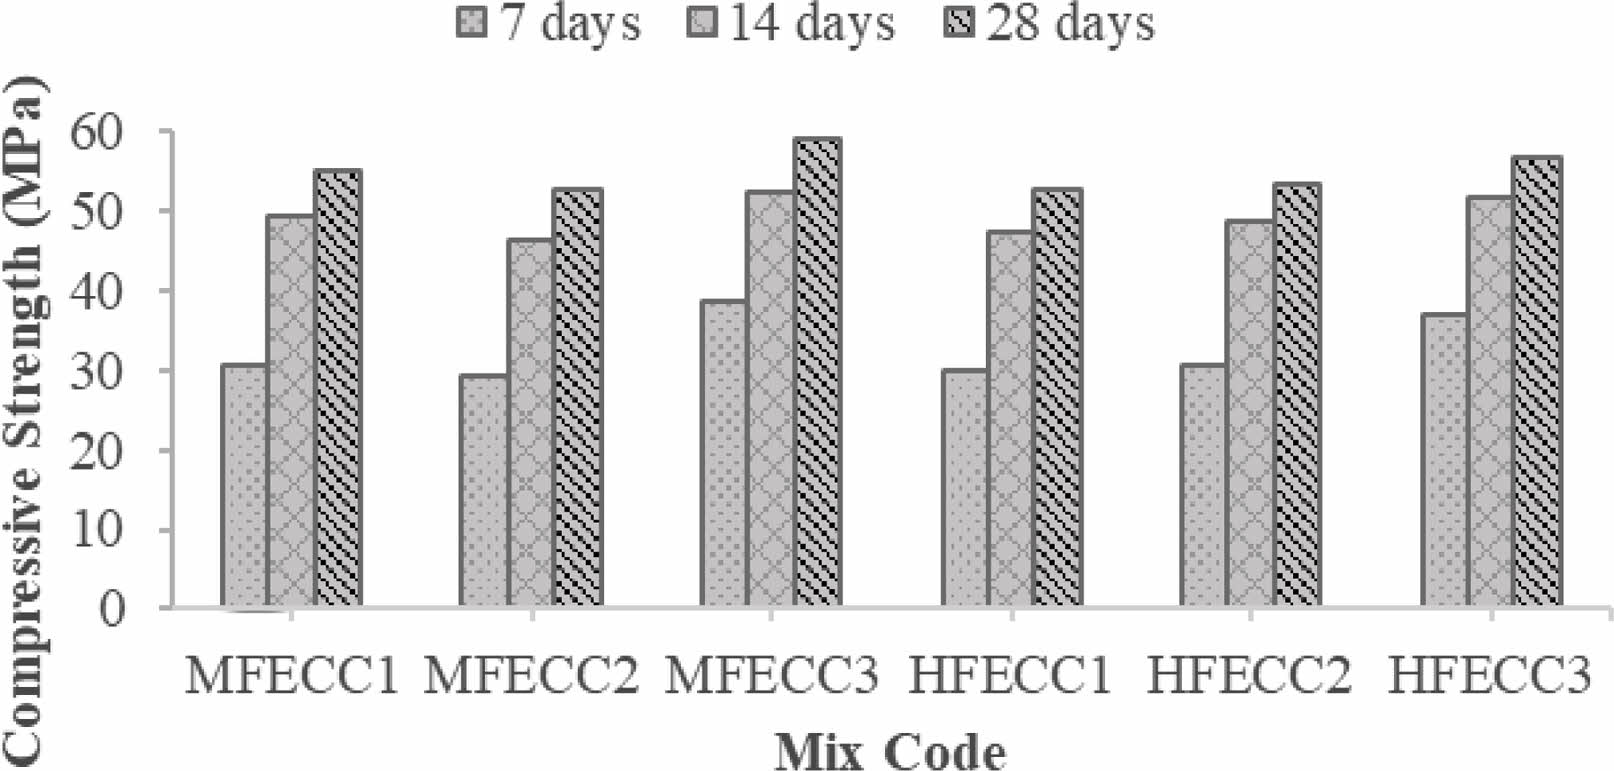
The CS for MFECC and HFECC mixes were exhibited in Fig. 5, at 7, 14, and 28 days. At 7 days, The CS for MFECC and HFECC mixes is in the range of 29.14-38.56 MPa. At 14 days, the CS for MFECC and HFECC mixes ranges from 46.28-52.23 MPa. Finally, after 28 days, the CS of MFECC and HFECC mixes were distributed between 52.46-58.89 MPa. The test results clearly indicate that MFECC3 exhibited a higher CS than MFECC1 and MFECC2, and this behaviour was due to the addition of silica fume and glass fiber. The high tensile strength, young’s modulus, aspect ratio, interfacial bonding properties, and compatibility with the concrete matrix is the main key factor for contributing strength aspects. Additionally, it was evident that HFECC3 exhibited a higher CS compared to HFECC1 and HFECC2, with the inclusion of silica fume with PVA and glass fiber being responsible for this elevated CS. The expected CS range for ECC mix falls approximately between 20 to 95 MPa [32, 33].
Direct tensile strength (DTS)
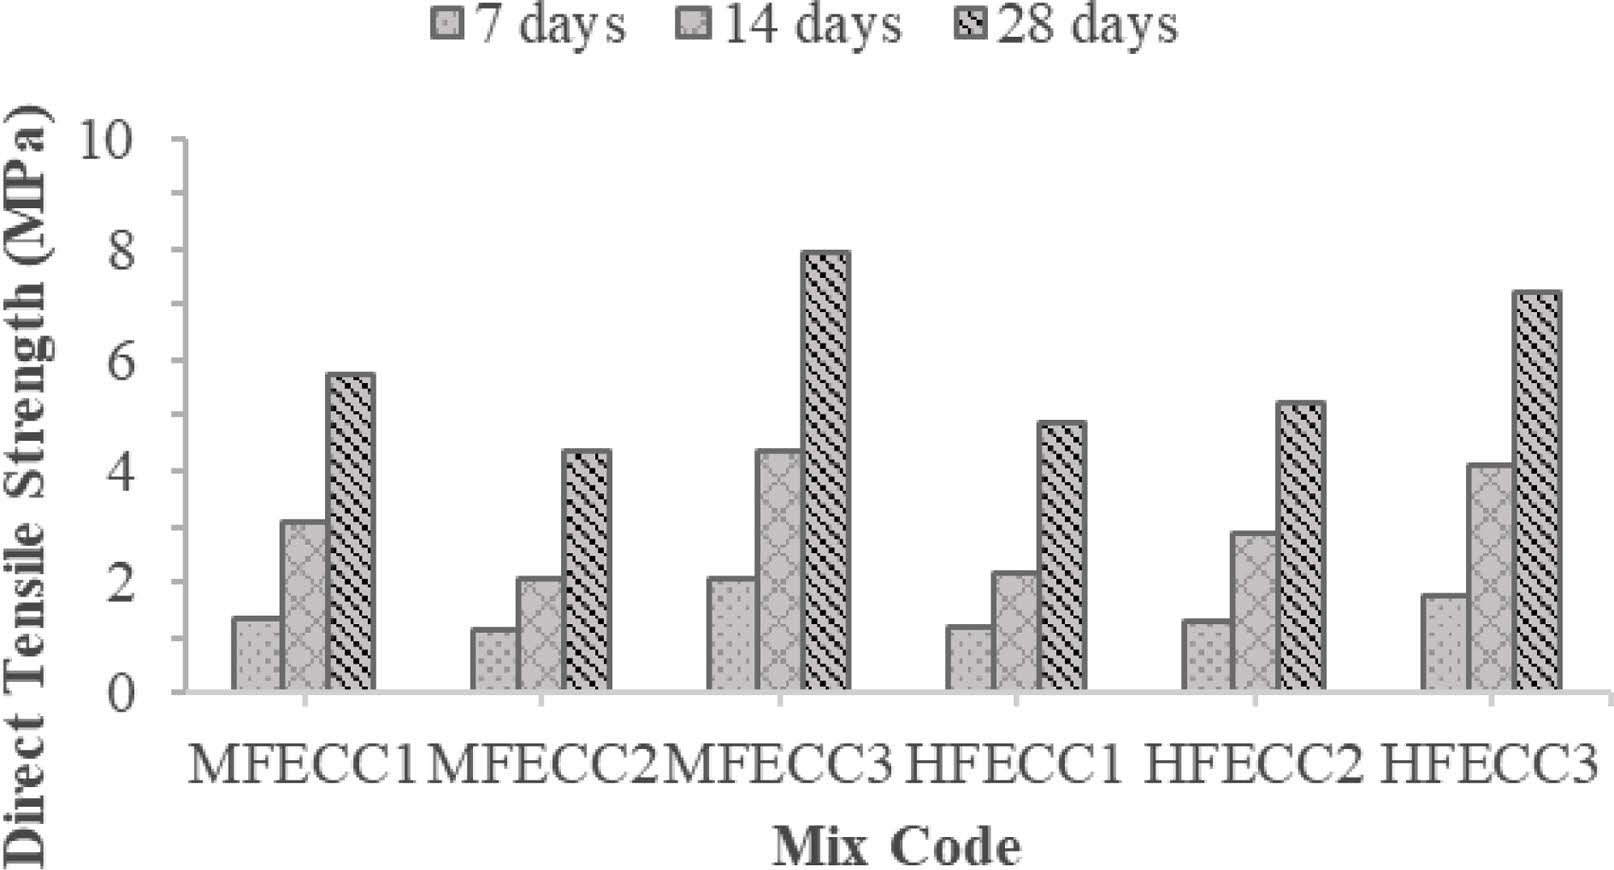
In general, ECC was primarily employed for repair purposes, but its utilization expanded to structural components owing to its characteristics such as tensile strain hardening, mitigation of crack and flexural behavior. At 7, 14, and 28 days, the DTS variation of MFECC and HFECC were shown in Fig. 6. At 7 days, the DTS of ECC in MFECC and HFECC mixes falls within the range of 1.14-2.05 MPa, with MFECC3 achieving the highest value. At 14 days, the DTS of ECC in MFECC and HFECC mixes ranges from 2.05-4.36 MPa, with MFECC3 leading in performance, Finally, at 28 days, the DTS of ECC in MFECC and HFECC mixes were distributed between 4.36-7.96 MPa, with MFECC3 exhibiting the highest tensile strength. At 28 days, MFECC2 exhibits a relatively lower DTS of 4.36 MPa than MFECC1 and MFECC3. The highest direct tensile strength recorded by HFECC3 at 28 days can be attributed to the synergistic effects of the hybrid fiber combination (PVA and glass fibers), optimized fiber volume fractions, high tensile strength, young’s modulus, enhanced crack bridging capabilities and improved interfacial bonding is a key factors. Furthermore, HFECC1 displays lower DTS of 4.85 MPa than HFECC2 and HFECC3. These findings were consistent with the anticipated range for the ultimate tensile strength of the ECC mixture, which was typically expected to be between 4-12 MPa following a 28-day curing period [34, 35].
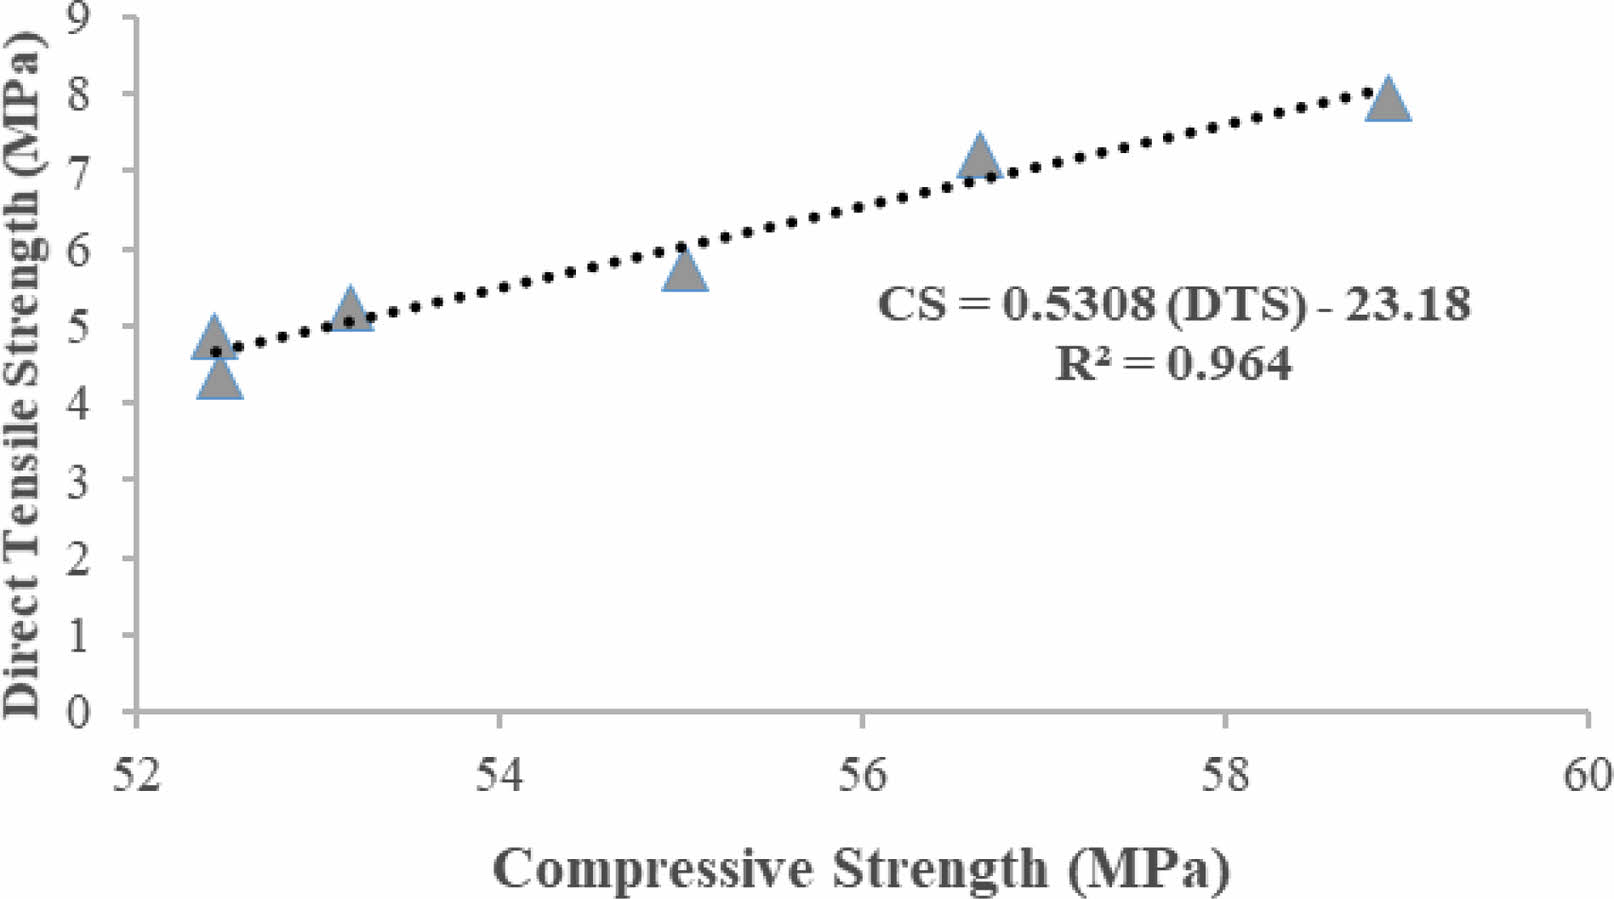
A regression equation has been established, relating the CS and DTS of both MFECC and HFECC at the 28-day, as illustrated in Fig. 7. The high coefficient of determination (R2=0.964) signifies an excellent fit, accounting for 96.4% of the experimental data.
Young’s modulus (YM)
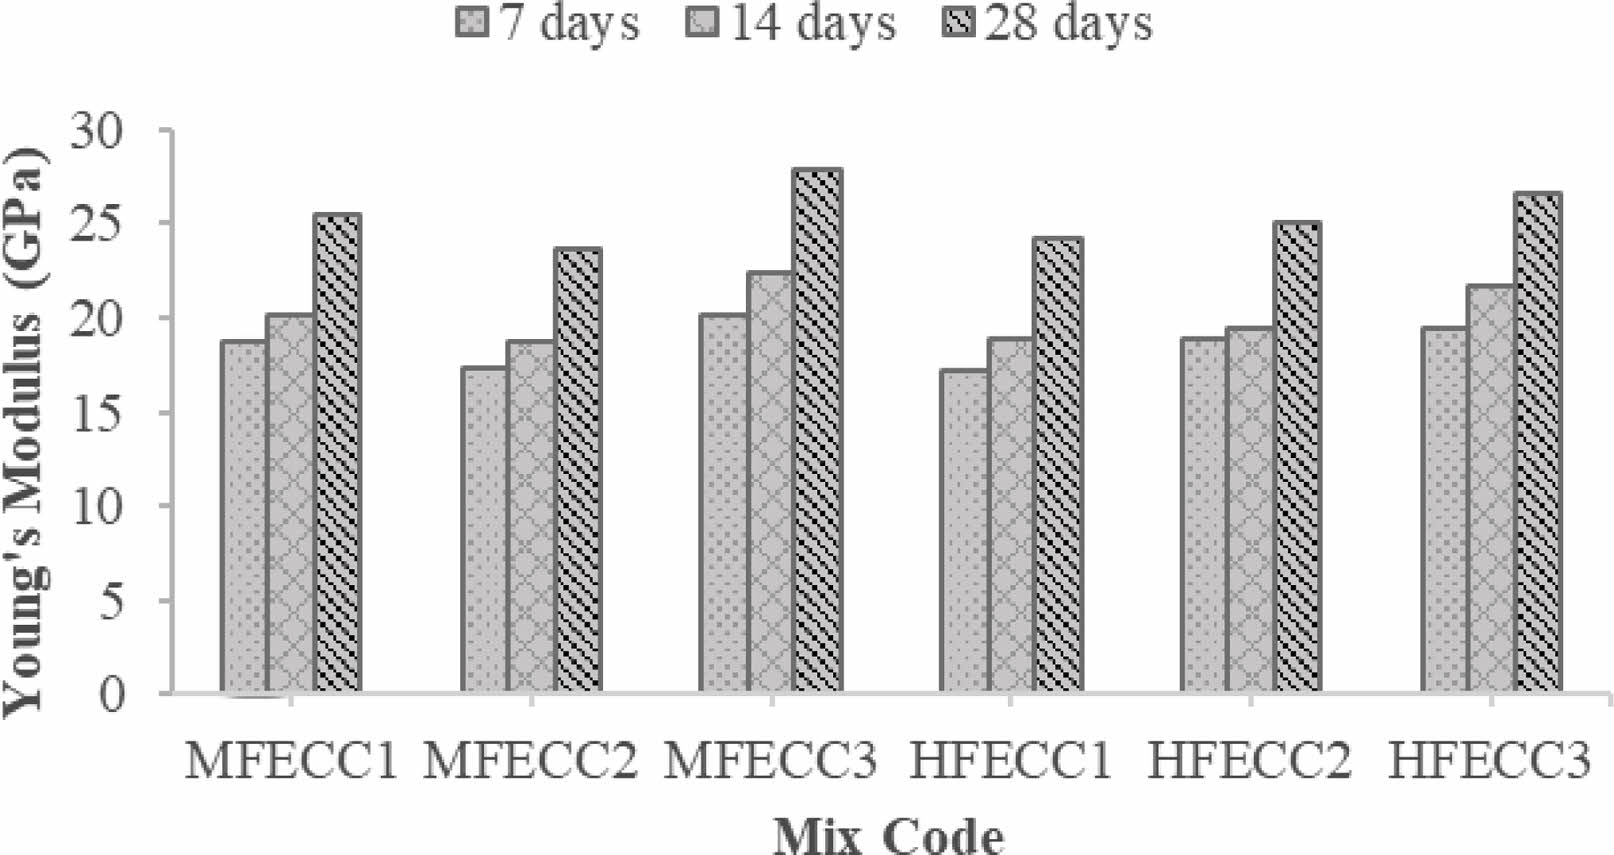
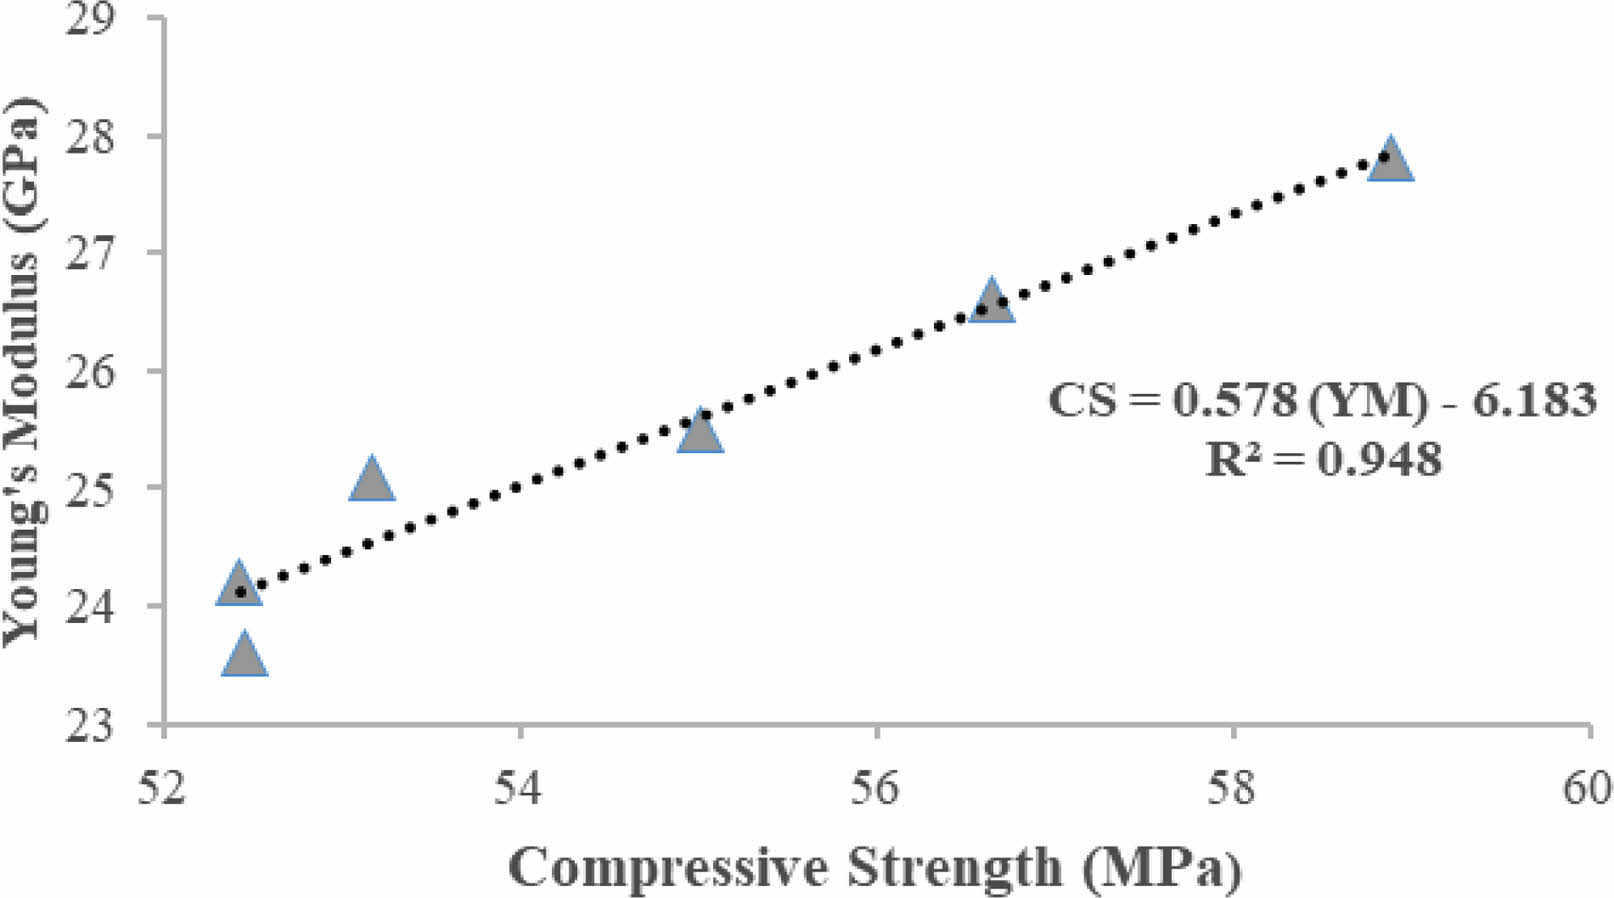
At 7, 14, and 28 days, the YM variation of MFECC and HFECC mixes were shown in Fig. 8. At 7 days, the YM for MFECC and HFECC mixes falls within a relatively narrow range of 17.4-20.1 MPa, with MFECC3 exhibiting the highest value. The differences in modulus among them were notably small. At 14 days, the YM for MFECC and HFECC mixes ranges from 18.7-22.4 MPa, with MFECC3 once again leading the way. Finally, after 28 days, the YM for MFECC and HFECC mixes is distributed between 23.6-27.8 MPa, with MFECC3 consistently demonstrating the highest values. At 28 days, MFECC2 displays a relatively less YM of 23.6 GPa than MFECC1 and MFECC3. Moreover, HFECC1 displays a relatively less YM of 24.2 GPa than HFECC2 and HFECC3. This indicates that the incorporation of PP in the hybridization reaction has an impact on the YM strength. Similar trend was observed by [36].
At 28 days, a regression equation has been established, relating the CS and YM strength of both MFECC and HFECC, as shown in Fig. 9. The high coefficient of determination (R2=0.948) signifies an excellent fit, accounting for 94.8% of the experimental data.
Impact toughness (IT)
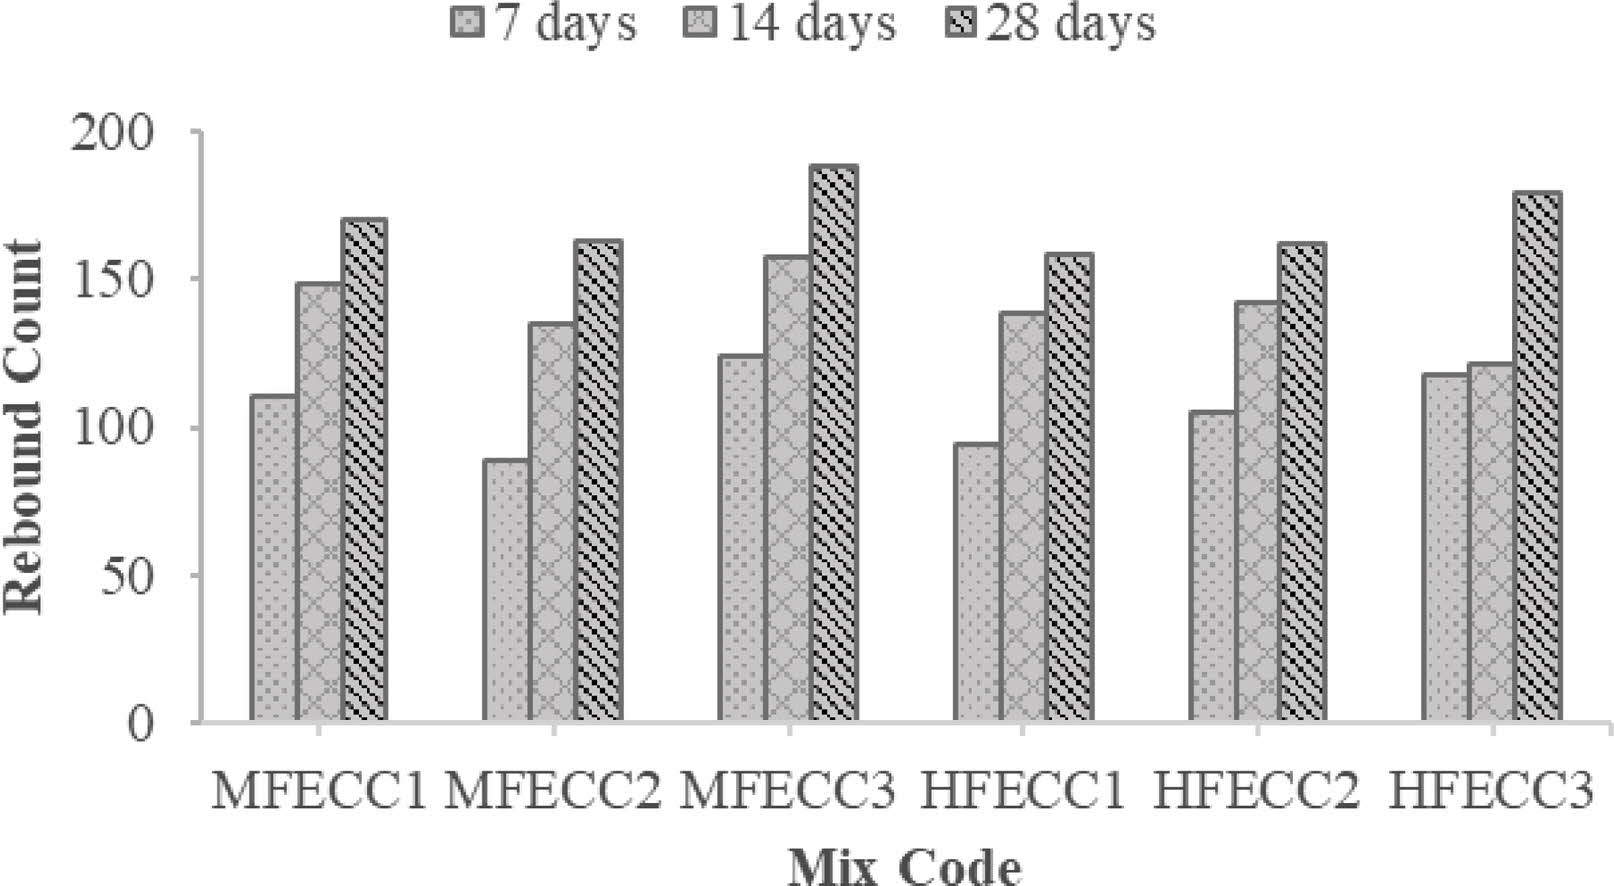
The rebound count data for both MFECC and HFECC were illustrated in Fig. 10 at 7, 14, and 28 days. Following 7 days of curing, the rebound count for all mixtures falls within the range of 89-124 counts. At the 14 day of curing, the rebound count for all mixes ranges from 135-157 counts. Lastly, after 28 days of curing, the rebound count for all mixtures were distributed between 163-188 counts.
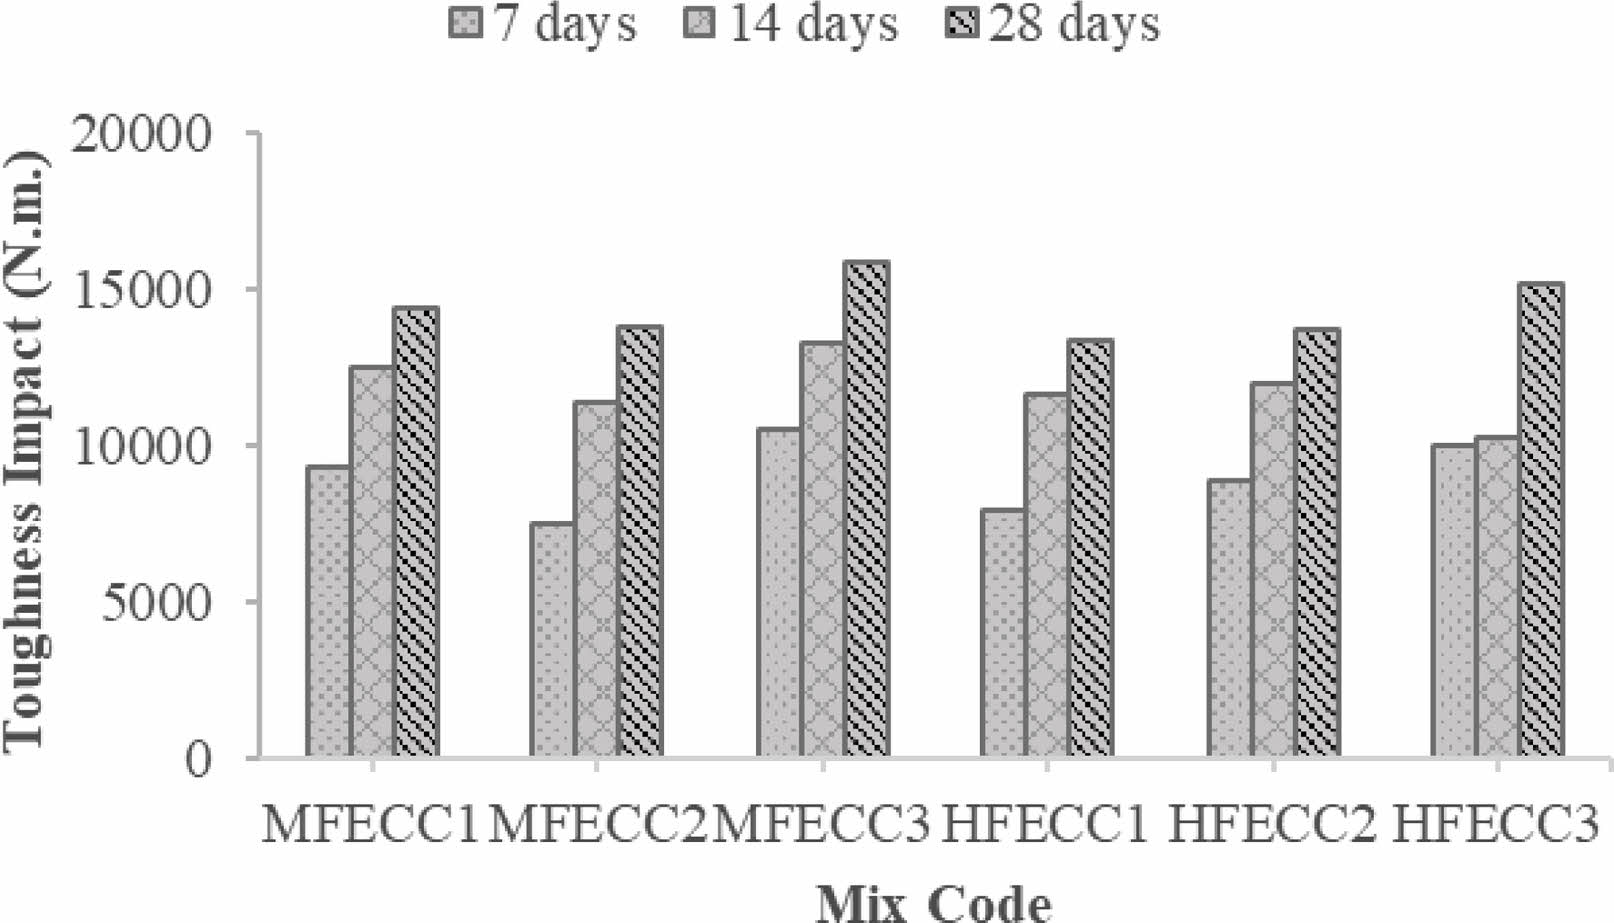
At 7, 14 and 28 days of curing, the IT results for both MFECC and HFECC were illustrated in Fig. 11. Following 7 days of curing, the IT values for MFECC and HFECC mixes fall within the range of 7517-10474 N.m. At 14 days of curing, the IT for MFECC and HFECC mixes varies from 11403-13261 N.m. Ultimately, after 28 days of curing, the IT of MFECC and HFECC mixes were observed to span between 13768-15879 N.m. At 28 days, MFECC2 displays a relatively higher IT of 15879 N.m. than other mixes, which was due to the addition of silica fume with glass in fiber in ECC.
|
Fig. 5 CS results for both MFECC and HFECC |
|
Fig. 6 DTS results for both MFECC and HFECC. |
|
Fig. 7 Regression equation between CS and DTS of both MFECC and HFECC. |
|
Fig. 8 YM results for both MFECC and HFECC. |
|
Fig. 9 Regression equation between CS and YM of both MFECC and HFECC. |
|
Fig. 10 Rebound count results for both MFECC and HFECC. |
|
Fig. 11 IT results for both MFECC and HFECC |
Based on the findings from the test results, the following conclusions were made:
•At 28 days, among the MFECC mixes, MFECC3 exhibits the highest compressive strength of 58.89 MPa than MFECC1 and MFECC2 mixes. In the case of hybridized mixes, HFECC3 records the highest compressive strength of 56.65 MPa than HFECC1 and HFECC2 mixes.
•Among the MFECC mixes, MFECC3 exhibits the highest direct tensile strength of 7.96 MPa at 28 days than MFECC1 and MFECC2 mixes. In the hybridized mixes, HFECC3 records the highest direct tensile strength of 7.21 MPa than HFECC1 and HFECC2 mixes.
•In the realm of MFECC mixes, MFECC3 showcases the highest young’s modulus at 28 days, registering an impressive 27.8 GPa, outpacing both MFECC1 and MFECC2 mixes. Similarly, within the hybridized mix category, HFECC3 achieves the highest young’s modulus strength, registering an impressive 26.6 GPa, surpassing HFECC1 and HFECC2 mixes.
•In both, PP fiber mixes and the combination of PP fiber with PVA fiber, there was a notable decrease in the compressive, direct tensile, Young’s modulus, and impact toughness strength at all the ages.
•In MFECC, it becomes evident that PVA fiber and glass fiber exhibit superior strength aspects than PP fiber. Further, in HFECC, the analysis of mechanical properties reveals that PVA fiber with glass fiber and PP fiber with glass fiber enhanced strength characteristics in comparison to PVA fiber with PP fiber.
The authors wish to acknowledge the Department of Civil Engineering, K.S. Rangasamy College of Technology, Tiruchengode, Tamil Nadu for the facility and support extended for the research work.
- 1. S. Sridhar, S. Nandhakumar, M. Nallusamy, and R. Maguteeswaran, J. Ceram. Process. Res. 23[4] (2022) 498-502.
-

- 2. S. Shinoj, R. Visvanathan, S. Panigrahi, and M. Kochubabu, Ind. Crops Prod. 33[1] (2011) 7-22.
-

- 3. G. Di Bella, V. Fiore, G. Galtieri, C. Borsellino, and A. Valenza, Constr. Build. Mater. 58 (2014) 159-165.
-

- 4. K.M. Senthilkumar, N. Kathiravan, L. Girisha, and M. Sivaperumal, J. Ceram. Process. Res. 23[4] 541-545.
-

- 5. H. Kasagani and C. Rao, Cem. Wapno, Beton. 21 (2016) 361-372.
-

- 6. H.R. Pakravan, M. Latifi, and M. Jamshidi, J. Ind. Text. 45[5] (2016) 637-651.
-

- 7. H.C. Wu, P. Sun, and J. Teng, J. Mater. Civ. Eng. 22[6] (2010) 572-579.
-

- 8. T.H. Ahn and T. Kishi, J. Ceram. Process. Res. 16[1] (2015) 117-123.
-

- 9. V.C. Li, ACI Struct. J. 206 (2002) 373-400.
- 10. E.H. Yang, Y. Yang, and V.C. Li, ACI Mater. J. 104 (2007) 620.
- 11. S.F.U. Ahmed and H. Mihashi, Mater. Struct. 44[6] (2011) 1179-1191.
-

- 12. S.F. Ahmed, M. Maalej, and P. Paramasivam, J. Mater. Civ. Eng. 19[7] (2007) 527-539.
-

- 13. V.C. Li, “Engineered Cementitious Composites (ECC) Material, Structural, and Durability Performance” (Concrete Construction Engineering Handbook, 2002).
-

- 14. A. Krishnaraja, S. Anandakumar, and M. Jegan, Cem. Wapno, Beton. 23[6] (2018) 479-486.
-

- 15. K. Ramasamy, S. Kandasamy, S. Anandakumar, and S.M. Jegan, Cem. Wapno, Beton. 24 (2019) 479-486.
- 16. P. Loganathan, R. Mohanraj, S. Senthilkumar, and K. Yuvaraj, Rev. Constr. 21[3] (2022) 678-691.
-

- 17. M. Shivaperumal, R. Thirumalai, S. Kannan, and Y.K.S.S. Rao, J. Ceram. Process. Res. 23[3] (2022) 404-408.
-

- 18. X.R. Cai, B.Q. Fu, and S.L. Xu, Adv. Mat. Res. (2011) 261-263.
-

- 19. M. Kunieda and K. Rokugo, J. Adv. Concr. Technol. 4[1] (2006) 19-33.
-

- 20. R. Zhang, K. Matsumoto, T. Hirata, Y. Ishizeki, and J. Niwa, Eng. Struct. 86 (2015) 146-156.
-

- 21. K. Yuvaraj and S. Ramesh, Int. J. Coal Prep. Util. (2022) 1-15.
-

- 22. C. Thamilpriyaa and G. Elangovan, J. Ceram. Process. Res. 24[3] (2023) 554-559.
-

- 23. K. Yuvaraj, and S. Ramesh, Cem. Wapno. Beton. 3 (2021) 253-262.
-

- 24. D. Velumani, P. Mageshkumar, and K. Yuvaraj, Pol. J. Environ. Stud. 33[1] (2024).
-

- 25. A.A.M. Fazli, S.K. Zakariaa, N.I.N.A. Rahmana, S.Z. Salleha, A.H. Yusoffa, N.A. Sallehb, M.A.A. Taibc, F. Budimand, A. Alia, and P.T. Teo, J. Ceram. Process. Res. 21[6] (2020) 667-682.
-

- 26. M. Khan and M. Ali, Constr. Build. Mater. 203 (2019) 174-187.
-

- 27. A. Tarawneh, G. Almasabha, R. Alawadi, and M. Tarawneh, Struct. 32 (2021) 1015-1025.
-

- 28. M. Khan, M. Cao, and M. Ali, J. Build. Eng. 30 (2020) 101-272.
-

- 29. P. Rashiddadash, A.A. Ramezanianpour, and M. Mahdikhani, Constr. Build. Mater. 51 (2014) 313-320.
-

- 30. J. Esfandiari and O. Heidari, J. Struct. Constr. Eng. 8 (2021) 130-150.
-

- 31. N. Arivusudar and S. Suresh Babu, Cem. Wapno. Beton. 25[4] (2020) 282-291.
-

- 32. V.C. Li, J. Adv. Concr. Technol. 1 (2003) 215-230.
-

- 33. M. Sivaraja, and S. Kandasamy, J. Reinf. Plast. Compos. 27[2] (2008) 135-144.
-

- 34. M. Sahmaran, K. Matsumoto, T. Hirata, and Y. Ishizeki, J. Mater. Civ. Eng. 23 (2011) 1735-1745.
- 35. S.J. Jang, D.H. Kang, K.L. Ahn, and H.D. Yun, Comput. Eng. Sci. 8[17] (2015) 757-764.
-

- 36. Y. Heo and K. Kim, J. Ceram. Process. Res. 16[1] (2015) 28-32.
-

 This Article
-
2024; 25(2): 254-260
Published on Apr 30, 2024
- 10.36410/jcpr.2024.25.2.254
- Received on Jan 17, 2024
- Revised on Feb 26, 2024
- Accepted on Feb 27, 2024
 Services
- Abstract
introduction
research significance
materials and methods
test methods
result and discussion
conclusion
- Acknowledgements
- References
- Full Text PDF
Shared
 Correspondence to
- K. Yuvaraj
-
Department of Civil Engineering, K.S. Rangasamy College of Technology, Tiruchengode, Tamil Nadu, India
Tel : +914288-274741 Fax: 04288-274745 - E-mail: yuvarajk@ksrct.ac.in




 Copyright 2019 International Orgranization for Ceramic Processing. All rights reserved.