


- Enhancing the optical, magnetic, and photoluminescence properties of CaAl2O4 powders by adding iron, nickel, copper, and zinc
Thanit Tangcharoen*
Department of Basic Science and Physical Education, Faculty of Science at Sriracha, Kasetsart University, Sriracha Campus, Chonburi 20230, Thailand
This article is an open access article distributed under the terms of the Creative Commons Attribution Non-Commercial License (http://creativecommons.org/licenses/by-nc/4.0) which permits unrestricted non-commercial use, distribution, and reproduction in any medium, provided the original work is properly cited.
In this study the synthesis of nanocrystalline pure calcium aluminate (CaAl2O4) powders along with its composites involving iron (Fe), nickel (Ni), copper (Cu), and zinc (Zn) ions is carried out via the sol-gel auto combustion method. The structures, chemical bonds, morphologies, particle sizes, and optical, magnetic, and fluorescence properties of the calcined powders produced were examined using X-ray diffraction (XRD), Fourier transform infrared spectroscopy (FT-IR), scanning electron microscopy (SEM), transmission electron microscopy (TEM), UV-visible diffuse reflectance spectroscopy (UV-DRS), vibrating sample magnetometry (VSM), and photoluminescence spectroscopy (PL). The full formation of the nanocomposites Fe2O3/CaAl2O4, NiO/CaAl2O4, CuO/CaAl2O4, and ZnO/CaAl2O4 with no impurity phases can be observed in the XRD and FT-IR results. These modified samples exhibited superior textural qualities in comparison to pure CaAl2O4 according to the SEM and TEM analyses, and it was demonstrated via UV-DRS analysis that the absorption and reflection levels could be enhanced in the presence of a transition metal when compared to the ultraviolet, visible, and infrared spectra of the pure sample. The bandgap energy (Eg) values for the modified samples were in the range of 1.45 eV to 5.70 eV, whereas the value for the pure sample was 4.56 eV. The PL spectra for the pure sample revealed ultraviolet, violet, blue, green, yellow, and orange emission bands in the range of 240 nm to 600 nm, although substantial changes in the emission intensity were apparent as was the case when transition metal ions were present. The VSM results indicated that the addition of magnetic ions could enable the tuning of the calcium aluminate diamagnetism to ferromagnetism.
Keywords: CaAl2O4, Transition metal ions, Sol-gel auto combustion, Diethanolamine, Magnetic materials, Photoluminescence.
Among the various compounds of the calcium oxide-aluminum oxide (CaO-Al2O3) system, monocalcium aluminate, CaAl2O4, or “krotite”, has received significant attention [1, 2]. It represents one of the mineral phases of calcium aluminate cement and plays an important role for construction applications, often serving as a binder in steel industry refractory castable on account of its excellent refractory characteristics [3, 4]. Furthermore, calcium aluminate-based materials have recently been finding new uses, such as in producing biomaterials used in bone grafts as a result of their biocompatibility along with their physical and mechanical properties [5, 6]. In addition, CaAl2O4 has been used in phosphor materials as a result of excellent luminescent efficiency, durability, and chemical stability [7]. Calcium aluminate/diatomaceous earth composites have also been employed as a reactive filter material used in aqua defluoridation [8]. CaAl2O4 has generally been obtained via solid-state sintering reactions, but this approach demands high temperatures and requires the existence of undesirable phases including unreacted lime, alumina, and intermediate mayenite [9]. For this reason, alternative techniques such as the sol-gel method, Pechini method, mechanochemical treatments, and high energetic attrition milling have been used as a means to prepare calcium aluminates. These methods allow lower synthesis temperatures and can generate products of the highest purity. However, the techniques can be rather complicated [10]. In contrast, the sol-gel auto combustion approach is a novel technique which is cheap, due to the short duration and high energy efficiency, and offers products with a high degree of purity [11-13]. The sol-gel approach has therefore been widely used in producing ceramics, ceramic matrix composites, metal matrix composites, and intermetallics [14]. When the approach is used in combination with other methods, it is possible to produce particularly dense materials [15]. The potential for altering CaAl2O4 properties through the addition within their crystal structures of transition and rare-earth metals is well known [16]. Many researchers have examined the effects of such additions to CaAl2O4, but the emphasis has usually been placed upon photoluminescence properties, whereas the optical, structural, or magnetic properties have often been overlooked [17, 18]. For instance, Zhai et al. [19] introduced dysprosium (Dy) ions to the structure of CaAl2O4 via the sol-gel combustion method, generating significant changes in photoluminescence (PL) properties, thermoluminescence (TL) properties, and afterglow. Despite the preparation of these Dy-doped CaAl2O4 samples making use of Dy3+ concentrations of only 0.1 to 5.0 mol%, the properties were clearly apparent. The higher doped sample exhibited greater luminescence intensity at 340 nm, 482 nm, and 574 nm than was the case for the lower doped sample. Meanwhile, Nkuna et al. [20] synthesized calcium aluminate containing yttrium (Y-doped CaAl2O4) via the sol-gel method, and subsequently revealed that the sample containing 0.1% Y3+ showed strong emission potential, with a bright blue-pink color visible, whereas the other samples produced colors transiting from blue to green in a white vertex region. Consequently, the material may be considered suitable for applications in energy storage and photoluminescence. In similar work, Faramawy et al. [21] added lanthanum (La3+) ions to CaAl2O4, and revealed that thermoluminescence intensity is directly influenced by the La3+ content. Meanwhile, structural parameter changes showed minor fluctuations. It was not, however, possible to establish the synthesis conditions which would optimize the performance since the only La3+ ion concentration tested was 0.1%. The same technique was then used by Faramawy et al. in the synthesis ofmagnesium/lanthanum co-doped calcium aluminate nanophosphors (CaAl2O4:La3+:Mg2+) while employing a range of Mg2+ concentrations. It was found that as the Mg2+ ion concentration rose, there was a related rise in integrated emission intensity, although there was no change observed in the structural parameters. The addition of Cu2+ ions was investigated by Kumar et al. [22], who studied how the optical, structural, and morphological properties of Ca1-xCuxAl2O4 nanoparticles prepared via the simple combustion approach were affected, along with the electrical conductivity. The results revealed a gradual decline in lattice volume and crystallite size as the Cu2+ content increased. However, the X-ray density values presented an opposing trend, while electrical conductivity rose substantially from 0.0026 S/cm to 0.0515 S/cm due to the improvements in charge carrier mobility efficiency along with metallic Cu+ ion migration. There were no reports, however, describing the optical, fluorescence, and magnetic qualities. Silva et al. [23]explained the effects of supporting calcium aluminate samples with nickel or iron ions (Ni-Fe/CaAl2O4), noting an increase in the chemical loop reactions of these samples as the pore volume and surface area also increased. Few studies are evident in the literature which compare the morphology, structural evolution, or magnetic, optical, and photoluminescence properties of synthesized CaAl2O4 powders which have been doped with iron, nickel, copper, or zinc. It is important to address this gap, and that future studies obtain the necessary data to achieve a deeper understanding of the properties of calcium aluminate in order that they can be better managed to our advantage.
During this study, the sol-gel auto combustion method was employed in the synthesis of pure CaAl2O4 powders along with composites involving ions of iron, nickel, copper, and zinc. The resulting calcined powders were then subjected to analysis through X-ray diffraction (XRD), Fourier transform infrared spectroscopy (FT-IR), scanning electron microscopy (SEM), transmission electron microscopy (TEM), photoluminescence spectroscopy (PL), UV-visible diffuse reflectance spectroscopy (UV-DRS), and vibrating sample magnetometry (VSM) to assess the effects exerted by the presence of the different transition metals upon their structures, chemical bonds, morphologies, and particle sizes, along with their optical, fluorescence, and magnetic properties.
Materials
Various solvents of analytical grade along with analytical grade reagents were employed in the preparation of the samples. All were supplied by Ajax Finechem, and no additional purification was necessary. The main reagents and solvents used included aluminum nitrate nonahydrate (Al(NO3)3·9H2O), calcium nitrate hexahydrate (Ca(NO3)2·4H2O), nickel nitrate hexahydrate (Ni(NO3)2·6H2O), iron (III) nitrate nonahydrate (Fe(NO3)3·9H2O, zinc nitrate hexahydrate
(Zn(NO3)2·6H2O), copper nitrate trihydrate (Cu(NO3)2·3H2O), and diethanolamine, DEA (C4H11NO2).
Preparation of pure and composite powders
This section describes the sol-gel auto combustion method employed in the synthesis of pure CaAl2O4 powders along with composites comprising 50% mol of iron, nickel, copper, and zinc ions (designated as Fe-CA, Ni-CA, Cu-CA, and Zn-CA). To begin, stoichiometric quantities of metal nitrate and aluminum nitrate were dissolved in 100 mL of absolute ethanol to produce a 0.2 M mixed nitrate solution. DEA was then introduced as the fuel using an equivalence ratio (Фe) of oxidizer to fuel. This mixture underwent stirring at a temperature of 200 ºC to permit diethanolamine complexes of the constituent metal ions to be formed along with the occurrence of thermal dehydration. A viscous gel was duly sighted after around 40 minutes, followed by self-ignition and the creation of a dark brown powder. This powder then underwent calcination for 4 hours at a temperature of 1100 ºC.
Characterizations
Various analytical techniques were applied in evaluating the structure, chemical bonds, morphology, and particle sizes, along with the optical, magnetic, and photoluminescence properties of the CA, Fe-CA, Ni-CA, Cu-CA, and Zn-CA powders. Examination of the calcined powders involved the X-ray diffraction (XRD) patterns obtained through the use of a Bruker D8 Advance diffractometer with Ni-filtered CuKα radiation (λ = 1.5406 Å) across a 20° to 80° in increments of 0.02º. To assess the Fourier transform infrared (FT-IR) spectra, the KBr pellet approach was implemented using a Thermo Scientific infrared spectrometer (Nicolet 6700). Internal molecular bonds were then analyzed in the range of 400 cm-1 to 4000 cm-1. Scanning electron microscopy (SEM) was then carried out to evaluate the surface textures of the samples using Quanta 450 FEI equipment. The morphology was then further studied using transmission electron microscopy (TEM, JEOL JEM-2100). Preparation of the TEM specimen was performed through the addition of very small amounts of the powder to ethanol, whereupon the mixture was treated in an ultrasonic bath. Drops of the resulting suspension were then added to a carbon-coated copper grid. A UV-visible diffuse reflectance (UV-DRS) spectrophotometer (Agilent, Cary 5000) was then used to measure the integration of sphere diffuse reflectance across a range of wavelengths from 200 nm to 2000 nm. A Perkin Elmer LS55 Fluorescence spectrophotometer was used to obtain the emission spectra, while the photoluminescence (PL) excitation and room temperature in the range of 240 nm to 600 nm was also determined. Finally, the room temperature assessment of the magnetic hysteresis loops operating at ±10 kOe was carried out using a vibrating sample magnetometer (VSM) (LakeShore Model 7404).
Phase identification and structural analysis
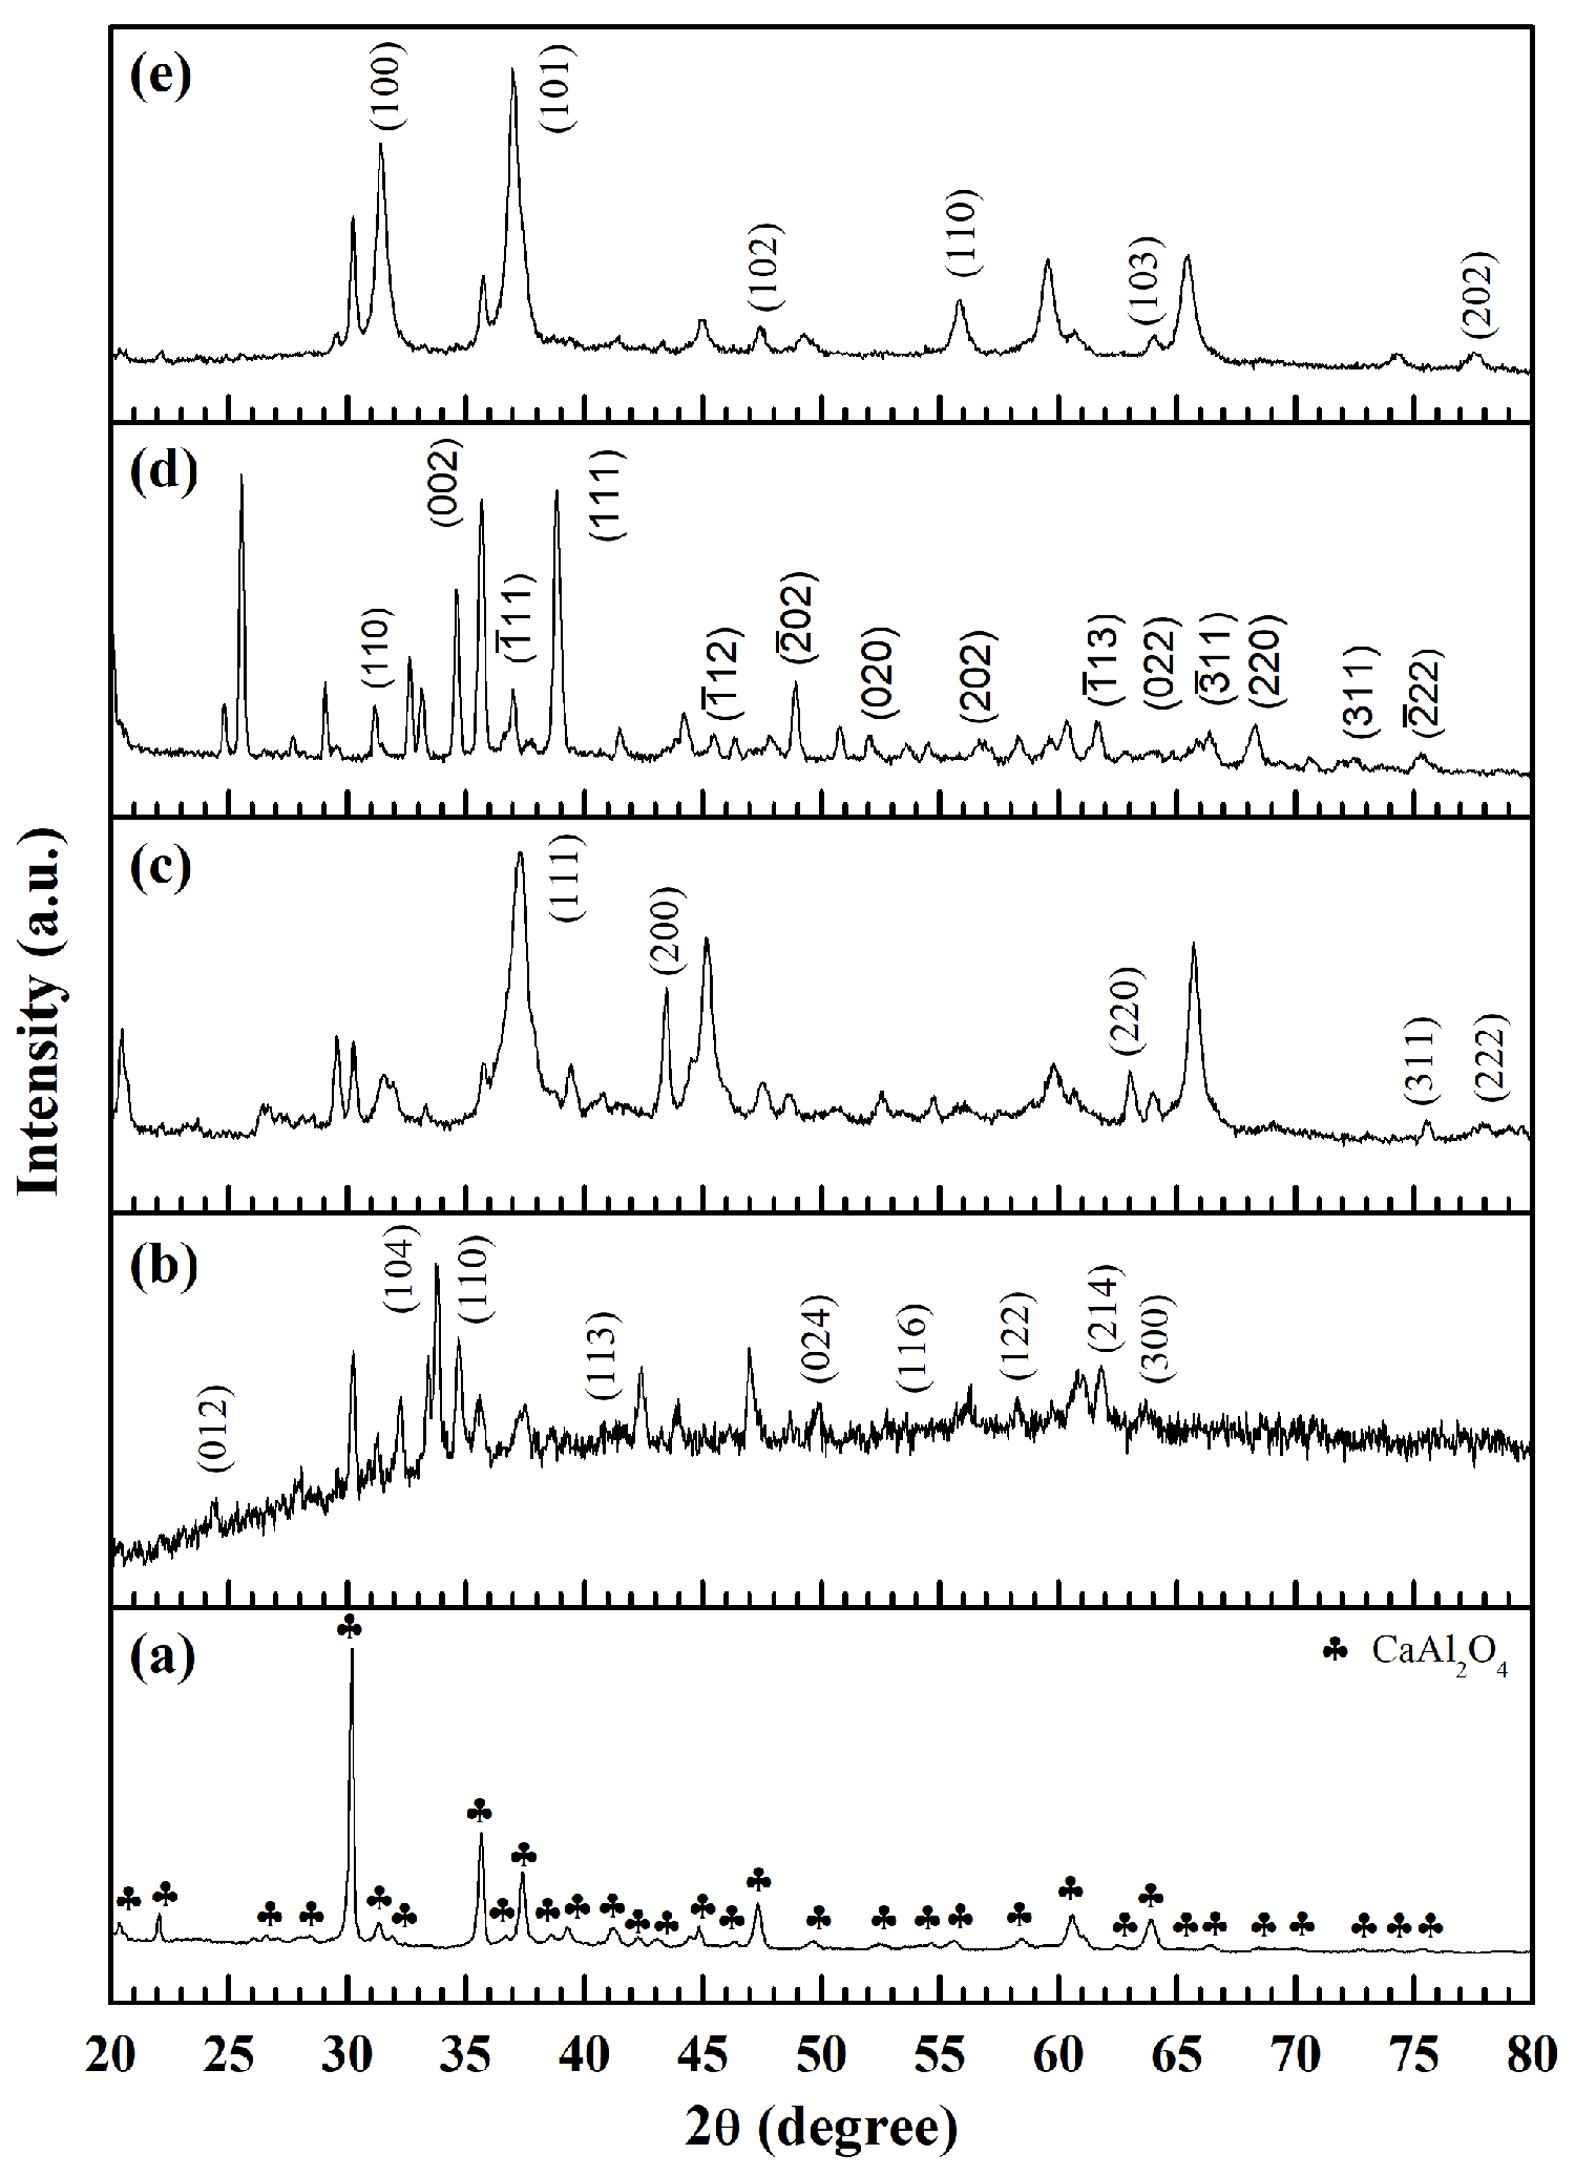
X-ray diffraction (XRD) analysis was employed to examine the crystal structures and phase formations of the pure CaAl2O4 powders along with the modified samples doped with iron, nickel, copper, or zinc ions. Figure shows the resulting patterns associated with CA (Fig. 1a), Fe-CA (Fig. 1b), Ni-CA (Fig. 1c), Cu-CA (Fig. 1d), and Zn-CA (Fig. 1e). For the pure CaAl2O4 sample, significant diffraction peaks could be observed at 2θ values from 20° to 80° which were linked to the (112), (020), (211), (122), (220), (212), (031), (303), (025), (313), (032), (400), (132), (035), (313), (226), (240), (143), (414), (404), (432), (441), (343), (061), (344), and (411) planes [24]. The findings align with expectations from the standard data insofar as a cubic spinel structure (AB2O4) is present within the space group (JCPDS file No. 53-0191 and 23-1036) [25]. The diffraction peaks are both clear and distinctive, indicative of the long-range ordered structure type which would be expected for trimetallic oxide powders. All observed diffraction peaks for the CaAl2O4 phase were apparent in the XRD spectra for each of the modified samples, although the addition of iron content to CaAl2O4 resulted in a reduction in the peak intensity, suggesting that the crystallinity of the modified samples was decreased. Furthermore, diffraction peaks were visible at 2q = 24˚, 33.5˚, 34.5˚, 41˚, 50˚, 53.5˚, 58˚, 62˚ and 64˚ in the diffraction pattern of the Fe-CA sample, clearly revealing the formation of the cubic α-Fe2O3 phase (JCPDS file no. 89-0598) [26]. The diffraction peaks for the nickel-doped sample, Ni-CA, of 2q = 37.3˚, 43.4˚, 63˚, 75.6˚, and 78˚ correspond directly to the (111), (200), (220), (311) and (222) reflections of the face-centered cubic rock salt NiO (JCPDS file no. 22-1189) [27]. The addition of copper ions to the calcium aluminate matrix produced peaks in the XRD diffraction pattern which emerged clearly at 2q = 32.5˚, 35.7˚, 36˚, 39˚, 46.5˚, 49˚, 52.2˚, 57˚, 61.8˚, 65˚, 66.5˚, 68.2˚, 72.5˚, and 75.3˚, linked to the respective Miller indices of (110), (002), (-111), (111), (-112), (-202), (020), (202), (-113), (022), (-311), (220), (311), and (-222). This particular pattern was previously indexed as the tenorite phase of monoclinic CuO (JCPDS file no. 48-1548) [28]. When adding zinc, the diffraction peaks were very distinctive, emerging at 2q = 31.8˚, 37.1˚, 47.6˚, 56˚, 64˚, and 77.2˚, associated with the respective diffraction planes of (100), (101), (102), (110), (103), and (202). These correspond to the zincite phase of hexagonal wurtzite ZnO (JCPDS file no. 36-1451) [29]. In the case of the CaAl2O4 systems doped with transition metals, the XRD patterns indicate peak locations which indicate that the addition of the iron, nickel, copper, or zinc ions does not create a solid solution with calcium aluminate, and instead produces fully formed nanocomposites of Fe2O3/CaAl2O4, NiO/CaAl2O4, CuO/CaAl2O4, and ZnO/CaAl2O4 with no impurity phases.
Chemical bonding analysis
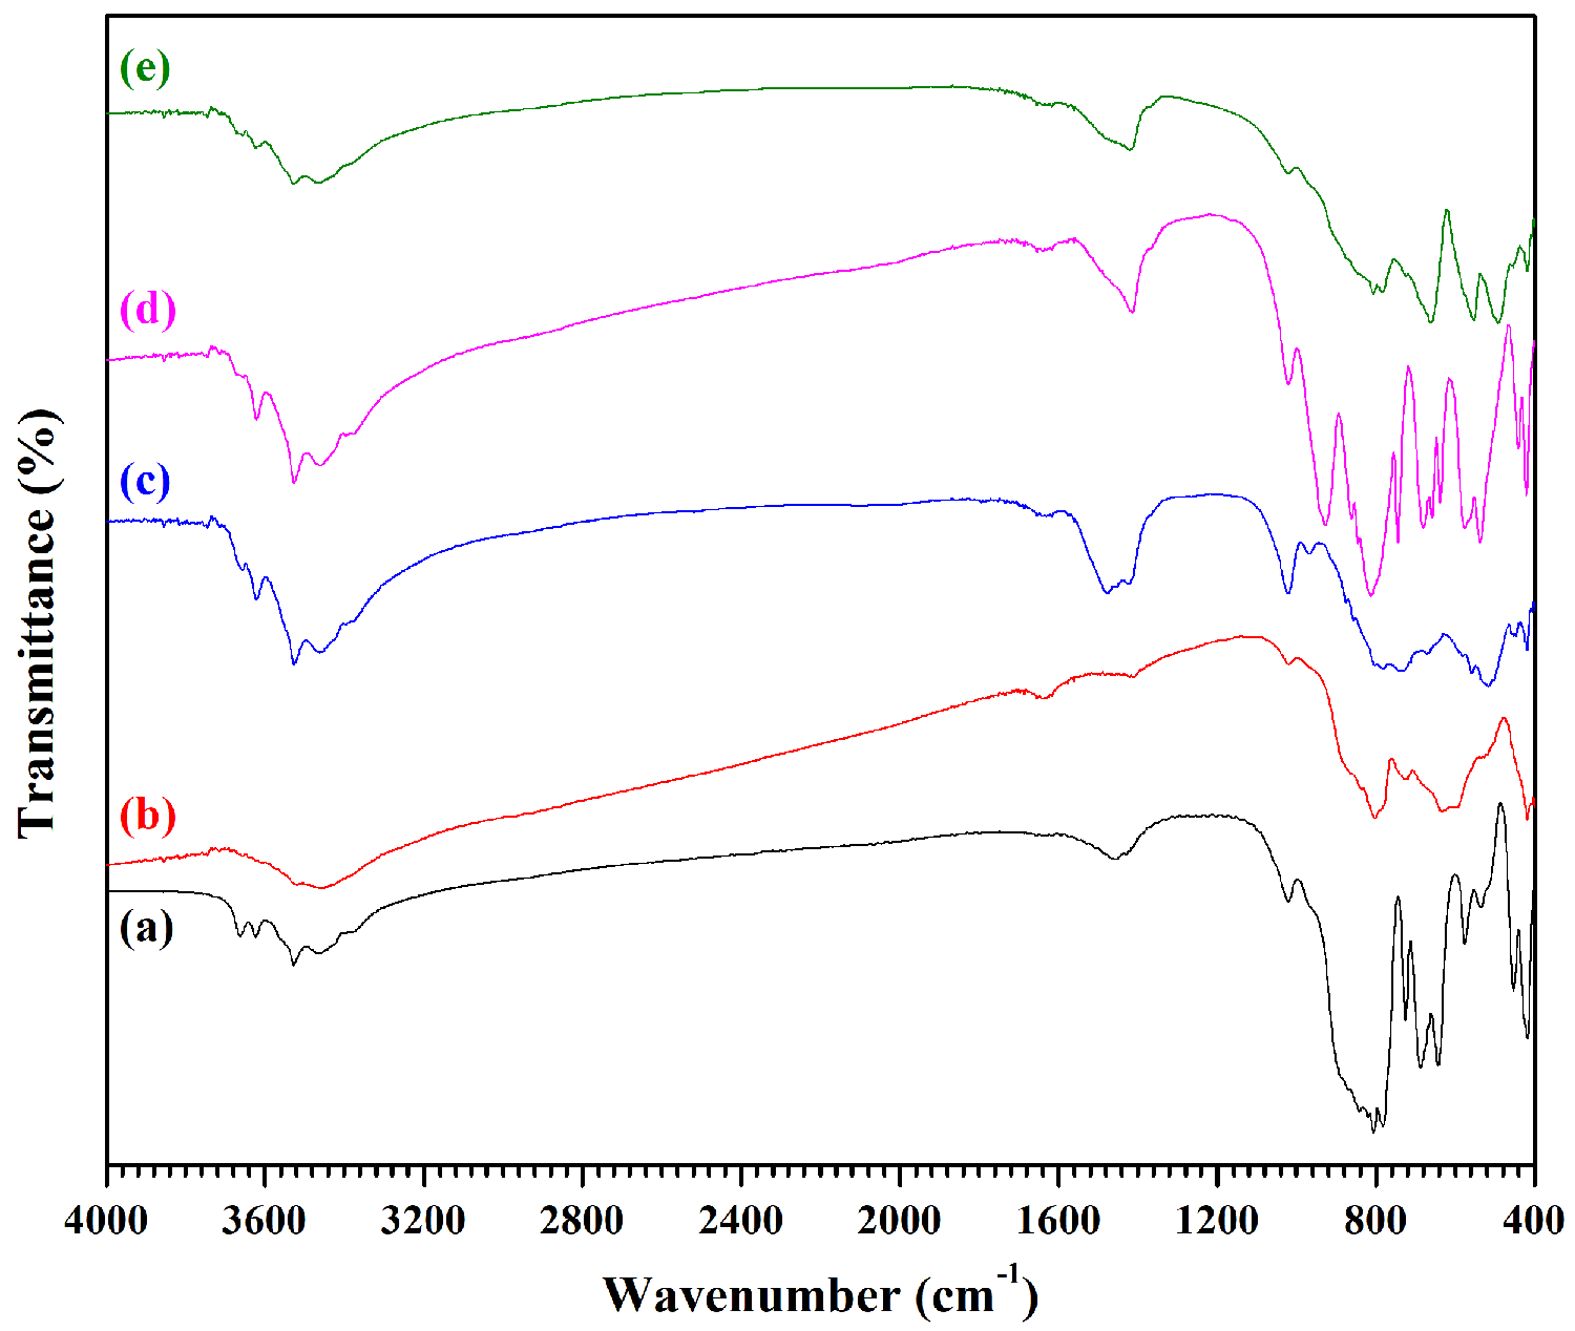
The surface functional groups for the various powders of CA, Fe-CA, Ni-CA, Cu-CA, and Zn-CA were investigated via the Fourier transforms infrared (FT-IR) spectra. It is possible to identify the compound constituents through this technique by examining the absorption frequency characteristics. Fig. 2 shows the FT-IR spectra for each of the samples across a range from 400 cm-1 to 4000 cm-1. It is necessary to consider for analysis three main phases of the FT-IR spectra. The first is absorption from 3400 cm-1 to 3700 cm−1 due to -OH stretching vibrational modes, including the bending vibrational mode of absorbed molecules of water [30]. Second is the weak absorption band observed around 1650 cm−1 due to H-O-H bending vibrations [31]. Most impurity groups occur in this range, including -OH,
NO3-, CO, and COO-. For example, at 1450 cm−1 it is possible to see absorption resulting from NO3− vibrational modes, whereas at 1320 cm−1 there is the chance to observe minimal signs of the N-O band [32]. The presence of this functional group is the result of the metal nitrate salts which serve as precursors in the synthesis process. In addition, it is possible to observe the symmetric stretching of COO− and C=O at around 1000 cm-1 to 1250 cm−1, aided by the fuel [33]. Fig. 2a shows the FT-IR spectrum for the pure CA sample, which revealed numerous absorption bands at 418, 454, 517, 538, 578, 646, 688, 726, 780, 805, and 880 cm-1 [34]. Bands below 600 cm-1 appeared because of the metal oxide stretching vibrations, attributable to Al–O, Ca–O and Ca–O–Al bonds. However, bands above 700 cm-1 were due to the stretching vibrations of the AlO4 tetrahedra group, while the main band within the range of 660 cm-1 to 690 cm-1 is a consequence of stretching in the AlO6 octahedral group [35, 36]. Although it was possible to see all of these peaks in the modified samples, structural disorder was evident in samples where transition metal ions had been added, such as the sample with iron doping (Fig. 2b) for which several absorption bands were apparent in the range of 500 cm-1 to 900 cm-1 due to the vibrational modes associated with the various ferric oxide phases. At 530 cm-1 and 890 cm-1 there were prominent bands visible which were attributable to the Fe-O stretching vibrational mode of the a-Fe2O3 phase [37]. In Fig. 2c, the nickel-doped powders present an FT-IR spectrum which has a peak at 515 cm-1 which is associated with the vibrational modes of Ni-O, and delivers clear evidence confirming the existence of nickel within the Ni-CA sample [38]. Fig. 2d shows the situation when copper serves as the dopant, with visible peaks at 525 cm-1, 680 cm-1, and 805 cm-1 which are attributable to the stretching mode of the Cu-O vibration, providing evidence of the formation of CuO within the Cu-CA sample [39]. In Fig. 2e, the Zn-CA FT-IR spectrum shows new peaks around 500 cm-1 and 560 cm-1 as a result of the Zn-O stretching vibration [40]. No impurities were evident in any of the samples, and all crystalline phase formations matched expectations according to the literature, in alignment with the XRD data.
Surface texture, morphological, and particle size analysis
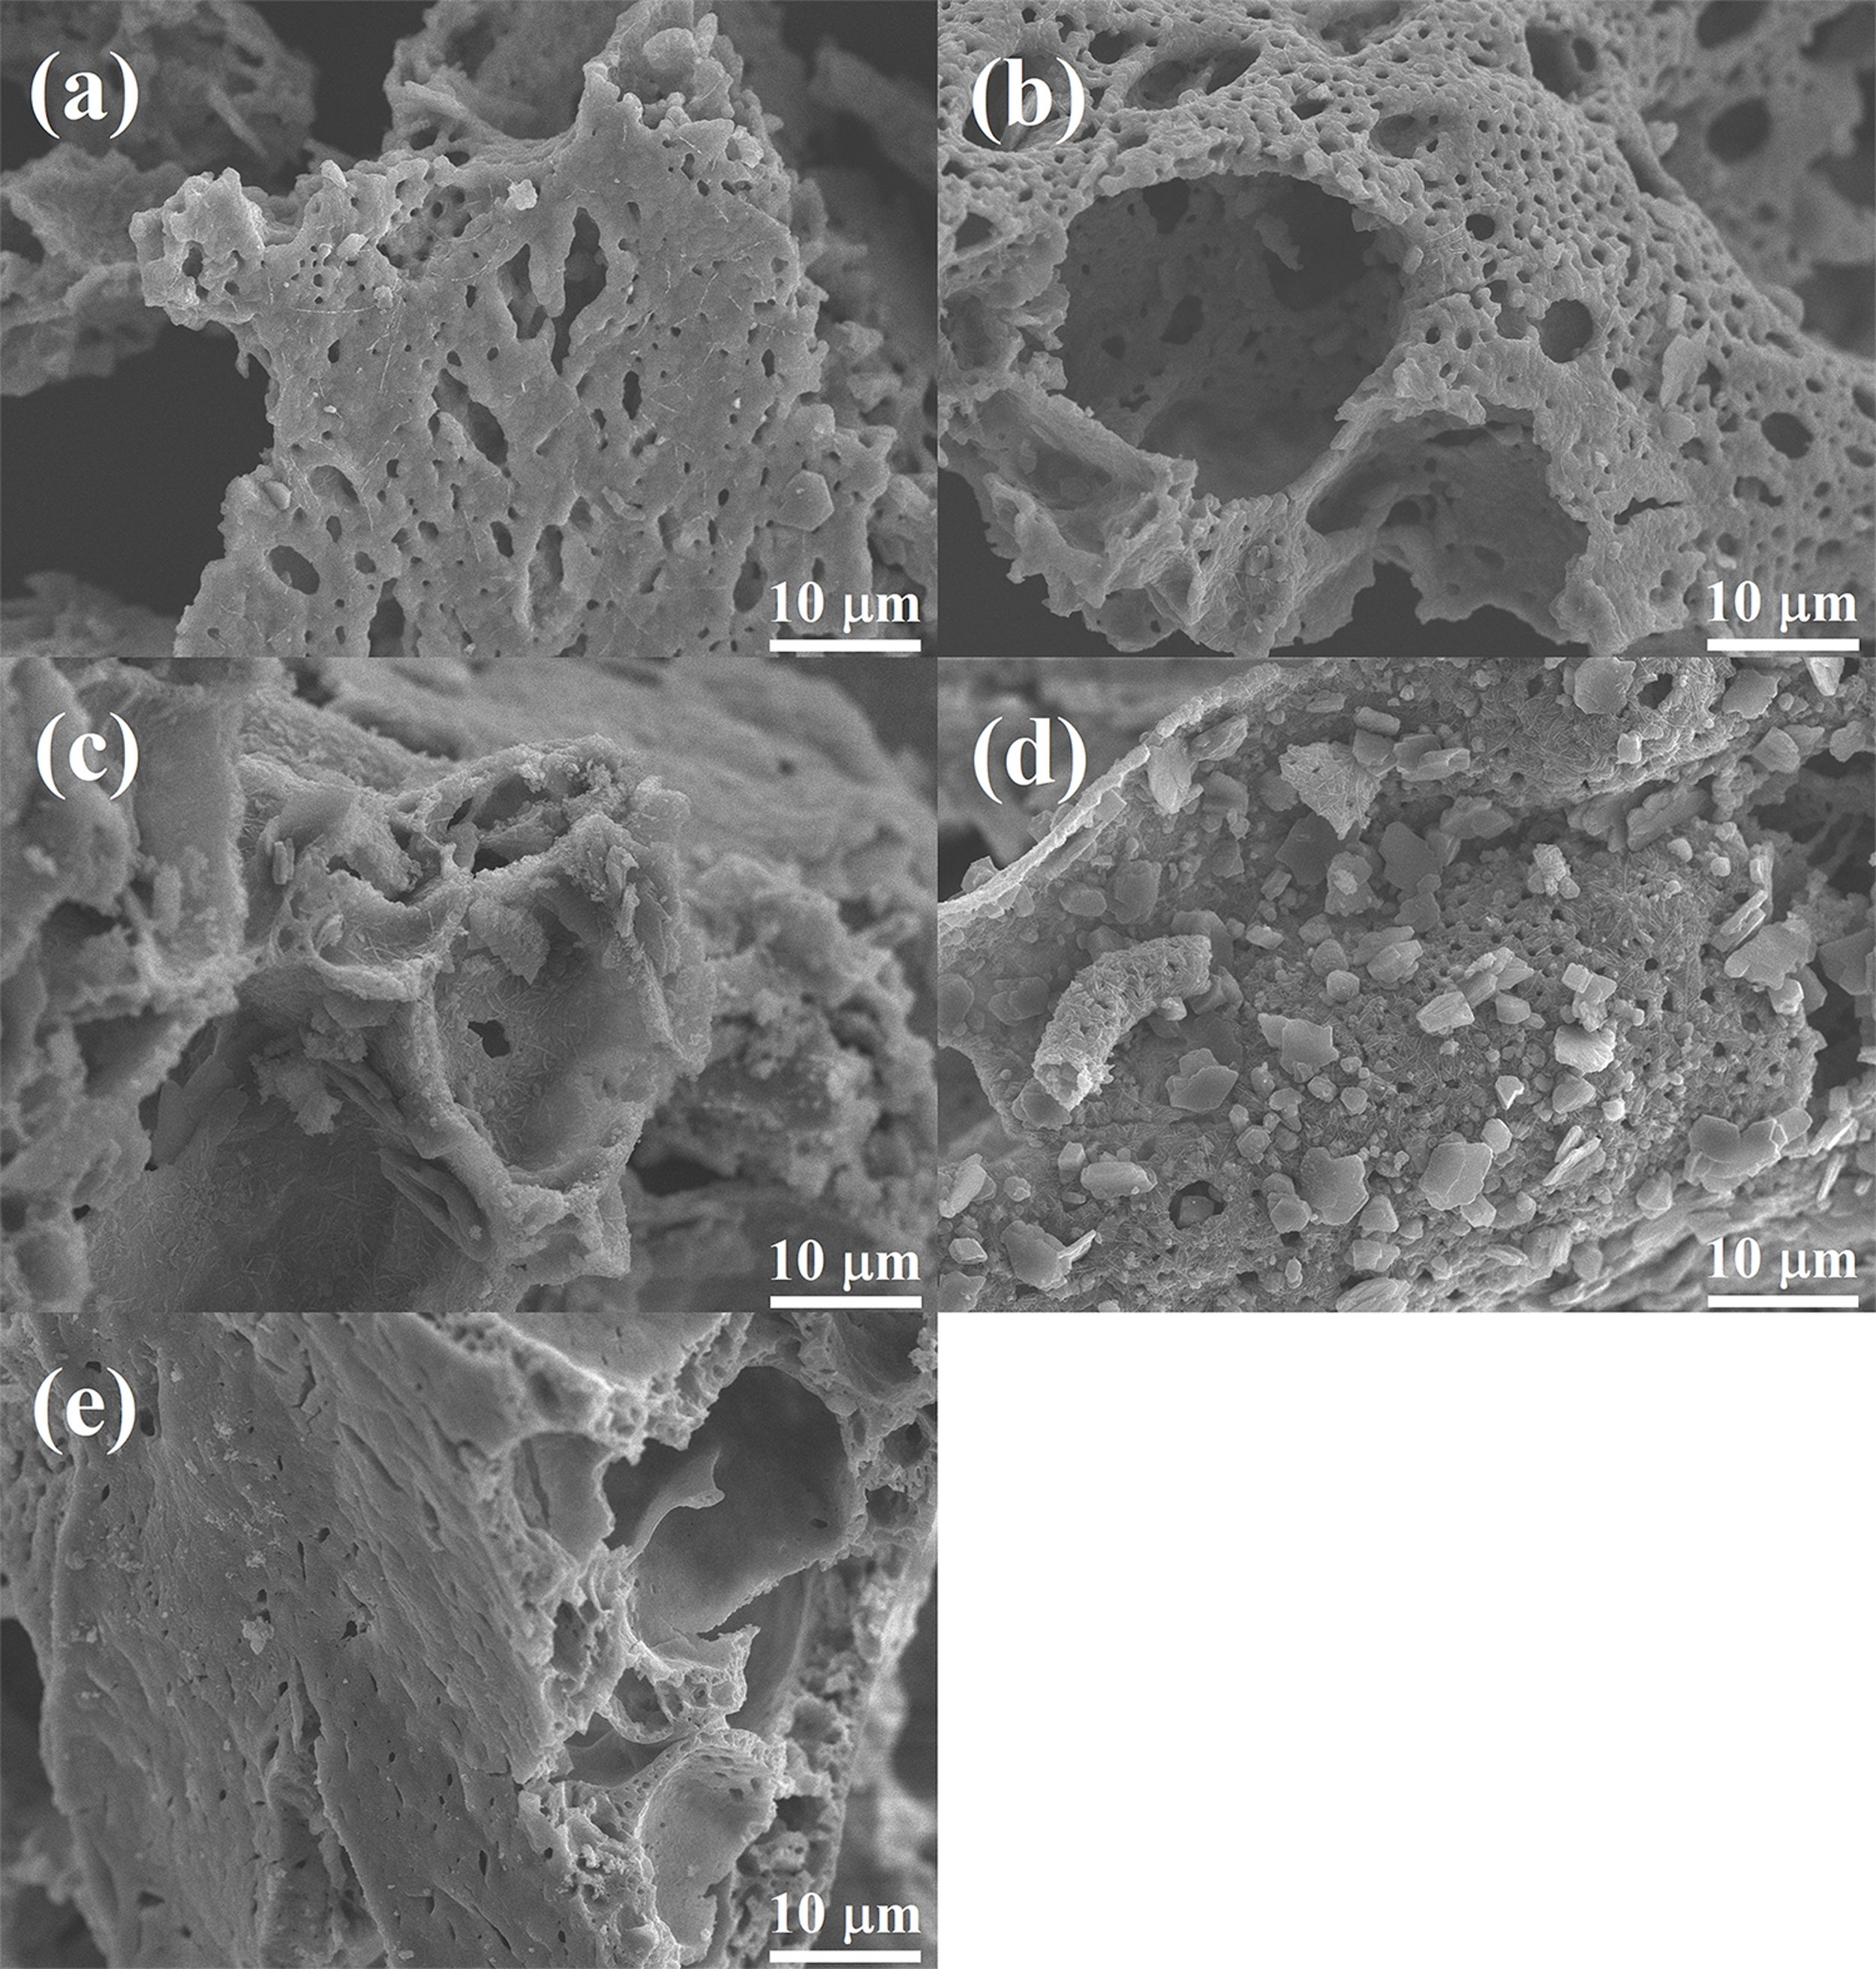
Scanning electron microscopy (SEM) was employed to evaluate the surface texture and morphology of the pure CaAl2O4 powders along with the modified samples doped with iron, nickel, copper, and zinc ions. The SEM images can be seen at 10,000× magnification in Figs. 3a (CA), 3b (Fe-CA), 3c (Ni-CA), 3d (Cu-CA), and 3e (Zn-CA), which reveals significant differences in morphology. CA and Fe-CA are revealed by SEM to possess rough surfaces which exhibit particle agglomerations. In both cases the grain sizes were large, at 0.5 µm to 1.0 µm, tightly packed, and their shapes were irregular. By comparison, the surfaces of Ni-CA and Zn-CA appeared to be smooth, though in actuality the surface comprises needle-shaped nanofibers arranged as floral bunches. The grain sizes were less than 100 nm. For Cu-CA, these floral bunches of needlelike nanofibers appeared to cover the surface, although the grain size was larger, at 1.0 µm to 2.0 µm, the surface was rougher, and there were obviously visible interconnected pore structures. The pores allow volatile gases including oxygen, nitrogen, carbon dioxide, and steam to be released during the combustion process. This enhanced porosity inevitable leads to a greater surface area, thus allowing the powders to serve as more effective catalysts.
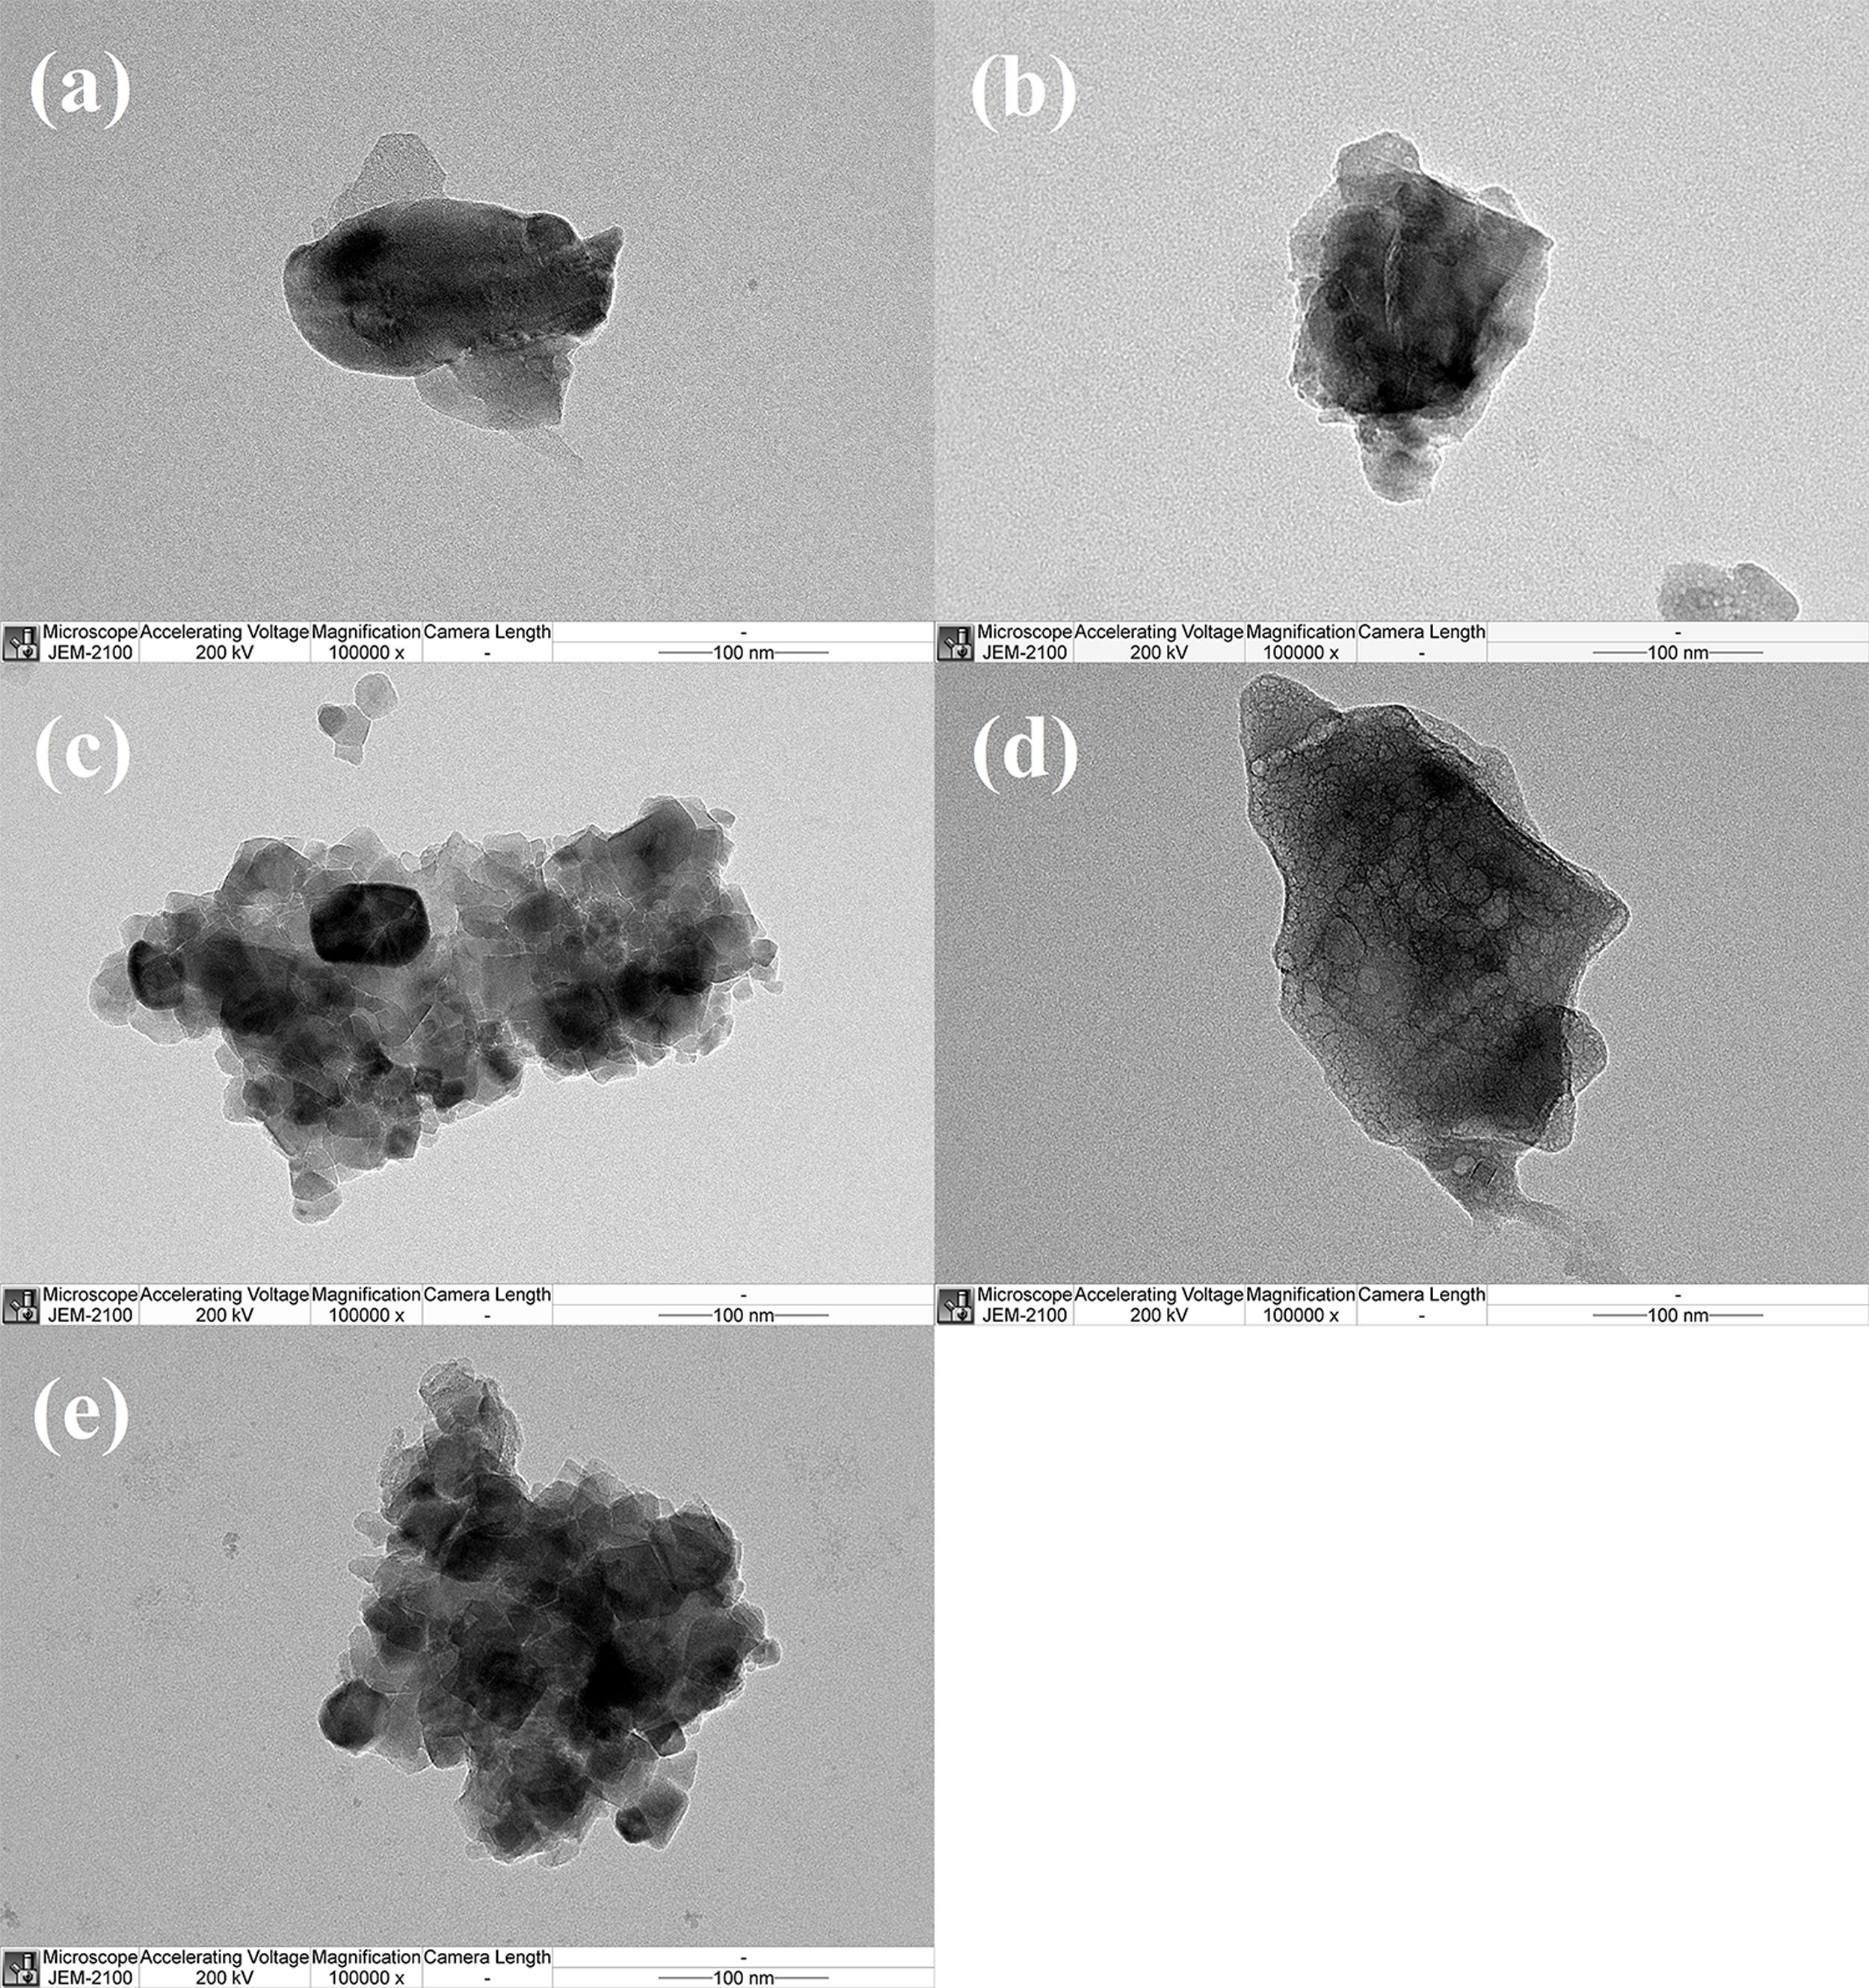
The morphology and particle sizes of the various calcium aluminate powders were also investigated using transmission electron microscopy (TEM), and the outcomes can be observed in Fig. 4. Particle aggregation can be seen due to the heat of the combustion stage and the subsequent calcination. Magnetostatic interactions among particles might also have a role to play in this aggregation. Fig. 4a shows the TEM images for pure CaAl2O4 which has irregular shaped particles which range in size from 100 nm to 200 nm, while exhibiting minimal agglomeration. By contrast, the modified samples revealed significant alterations to morphology as well as particle sizes. Fig. 4b shows the results for Fe-CA, which exhibits agglomerated particles which have sub-grain boundaries, and a size which has dropped to just 50 nm to 100 nm. Figs. 4c and 4e show the outcomes for Ni-CA and Zn-CA respectively, with particles appearing in different shapes such as cubes, hexagons, or other polyhedral forms, while the particle sizes had decreased to a range of 20 nm to 50 nm, while the grain boundaries positioned between the grains were smoother and offered better continuity than was observed in the pure sample. Grain boundary connectivity plays a key microstructural role in governing the bulk properties of nanocrystalline materials, as does the grain boundary character distribution. However, adding copper in the case of the Cu-CA sample shown in Fig. 4d can cause a notable size increase to approximately 200 nm.
Optical properties analysis
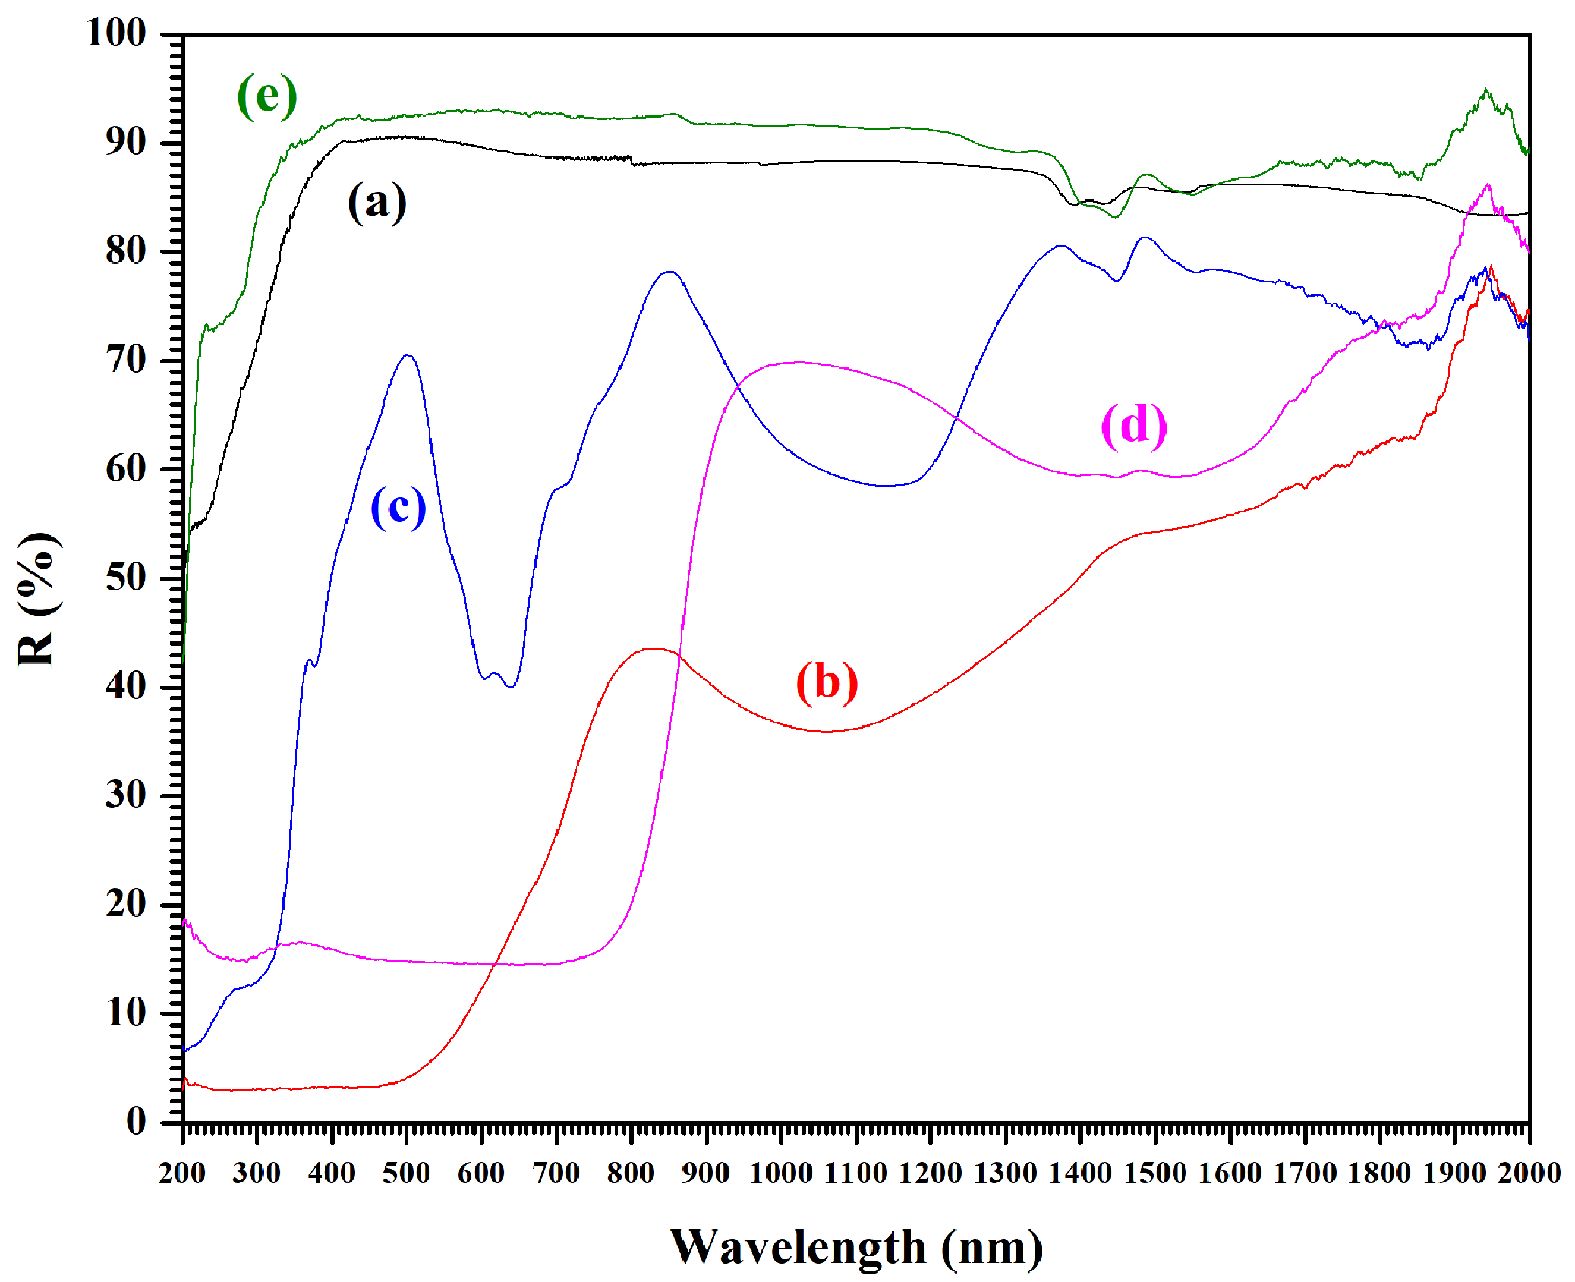
Figure 5 presents the ultraviolet diffuse reflectance spectra (UV-DRS) spectra for the pure CaAl2O4 powders and the samples doped with iron, nickel, copper, and zinc ion. The visible absorption peaks confirm electron transition from valence to conduction bands, and are sometimes indicative of intrinsic defect levels [41]. Fig. 5a presents the pure sample which reveals absorbance at 200 nm to 380 nm in the UV region, with reflectance measuring 50-88%. In the VIS region, from 380 nm to 700 nm, and into the NIR region from 800 nm to 1200 nm, the reflectance increases to as much as 88-91%. However, it begins to decrease further into the NIR region from 1200 nm to 2000 nm, dropping to 83-85%. For samples modified using iron, nickel, or copper, the UV-VIS-NIR region reveals reduced reflectance. Figs. 6b, 6c, and 6d show the results for Fe-CA, Ni-CA, and Cu-CA respectively. In the UV region, however, these modified samples presented minimal reflectance as follows: Fe-CA (3%) < Cu-CA (15-19%) < Ni-CA (7-43%). In the UV regions, typical absorption bands could be observed as a consequence of band-to-band electron transitions which link full O 2p orbitals and empty Al 3s, along with the possibility of Al 3p wave function mixing [42]. These samples also produced one further shoulder at 350 nm, which was indicative of electronic excitation arising between full metal ion O 2p orbitals and empty 4s orbitals [43]. The reflectance results for the VIS region differed in the case of the modified samples when comparisons to the pure sample were drawn. The Ni-CA sample produced three smaller bands located around 370 nm, 590 nm, and 630 nm, which provide confirmation of the NiO structure formation, for which the minimum reflectance level was 40%. In addition, a high-energy band appeared at 370 nm due to the charge transfer bands and 3A2g-3T1g spin. This permitted transition which resulted in the octahedral coordination of the Ni2+ cations [44]. Further bands were present at 590 nm and 630 nm due to the 3T1-3T2 (3P) spin permitting transition. The doublet d-d bands appear as a result of the Ni2+ occurring at both the tetrahedral and octahedral sites [45]. In the case of Cu-CA, the UV-DRS spectrum displayed a broad absorption band responsible for 14-17% reflectance, encompassing the VIS spectra with no other notable features. An additional band appears at 400 nm to 500 nm, as a consequence of the charge transfer arising between the O and Cu2+ occupied octahedral sites. Moreover, a broad shoulder appears at around 600 nm to 700 nm due to Cu2+ d-d transitions taking place inside the tetragonally-distorted octahedral geometry of the Cu2+ ions [45]. For the sample modified with iron, the reflectance spectra for the VIS region measured around 3-4% at wavelengths of 380 nm to 500 nm. Toward the end of the VIS region, the reflectance increased to 5-26%. These bands appear because of the intrinsic band gap absorption which is a consequence of pair excitations in addition to local crystal field transitions [46]. For Zn-CVA, however, the UV reflectance exceeds that of the pure sample, maintaining a range of 85-92% in the VIS and NIR regions. Although the sample modified with zinc produces absorption peaks in the NIR region which match those of the pure sample, this did not occur for the samples doped with iron, nickel, or copper. The intensity of the absorption bands clearly rose in the range of 800 nm to 2000 nm upon the addition of copper or nickel, until minimum reflectance reached about 58% for the samples of Ni-CA and Cu-CA. In the iron-doped sample of Fe-CA, absorption efficiency was increased in the NIR region, and the minimum reflectance was 37%. This might be due to the effects of particle size in addition to the various oxides which are present, causing the optical spectra to broaden [47]. At the end of the VIS region and in the opening of the NIR region, the highest absorption efficiency was observed for Cu-CA, but when considering all wavelengths, the best performance was achieved by Fe-CA.
Energy band gap analysis
Using the UV-DRS spectra, assessment of the optical band gaps was carried out via the Kubelka-Munk function presented in Equation (1) along with the Tauc relation shown as Equation (2) [48]:
in which is the Kubelka-Munk function, the absorption coefficient is given as α, while reflectance is indicated by R.

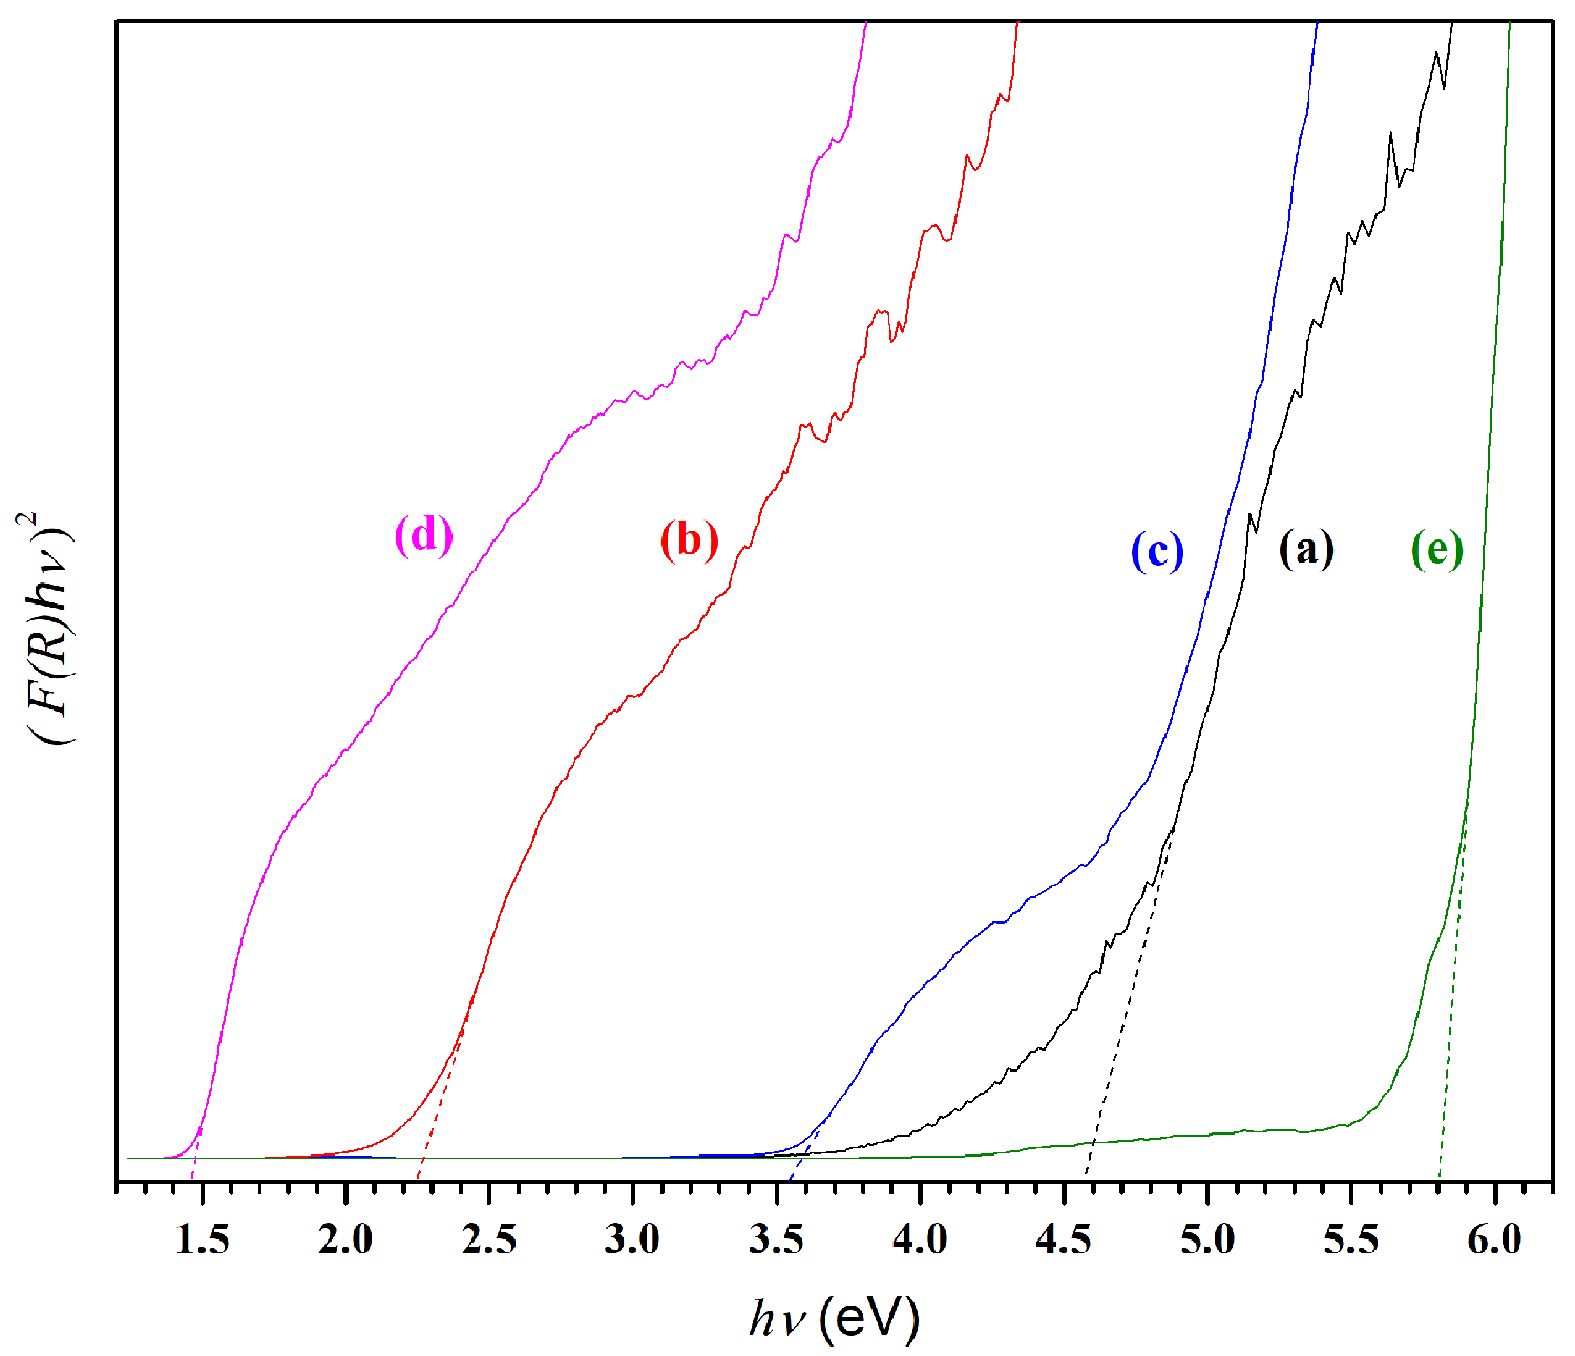
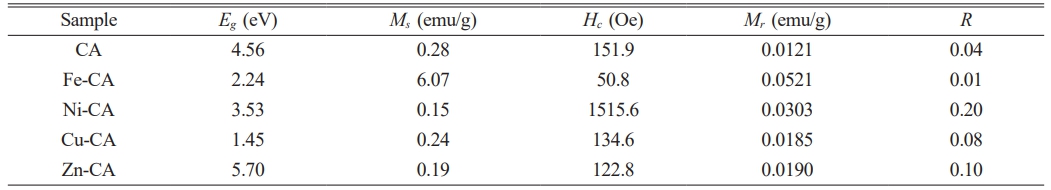
and in which light energy is indicated by hv, A serves as a constant, Eg represents the band gap energy, and n = ½ in the case of the direct band gap. The plot of (F(R)hv)2 against hv is shown in Fig. 6 foe all of the various aluminate samples. Extrapolation of the Tauc plot to the hv-axis creates intersections which confirm the values for the direct band gap (Eg). In Fig. 6a which presents pure CaAl2O4, the Eg value of 4.56 eV aligns closely with earlier studies [49]. Changes in the optical band gap arise as a result of a non-uniform expansion in the optical spectra because of differing particle sizes and distribution [50]. The outcomes show that significant differences exist in the bandgap quantities for each of the modified samples due to the presence of the transition metal ions which are of course absent in pure samples. Table 1 summarizes the results. The result for the nickel-doped sample is shown in Fig. 6c, in which the Eg values fell to 3.53 eV. When copper is added to form Cu-CA, the decline in the Eg value is even greater, as it falls to 1.45 eV, as can be seen in Fig. 6d. This decrease was also observed in the case of Fe-CA, as Fig. 6b shows Eg values of 2.24 eV. Meanwhile, Zn-CA is shown in Fig. 6e, with an Eg value of 5.70 eV. The data suggest that it is possible to tune the band gaps through the addition of selected transition metals to achieve the required results. Practical applications are then possible in fuel calls, photocatalysis, photovoltaics, or thermoelectrics. When copper or iron are added, the samples will be able to show absorbance in both the UV and VIS regions, and into the start of the NIR region. Accordingly, these materials can serve as excellent photocatalysts under sunlight.
Magnetic behavior analysis
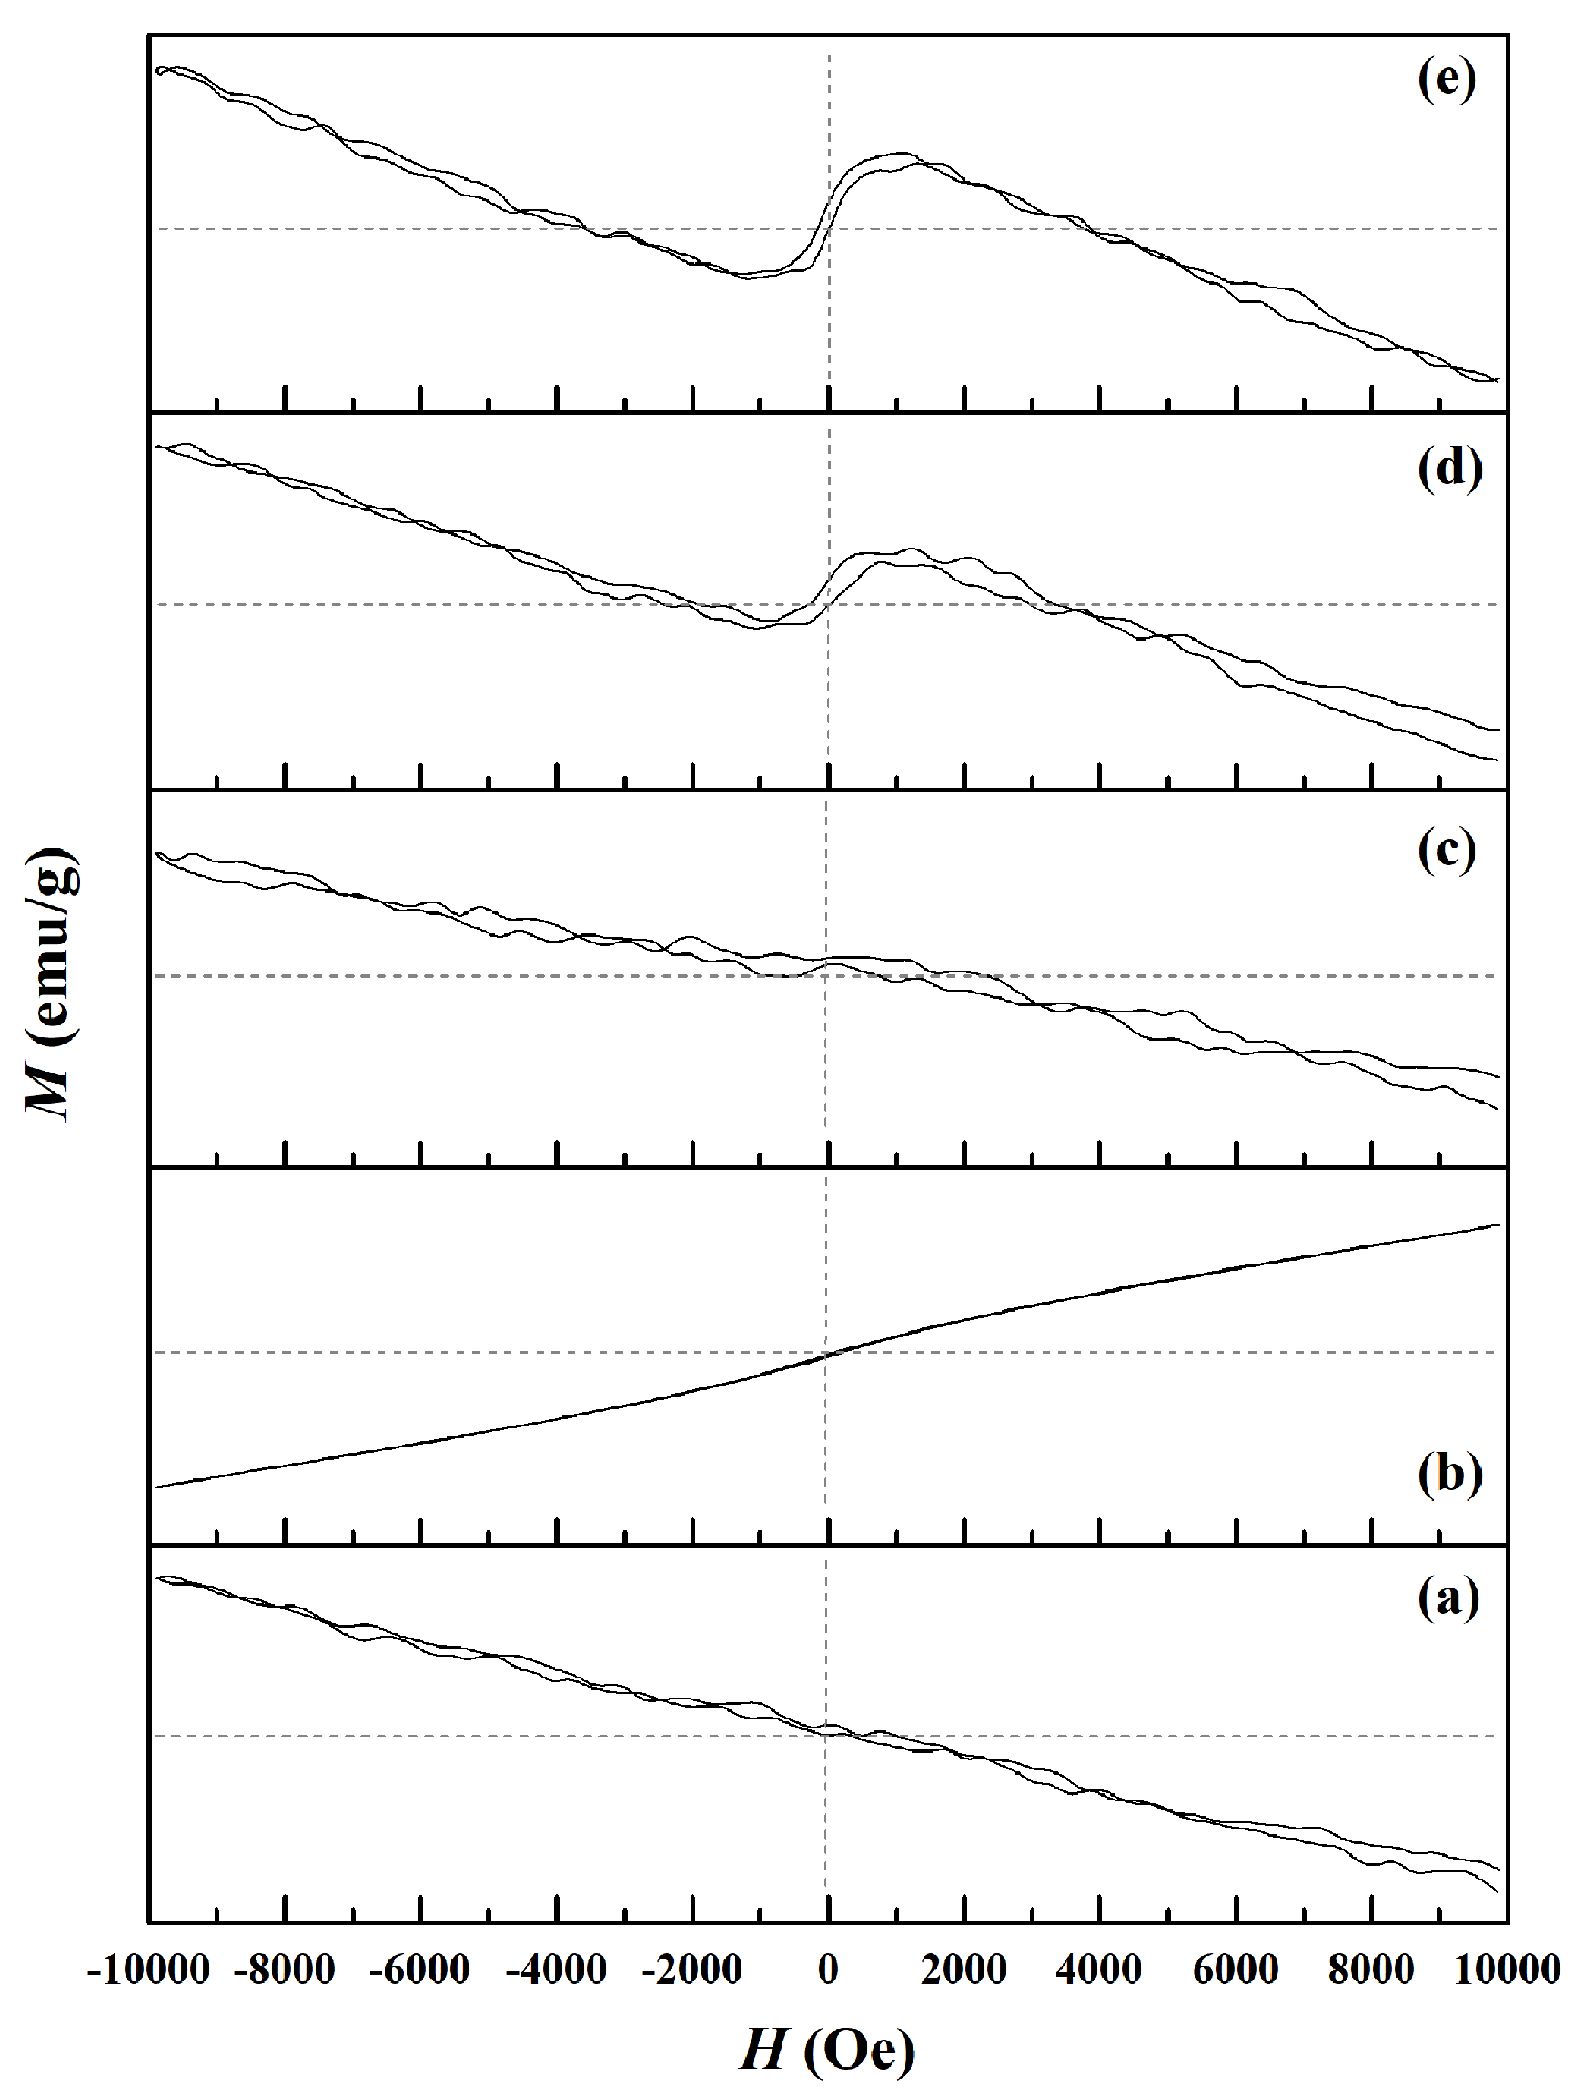
The magnetic hysteresis loops employed to assess field-dependent magnetization can be seen in Fig. 7. They can be produced using an alternating magnetic field operated at ±10 kOe, enabling the determination of hysteresis curves which are then applied to reveal the key magnetic properties, including specific remanence magnetization (Mr), specific saturation magnetization (Ms), coercivity (Hc), and the remanence ratio (Mr/Ms or R). The values are summarized for each of the samples in Table 1. Results for the pure CaAl2O4 sample are presented in Fig. 7a, indicating straight-line diamagnetism with no visible saturation prior to ±10 kOe. The highest magnetization level for this sample was 0.28 emu/g, in line with the findings of Ahlawat et al. [51]. When nickel is introduced to form Ni-CA, the magnetic properties were unchanged, with the exception of Ms which declined to 0.15 emu/g. In contrast, Cu-CA is shown in Fig. 7d, which reveals the key changes resulting from the addition of copper ions. Diamagnetic properties are evident, in addition to a small S-shaped hysteresis loop which at room temperature displays ferromagnetic qualities. Previous research has shown that the ferromagnetic activity of the CuO nanocomposite is associated with the change in valence of the copper ions, or with defects. According to Gao et al., pairs of regular copper ions are located at the CuO nanocomposite interface, with configurations of d9 (Cu+) and d10 (Cu2+). It is possible for oxygen vacancies (V0) to occur in large size localized orbitals where two unpaired electrons are able to jump between the Cu1+ and Cu2+ ions. The result is that the interface has copper ions capable of self-alignment in ferromagnetic order, allowing the inference that the electrons, V0, and copper ions are the main factors leading to the ferromagnetic enhancement of the CuO system via the mechanism of indirect double exchange [52]. A similar outcome can be observed in Fe-CA, as shown in Fig. 7b, with hysteresis curves generating an S-shape after optimization of the composition, thus offering clear evidence of ferromagnetism [53]. Changes in the magnetization hysteresis loop occur which may be due to the super-exchange (SE) interaction which takes place because of the s-f coupling and F-center exchange coupling (FCE) arising between the Fe2+ and Al3+ via O2- ions [54, 55]. It is also possible for defects such as electrons, holes, or oxygen vacancies to mediate the ferromagnetic exchange between cations [56]. At room temperature, the observed weak ferromagnetism might be linked to uncompensated magnetic moments which occur because of SE and FCE interactions on the surfaces of the samples [57, 58].
Photoluminescence analysis
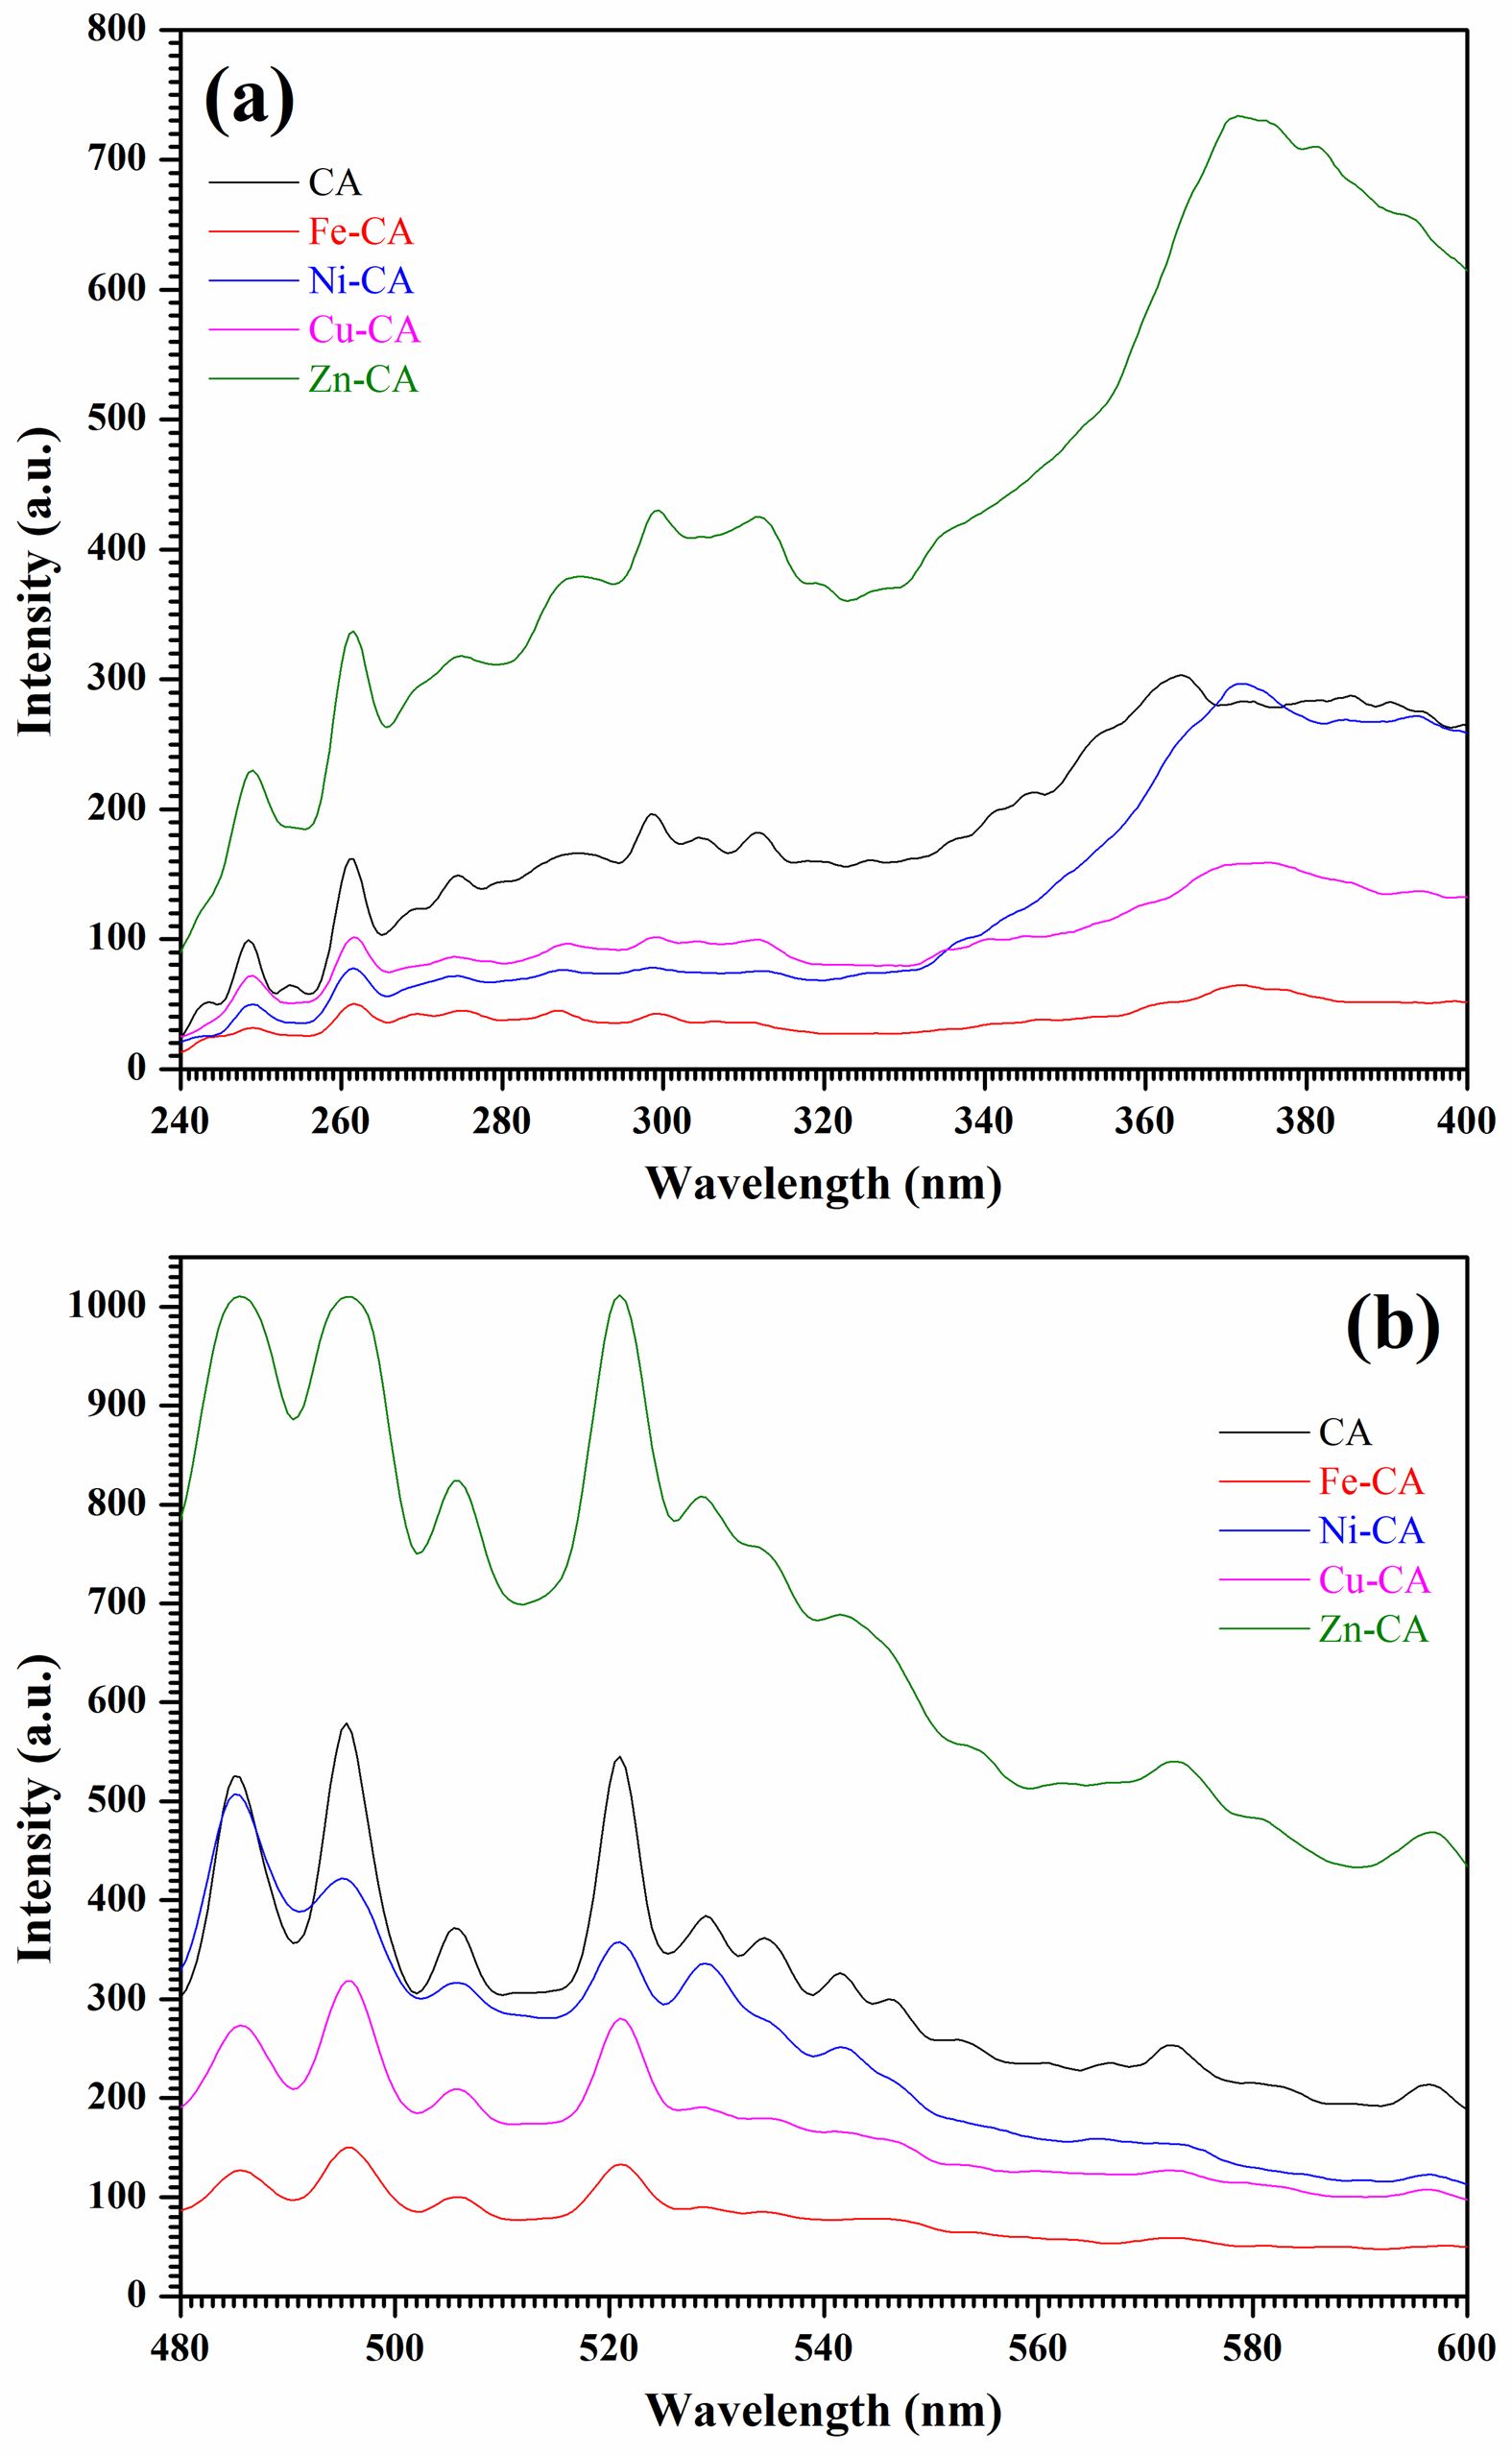
Recombination taking place in semiconductors is observable through the photoluminescence (PL) spectra, since band gap data are provided along with details about sub-bandgap defect states and the relative energy position [59]. There are variations apparent in material defects when the synthesis conditions differ, or if the crystallite dimensions and morphology vary [60]. Fig. 8 presents the CA, Fe-CA, Ni-CA, Cu-CA, and Zn-CA powder PL spectra under normalized room temperature conditions, encompassing the ultraviolet and visible regions in Figs. 8a and 8b respectively. An excitation wavelength of 220 nm was then used to examine the different emission bands. In each sample, a number of emission peaks were visible in the PL spectra which could be attributed to electron recombination and photogenerated holes, and which covered a range of structural defects including oxygen or metal vacancies, oxygen antisites, metal interstitials, and the ionized charge states linked to intrinsic defects [61]. Structural defects can easily occur due to the rapid combustion phase in the sol-gel approach, and these can subsequently serve as deep defect donors within the various semiconductor oxides, leading to optical emissions [62]. The PL spectrum for pure calcium aluminate presented continuous ultraviolet, violet, blue, and green emissions at around 360-400 nm, 485 nm, 495 nm, 520 nm, and 530-540 nm, while yellow and orange emissions of lower intensity were seen from 560 nm to 600 nm. It is not yet possible to identify the exact source of these defect-related emissions as the details remain rather complex, despite comprehensive studies of photoluminescence properties [63]. When iron, nickel, and copper ions were added, the emissions of the resulting Fe-CA, Ni-CA, and Cu-CA samples deteriorated in every region. Kazarinov et al. explain that the lower levels of photoluminescence intensity may be due to additional states created through anion vacancy and oxygen defects, because these tend to draw electrons and cause separation of the electron hole recombination [64]. However, in the case of the Zn-CA sample, the emission bands exhibit twice the intensity value of the pure sample and are much stronger. The PL peak intensity depends on how many charge transfers and surface defects are involved. There is also an effect exerted by residual organic materials such as NO3- and CO2 which the FT-IR analysis revealed to be present [65].
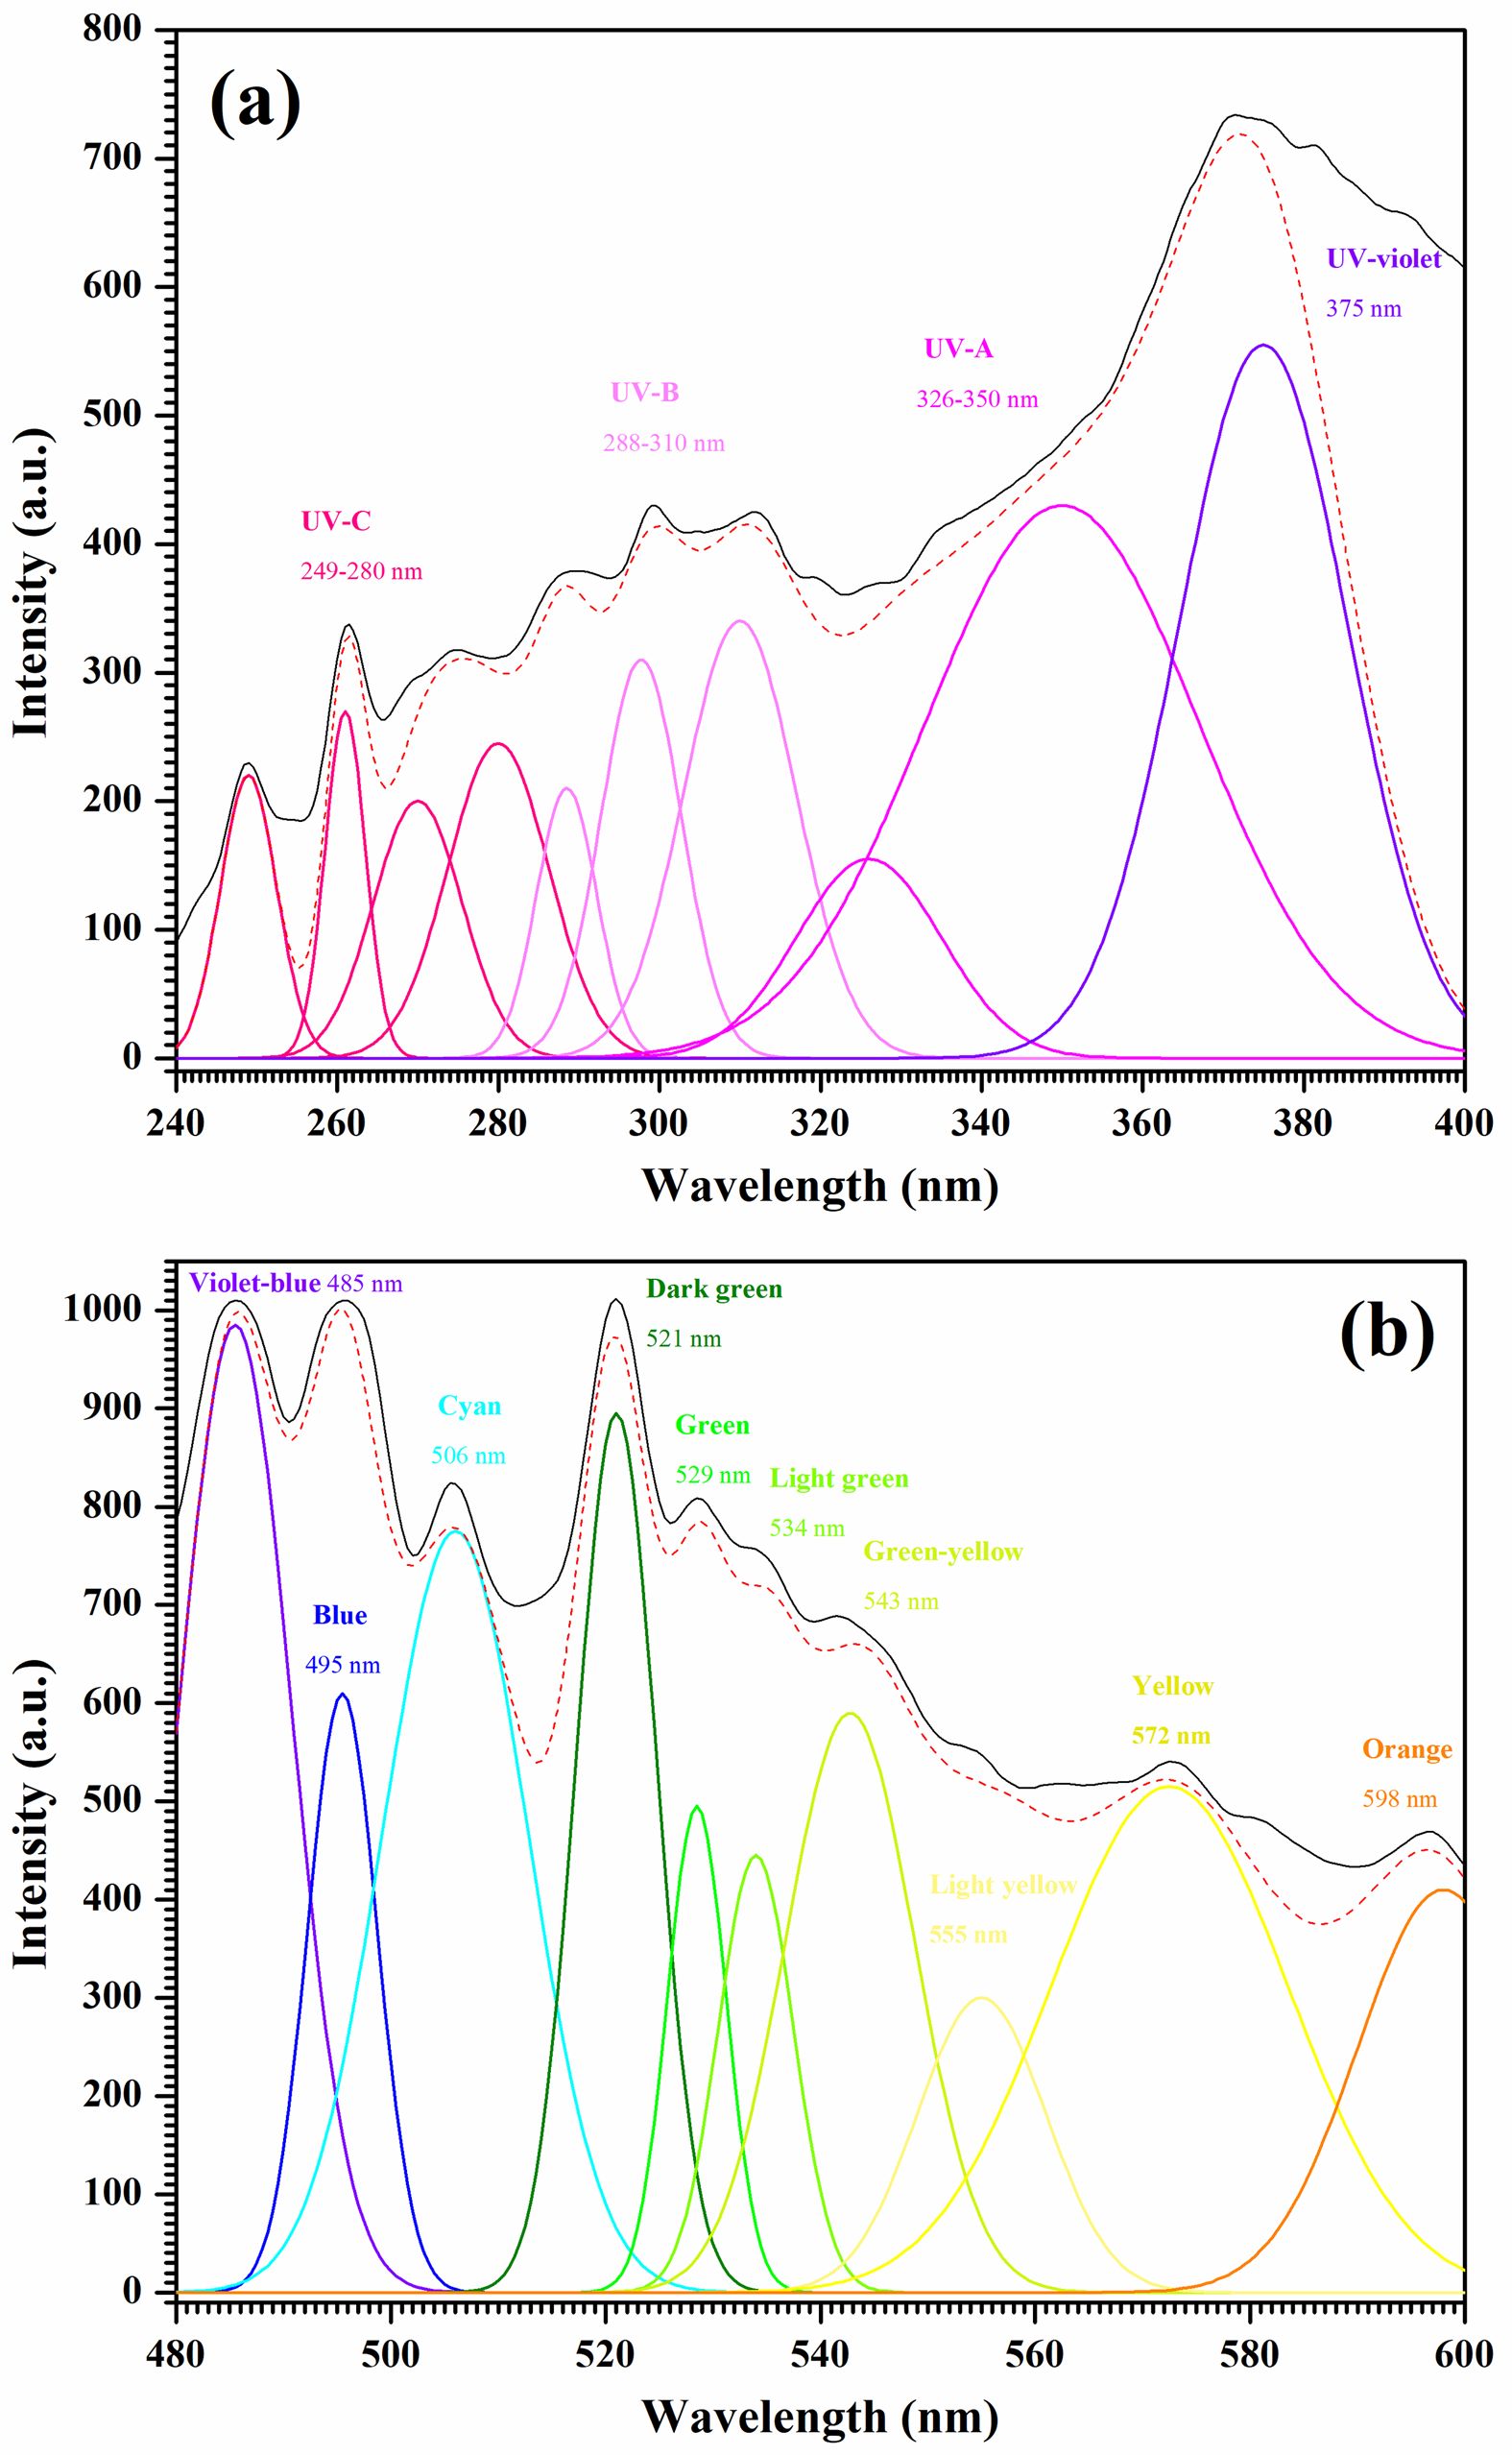
The deconvolution of the transition metal-doped calcium aluminate powders can be seen in Fig. 9. The ten Gaussian parts within the UV and VIS regions, shown respectively in Figs. 9a and 9b, reveal a good fit, with the data shown as follows: 249-280 nm (UV-C), 288-310 nm (UV-B), 326-350 nm (UV-A), 375 nm (UV-violet), 485 nm (violet-blue), 495 nm (blue), 506 nm (cyan), 521 nm (dark green), 529 nm (green), 534 nm (light green), 543 nm (green-yellow), 555 nm (light yellow), 572 nm (yellow), and 598 nm (orange).
Several energy positions are available for the defect centers of the Ca-Al-O systems, which include Fe-O, Ni-O, Cu-O, and Zn-O. Accordingly, the origins of the luminescence emission components can be identified. UV emission luminescence peaks can be seen under 400 nm as electron transitions take place from the conduction band to a single ionized oxygen vacancy (VO+), since the responsible acceptor defects are located above the valence band [66]. In the UV-violet region, a luminescence peak occurs as a result of electron transitions to the valence band from the ionized metal interstitial (Mi+) defect level [67]. Zeng et al. [68] found similar results concerning emissions attributable to the transitions of extended metal interstitial (Mi) states located below the minima of the conduction band. The formation enthalpy of a complex of VO which had doubly ionized Mi++ defects was investigated by Kim et al. [69], who reported that each complex generated different energy Mi* and VO* states. The recombination of the valence band and the electron-hole pairs involving these Mi* states can explain the violet emission. A violet-blue emission luminescence peak occurs at 485 nm due to the charge transfer transition between the Al3+ located at the octahedral sites and the surrounding O2− ions [70]. The spectra show blue luminescent main peaks, the first of which is at 495 nm and the second, which is cyan, at 506 nm, attributable to electrons transitioning to holes which are trapped at calcium ion vacancies [71]. These are linked to the main oxygen vacancies (Vo) which can cause the production of many emission pathways which bridge the band gap regions to allow simultaneous emissions [72]. Electrons are captured from the side trap level by the oxygen vacancy due to the positive charge, while the oxygen vacancy is also able to act as a luminescent center. The three charge states determine the Vo defect levels. These include neutral Vo, single ionized Vo+, and double ionized Vo++. The double ionized oxygen vacancy can explain the blue emission from the pure sample of CaAl2O4. Density functions were used by Zhai et al. to acquire theoretical findings which aligned with the results obtained experimentally [73]. Green emissions are indicated by the peaks visible in the range of 521 nm to 543 nm, due to the F-center (oxygen vacancies which retain both electrons) which surrounds the octahedral calcium atom [74]. From 555 nm to 572 nm, the F22+ centers (double charged vacancies) which surround the octahedral Al3+ ions produce yellow emissions [75]. Finally, there is an orange emission peak at 598 nm due to the transition to the valence band of the metal ion interstitials [76].
|
Fig. 1 XRD patterns of (a) CA, (b) Fe-CA, (c) Ni-CA, (d) Cu-CA, and (e) Zn-CA powders. |
|
Fig. 2 FT-IR spectra of (a) CA, (b) Fe-CA, (c) Ni-CA, (d) Cu-CA, and (e) Zn-CA powders. |
|
Fig. 3 SEM images at 10000× magnification of (a) CA, (b) Fe-CA, (c) Ni-CA, (d) Cu-CA, and (e) Zn-CA powders. |
|
Fig. 4 TEM images at 100000× magnification of (a) CA, (b) Fe-CA, (c) Ni-CA, (d) Cu-CA, and (e) Zn-CA powders. |
|
Fig. 5 UV-Vis diffuse reflectance spectra of (a) CA, (b) Fe-CA, (c) Ni-CA, (d) Cu-CA, and (e) Zn-CA powders. |
|
Fig. 6 Plot of (F(R)hν) 2 versus hν for (a) CA, (b) Fe-CA, (c) Ni-CA, (d) Cu-CA, and (e) Zn-CA powders. |
|
Fig. 7 Magnetic hysteresis curves of (a) CA, (b) Fe-CA, (c) Ni-CA, (d) Cu-CA, and (e) Zn-CA powders. |
|
Fig. 8 PL emission spectra in (a) UV and (b) VIS regions of pure CaAl2O4 powders and its composites with Fe, Ni, Cu, and Zn ions. |
|
Fig. 9 Deconvoluted PL emission spectra in (a) UV and (b) VIS regions of Zn-CA powders. |
|
Table 1 Band gap values (Eg), specific saturation magnetization (Ms), coercivity (Hc), specific remanence magnetization (Mr), and remanence ratio (R) of pure CaAl2O4 powders and its composites with Fe, Ni, Cu, and Zn ions. |
This research made use of the sol-gel auto combustion method to synthesize pure CaAl2O4 powders and to produce samples doped with the ions of iron, copper, nickel, or zinc. The chemical bonds, structures, and particle sizes were then evaluated in addition to the optical, magnetic, and fluorescence characteristics in order to determine how the addition of transition metal ions influences the material properties. For the modified samples, XRD and FT-IR analyses confirmed the presence of the spinel CaAl2O4 structure in the main phase as well as in secondary phases including Fe2O3, NiO, CuO, and ZnO. SEM and TEM images allowed determination of the particle morphology, and showed the presence of different shapes including cubes, hexagons, and polyhedrons, in addition to particles of varying sizes and irregular shapes. The UV-visible diffuse reflectance spectra for CA and Zn-CA demonstrated reflectance measuring 50-93% in the UV, VIS, and NIR regions. Meanwhile, the Fe-CA sample achieved very strong absorption in the UV, VIS, and NIR regions, touching 97%. Optimized modified samples displayed band gap energy measurements in the range of 1.45 eV to 5.70 eV, while the pure sample value was 4.56 eV. Investigation of the magnetic properties revealed room temperature ferromagnetic activity in the samples of both Fe-CA and Cu-CA, whereas diamagnetism was found in the pure sample. Photoluminescence analysis of the Zn-CA emission spectra revealed various colors showing a high degree of intensity in the UV, violet, blue, cyan, green, yellow, and orange regions which can be explained by different defect center types found within the material band gaps. The observed qualities indicate the possibility of using these materials for fluorescent, refractory, or photocatalytic applications, or in the field of spintronics. The findings in this study may also promote a better understanding of the factors which link structures, compositions, and properties, in order that these can be effectively combined to control the properties of new composite materials.
This research was financial supported from the Thailand Research Fund, Office of the Higher Education Commission (Grant number MRG6280220).
The Author declares that there is no conflict of interest
- 1. X. Liu, D. Yang, Z. Huang, J. Ye, S. Zhang, M. Fang, H. Ding, and Y. Liu, Ceram. Int. 41 (2015) 14727-14732.
-

- 2. H.J. Liaw and W.C.J. Wei, J. Ceram. Process. Res. 6 (2005) 230-235.
- 3. R. Salomão, V.L. Ferreira, I.R. Oliveira, A.D.V. Souza, and W.R. Correr, J. Eur. Ceram. Soc. 36 (2016) 4225-4235.
-
- 4. W.J. Wei, S.D. Tze, and H.C. Liaw, J. Ceram. Process. Res. 6 (2005) 223-229.
- 5. J.M. Fernández, I.N. Blasco, A. Duran, R. Sirera, and J.I. Alvarez, J. Environ. Manage. 140 (2014) 1-13.
-
- 6. Y. Tian, X. Pan, H. Yu, and G. Tu, J. Alloys Compd. 670 (2016) 96-104.
-
- 7. S. Yang, G. Xiao, D. Ding, Y. Ren, L. Lv, and P. Yang, Ceram. Int. 43 (2017) 15918-15926.
-
- 8. N. Sakhare, S. Lunge, S. Rayalu, S. Bakardjiva, J. Subrt, S. Devotta, and N. Labhsetwar, Chem. Eng. J. 203 (2012) 406-414.
-
- 9. P. Cheng, Y. Liu, L. Yang, Q. Ren, X. Wang, Y. Chi, H. Yuan, S. Wang, and Y.X. Ren, J. Environ. Chem. Eng. 11 (2023) 109377.
-
- 10. S.H. Choi, N.H. Kim, Y.H. Yuna, and S.C. Choi, J. Ceram. Process. Res. 7 (2006) 62-65.
- 11. A.A. Amer, H. El-Didamony, T.M. El-Sokkary, and M.I. Wahdan, Bol. Soc. Esp. Ceram. Vidrio 61 (2022) 98-106.
-
- 12. M.N. Singh, A.G. Barua, and R.K. Gartia, Optik 228 (2021) 166151.
-
- 13. R. Ianoş, Ceram. Int. 44 (2018) 21908-21913.
-
- 14. C.A.G. Valles, T.M. Piters, M.B. Flores, R. Melendrez, P.S. Castillo, and V. Chernov, J. Lumin. 286 (2025) 121407.
-
- 15. A. Fatima, S. Gouadria, A. Gassoumi, A.G. Al-Sehemi, and A. Kumar, Diamond Relat. Mater. 152 (2025) 111944.
-
- 16. C.K. Chaithra, B.R.R. Krushna, M.M. Gowri, S.C. Sharma, A.S. Rajashekharaiah, C.T. Meyyammai, J. Inbanathan, K. Manjunatha, S.Y. Wu, and H. Nagabhushana, J. Lumin. 280 (2025) 121111.
-
- 17. R. Cao, F. Zhang, C. Cao, X. Yu, A. Liang, S. Guo, and H. Xue, Opt. Mater. 38 (2014) 53-56.
-
- 18. H. Dong, J. Ceram. Process. Res. 12 (2011) 704-707.
-
- 19. B. Zhai, M.M. Chen, and Y.M. Huang, RSC Adv. 12 (2022) 31757-31768.
-
- 20. E. Nkuna, M.R. Mhlongo, C. Dlamini, L.T. Melato, A. Bele, and V.M. Maphiri, Heliyon 10 (2024) e33274.
-
- 21. N. El-Faramawy, A. Salah, and S. Farouk, Eur. Phys. J. Plus 139 (2024) 875.
-
- 22. K.S.M. Kumar and L.J. Berchmans, Ceram. Int. 35 (2009) 1277–1280.
-
- 23. A.A. Silva, D.M.A. Melo, T.R. Costa, R.L.B.A. Medeiros, G.C. Anjos, F.C. Carvalho, R.A.B.N. Santiago, A.A.S. Oliveira, and R.M. Braga, J. Energy Inst. 118 (2025) 101877.
-
- 24. S.K. Sharma and M.M. Malik, Mater. Lett. 65 (2011) 1451-1453.
-
- 25. T. Wen, J. Yu, L. Yuan, E. Jin, T. Liu, C. Tian, and Y. Zhou, Ceram. Int. 46 (2020) 4256-4264.
-
- 26. C. Zhou, L. Wan, Z. Lou, S. Wu, S.A. Baig, and X. Xu, Environ. Sci. Pollut. Res. 30 (2023) 120030-120043.
-
- 27. Y.S. Noh, H. Song, and D.J. Moon, Catal. Lett. 155 (2025) 247.
-
- 28. C.J. Chang, T.F.M. Chang, T.H. Yang, W.K. Su, C.Y. Chen, M. Sone, and K.S. Lin, J. Taiwan Inst. Chem. Eng. 176 (2025) 106297.
-
- 29. A. Sobha, J. Johnson, and K.P. Abhina, J. Alloys Compd. 1037 (2025) 182365.
-
- 30. H.K.A. El-Hamid, E.M.A. Hamzawy, G.T. El-Bassyouni, and S. Mardin, Ceram. Int. 51 (2025) 23688-23700.
-
- 31. S. Didde, R.S. Dubey, S.K. Panda, and G.S. Babu, ACS Omega 8 (2023) 38064-38071.
-
- 32. D. Madej, M. Rajska, and A. Kruk, Ceram. Int. 46 (2020) 2373-2383.
-
- 33. P. Sakthivel, C. Karthikeyan, T. Prakash, K. Maheshvaran, S.S. Alharthi, and K. Ramachandran, Ceram. Int. 51 (2025) 19000-19011.
-
- 34. X. Pan, D. Zhang, Y. Wu, and H. Yu, Ceram. Int. 44 (2018) 13544-13550.
-
- 35. M.N. Singh, L.R. Singh, and A.G. Barua, Radiat. Phys. Chem. 188 (2021) 109631.
-
- 36. V. Singh, M. Yadav, and Y.C. Sharma, Fuel 203 (2017) 360-369.
-
- 37. M.M. Ali, S.A. Habeeb, and M.H. Al-Maamori, Phys. Open 25 (2025) 100319.
-
- 38. S.J. Hong, H.J. Mun, B.J. Kim, and Y.S. Kim, Micromachines 12 (2021) 1168.
-
- 39. T.N. Vidaarth, S. Surendhiran, S. Savitha, K.S.G. Jagan, S. Swetha, M. Kathirselvam, R. Mohanraj, and A. Karthik, J. Alloys Compd. Commun. 8 (2025) 100121.
-
- 40. N.J. Tamanna, M.S. Hossain, N.M. Bahadur, and S. Ahmed, Results Chem. 7 (2024) 101313.
-
- 41. K. Mahi, G. Benabdellah, K.A.Z. Ouari, and M. Trari, Indian J. Phys. 98 (2024) 4333-4339.
-
- 42. T.S. Mabelane, L.F. Koao, S.V. Motloung, T.E. Motaung, R.E. Kroon, and M.R. Mhlongo, J. Mol. Struct. 1260 (2022) 132751.
-
- 43. C. Jagadeeshwaran, K. Madhan, and R. Murugaraj, J. Mater. Sci.:Mater. Electron. 29 (2018) 18923-18934.
-
- 44. Y. Deng, Y. Gao, F. Zhu, B. Zhu, L. Huang, and J. Qiu, Ceram. Int. 50 (2024) 12319-12325.
-
- 45. A.N. Kiryakov, A.F. Zatsepin, A.S. Vagapov, B.L. Oksengendler, and N.V. Gavrilov, J. Phys. Chem. Solids 170 (2022) 110966.
-
- 46. A.N. Kiryakov, A.F. Zatsepin, and V.V. Osipov, J. Lumin. 239 (2021) 118390.
-
- 47. S.M. Yakout and A.M. El-Sayed, Adv. Powder Technol. 30 (2019) 2841-2850.
-
- 48. J. Tauc, R. Grigorovici, and A. Vancu, Phys. Status Solidi 15 (1966) 627-637.
-
- 49. R. Ahlawat, B. Goswami, N. Rani, M. Chauhan, and G. Rani, Appl. Nanosci. 13 (2023) 6151-6164.
-
- 50. D.M. Mamand, S.S. Khasraw, R.T. Abdulwahid, P.A. Mohammed, A. Hassanzadeh, O.G. Abdullah, D.S. Muhammad, S.B. Aziz, and J. Hassan, J. Sci.:Adv. Mater. Devices 10 (2025) 100937.
-
- 51. R. Ahlawat, B. Goswami, N. Jangra, B. Mohan, and G. Rani, Phys. Scr. 99 (2024) 1059b1.
-
- 52. D. Gao, Z. Zhang, Q. Xu, J. Zhang, Z. Yan, J. Yao, and D. Xue, Appl. Phys. Lett. 104 (2014) 022406.
-
- 53. R.M. Khattab, H.E.H. Sadek, and A.A. Gaber, Ceram. Int. 43 (2017) 234-243.
-
- 54. L.J. Collazos, D.R. Saldanha, G.P. Zamudio, R. Dutra, R.L. Sommer, and D.E.G. Chavez, J. Magn. Magn. Mater. 630 (2025) 173402.
-
- 55. E. Uyanga, B. Enkhmend, S. Kobayashi, T.Y. Kiseleva, N. Jargalan, and D. Sangaa, Mater. Today Commun. 44 (2025) 111996.
-
- 56. V. Seeman, E. Feldbach, T. Kärner, A. Maaroos, N.M. Ulmane, A.I. Popov, E. Shablonin, E. Vasil'chenko, and A. Lushchik, Opt. Mater. 91 (2019) 42-49.
-
- 57. C. Srinivas, S.S. Meena, P. Bhatt, E.R. Kumar, V. Rajendran, P. Balraju, and D.L. Sastry, Inorg. Chem. Commun. 179 (2025) 114738.
-
- 58. A.C. Heredia, M.I. Oliva, U. Agú, C.I. Zandalazini, S.G. Marchetti, E.R. Herrero, and M.E. Crivello, J. Magn. Magn. Mater. 342 (2013) 38-46.
-
- 59. K. Syrek, E. Wierzbicka, M. Zych, D. Piecha, M. Szczerba, M.S. Mroz, J.K. Kołodziej, and G.D. Sulka, J. Photochem. Photobiol., C 62 (2025) 100681.
-
- 60. S.H. Yang, C.C. Ho, Y.Y. Tsai, and S.M. Liao, Opt. Mater. 167 (2025) 117316.
-
- 61. B. Zhai and Y.M. Huang, Physica B 646 (2022) 414284.
-
- 62. F. Kermani, S. Mollazadeh, and J.V. Khaki, Ceram. Int. 45 (2019) 13496-13501.
-
- 63. L. Zhang, C. Wang, T. Zhang, W. Jin, C. Ding, and Z. Wang, Mater. Today Commun. 44 (2025) 111859.
-
- 64. Y. Kazarinov, J.W. Tomm, A. Prokhorov, R. Minikayev, J.Z. Domagala, J. Gabrusenoks, A.I. Popov, I. Shcherbakov, S. Orel, and K. Lamonova, J. Lumin. 277 (2025) 120970.
-
- 65. R. Panda, M. Behera, R.A. Kumar, and D. Joshi, Mater. Sci. Eng., B 299 (2024) 117006.
-
- 66. L. Museur, E. Feldbach, Y. Smortsova, A. Kotlov, and A. Kanaev, J. Lumin. 279 (2025) 121029.
-
- 67. L. Pan, S. Sholom, S.W.S. McKeever, and L.G. Jacobsohn, J. Alloys Compd. 880 (2021) 160503.
-
- 68. H. Zeng, G. Duan, Y. Li, S. Yang, X. Xu, and W. Cai, Adv. Funct. Mater. 20 (2010) 561-572.
-
- 69. Y.S. Kim and C.H. Park, Phys. Rev. Lett. 102 (2009) 086403.
-
- 70. G.H. Sun, Q.L. Zhang, J.Q. Luo, L.C. Li, Z. Deng, and R.G. Zhang, J. Lumin. 234 (2021) 117956.
-
- 71. V. Babin, V. Hreb, A. Krasnikov, V. Stadnik, L. Vasylechko, and S. Zazubovich, Mater. Res. Bull. 193 (2026) 113710.
-
- 72. B.M. Mothudi, O.M. Ntwaeaborwa, J.R. Botha, and H.C. Swart, Physica B 404 (2009) 4440-4444.
-
- 73. B. Zhai and Y.M. Huang, Europhys. Lett. 127 (2019) 17001.
-
- 74. V.N. Kuzovkov, E.A. Kotomin, A. Lushchik, A.I. Popov, and E. Shablonin, Opt. Mater. 147 (2024) 114733.
-
- 75. E.R. Wang, T.C. Huang, Y.H. Chang, Y.H. Wu, S.W. Ke, C.H. Chang, C.Y. Lee, B.Y. Chen, G.C. Yin, M.T. Tang, and B.H. Lin, Opt. Mater. 142 (2023) 114146.
-
- 76. V. Skuratov, O. Korolik, M. Mamatova, J. O’Connell, N. Kirilkin, A. Dauletbekova, and A. Akilbekov, J. Lumin. 283 (2025) 121259.
-
 This Article
-
2026; 27(1): 130-140
Published on Feb 28, 2026
- 10.36410/jcpr.2026.27.1.130
- Received on Nov 5, 2025
- Revised on Jan 9, 2026
- Accepted on Jan 26, 2026
Services
- Abstract
introduction
experiment
results and discussion
conclusions
- Acknowledgements
- Declaration of Interest
- References
- Full Text PDF
Shared
Correspondence to
- Thanit Tangcharoen
-
Department of Basic Science and Physical Education, Faculty of Science at Sriracha, Kasetsart University, Sriracha Campus, Chonburi 20230, Thailand
Tel : +66-38-354580-4 ext. 663013 - E-mail: sfscitnt@ku.ac.th
Clean-Energy Research Institute(CRI), Hanyang University, 222, Wangsimni-ro, Seongdong-gu, Seoul, 04763, Korea
E-mail: jcpr@hanyang.ac.kr