


- Influence of process routes on microstructure and mechanical properties of AA 5083 alloy processed by equal channel angular extrusion
T. Venugopala,*, R. Thirumalaib, D. Tamilvendanc and R. Prakashd
aAssociate Professor, Department of Mechanical Engineering, KGiSL Institute of Technology, Coimbatore, Tamilnadu
bProfessor, Department of Aeronautical Engineering, Hindusthan Institute of Technology, Coimbatore, Tamilnadu
aAssistant Professor, Department of Mechanical Engineering, School of Engineering, Mohan Babu University, Tirupathi, Andhra Pradesh
aAssistant Professor, Department of Mechanical Engineering, AVS College of Technology, Salem, TamilnaduThis article is an open access article distributed under the terms of the Creative Commons Attribution Non-Commercial License (http://creativecommons.org/licenses/by-nc/4.0) which permits unrestricted non-commercial use, distribution, and reproduction in any medium, provided the original work is properly cited.
The present investigation deals with the possible mechanism of improving the strength and ductility of AA-5083 alloy through severe plastic deformation (SPD). The grain refinement of ~4 μm is achieved using the equal channel angular extrusion (ECAE) of the SPD process. The as-received AA-5083 alloy was pre-annealed before the ECAE process. The annealed alloy was subjected to two different routes(RBC and RC) of ECAE process. The alloy processed under different routes (RBC and RC) exhibits the combination of enhanced strength and ductility due to finer microstructures. However, the RBC posses the enhanced yield strength of 392 MPa and 27% ductility. It is attributed to the shearing of planes in all three directions. Meanwhile, the RC processed alloy possess the increased strength, compared with the base alloy. The microstructural refinement obtained through the SPD process is corroborated with the compression, hardness and wear behaviour of the alloy. The base alloy exhibits the ultimate compressive strength of 168 MPa with the ductility of 22%. The SPD processed alloys RBC and RC exhibits the ultimate compressive stress of 535 MPa and 424 MPa. The hardness results also validate the enhanced strength of the SPD processed alloys. The (RBC) and (RC) exhibits the micro hardness values of 152Hv and 148 Hv respectively. The wear behaviour of the SPD processed alloys is analyzed using the Taguchi orthogonal array (L9).
Keywords: AA-5083 alloy, ECAE, Process routes, microstructure, mechanical properties, wear, severe plastic deformation.
Aluminum (Al) alloys are widely utilized in the automotive and aerospace industries due to their desirable properties and a high strength-to-weight ratio. Despite these advantages, the strength of aluminum and its alloys is generally lower compared to other structural materials. To enhance the strength of aluminum alloys, various techniques such as heat treatment, thermomechanical processing, and creating an Ultrafine-Grained (UFG) structure can be employed. Metals with UFG microstructures offer a superior combination of strength and toughness compared to their bulk counterparts, leading to significant global research interest in producing such materials. Grain size can be modified using Severe Plastic Deformation (SPD) techniques. SPD methods, including High Pressure Torsion (HPT), Accumulative Rolling Bonding (ARB), Equal Channel Angular Pressing (ECAP), and Multi-Axial Forging (MAF), are prominent for producing ultrafine-grained materials. Among these, ECAP is particularly notable for refining coarse-grained materials into an ultrafine-grained structure. ECAP is widely used due to its ability to produce a homogeneous microstructure without altering the dimensions of the specimen. The ECAP process offers four distinct routes (RA, RB, RBC, and RC) each impacting the anisotropy of the microstructure and the mechanical properties of the processed alloys.
The AA 5083 alloy possess the excellent functional properties such as lightweight, highly ductile, durability, weldability and superior corrosion resistance [1]. These highly desirable properties are in high demand in the automobile and aviation sectors [2]. However, the AA 5083 displays inferior strength to other structural based Al alloys. Further, this alloy falls under the non heat treatable category among the aluminium based alloys [3]. It led to the quest for alternate strengthening mechanisms which improves the strength and ductility of the AA 5083 alloy. However, grain refinement is one of the prominent methods employed to improve the strength of the alloys [4]. Grain refinement can be achieved using any of the severe plastic deformation methods. The severe plastic deformation (SPD) technique is among the strengthening mechanism that has been exercised to improve the mechanical properties of the Al 5083 alloy [5]. Among the SPD methods, the equal channel angular pressing extrusion (ECAE) is the most widely employed technique to improve the strength of AA 5083 alloy [6]. The ECAE process outclasses other SPD methods due to its unique nature of improving the strength without sacrificing the sample geometry. Further, it has distinct nature of controlling the microstructure in the various directions. Through this method, the structure-property of the alloys can be controlled [7].
In this study, an investigation has been attempted to study the influence of ECAE process on grain refinement. The parental AA 5083 alloy was pre-annealed and subjected to ECAE process under different routes such as RBC and RC. The RBC and RC routes were chosen because they impose distinct strain paths: RBC introduces shear on all three orthogonal planes (X, Y, Z), whereas RC limits deformation to X and Y. This contrast directly tests the hypothesis that multidirectional shear promotes superior grain refinement and isotropy. RA and RB were omitted since they exhibit repetitive shear orientation with less impact on strain distribution. Post-process annealing and other surface treatment such as shot peening or anodizing could further enhance wear performance by stabilizing refined grains and increasing surface hardness. The ECAEed samples were subjected to dry sliding wear behaviour to understand the wear characteristics of the fine-grained structures achieved with two different processing routes. The wear studies have been performed by varying three processing parameters such as sliding distance (S), sliding velocity (V) and material (M) using the Taguchi orthogonal array.
The novelty of this work lies in demonstrating route-specific strengthening of AA5083 alloy through comparative analysis of RBC and RC ECAE routes. While several studies have addressed grain refinement using SPD, limited data exist for non-heat-treatable AA5083 subjected to multiple ECAE passes under different rotation routes. Our work systematically correlates microstructural refinement, mechanical response, and wear performance via Taguchi optimization, thereby establishing a direct process–structure–property relationship relevant for route selection in industrial applications.
In this study, only RBC and RC routes were selected because these two routes represent contrasting strain path conditions. RBC involves rotation in three planes (0°, 90°, 180°, 270°), promoting uniform strain distribution and finer grain refinement, while RC involves rotation between 0° and 180°, inducing directional shear. Routes RA and RB were excluded as their strain path symmetry and limited plane rotation generally lead to lower refinement efficiency and less uniform deformation, as reported in earlier studies. This study did not include EBSD or TEM analysis to directly quantify grain boundary misorientation. Long term fatigue and corrosion behavior of the processed alloy were not examined. Future studies should address these aspects to extend industrial relevance.


Materials and Methods
In this study, Aluminium Magnesium alloy (AA5083) was employed as base alloy. The chemical composition of as received AA5083 alloy was analyzed using atomic absorption spectroscopy (AAS) and it is summarized in Table 1.
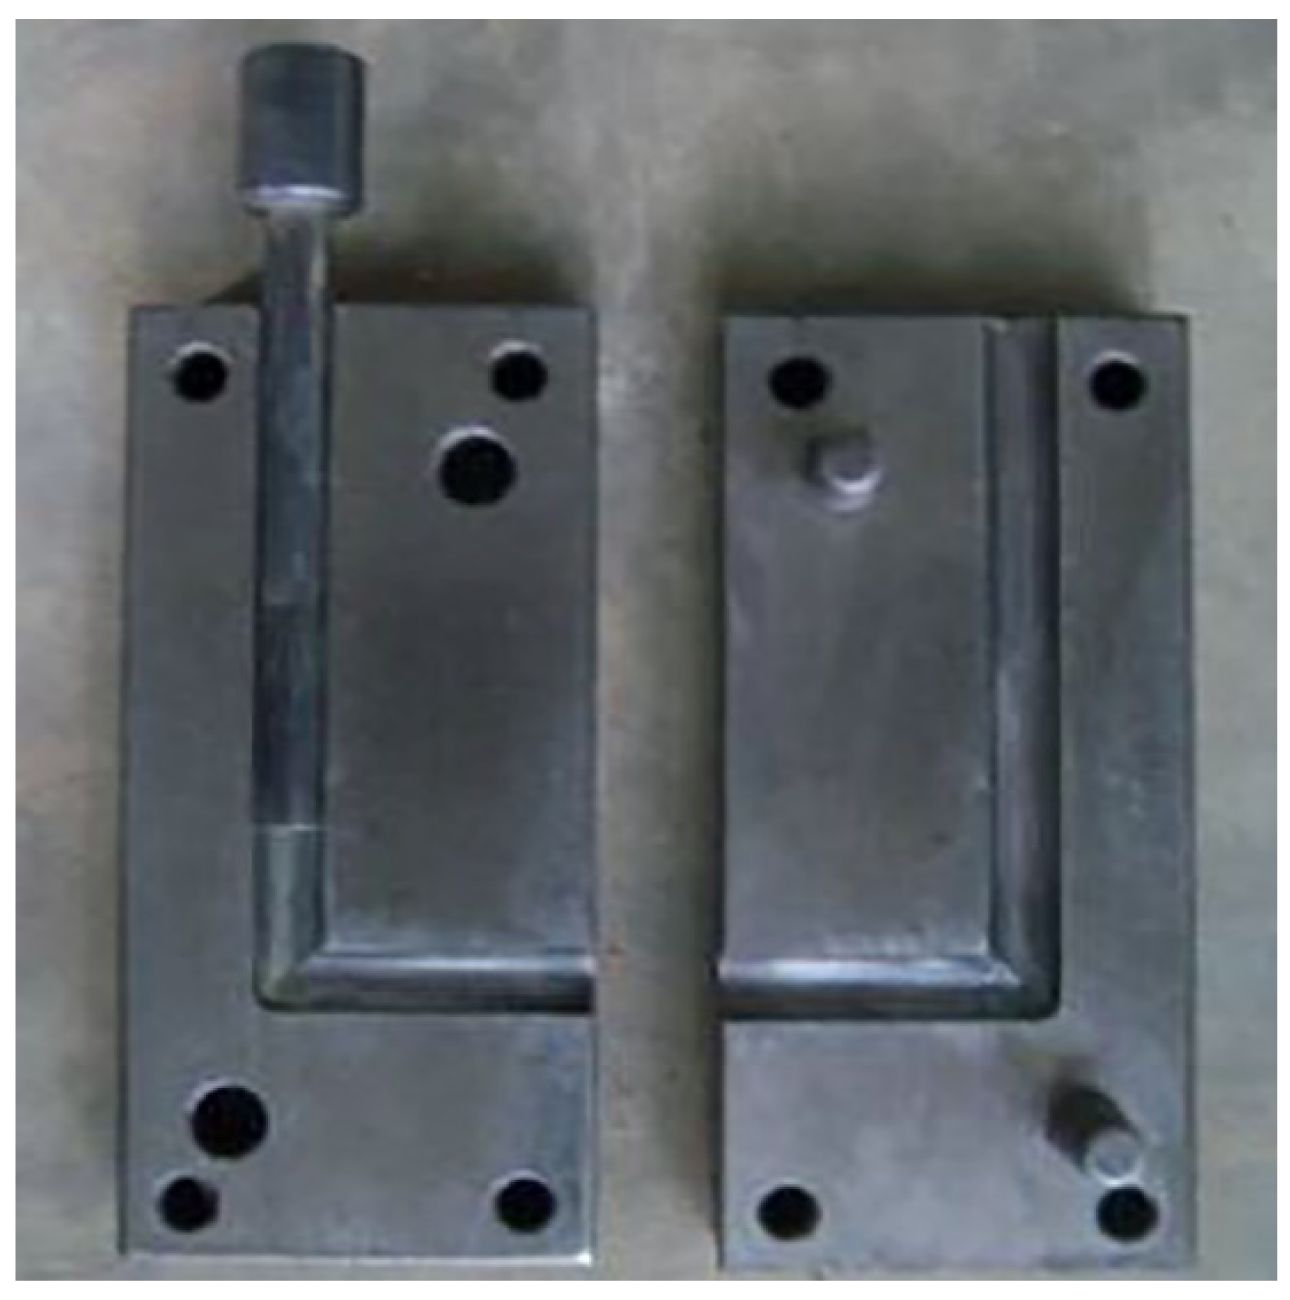
The alloy was machined to the required dimensions of 12 mm × 15 mm to carry out the ECAE process. The machined ingots were subjected to annealing treatment at 420 °C for an hour and furnace cooled, to relieve internal stress induced during the machining process. The schematic of the ECAE die is presented in Fig. 1. The annealed samples and the die walls were coated with the molybdenum disulfide (MoS2) lubricant. The purpose of lubricant is to reduce the friction encountered while the sample passing through the channel and die angle. The ECAE process has been performed upto three passes under two varying (RBC and RC) routes at room temperature. The parental and ECAEed alloys were ground and fine polished with alumina powder. The base and the ECAEed alloys were characterized by optical and electron microscopy, Vickers hardness and the compression test. The ECAEed samples were cut parallel to the extruded direction for the compression test which was carried out as per the ASTM E9 standards using Tinius Olsen tester. Vicker’s hardness test has been performed as per ASTM E92 test conditions using Wilson Hardness tester, China, under the constant load of 0.3 kg for the dwell time of 15s. The dimensions of the compression sample are maintained with 1:2 aspect ratio and test were conducted till fracture under the strain rate of 1×10⁻³ s-1.
Experimental design for wear study
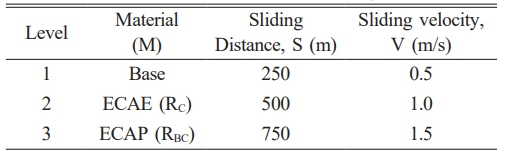
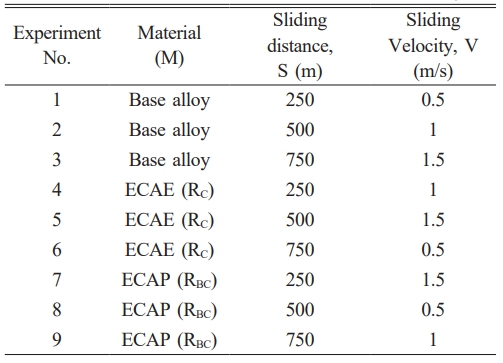
The dry sliding wear test was carried out at an ambient temperature using a pin on disc machine for the constant load of 10N. The test specimens conform to the specifications of ASTM G99 test standards. The influence of processing parameters were understood from Taguchi (L9) orthogonal array. The parameters and levels considered in this study are listed in Table 2. The chosen parameters for each dry sliding wear experiment based on the Taguchi L9orthogonal array are shown in Table 3.
|
Fig. 1 Schematic of the ECAE die. |
Influence of processing routes on the microstructural evolution
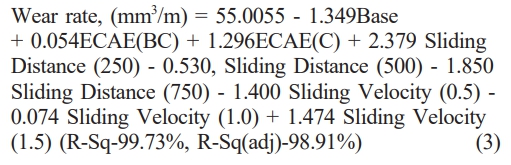
The optical microstructures of base and ECAEed (RBC and RC) AA 5083 alloy are presented in the Fig. 2. The as received AA 5083 alloy microstructure (Fig. 2a) demonstrate the elongated and coarser grains. However, the ECAEed (3-passes) microstructures (Figs. 2 b-c) reveals the microstructural refinement in both the routes processing (RBC and RC). The significant grain refinement is achieved through the continuous dynamic recovery and recrystallization (CDRR) process [8]. This is the general mechanism which is associated with the grain refinement through the ECAE process. The CDRR mechanism involves the evolution of subgrains during the shearing of planes in every direction. Although CDRR is inferred from microstructural observations, future work involving EBSD or TEM characterization would be necessary to confirm grain boundary misorientation and validate the proposed model.
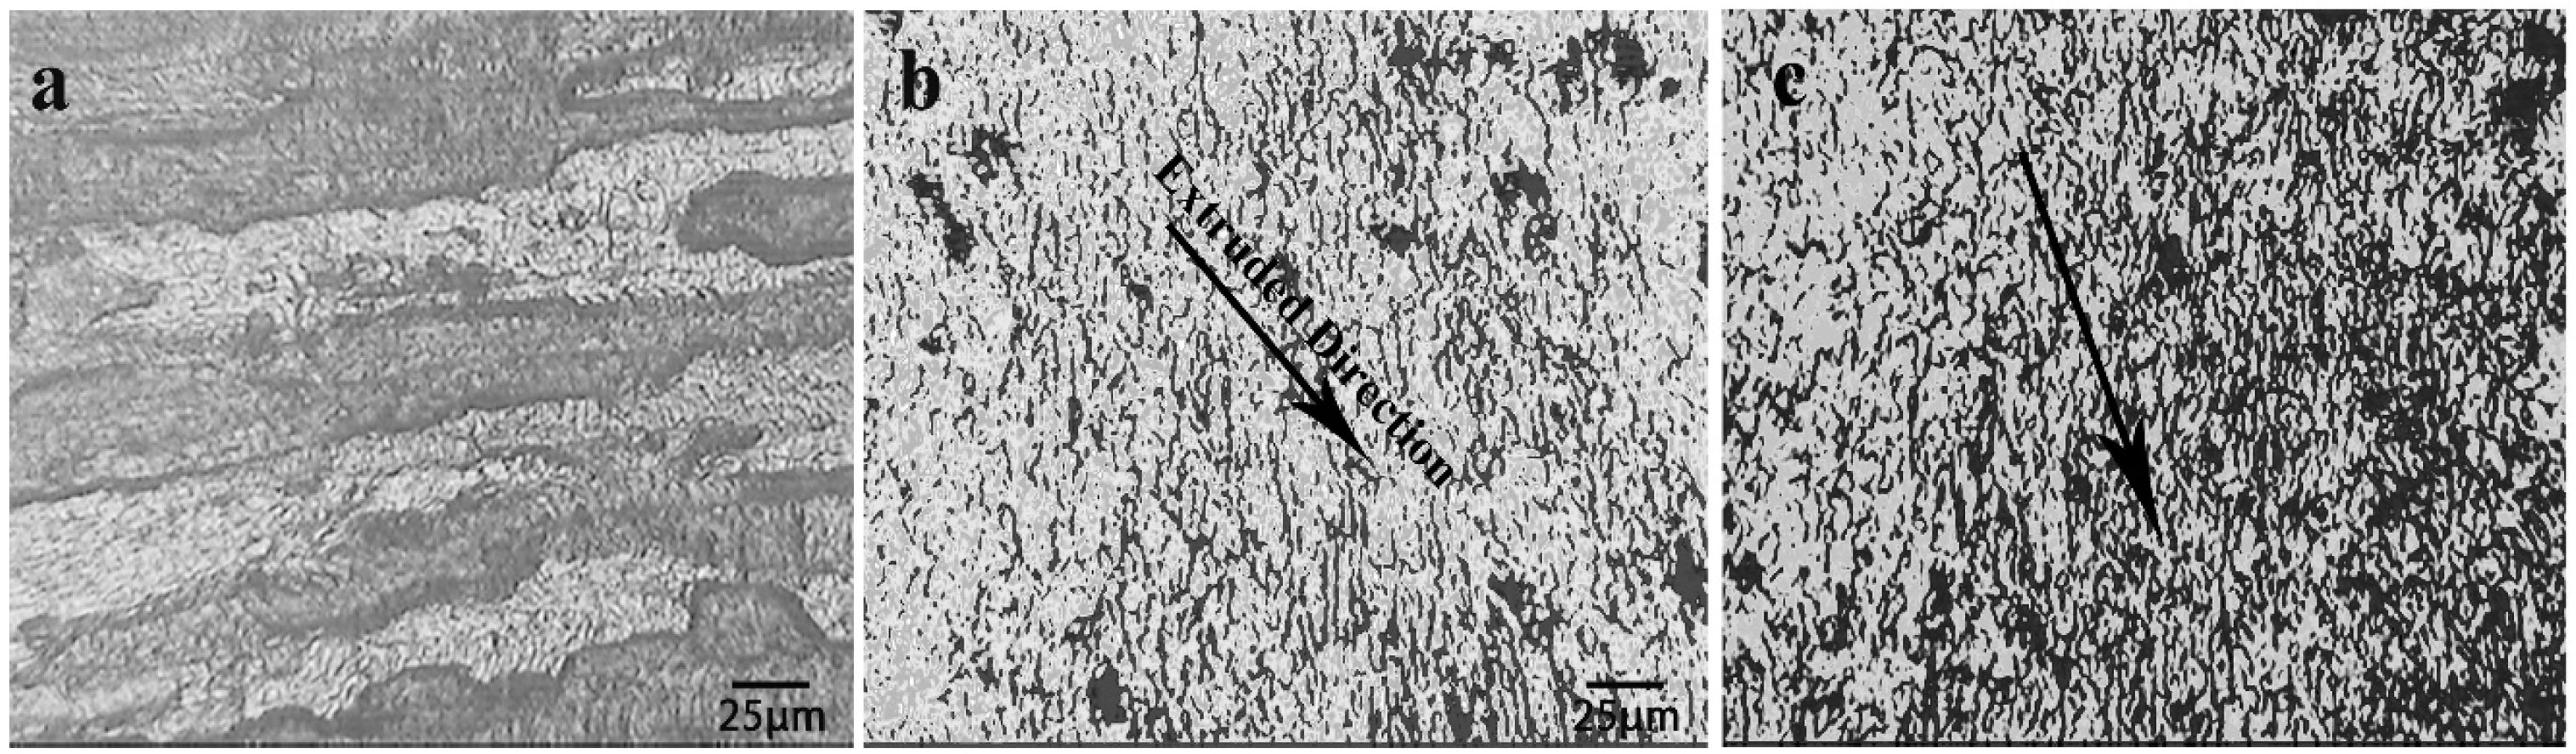
The grain size distribution plot is explicit in Fig. 3. The plots indicate the variation of grain sizes between the as-received alloy and the strain imposed ECAEed samples. The grain size distribution plot further indicates the average grain size of the base alloy is ~38 μm. Interestingly, the ECAEed samples both RBC and RC possess almost the uniform grain sizes of ~4 μm.
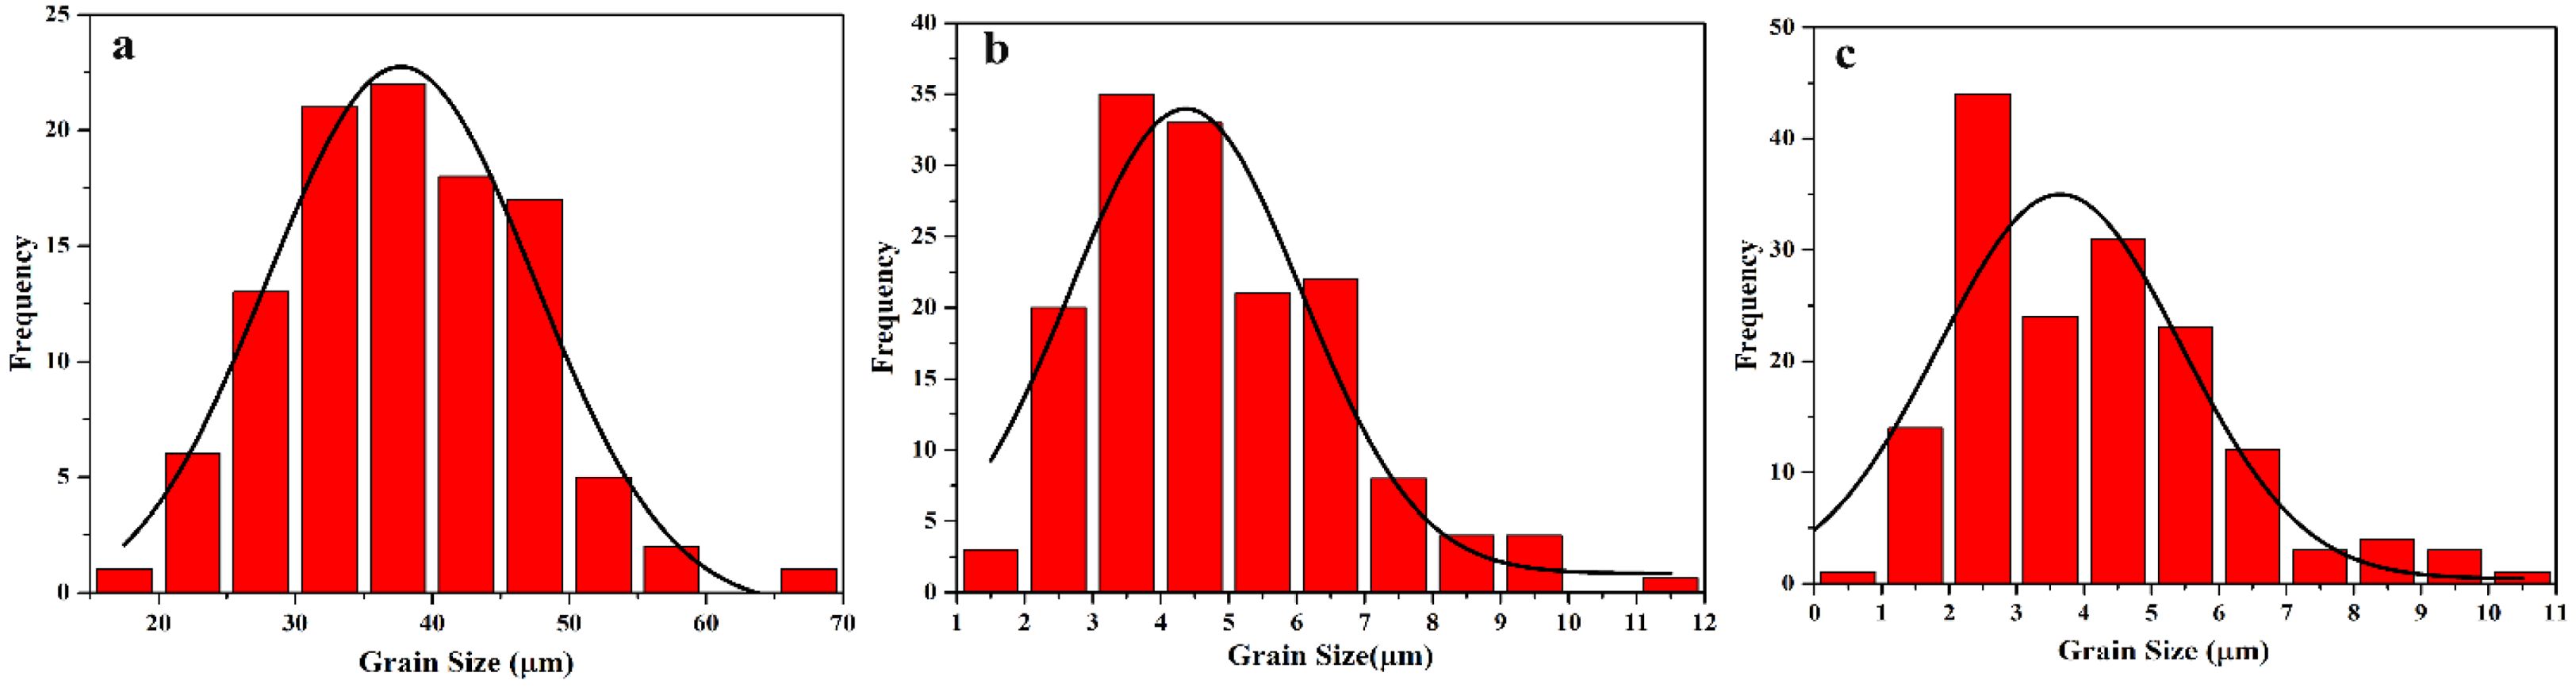
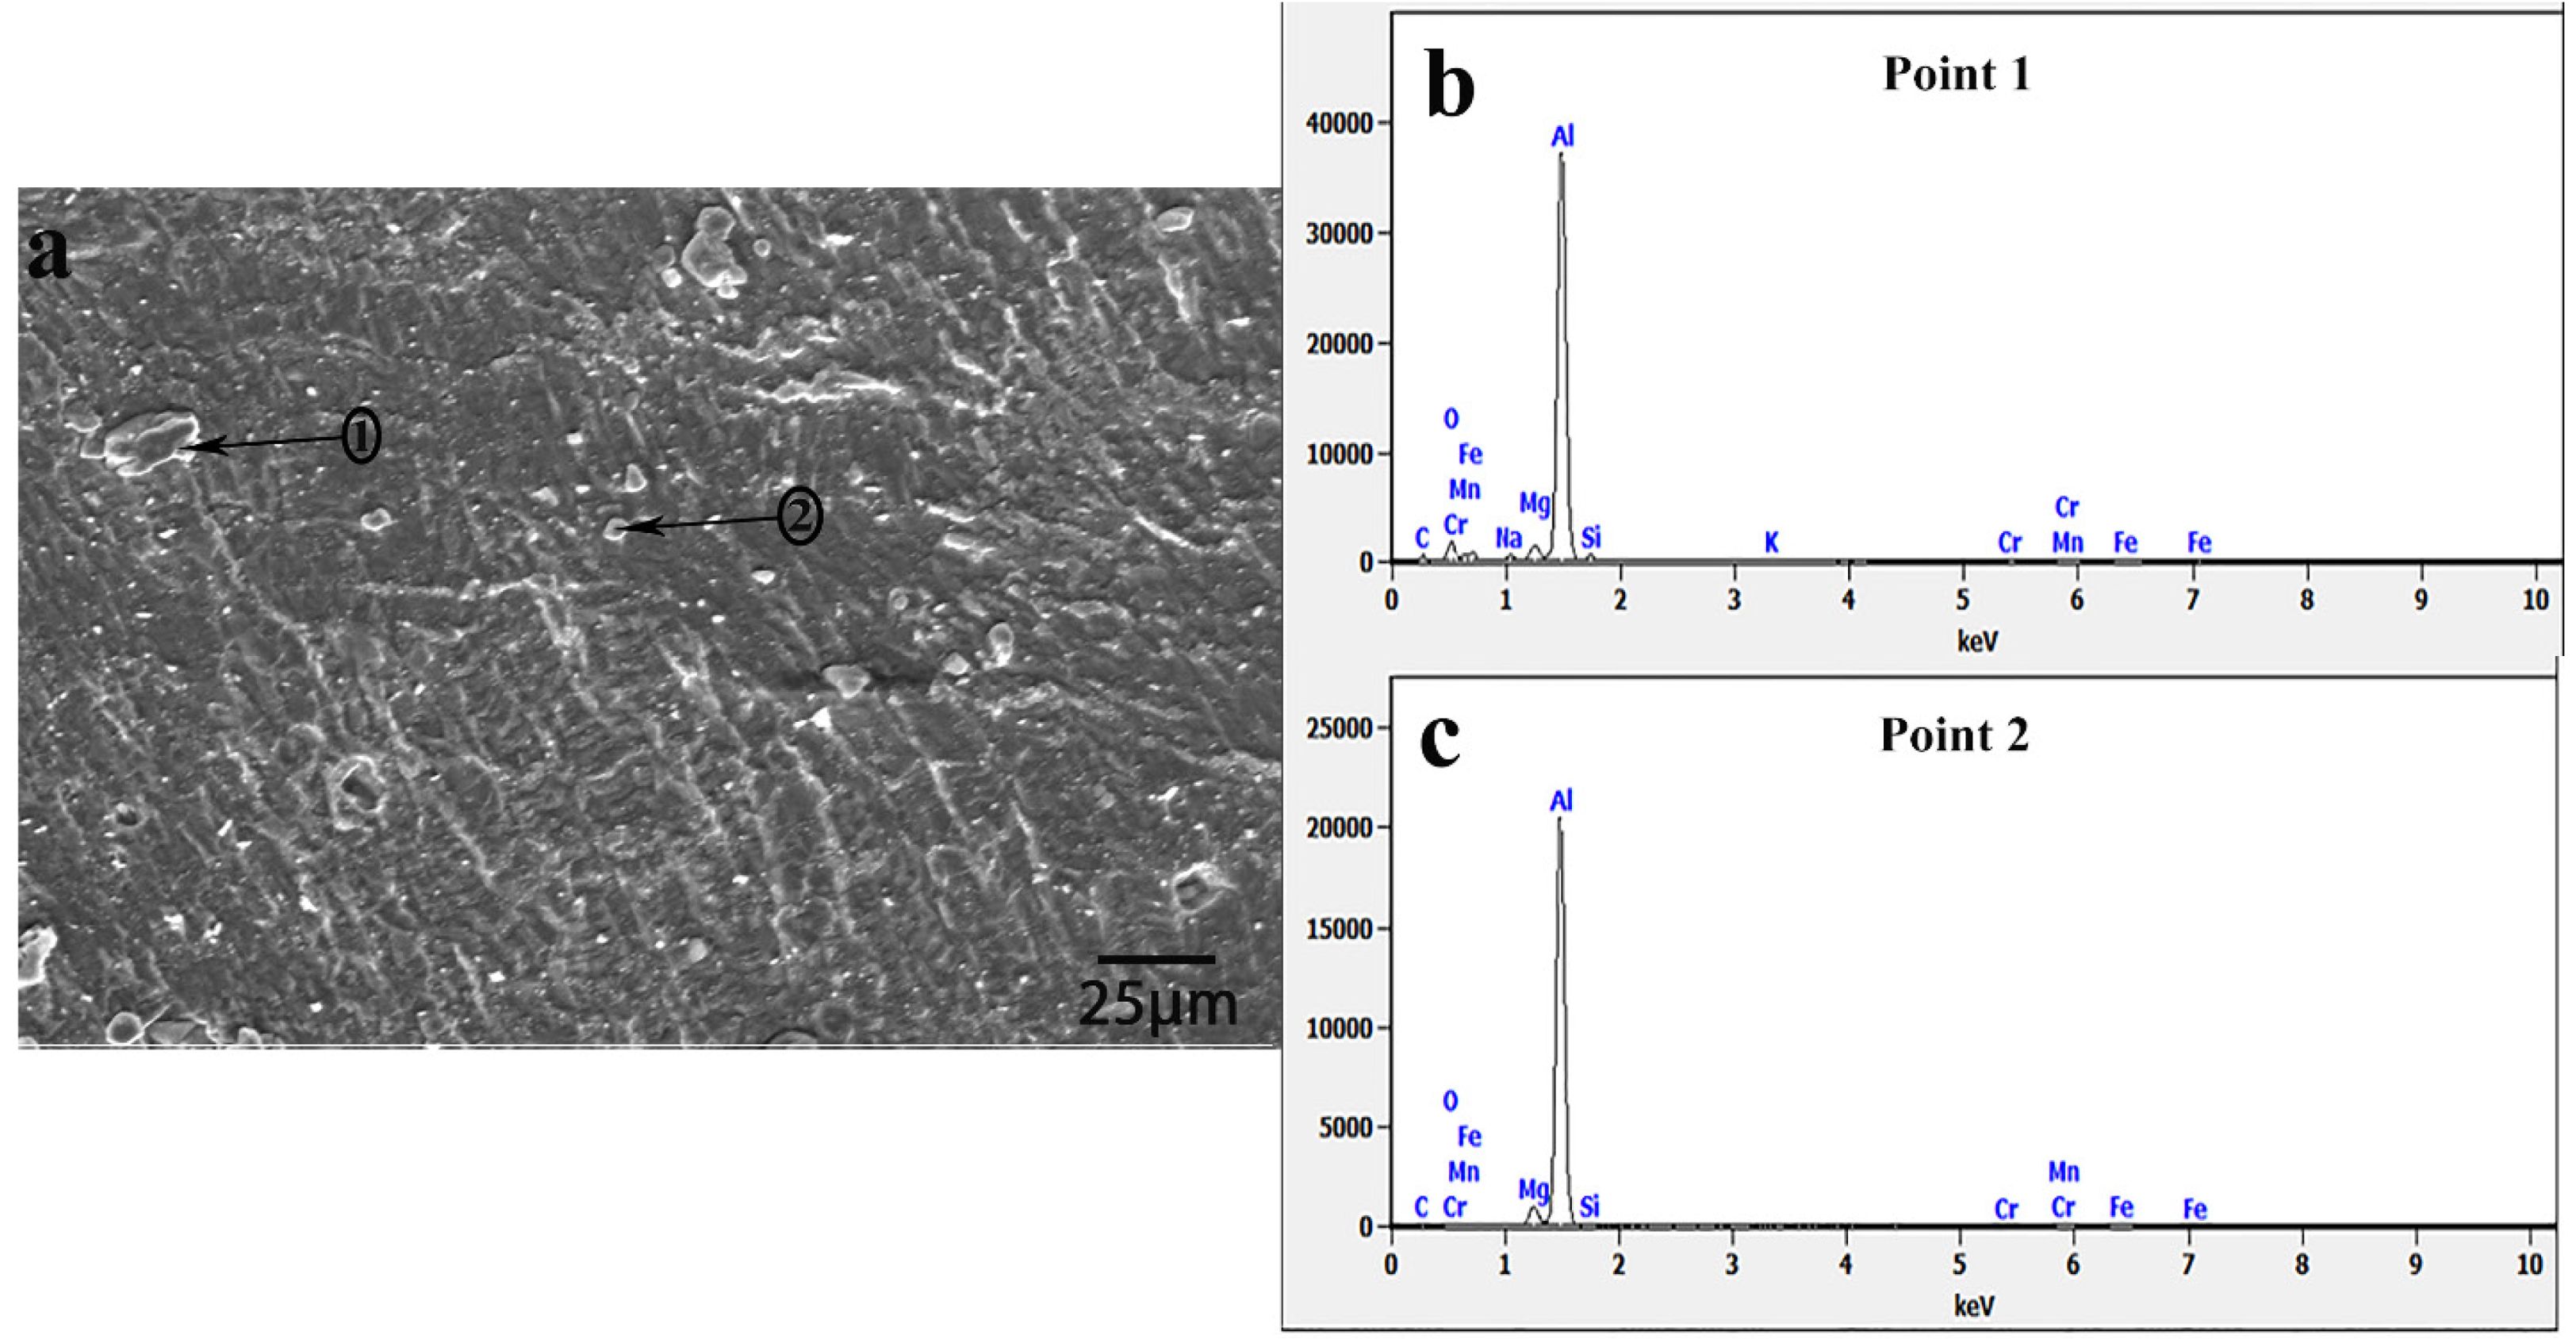
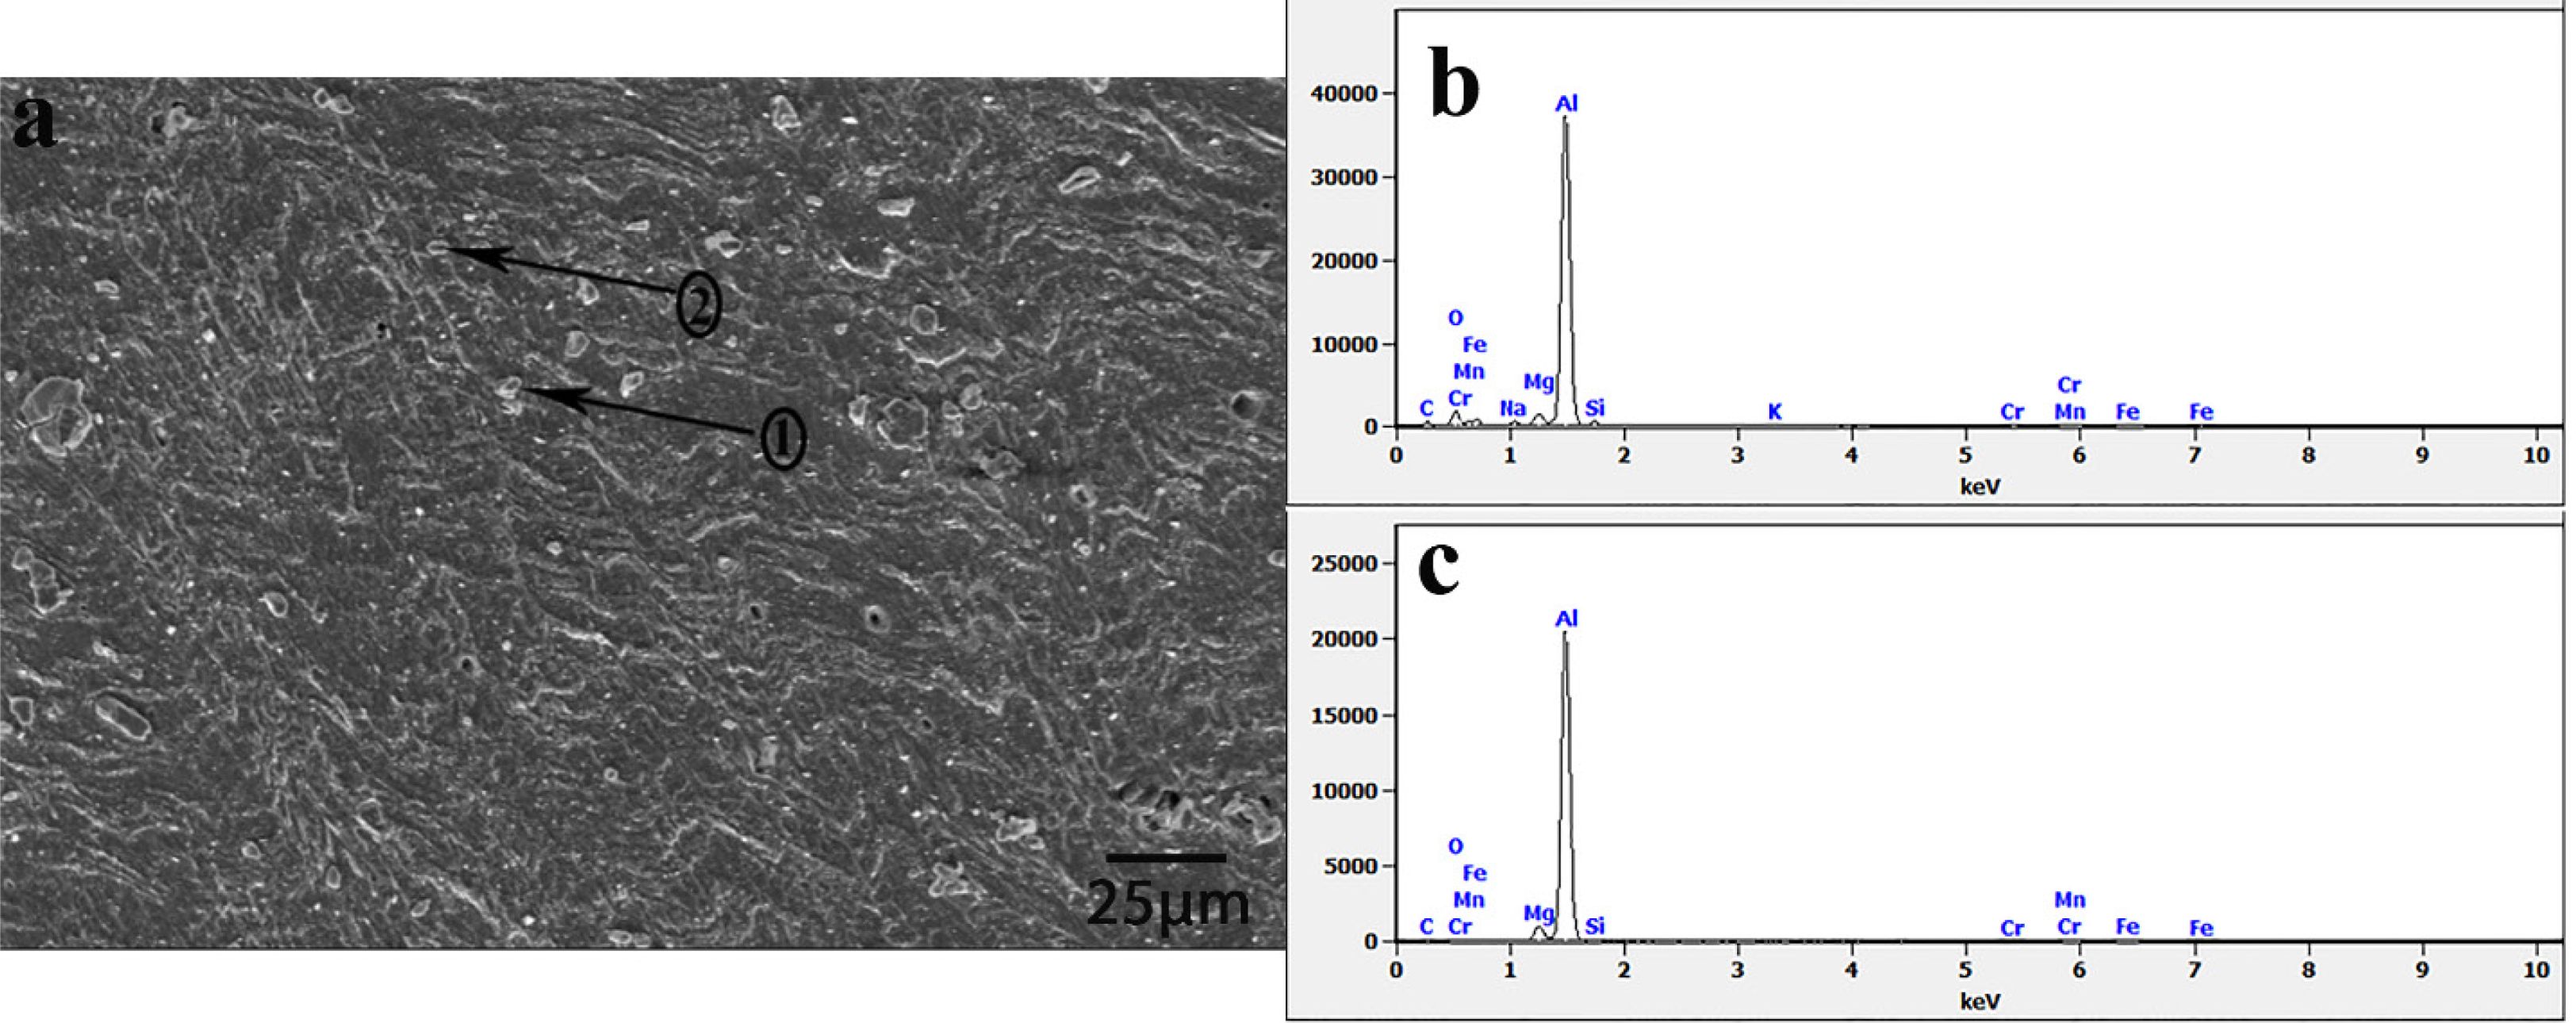
The SEM micrographs of the base and ECAEed AA-5083 alloy and the corresponding EDS spectrum are depicted in Figs. 4-6. In general, all the spectrum confirms the presence of various alloying elements such as Mg and Mn content. Further, the SEM micrograph reveals the presence of coarser and semi-coherent Mg17Al12 intermetallic compound point (1). This compound is present in the Al-Mg system when the Mg content exceeds the solid solution limit [9].
EDS spectra confirmed uniform Mg and Mn distribution in both RBC and RC samples. No segregation or enrichment of alloying elements was detected, indicating that severe deformation enhanced elemental homogeneity and suppressed intermetallic clustering.
Influence of processing routes on the compressive behaviour of AA 5083 alloy
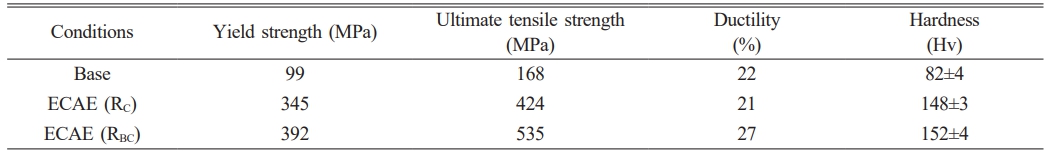
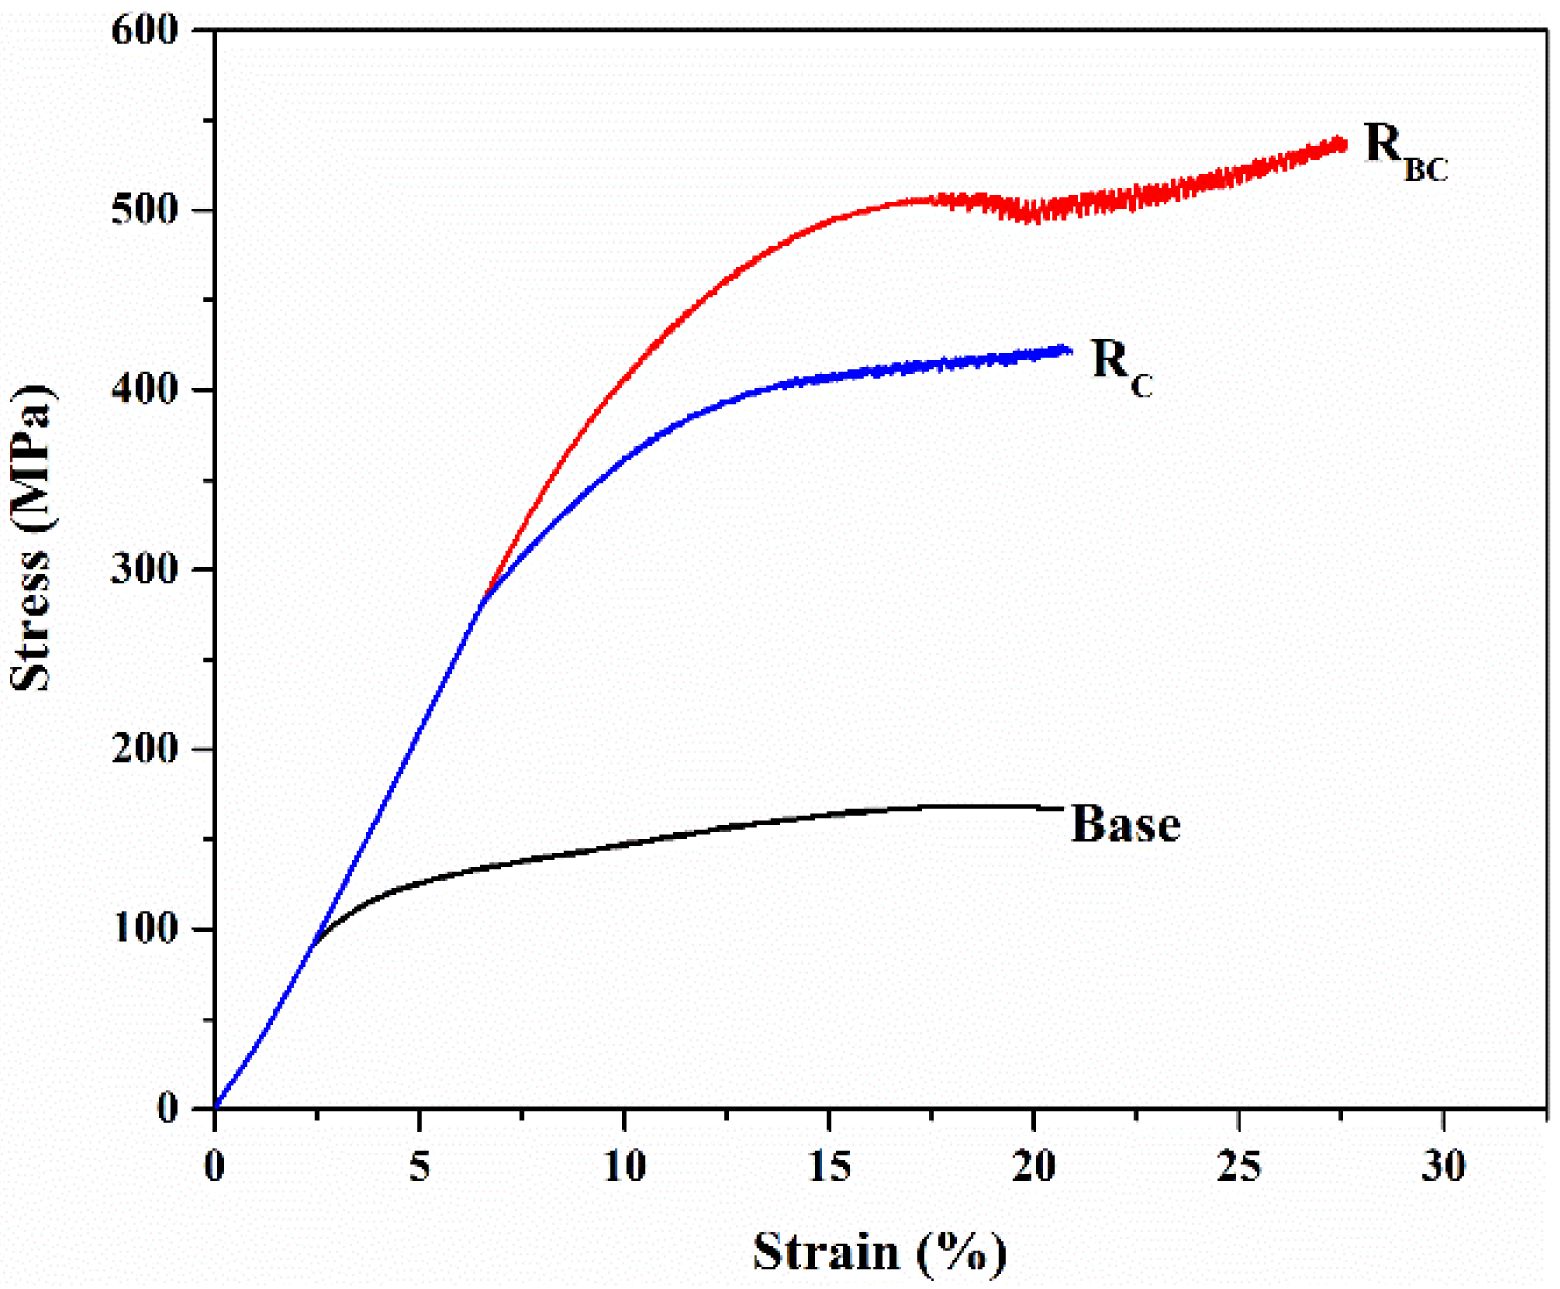
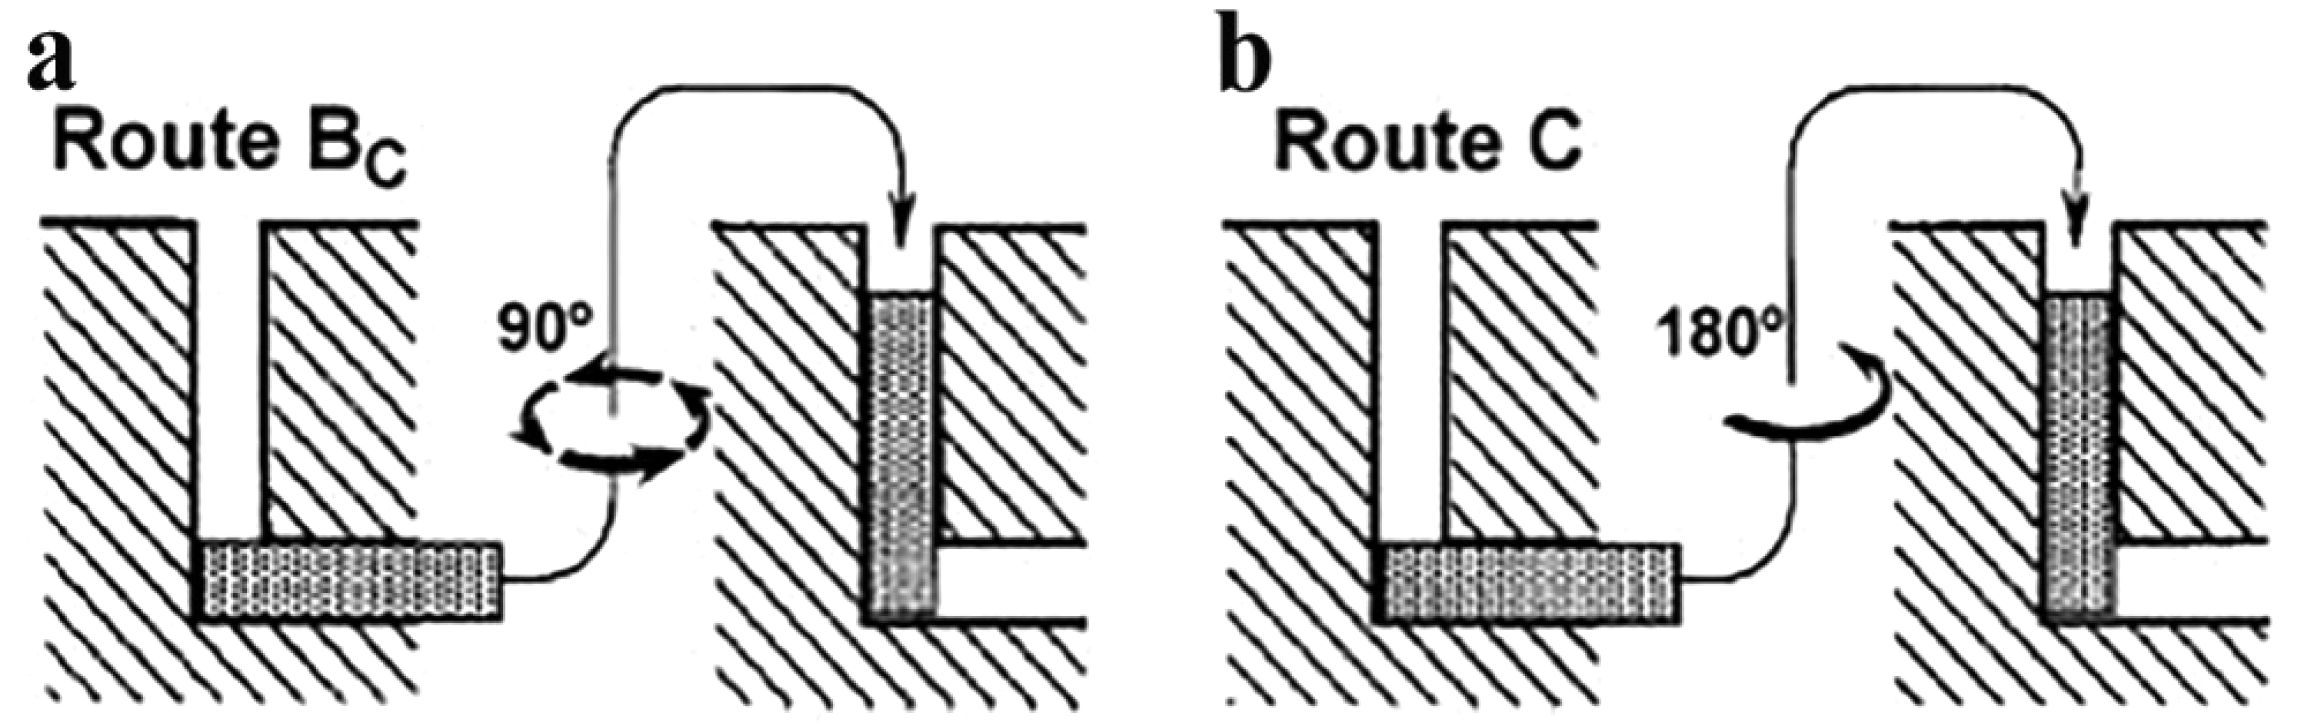
The stress-strain behaviour of compressed AA 5083 alloy is presented in Fig. 7. The curves explicit the role of ECAE process on both the ECAEed samples. The compressive test results are tabulated in Table 4. The base alloy exhibits the compressive strength of 168 MPa. The yield strength of base alloy is 99 MPa with the ductility of 22%. However, the ECAE process has significantly enhanced the strength without any concomitant loss in ductility. The RC process exhibit the maximum yield strength (345 MPa) and ultimate compressive strength (424 MPa) compared with the base alloy. The ductility of the RC is 21% which is superior to the base alloy. However, the RBC processed alloy exhibits the compressive strength of YS and UTS is 392 MPa and 535 MPa, respectively. The RBC processed alloy exhibits the maximum strength as compared with the RC processed alloy. The rotation of samples during the ECAE process led to the increment in strength and ductility of ECAEed alloys. In the case of RBC, the strain is shared by all three directions (X,Y and Z). As a result, the distribution of strain is uniform, in all three directions. The rotation ensures the distribution of strains uniformly as such RBC (0°−90°−180°−270°−360°). However, the RC process restricts the sharing of strains in all the directions. The RC process involves the sample rotation of 180 degrees between two passes [10]. This allows the deformation or strain imposing only on the X and Y planes. However, the deformation along the Z direction is restricted. The RC process induces the shear on the following path as (0°−180°−360°−0°−180°). The schematic of these two mechanisms is illustrated in Fig. 8. Since the shearing of planes in the Z direction is restricted, the strength of the RC is inferior to the RBC processed sample. A similar trend is observed in the hardness tests. The hardness of the base material is 82Hv. However, after the ECAE process the RC and RBC processed ECAEed alloy exhibits the hardness values of 148Hv and 152Hv, respectively.
The mechanical and hardness measurements were repeated three times to ensure reproducibility. The reported values represent the mean of the repeated trials, and the standard deviation was within ±3% for all test results. The relationship between grain size and yield strength follows the Hall–Petch equation, σy = σ₀ + k × d⁻1/2, with σ₀ = 85 MPa and k = 0.65 MPa × m1/2. This indicates that refinement to ~4 μm grains contributed significantly to the observed strength enhancement. The Mg₁₇Al₁₂ intermetallic compound also improves hardness and wear resistance through its high load-bearing capacity and ability to hinder dislocation motion. Mg₁₇Al₁₂ acts as a load-bearing phase that resists plastic flow and contributes to wear resistance by impeding dislocation motion. Its semi-coherent nature aids strain accommodation without embrittlement. Uniform dispersion after ECAE ensures improved strength–ductility synergy.
Influence of processing routes on the wear behaviour of AA 5083 alloy
To optimise the process parameters for the various factors and its levels the Taguchi orthogonal array has been widely employed [11]. The Taguchi method is one of the promising technique to compare the experimental and desired outputs. The Taguchi technique employs a loss function which is converted into a another variable namely, signal to noise ratio (η). The signal to noise ratio has three different types of evaluating the engineering parameters such as Larger the better, Smaller the better and Nominal the best [12, 13]. Since the present study aims at reducing the wear of AA 5083, Lower the better is preferred.

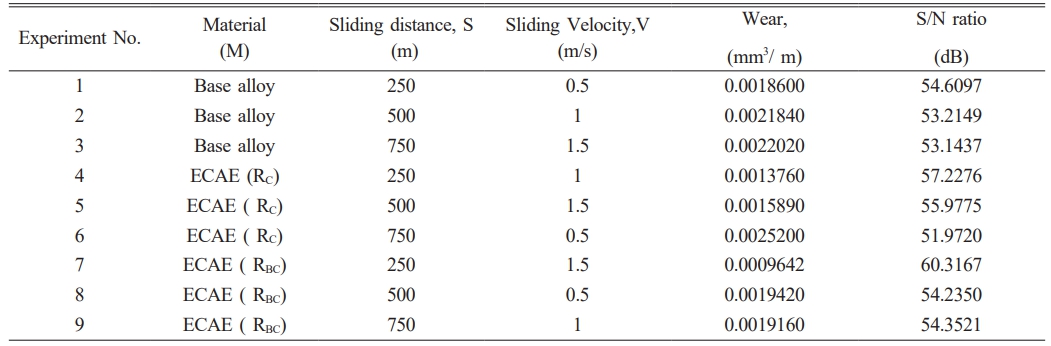
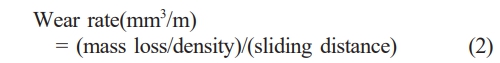
Where yi is the data obtained during the wear test at the ith experiment and n is the number of observations [14]. The Table 5 displays the calculated wear rate data and the signal to noise ratio results. The signal to noise ratio values were obtained using the statistical software Minitab.18. The wear rate is calculated using the following formula which is reported elsewhere [15].
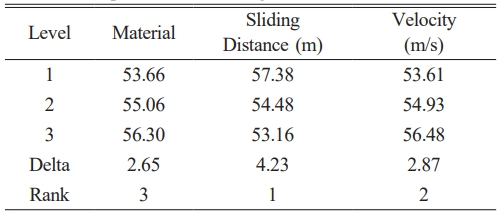
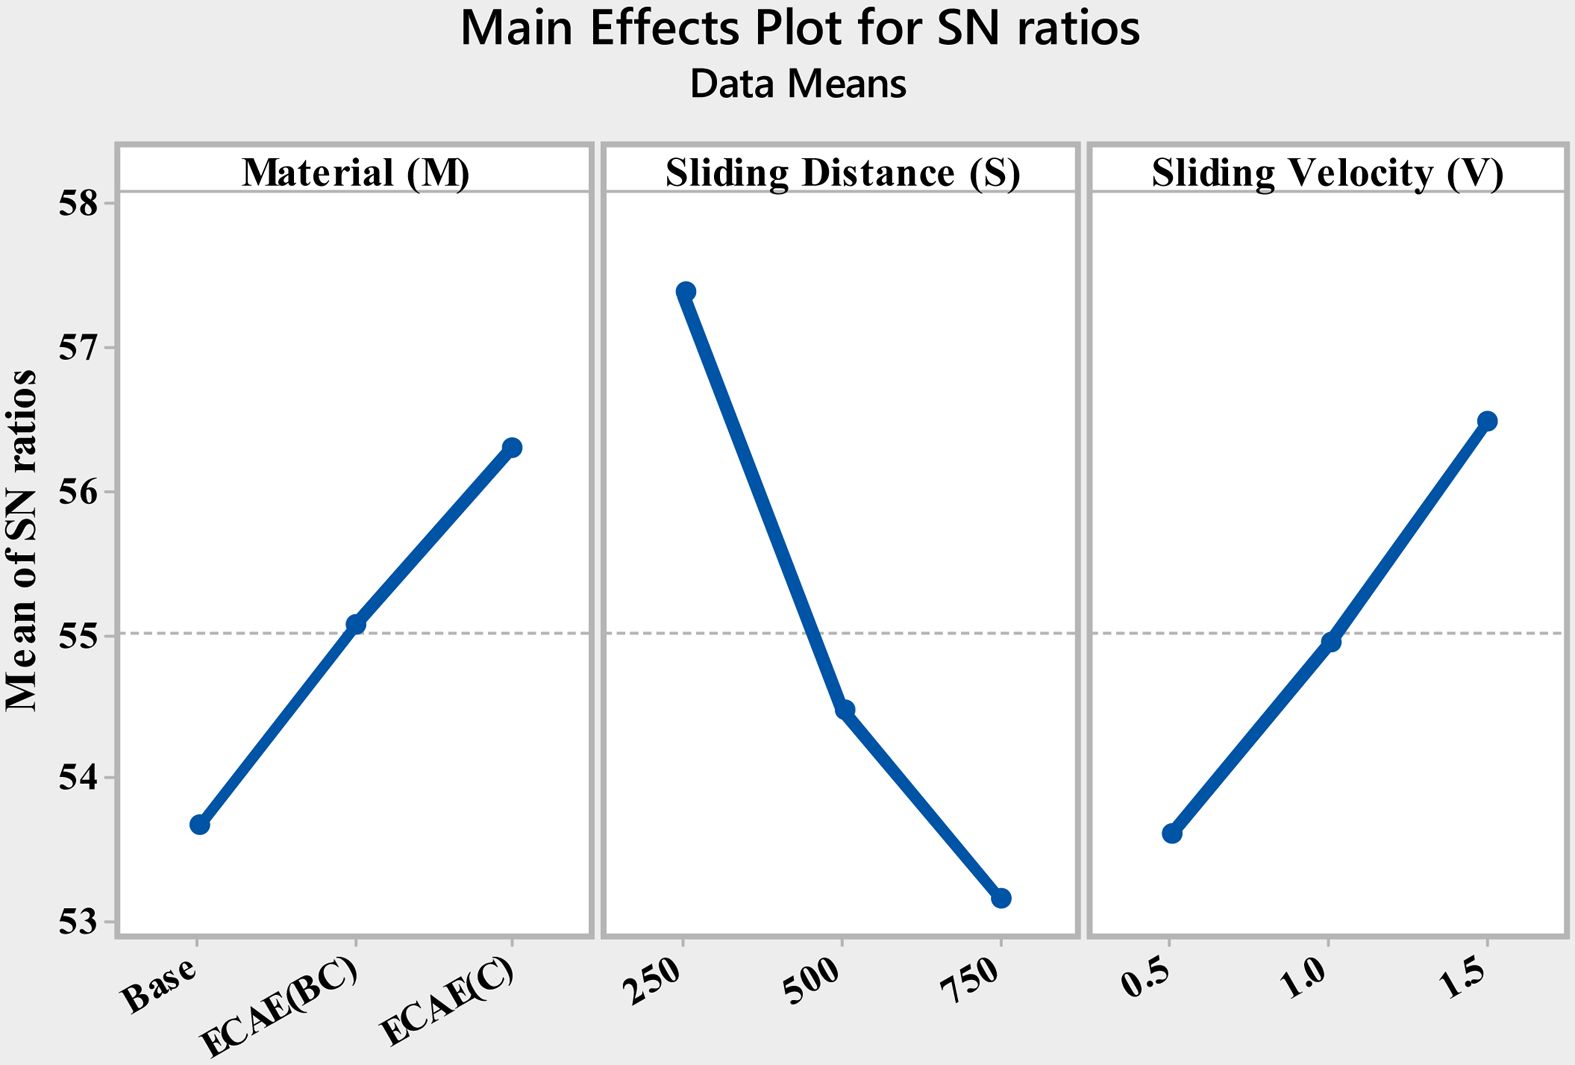
The influence of ECAE processing routes under different experimental factors such as base, ECAE(RBC) and (ECAE (R¬C)), sliding distance (S), sliding velocity (V) are analyzed. The obtained signal to noise ratio is tabulated in Table 6. It is further understood from the Table 6 that the most influential factors and levels were identified. The identified parameters are subsequently ranked and highlighted in Table 6.
The tabulated results in Table 6 indicate the most influential parameter for wear behavior is the sliding distance(S), level-1 ranked (1). The calculated S/N ratio for the sliding distance is 57.38 dB. However, under the material category, the ECAEed (RC) level-3 exhibits the most significant factor, ranked-3. The S/N ratio is 56.3 dB. The sliding velocity(V) level-3 is ranked-2. The S/N ratio of sliding velocity is calculated to be 56.48 dB. The main effects plot for SN ratio is depicted in Fig. 9. The Fig. 9 reveals the changes in the S/N ratio according to the various factors and levels considered in this study.
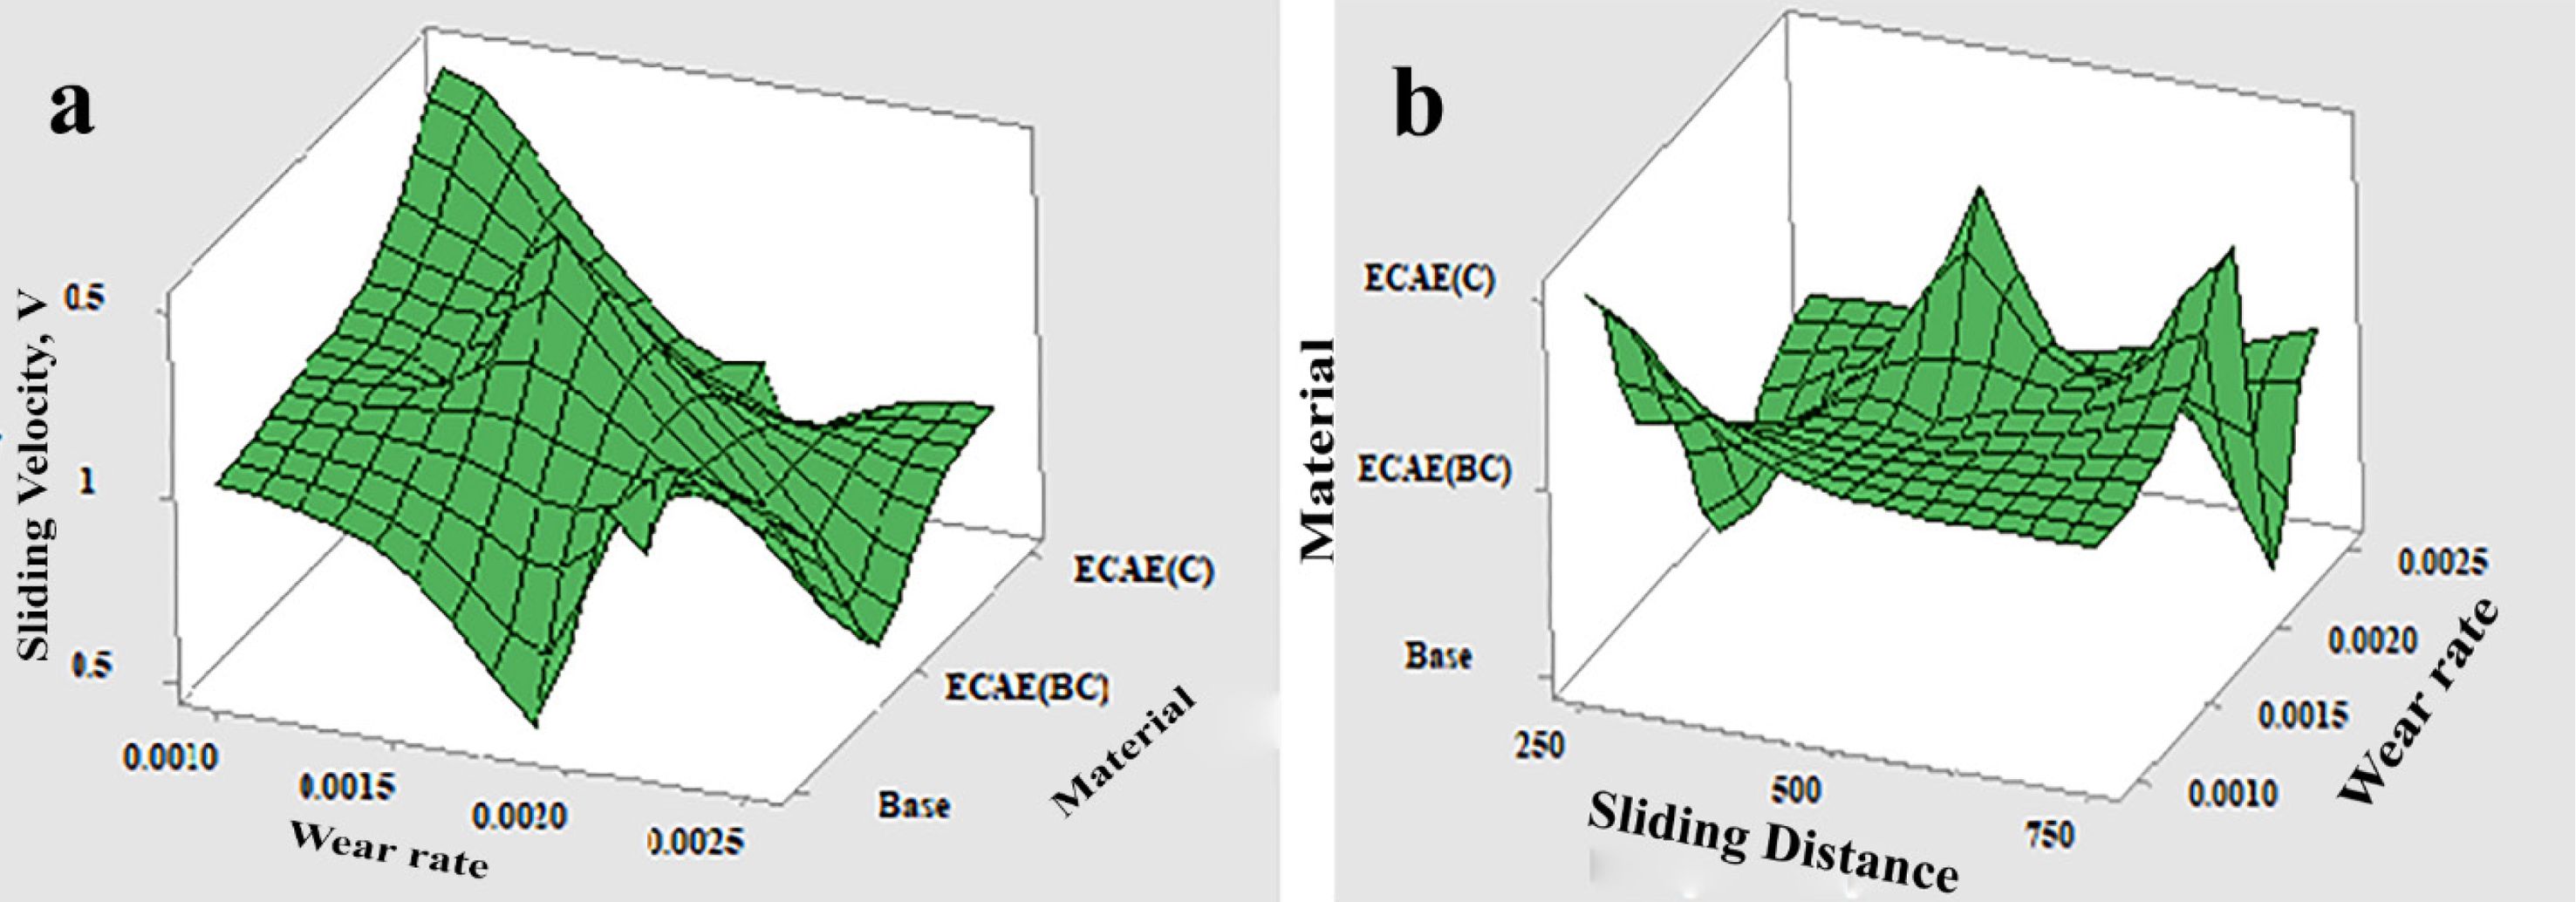
Fig. 10 displays and compares all the process parameters and levels with the output variable wear. From the Fig. 10 it is further understood that the parental alloy encounters more wear than the ECAEed samples. Among the sample category, ECAEed(RC) processed material exhibits higher wear resistance. It is mainly due to the factors such as grain refinement, distribution of intermetallic compounds and strain induced in limited directions during ECAE process. The grain refinement is not only attributed to the increment in strength and ductility. It also primarily provides resistance to wear due to the finer grain size resists the plastic deformation. Under the tested conditions, the dominant wear mechanism was mild oxidative wear, transitioning to abrasive wear at higher sliding distances. This transition correlates with localized softening of the aluminum matrix at elevated contact temperatures.
Since the shearing takes place in restricted directions, the resistance to wear is also offered from the various directions (X and Y). The RC has restricted shear sharing due to the sample rotations. As mentioned earlier, during the processing of ECAE (RC) involves the rotation upto 180o. Thus, the restriction of shearing along the Z is induced. It favours the smooth sliding of material along the Z directions. Therefore, it loses its stability in that direction which leads to wear during the dry sliding test. Further, the role of distributed intermetallic compounds on the microstructures of AA 5083 alloy on the wear behavior cannot be ruled out. Since the intermetallic compound especially, Mg17Al12 compound possess load-bearing capacity [16]. It is expected to offer significant wear resistance to the material. Sliding distance (250 m) ranked 1 proves to be a significant factor among all the parameters. It is attributed to the increase in the sliding distance under the constant load leads to more wear due to the breaking of particles.
Meanwhile, the stability of finer grain sizes for the increased sliding distance is also a significant factor. Apart from that the two process variables, the sliding velocity (level-3) and ranked-2 show the increasing sliding velocity, provides higher wear resistance. Increasing the velocity during the dry sliding wear leads to softening of the material. It is mainly due to the increase in coefficient of friction leads to increase in temperature. As the temperature rises, the soft material aluminium tends to slide smoothly against the steel disc.
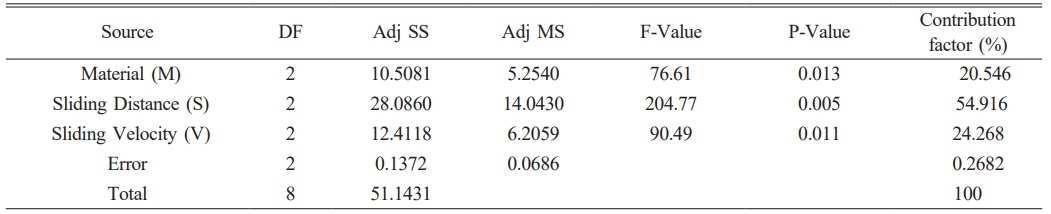
The interaction between each process parameters and levels are evaluated using the analysis of variance (ANOVA). The analysis of variance was carried out for the confidence level of 95%. The results are tabulated inTable.7. The significant factor is identified as the sliding distance by comparing the P-value which is less than 5%. The contribution factor is listed inTable.7. The contribution of the three process parameters such as Material, Sliding Distance and Sliding Velocity is 20.56%, 54.946% and 24.26%, respectively.
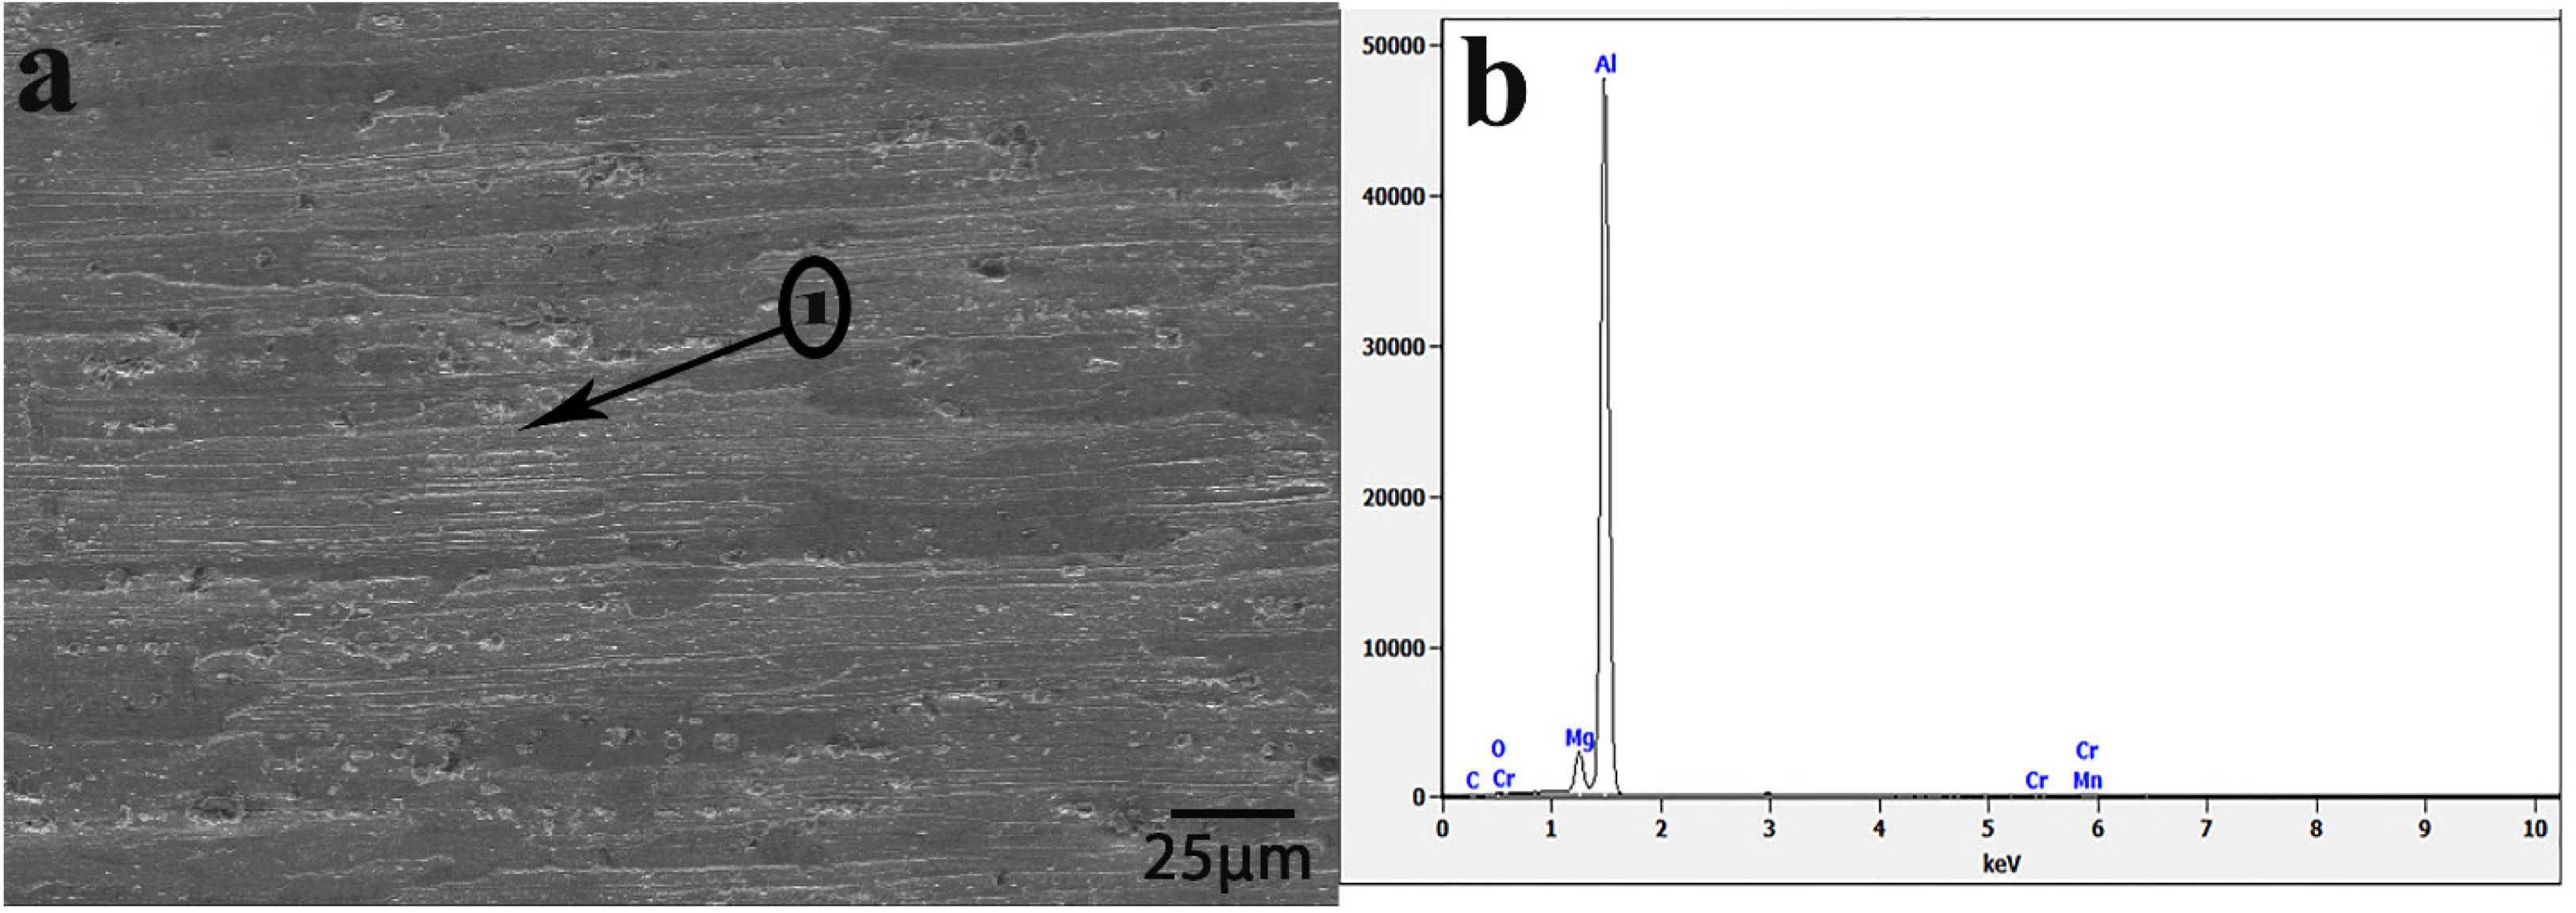
To further establish a relationship between independent and dependent variables a regression equation is generated [17, 18]. The same has been presented in the equation 3. The obtained R2 values for the regression equation are R-Sq-99.73%, R-Sq(adj)-98.91%. The confirmation studies are performed based on the optimized parameters (A3B1C3) obtained in the Taguchi model is presented in Table 8.
Although the Taguchi L9 orthogonal array primarily focuses on main effects, interactions among material, sliding distance, and sliding velocity were evaluated indirectly through confirmation experiments. ANOVA analysis confirmed that potential two-factor interactions did not significantly influence the overall response, validating the robustness of the Taguchi design. Anova analysis and optimization techniques such as Taguchi technique, Response surface methodology are used to determine the optimal process parameters [19-23]. The L9 orthogonal array primarily evaluated main effects of the three factors, and ANOVA identified sliding distance as the dominant parameter (54.9% contribution). While interactions were not explicitly analyzed, residual error (0.27%) was minimal, indicating negligible second-order effects within the tested range. To prevent overfitting of the regression model (R² = 99.73%), residual analysis and cross validation were performed. Randomly distributed residuals and validation with independent datasets confirmed the model’s predictive reliability within ±4% deviation.
|
Fig. 2 Optical microstructures of AA-5083 alloy a) Base, b) ECAEed (RBC) and ECAEed (RC). |
|
Fig. 3 Grain Size distribution of AA-5083 alloy a) Base, b) ECAEed (RBC) and ECAEed (RC). |
|
Fig. 4 SEM micrograph of AA-5083 alloy a) base alloy and b) EDS spectrum of base alloy. |
|
Fig. 5 SEM micrograph of AA-5083 alloy a) RBC and b) EDS spectrum of point 1 and c) EDS spectrum of point 2. |
|
Fig. 6 SEM micrograph of AA-5083 alloy a) RC and b) EDS spectrum of point 1 and c) EDS spectrum of point 2. |
|
Fig. 7 Stress vs strain curves of compressed base and ECAEed Al-5083 alloy |
|
Fig. 8 Schematic of ECAE processing routes. |
|
Fig. 9 Effects of factors on average S-Noise ratio of Wear. |
|
Fig. 10 Effects of various parameters on wear. |
The AA 5083 alloy was annealed at an optimized temperature. The pre-annealed alloy has been subjected to the ECAE process for a maximum of three passes. The obtained results are summarized below.
i) The coarser grain size of the base (38 μm) alloy is refined to a finer scale of ~4 μm in both the processing routes such as RBC and RC. The finer grain sizes are obtained in the ECAE process through continuous dynamic recovery and recrystallization (CDRR).
ii) The mechanical properties of the ECAEed (RBC) AA 5083 alloy exhibits the maximum ultimate compressive strength of 535 MPa and yield strength of 392 MPa without any concomitant loss in the ductility of the alloy. The ductility of 27% is achieved. The RBC route, owing to its uniform strain distribution, shows potential scalability for industrial forming of AA5083 components. However, large-scale implementation would require optimized die geometry and lubrication to manage frictional heating and tool wear.
iii) The (RC) processed ECAEed sample exhibits the ultimate compressive strength of 424 MPa and the yield strength of 345 MPa with the ductility of 21%. The hardness test results indicate the increment in the hardness value as compared the base alloy. The base alloy hardness is 82 Hv whereas the ECAEed (RC and (RBC) sample exhibits the hardness values of 148Hv and 152 Hv, respectively.
iv) The dry sliding wear experiments demonstrate the sliding velocity is the most significant factor in the process parameters. The contribution factor for the sliding distance is 54.916. The optimized parameter for the wear test is A3B1C3.
v) EDS results confirmed no significant elemental segregation after ECAE, indicating uniform alloying element distribution post processing.
SPD – Severe Plastic Deformation
ECAE – Equal Channel Angular Extrusion
RBC, RC – Route Types in ECAE
CDRR – Continuous Dynamic Recovery and Recrystallization
EBSD – Electron Backscatter Diffraction
TEM – Transmission Electron Microscopy
ANOVA – Analysis of Variance
S/N – Signal-to-Noise Ratio
- 1. S. Malopheyev and R. Kaibyshev, Mater. Sci. Eng., A. 620 (2014) 246-252.
-

- 2. S.Y. Chang, B. Du Ahn, S.K. Hong, S. Kamado, Y. Kojima, and D. Shin, J. Alloys Compd. 386 (2005) 197-201.
-
- 3. R. Verma, A.K. Ghosh, S. Kim, and C. Kim, Mater. Sci. Eng. A. 191 (1995) 143-150.
-
- 4. Shibayan Roy, D.Satyaveer Singh, Satyam Suwas, S. Kumar, and K. Chattopadhyay, Mater. Sci. Eng., A. 528 (2011) 8469-8478.
-
- 5. N. Fakhar, F. Fereshteh-Saniee, and R. Mahmudi, Trans. Nonferrous Met. Soc. China. 26 (2016) 3081-3090.
-
- 6. M.H. Goodarzy, H. Arabi, M.A. Boutorabi, S.H. Seyedein, and S.H. Hasani Najafabadi, J. Alloys Compd. 585 (2014) 753-759.
-
- 7. Z. Horita, T. Fujinami, and T.G. Langdon, Mater. Sci. Eng., A. 318 (2001) 34-41.
-
- 8. M. Karami and R. Mahmudi, Mater. Sci. Eng., A. 607 (2014) 512-520.
-
- 9. J. Kang, X. Sun, K. Deng, F. Xu, X. Zhang, and Y. Bai, Mater. Sci. Eng., A. 697 (2017) 211-216.
-
- 10. T.G. Langdon, Mater. Sci. Eng., A. 462 (2007) 3-11.
-
- 11. K. Palanikumar, Journal of the International Measurement Confederation 44 (2011) 2138-2148.
-
- 12. I. Asiltürk and H. Akkuş, Journal of the International Measurement Confederation 44 (2011) 1697-1704.
-
- 13. A. Gupta, H. Singh, and A. Aggarwal, Expert System with Applications 38 (2011) 6822-6828.
-
- 14. N. Mandal, B. Doloi, B. Mondal, and R. Das, Measurement: Journal of the International Measurement Confederation 44 (2011) 2149-2155.
-
- 15. S. Baskaran, V. Anandakrishnan, and M. Duraiselvam, Mater. Des. 60 (2014) 184-192.
-
- 16. N.M. Chelliah, R. Kumar, H. Singh, and M.K. Surappa, J. Magnesium Alloys. 5 (2016) 35-40.
-
- 17. S. Shankar, T. Mohanraj, and K. Ponappa, J. Tribol. 12 (2017) 1-17.
- 18. T. Venugopal and P. Chandramohan, Int. J. Heavy Veh. Syst. 27[1-2] (2020) 164-179.
-
- 19. S. Murugesan, V. Thangamuthu, R.M. Shivaji, and R. Suresh Kumar, J. Ceram. Process. Res. 23[3] (2022) 367-372.
-
- 20. R. Thirumalai, S. Karthick, and M. Giriraj, J. Ceram. Process. Res. 23[2] (2022) 221-227.
-
- 21. K.M. Senthil Kumar, T. Ramanathan, S. Murugesan, and V. Thangamuthu, J. Ceram. Process. Res. 22[6] (2021) 731-738.
-
- 22. S. Vinothkumar and P. Senthilkumar, J. Ceram. Process. Res. 23[4] (2022) 546-552.
-
- 23. K.M. Senthilkumar, A. Sivakumar, Rohokale MilindShivaji, S.K. Tamang, and M. Giriraj, J. Ceram. Process. Res. 23[2] (2022) 233-236.
-
 This Article
-
2026; 27(1): 96-104
Published on Feb 28, 2026
- 10.36410/jcpr.2026.27.1.96
- Received on Oct 4, 2025
- Revised on Nov 12, 2025
- Accepted on Dec 1, 2025
Services
- Abstract
introduction
experimental procedure
experimental results
conclusions
abbreviations
- References
- Full Text PDF
Shared
Correspondence to
- T. Venugopal
-
Associate Professor, Department of Mechanical Engineering, KGiSL Institute of Technology, Coimbatore, Tamilnadu
Tel : +91 9894019632 - E-mail: venugopalkgisl@gmail.com
Clean-Energy Research Institute(CRI), Hanyang University, 222, Wangsimni-ro, Seongdong-gu, Seoul, 04763, Korea
E-mail: jcpr@hanyang.ac.kr