


- Effect of B2O3 on the crystallization behavior and properties of glass-ceramics prepared from copper slag reduction tailings
Ju Xua,c,d, Guojun Maa,c,d,*, Zhibo Tonga,b,* and Yunjie Lia,c,d
aKey Laboratory for Ferrous Metallurgy and Resources Utilization of Ministry of Education, Wuhan University of Science and Technology, Wuhan 430081, China
bSchool of Materials Science & Engineering, Yangtze Normal University, Chongqing 408100, China
cState Key Laboratory of Advanced Refractories, Wuhan University of Science and Technology, Wuhan 430081, China
dJoint International Research Laboratory of Refractories and Metallurgy, Wuhan University of Science and Technology, Wuhan 430081, ChinaThis article is an open access article distributed under the terms of the Creative Commons Attribution Non-Commercial License (http://creativecommons.org/licenses/by-nc/4.0) which permits unrestricted non-commercial use, distribution, and reproduction in any medium, provided the original work is properly cited.
The chemical composition of copper slag reduction tailings is similar to that of CaO–Al2O3–SiO2–Fe2O3 system glass-ceramics. Utilizing the copper slag reduction tailings as the primary raw material, glass-ceramics were prepared by the melting method, offering an effective approach for the high-value utilization of copper slag. The effects of varying B2O3 content on the crystallization kinetics, phase composition, and properties of the glass-ceramics were investigated using techniques such as thermogravimetry–differential scanning calorimetry, X-ray diffraction, and scanning electron microscopy coupled with energy-dispersive spectroscopy. The addition of B2O3 reduced both the nucleation and crystallization temperatures of the glass-ceramics, thereby promoting crystallization and transforming the crystallization mechanism from surface crystallization to bulk crystallization. With increasing B2O3 content, the crystallization activation energy (E) of the glass-ceramics initially decreased and then increased. The predominant crystalline phase precipitated in the glass-ceramics was anorthite, accompanied by an increased precipitation of wollastonite. The glass-ceramic containing 6 wt% B2O3 exhibited the best overall performance, with a bulk density of 2.95 g·cm⁻³, a water absorption rate of 0.51%, a microhardness of 886.32 HV, and a flexural strength of 230 MPa. In addition, the mass loss rates under acid and alkali resistance tests were 2.2% and 1.9%, respectively.
Keywords: B2O3, Copper slag reduction tailings, Glass-ceramics, Crystallization kinetics, Properties.
With the rapid development of industry, global copper production has increased sharply. During the pyrometallurgical copper smelting process, approximately 2.2-3 tons of copper slag are generated for every ton of copper produced [1, 2]. According to statistics, the global annual output of copper slag is approximately 70 million tons, of which China accounts for 20-30 million tons per year [3]. Currently, the accumulated copper slag stockpile in China has reached 130 million tons [4]. After undergoing beneficiation or sedimentation, the majority of these waste slags are merely stockpiled, leading to considerable land occupation. Moreover, the toxic heavy metals contained within pose potential threats to the surrounding soil and water environments [5]. In addition, copper slag contains a significant amount of valuable metals, with iron and copper grades reaching or even exceeding the mineable grades of iron and copper ores (27% and 1%, respectively) in China, thus offering high utilization potential [6].
At present, carbothermal reduction is widely regarded as one of the most effective methods for the treatment of copper slag [7]. The copper slag reduction tailings refer to the residual molten slag obtained after extracting iron from copper slag via carbothermal reduction. Its primary components are SiO2, CaO, and Al2O3, which are similar to those of silicate glass-ceramics, making it a suitable raw material for glass-ceramic production [8, 9]. The preparation of glass-ceramics using copper slag reduction tailings not only effectively addresses the secondary pollution generated during the carbothermal reduction process but also contributes to resource conservation, thereby enabling the comprehensive utilization of all components of copper slag.
During the preparation of glass-ceramics, their structure and properties can often be effectively tailored through the use of additives. Under appropriate conditions, additives can promote crystallization or modify the size and morphology of crystals, thereby enhancing the overall performance of glass-ceramics [10, 11]. Studies have shown that additives such as CaF2, TiO2, Cr2O3, and B2O3 can facilitate crystallization by regulating the glass network structure, reducing melt viscosity, or serving as nucleating agents [12-14].
B2O3 exists in the glass network in the form of triangular [BO3] and tetrahedral [BO4] units, with the [BO4] tetrahedron possessing a denser structure than the [BO3] triangle. The properties of glass-ceramics are determined by the relative fractions of [BO3] and [BO4] units [15, 16]. In addition, the incorporation of B2O3 can reduce the viscosity of glass-ceramics, which is beneficial for lowering the sintering temperature and promoting the sintering process of the glass-ceramics [17]. Therefore, compared with conventional additives, B2O3, similar to Si, is a complex amphoteric oxide that can not only act as a network former by participating in the formation of a “hybrid glass framework”, but also serve as a fluxing agent to reduce the sintering temperature of glass-ceramics [18, 19]. Currently, existing research primarily focuses on the effects of B2O3 on the structure and properties of Fe2O3-CaO-SiO2 ternary system glass-ceramics. However, the crystallization behavior, microstructure, and physicochemical properties of B2O3-modified CaO-Al2O3-SiO2-Fe2O3 (CASF) quaternary system glass-ceramics derived from copper slag reduction tailings remain inadequately investigated systematically.
However, existing studies have predominantly focused on the qualitative description of the effects of single additives on crystallization behavior, while the specific functional pathways of B2O3 in copper slag reduction tailings-based glass-ceramics, as well as its influence on crystal growth kinetics and structural modulation mechanisms remain insufficiently investigated.
In this study, copper slag reduction tailings were used as the raw material to systematically investigate the influence of B2O3 on the crystallization behavior and overall performance of glass-ceramics. Techniques including differential scanning calorimetry (DSC), X-ray diffraction (XRD), scanning electron microscopy with energy-dispersive spectroscopy (SEM–EDS), and microhardness testing were employed to analyze the effects of B2O3 on phase composition, crystal morphology, mechanical properties (such as flexural strength, bulk density, water absorption, and apparent porosity), as well as acid and alkali resistance. The findings aim to provide a theoretical basis for the efficient preparation and performance optimization of copper slag reduction tailings-based glass-ceramics, thereby promoting the advancement of resource utilization technologies for industrial solid waste.
Preparation of glass-ceramics
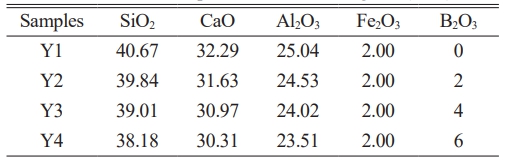
After the carbothermal reduction of modified copper slag, the reduction tailings composed primarily of SiO2, CaO, and Al2O3 was obtained. In consideration of the residual Fe2O3 present in the reduction tailings, the Fe₂O₃ content was fixed at 2 wt%. Based on its main components, (CaO-Al2O3-SiO2-Fe2O3) CASF base glass was formulated with a mass ratio of x wt% B2O3, 2 wt% Fe2O3, and (98–x) wt% of 41.50 wt% SiO2, 32.95 wt% CaO, and 25.55 wt% Al2O3. The value of x was varied at 0, 2, 4, and 6 wt% to investigate the effect of B2O3 content. Table 1 lists the chemical composition of the CASF base glass.
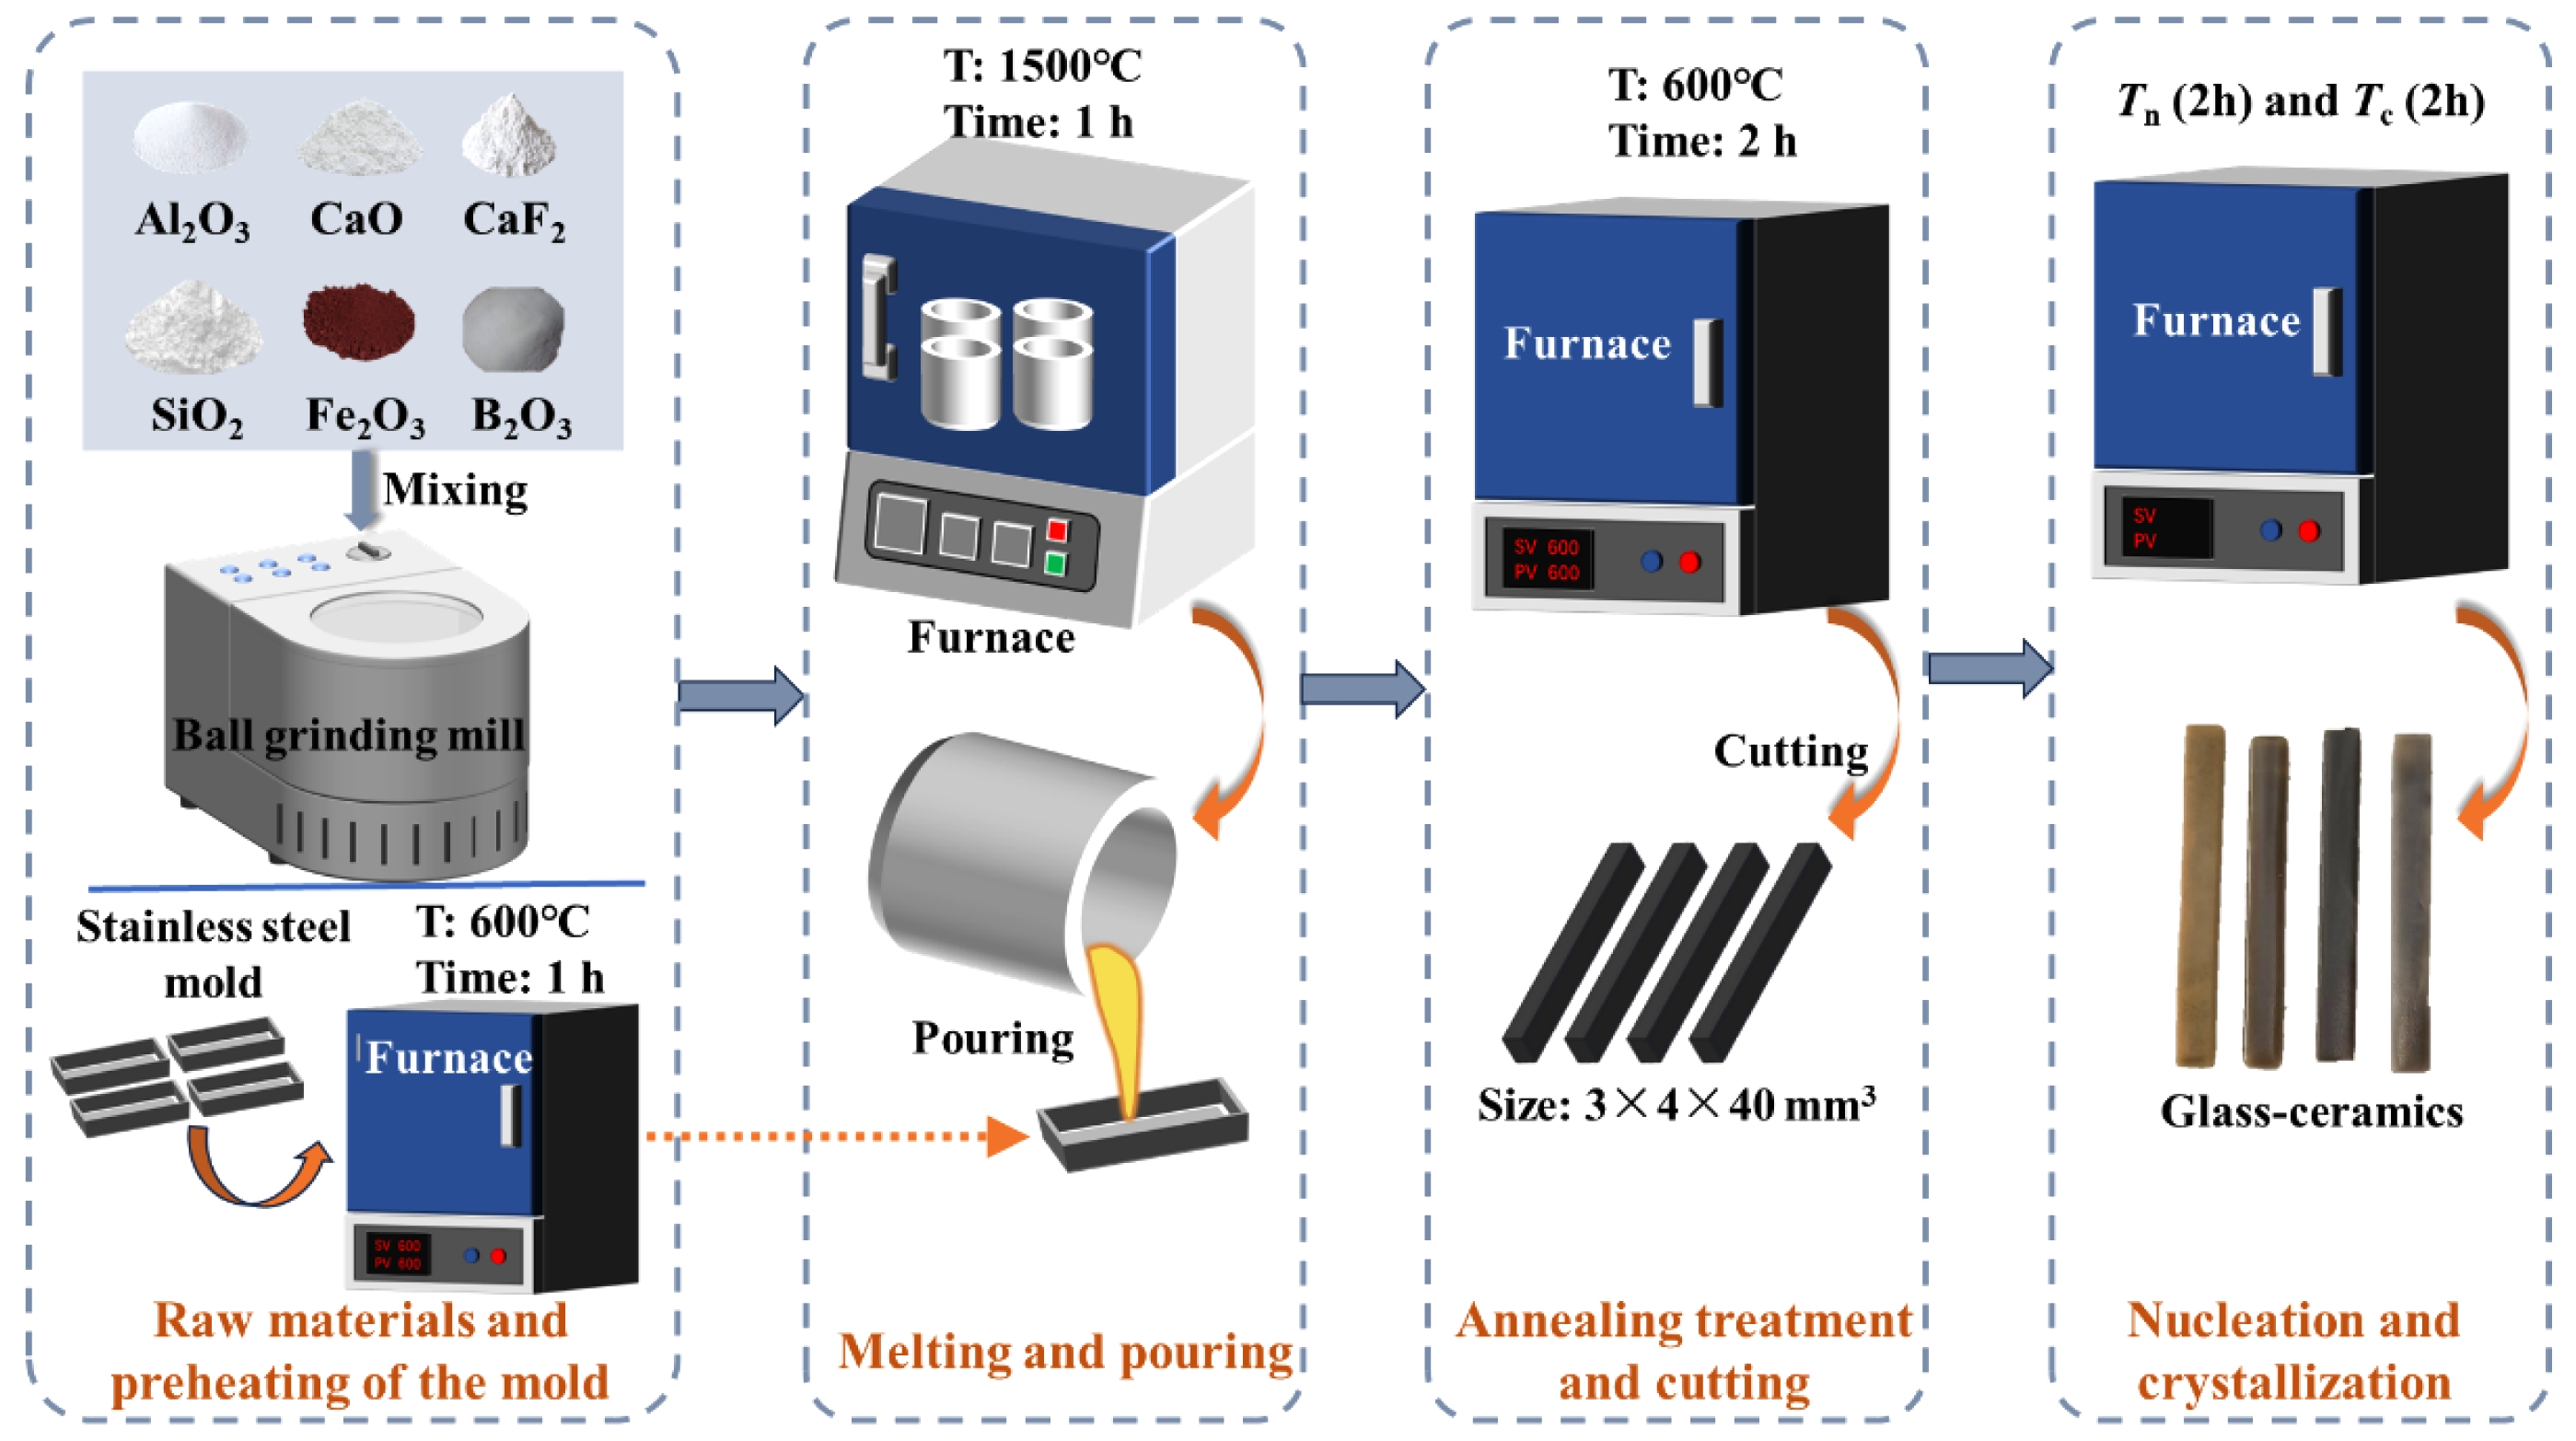
Based on the chemical composition of the base glass shown in Table 1, the accurately weighed raw materials were thoroughly mixed and sieved to a particle size of less than 74 μm. The mixture was then placed in a muffle furnace and heated to 1500 °C with a holding time of 1 h to ensure complete melting and homogenization. The molten slag was subsequently cast into a mold preheated at 600 °C for 1 h, followed by annealing in the same furnace at 600 °C for 2 h. After annealing, the base glass samples were cooled to room temperature along with the furnace. Finally, the samples were demolded, cut, ground, and polished to obtain base glass specimens with dimensions of 3 × 4 × 40 mm3. A portion of the base glass was crushed for differential thermal analysis, and the corresponding nucleation and crystallization temperatures were determined based on the DSC curves. Subsequently, an appropriate heat treatment schedule was established for the preparation of glass-ceramics. The specific preparation process is illustrated in Fig. 1.
Differential thermal analysis
Differential thermal analysis determines the nucleation and crystallization temperatures of glass-ceramics by detecting endothermic or exothermic peaks during the heating process, thereby enabling the design of an appropriate heat treatment schedule.
The prepared base glass was placed into a crusher and thoroughly ground until the particle size reached 200 mesh. The thermal analysis was conducted using a simultaneous thermal analyzer (STA449F3, NETZSCH, Germany). A sample of 10 ± 0.5 mg was placed in an alumina crucible and loaded into the thermogravimetric apparatus. DSC curves were obtained under different heating rates (5 ℃/min, 10℃/min, 15 ℃/min, and 20 ℃/min). α- Al2O3 powder was used as the reference material. The testing conditions were as follows: air atmosphere, temperature range 0-1200 ℃.
The crystallization activation energy is a critical parameter that reflects the crystallization behavior of base glass. A lower activation energy indicates a higher crystallization tendency and improved ease of crystal phase formation. This parameter can be determined using the Kissinger equation [20], as shown in Equation (1).
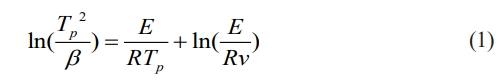
Where Tp is the peak temperature of the exothermic peak in the DSC curve (K); β is the heating rate of the DSC curve, ℃/min; R is the universal gas constant; E is the crystallization activation energy, kJ/mol; and ν is the frequency factor.
To determine the crystallization mechanism of the glass-ceramics, the crystal growth index n of the base glass was calculated using the Augis–Bennett equation [21], as shown in Equation (2).
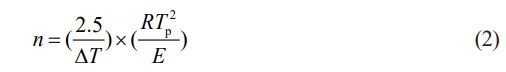
Where ΔT is the full width at half maximum (FWHM) of the crystallization peak in the DSC curve; R is the universal gas constant; E is the crystallization activation energy, kJ/mol; and Tp is the peak temperature of the exothermic peak in the DSC curve, K.
Crystal phase and microstructure
An X-ray diffractometer (X'Pert PRO MPD, PANalytical, Netherlands) was used to detect and analyze the phase composition. The specific experimental parameters were as follows: Cu target, operating voltage set at 40 kV, operating current at 40 mA, scanning speed of 2°/min, and a scanning range from 20° to 60°. The diffraction data were further processed using Jade 6 software for full-pattern fitting and semi-quantitative phase analysis. A field emission scanning electron microscope (Nova NanoSEM400, FEI, USA) combined with an energy-dispersive X-ray spectrometer (INCA IE350 PentaFET-X3, Oxford Instruments, UK) was employed to observe and analyze the microstructure and crystalline phase composition of the copper slag and glass-ceramic samples.
Properties of glass-ceramics measurement
Flexural strength
The prepared bulk glass-ceramic specimens (3 × 4 × 40 mm3) were ground and polished, followed by mechanical testing using a flexural and compressive strength tester (DYE-10 kN, Timestar Instrument Co., Ltd., Wuhan). The flexural strength was measured using the three-point bending method, with a span of 30 mm and a loading rate of 5 mm/min. Five samples were randomly selected from each composition for testing, and the average value was calculated [22]. The calculation method is shown in Equation (3).
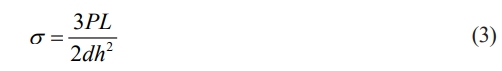
Where σ is the flexural strength, MPa; P is the maximum applied load, N; L is the span, mm; d is the width of the specimen, mm; and h is the height of the specimen parallel to the loading direction, mm.
Microhardness testing
The microhardness of the polished glass-ceramic samples was measured using a digital Vickers hardness tester (HVS-1000Z). A load of 100 N was applied for 10 s. Each composition was measured five times, and the average value was taken as the final microhardness result.
Bulk density and water absorption testing
After cutting and polishing, the glass-ceramic samples were tested for bulk density and water absorption based on the Archimedes displacement method [23, 24]. Each composition was tested five times, and the average value was taken. The calculation formulas are as follows:
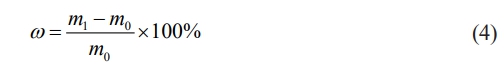
Where ω is the water absorption rate, %; m0 is the mass of the glass-ceramic sample after drying, g; and m1 is the mass of the water-saturated sample in air, g.
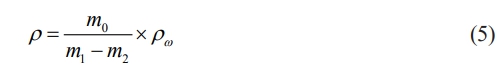
Where ρ is the bulk density, g·cm-3; m2 is the suspended mass of the glass-ceramic sample, g; and ρω is the density of water, which is 1 g·cm-3 when deionized water is used.
Corrosion resistance testing
In accordance with the national building materials standards JC/T 258-1993 [25] and JC/T 2283-2014 [26], the acid and alkali resistance of the glass-ceramics was evaluated. The polished glass-ceramic samples were immersed in 20 wt% H2SO4 and 20 wt% NaOH solutions and boiled for 1 hour. The corrosion resistance was assessed by calculating the mass loss rate of the samples before and after the corrosion treatment. During the experiment, the acid and alkali solutions were appropriately replenished to maintain consistent concentrations throughout the corrosion process. The dimensions of the glass-ceramic samples were 5 × 5 × 20 mm3, with five samples tested per group. After corrosion, the samples were removed, dried, and weighed. The average mass loss was then calculated using Equation (6).
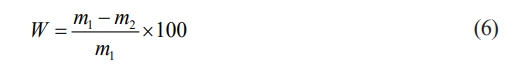
Where W is the mass loss rate of the glass-ceramic sample, %; m1 is the mass of the sample before corrosion, g; and m2 is the mass of the sample after corrosion, g.
|
Fig. 1 Flow chart of the glass-ceramics preparation process. |
Effect of B2O3 on crystallization kinetics
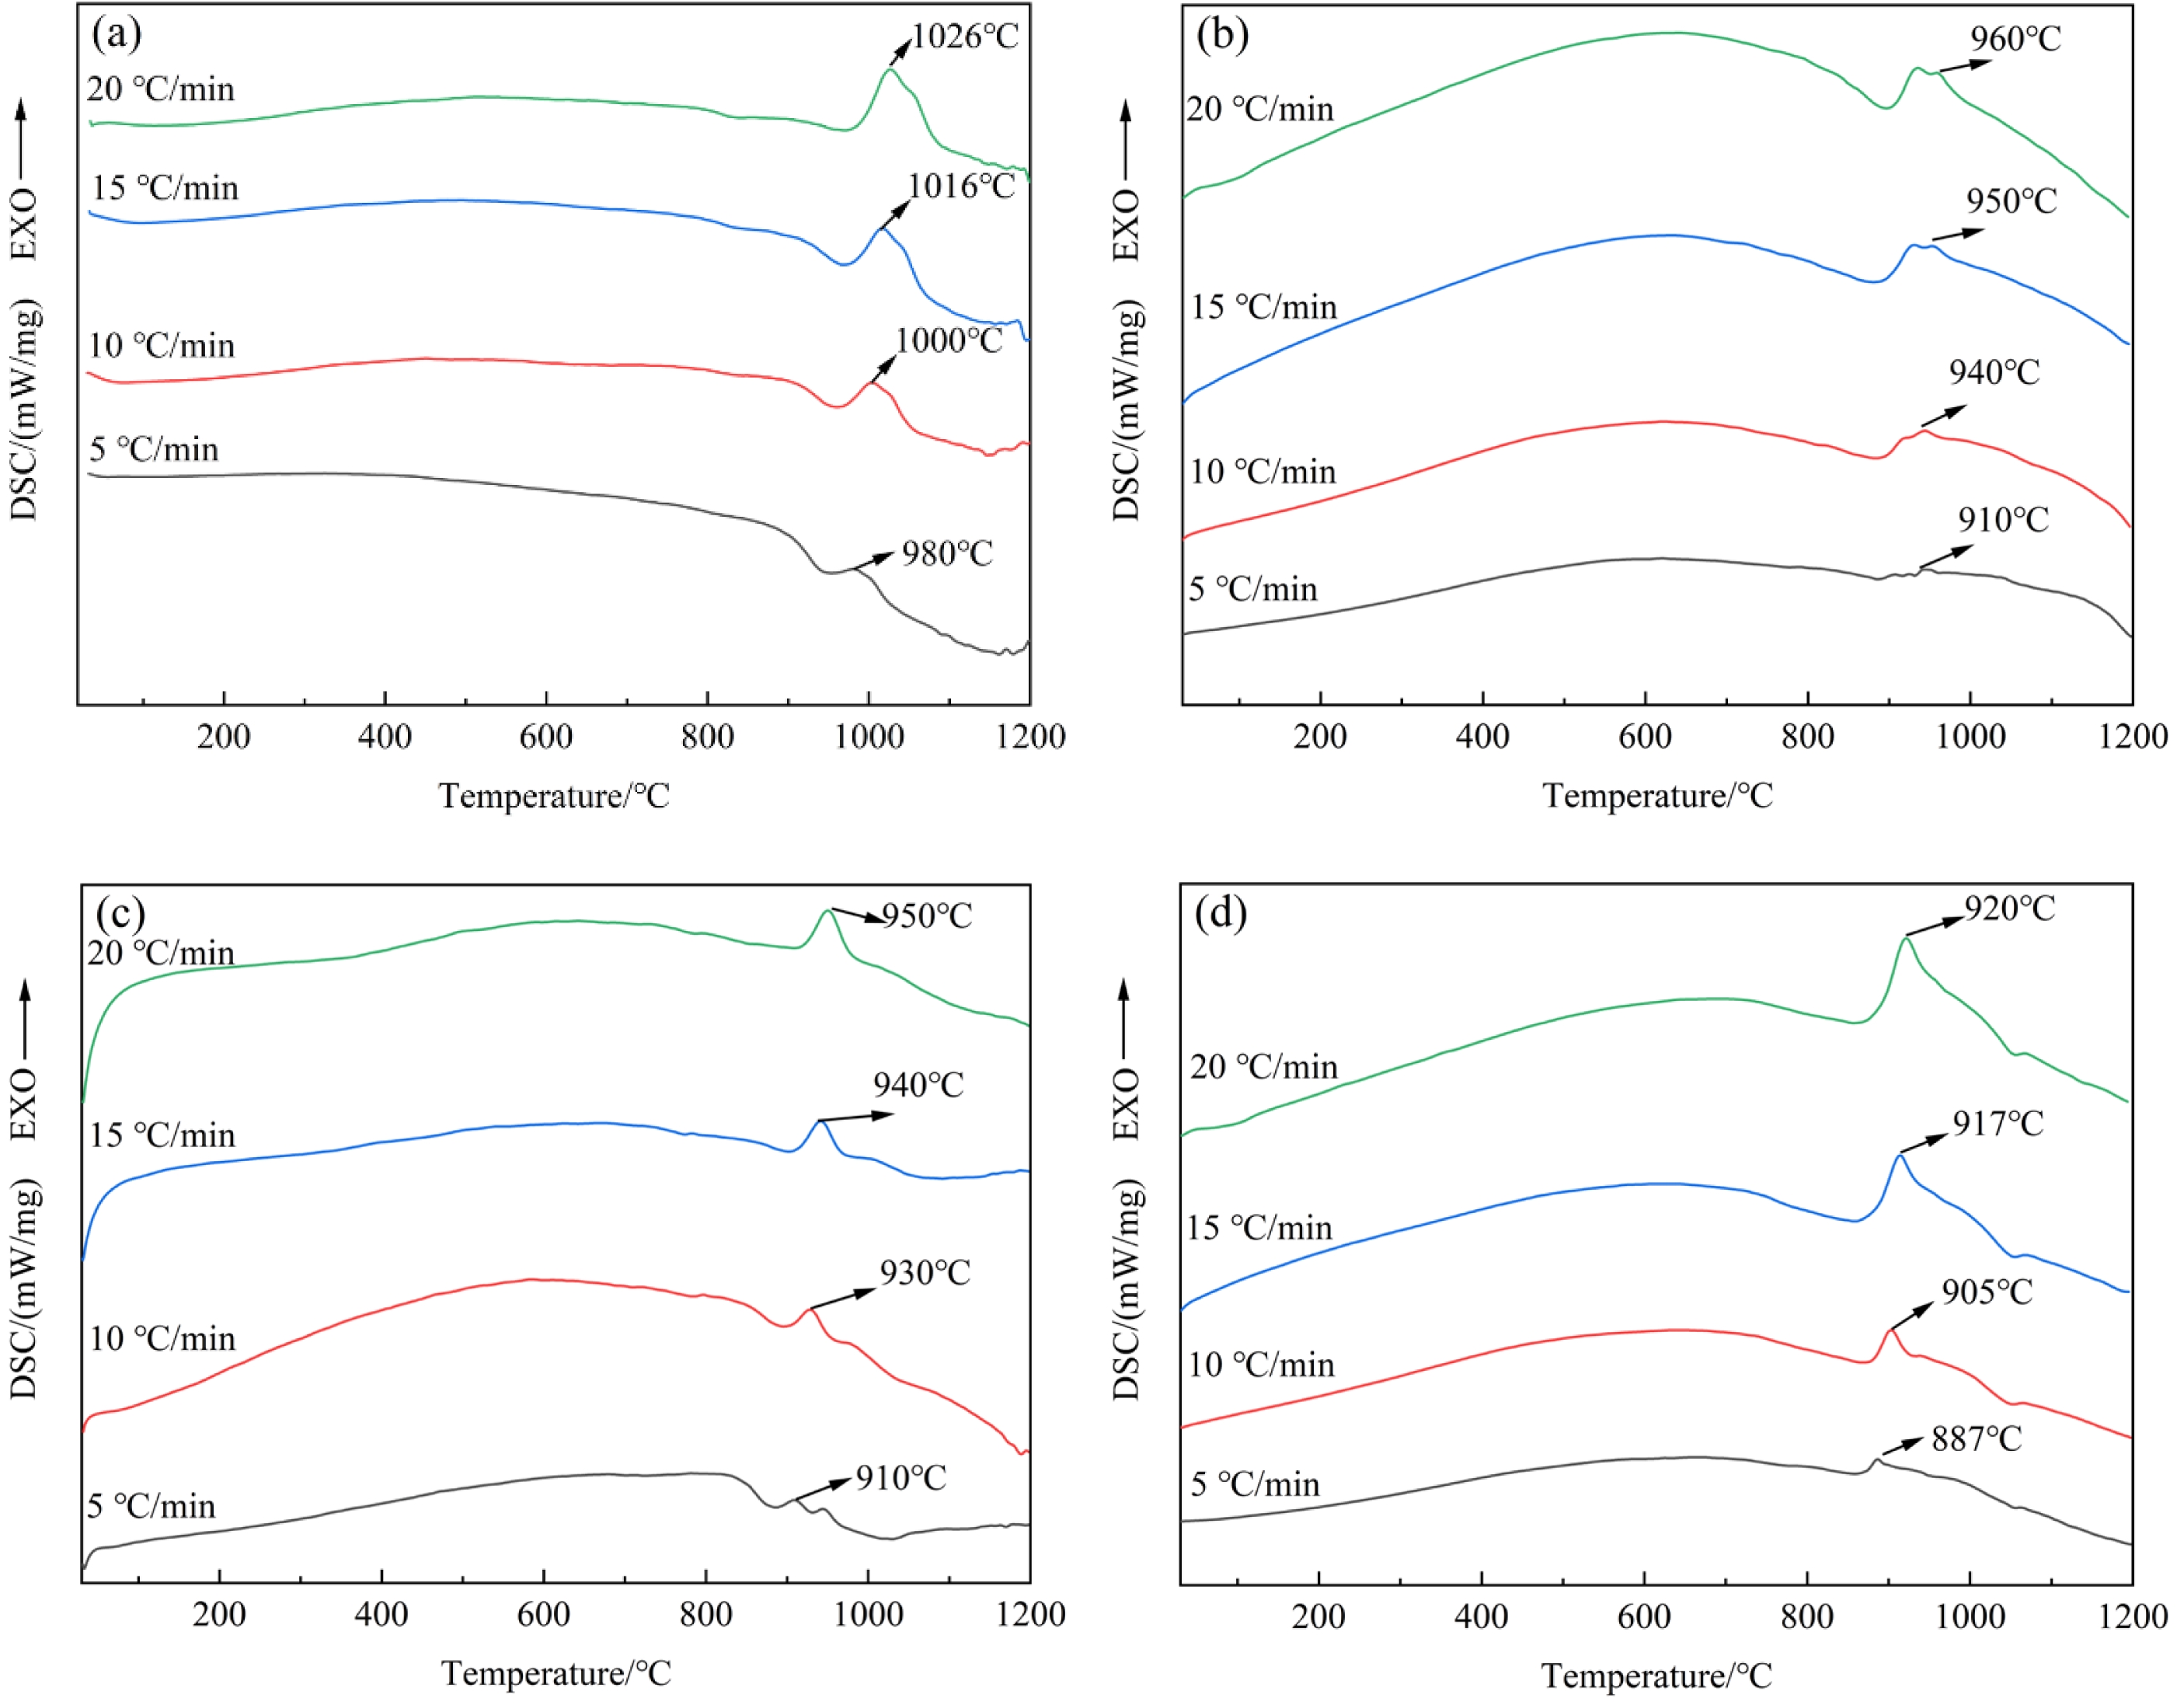
Through systematic processing and analysis of the differential thermal analysis (DTA) data, the DSC curve characteristics of glass-ceramic samples with different B2O3 contents are obtained, as illustrated in Fig. 2. With increasing B2O3 content, the crystallization peak temperature of the base glass decreases under the same heating rate, indicating that the addition of B2O3 effectively reduces the crystallization temperature. At a fixed B2O3 content, the crystallization peak shifts toward higher temperatures as the heating rate increased. By accurately determining the peak temperature (Tp) of the crystallization exothermic peak at different heating rates (β), a quantitative relationship between Tp and β can be established. Based on the Kissinger kinetic equation [18], this dataset can be used to calculate the crystallization activation energy (E), thereby revealing the energy barrier characteristics of phase evolution and the nucleation-growth kinetics within the glass-ceramic system.
The sharpness and width of the crystallization exothermic peak reflect, to some extent, the effectiveness of the crystallization process in glass-ceramics. A broader and sharper peak indicates a more efficient crystallization process. Observations reveale that when the B2O3 content reached 6 wt%, the DSC curve displayed the sharpest peak, the widest peak width, and the largest exothermic peak area. These characteristics indicate that the glass-ceramic sample with 6 wt% B₂O₃ exhibits an accelerated crystallization rate and an enhanced crystallization tendency [27].
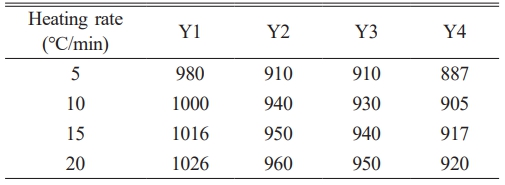
The Tp values of each group of samples under different heating rates are listed in Table 2. As shown in the data, the Tp values of the same group gradually increase with increasing heating rate. This trend arises because the transformation from a metastable amorphous state to a stable crystalline state in glass-ceramics requires a certain amount of energy and time. When the heating rate is relatively low, sufficient time is available for the base glass to transform into the crystalline phase. Consequently, the Tp value of the crystallization peak is lower, and the instantaneous transformation rate from amorphous to crystalline is relatively slow, resulting in a broader and flatter crystallization peak. As the heating rate increases, the sample temperature rises more rapidly within the same time interval compared to lower heating rates. This shortens the time available for the base glass to transform into a glass-ceramic, resulting in a rightward shift and gradual increase in the Tp value. The instantaneous transformation rate from the amorphous phase to the crystalline phase becomes higher, and the crystallization peak becomes sharper. Moreover, the trend observed in the Tp values under different heating rates is consistent with the variations observed in the DSC analysis results.
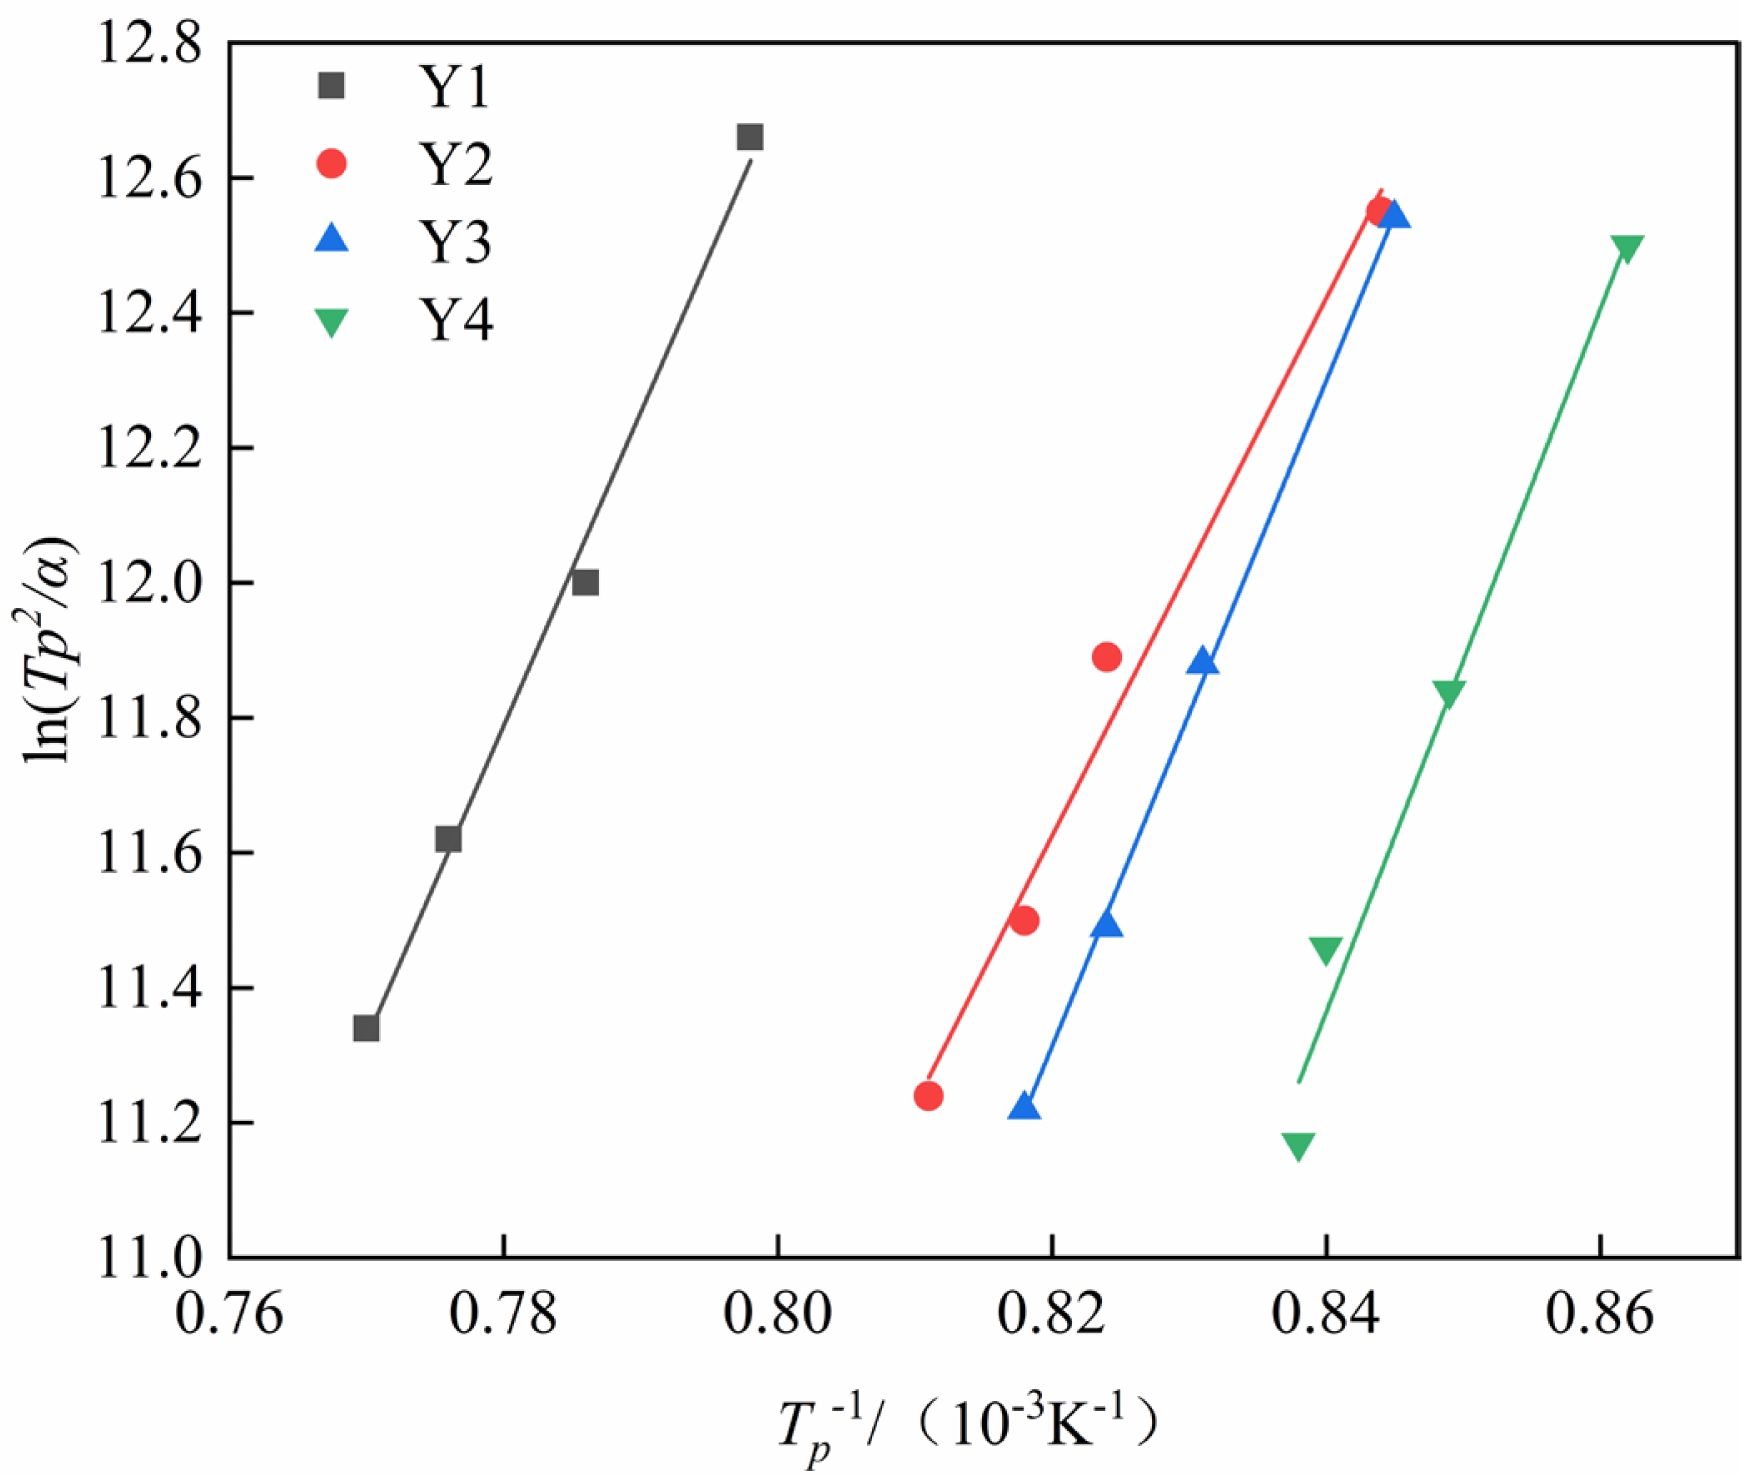
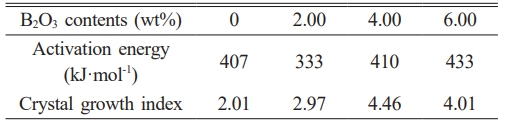
The experimental data in Table 2 are processed by first calculating 1/Tp and ln(Tp²/β) for each sample. These two sets of values are then used as the x- and y-axes, respectively, to perform linear fitting, and the fitting results are shown in Fig. 3. From the slope and intercept of the fitted linear equation, the activation energy and effective frequency factor are calculated. Subsequently, the Augis–Bennett equation is applied using the data at a heating rate of 20 ℃/min as the reference to determine the crystal growth index of the glass-ceramics. The crystallization activation energy (E) and crystal growth index (n) for each group of samples are listed in Table 3.
The calculated results show that when the B2O3 content is 2 wt%, the crystallization activation energy of the glass sample decreases. However, with further increases in B2O3 content, the activation energy gradually increases. In terms of the crystal growth index, it generally exhibits an increasing trend with the addition of B2O3. This phenomenon may be attributed to the behavior of B2O3 at low addition levels, where B3+ enters the network in the form of [BO3] triangular units, partially substituting the connectivity sites of [SiO4] tetrahedra. This network-modifying effect reduces the degree of polymerization of the silica network, leading to a decrease in glass viscosity and an increase in atomic mobility. As a result, the energy barrier for nucleation is lowered, causing the crystallization activation energy of the glass-ceramic sample containing 2 wt% B2O3 to decrease. As the B2O3 content increases, a greater proportion of B3+ ions combine with anions to form [BO4] tetrahedral units, leading to a more stabilized glass structure. Consequently, higher energy is required to overcome the thermodynamic barrier, resulting in an increase in activation energy. However, the dimensionality of crystal growth also increases, and the crystallization mechanism of the glass-ceramics tends to shift toward bulk crystallization [28, 29].
Phase and morphological analysis of glass-ceramics with different B2O3 contents
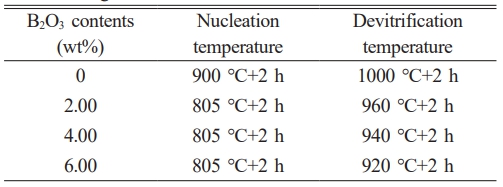
To investigate the effect of B2O3 content on the crystallization behavior of CASF system base glass, corresponding nucleation and crystallization heat treatment schedules were designed based on the DSC curves shown in Fig. 2. The specific parameters are listed in Table 4.
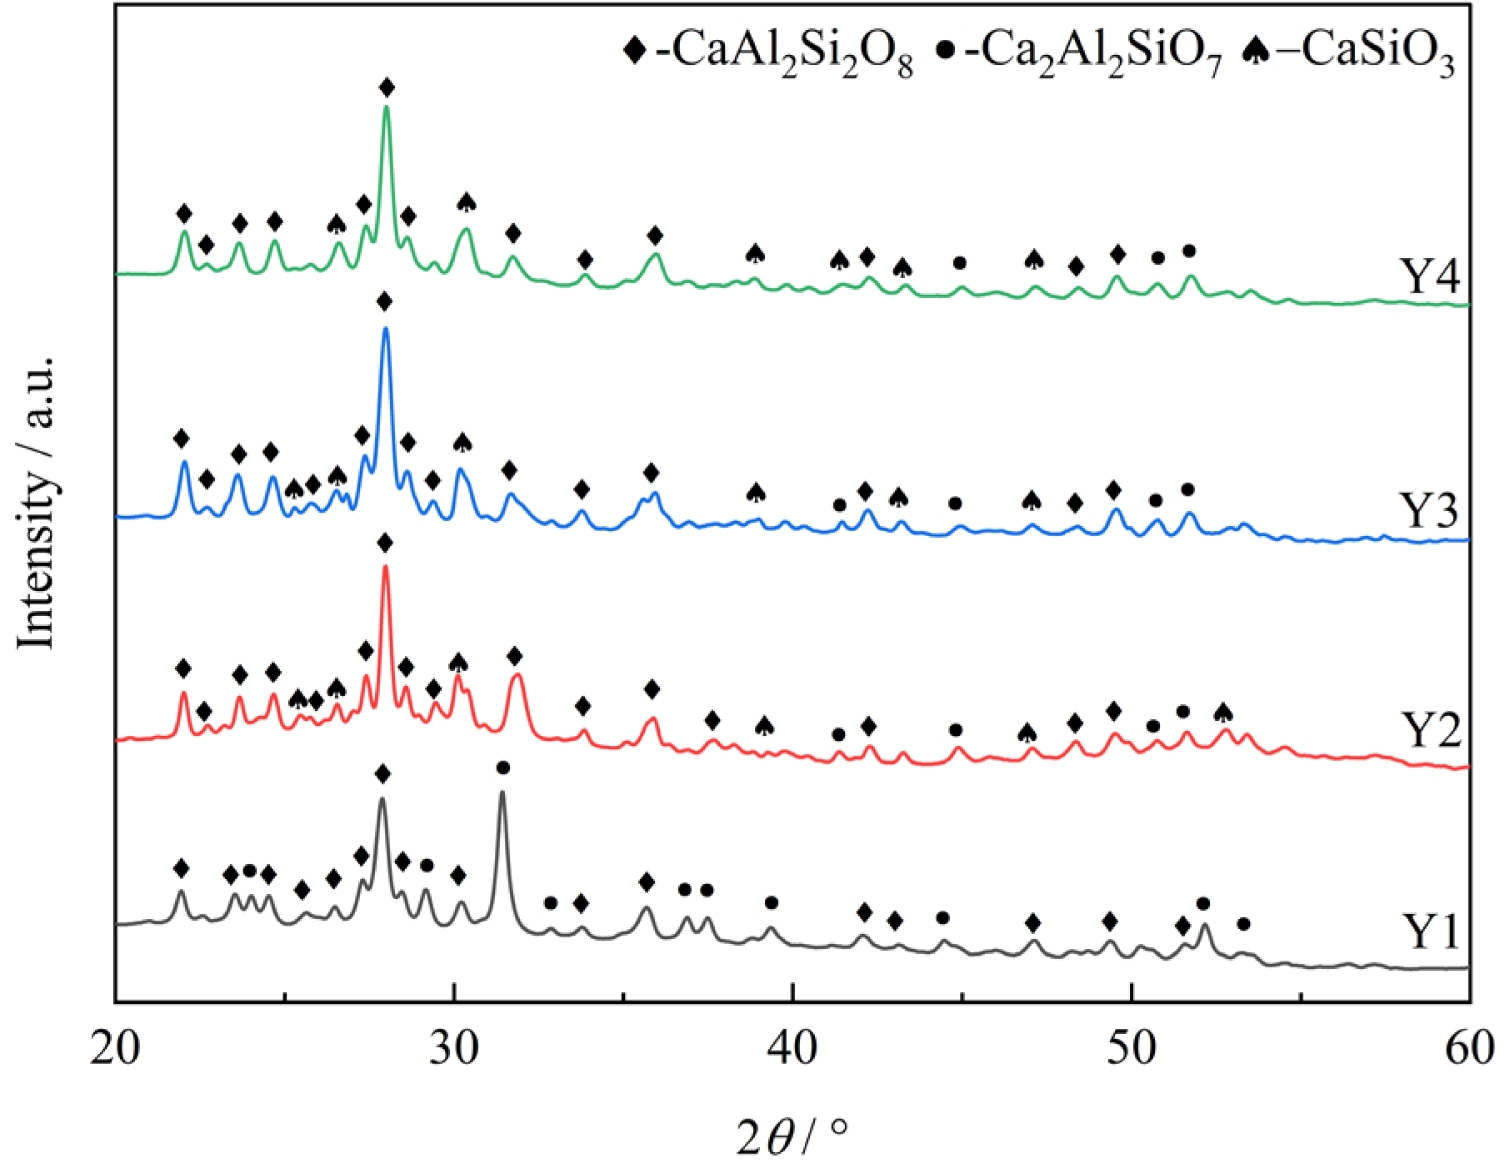
Fig. 4 presents the XRD patterns of glass-ceramics with different B2O3 contents. As shown in Fig. 4, the crystalline phases precipitated in the glass-ceramic samples change with the addition of the fluxing agent B2O3, resulting in the formation of anorthite, calcium aluminosilicate, and wollastonite phases. The diffraction peak intensity of calcium aluminosilicate decreases significantly. The addition of B2O3 reduces the crystallization temperature of the glass-ceramics, and the lower-viscosity environment facilitated the diffusion of ions such as Ca2+ and Si4+, thereby promoting the nucleation and growth of wollastonite (CaSiO3) and enhancing the intensity of its diffraction peaks.
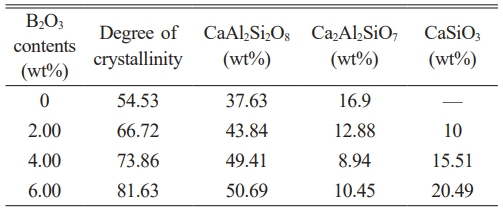
The XRD diffraction peaks for samples with varying B₂O₃ contents were deconvoluted using a Gaussian-Cauchy mixture function [30] via the Jade 6 software. The calculated crystallinity results, presented in Table 5, demonstrate a consistent increase with the addition of B2O3. The glass-ceramic with 6 wt% B₂O₃ exhibits the highest crystallinity, indicating the highest content of precipitated crystalline phases and the lowest content of the residual glass phase.
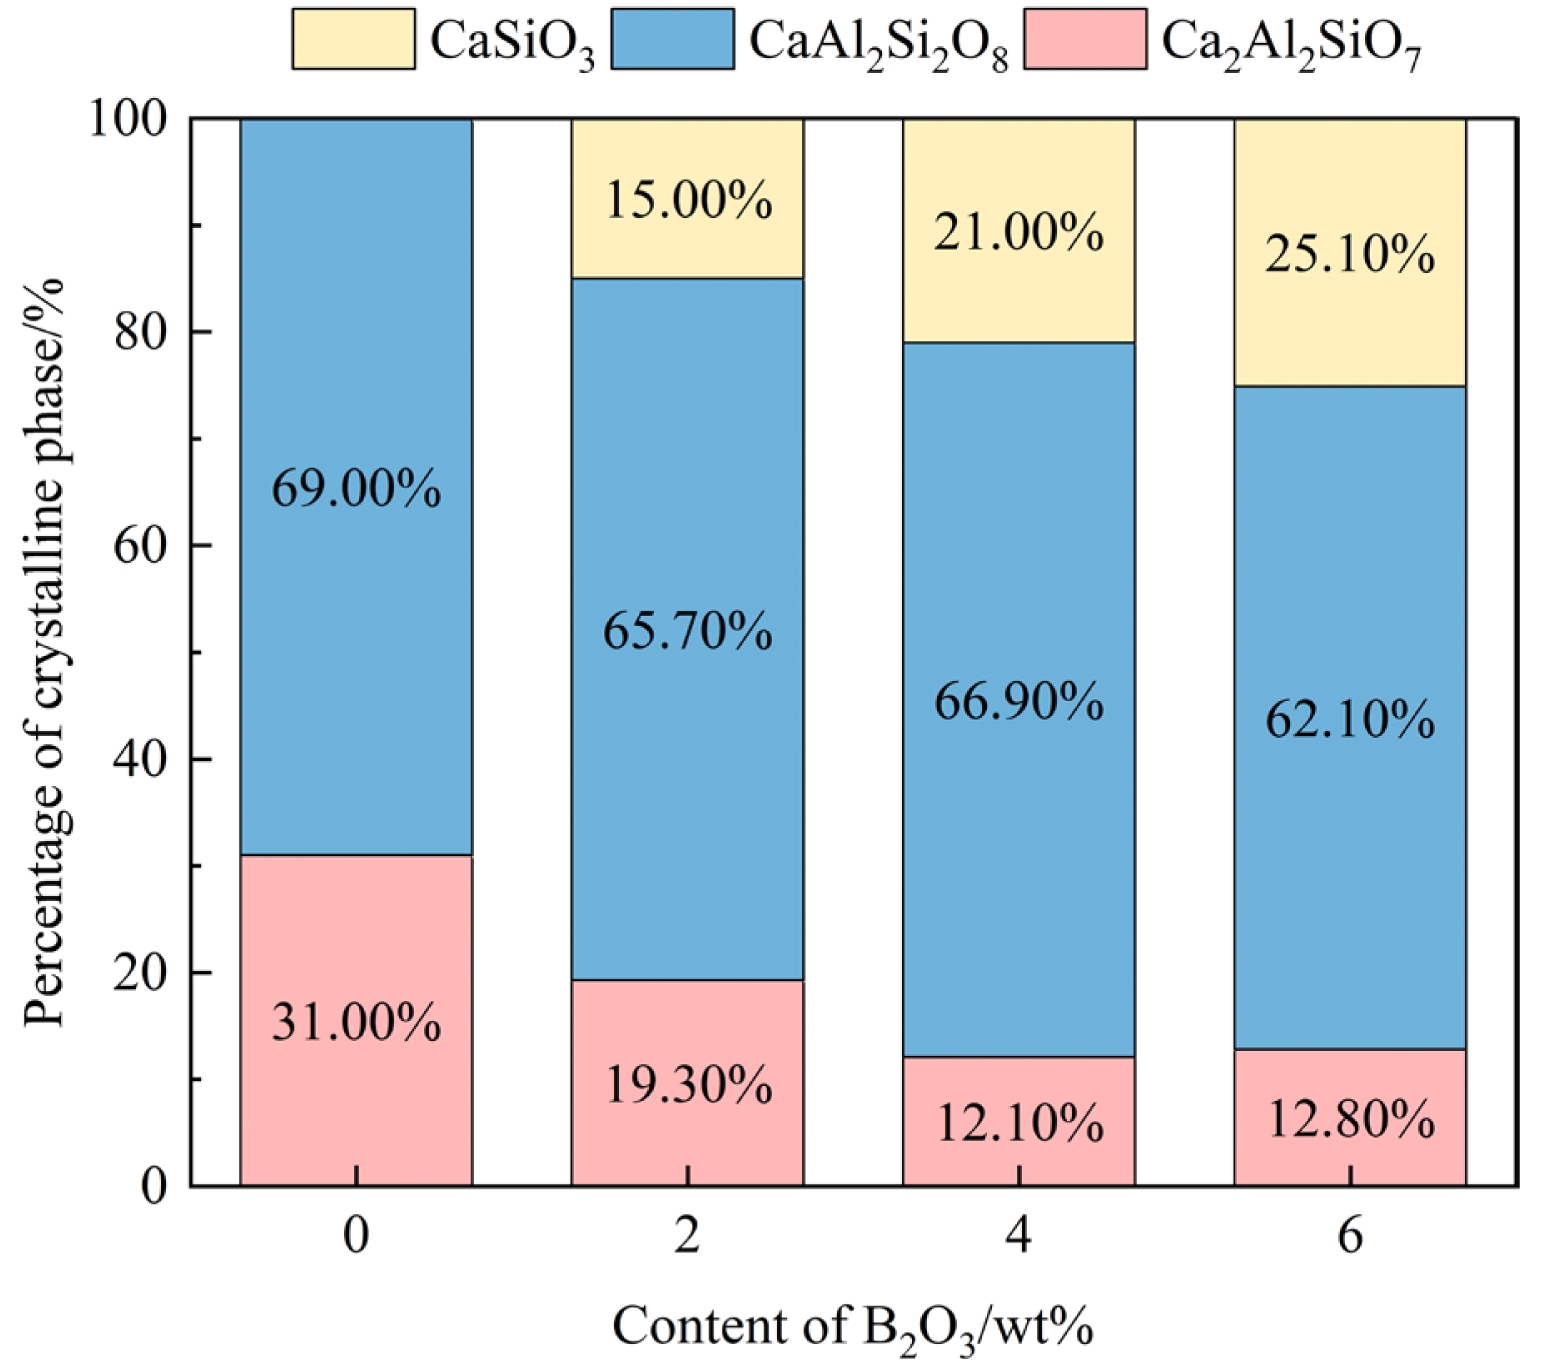
Fig. 5 shows the semi-quantitative analysis results of the crystalline phases precipitated in glass-ceramics with varying B2O3 contents. The semi-quantitative fitting errors were 8.77%, 8.21%, 9.24%, and 8.46%, respectively. As observed in the figure, with the increase in B2O3 content, the proportion of anorthite decreased from 69% to 54%, while the content of wollastonite gradually increased to 25%, indicating that the formation of wollastonite was driven by improved kinetic conditions. The formation of anorthite requires the cooperative arrangement of Al3+ and Si4+ within a tetrahedral network, and the primary components (CaO–Al2O3–SiO2) provide a sufficient structural basis for this. Even with the addition of B2O3, the high content of Al2O3 and SiO2 can still support anorthite as the dominant crystalline phase. Due to the similar charge between B3+ and Al3+, B2O3 may partially substitute Al2O3 in the glass network, forming [BO3] or [BO4] units. This substitution reduces the likelihood of Al3+ participating in crystal formation, which accounts for the slight decrease in the proportion of anorthite and the corresponding increase in wollastonite precipitation when the B2O3 content reaches 6 wt%.
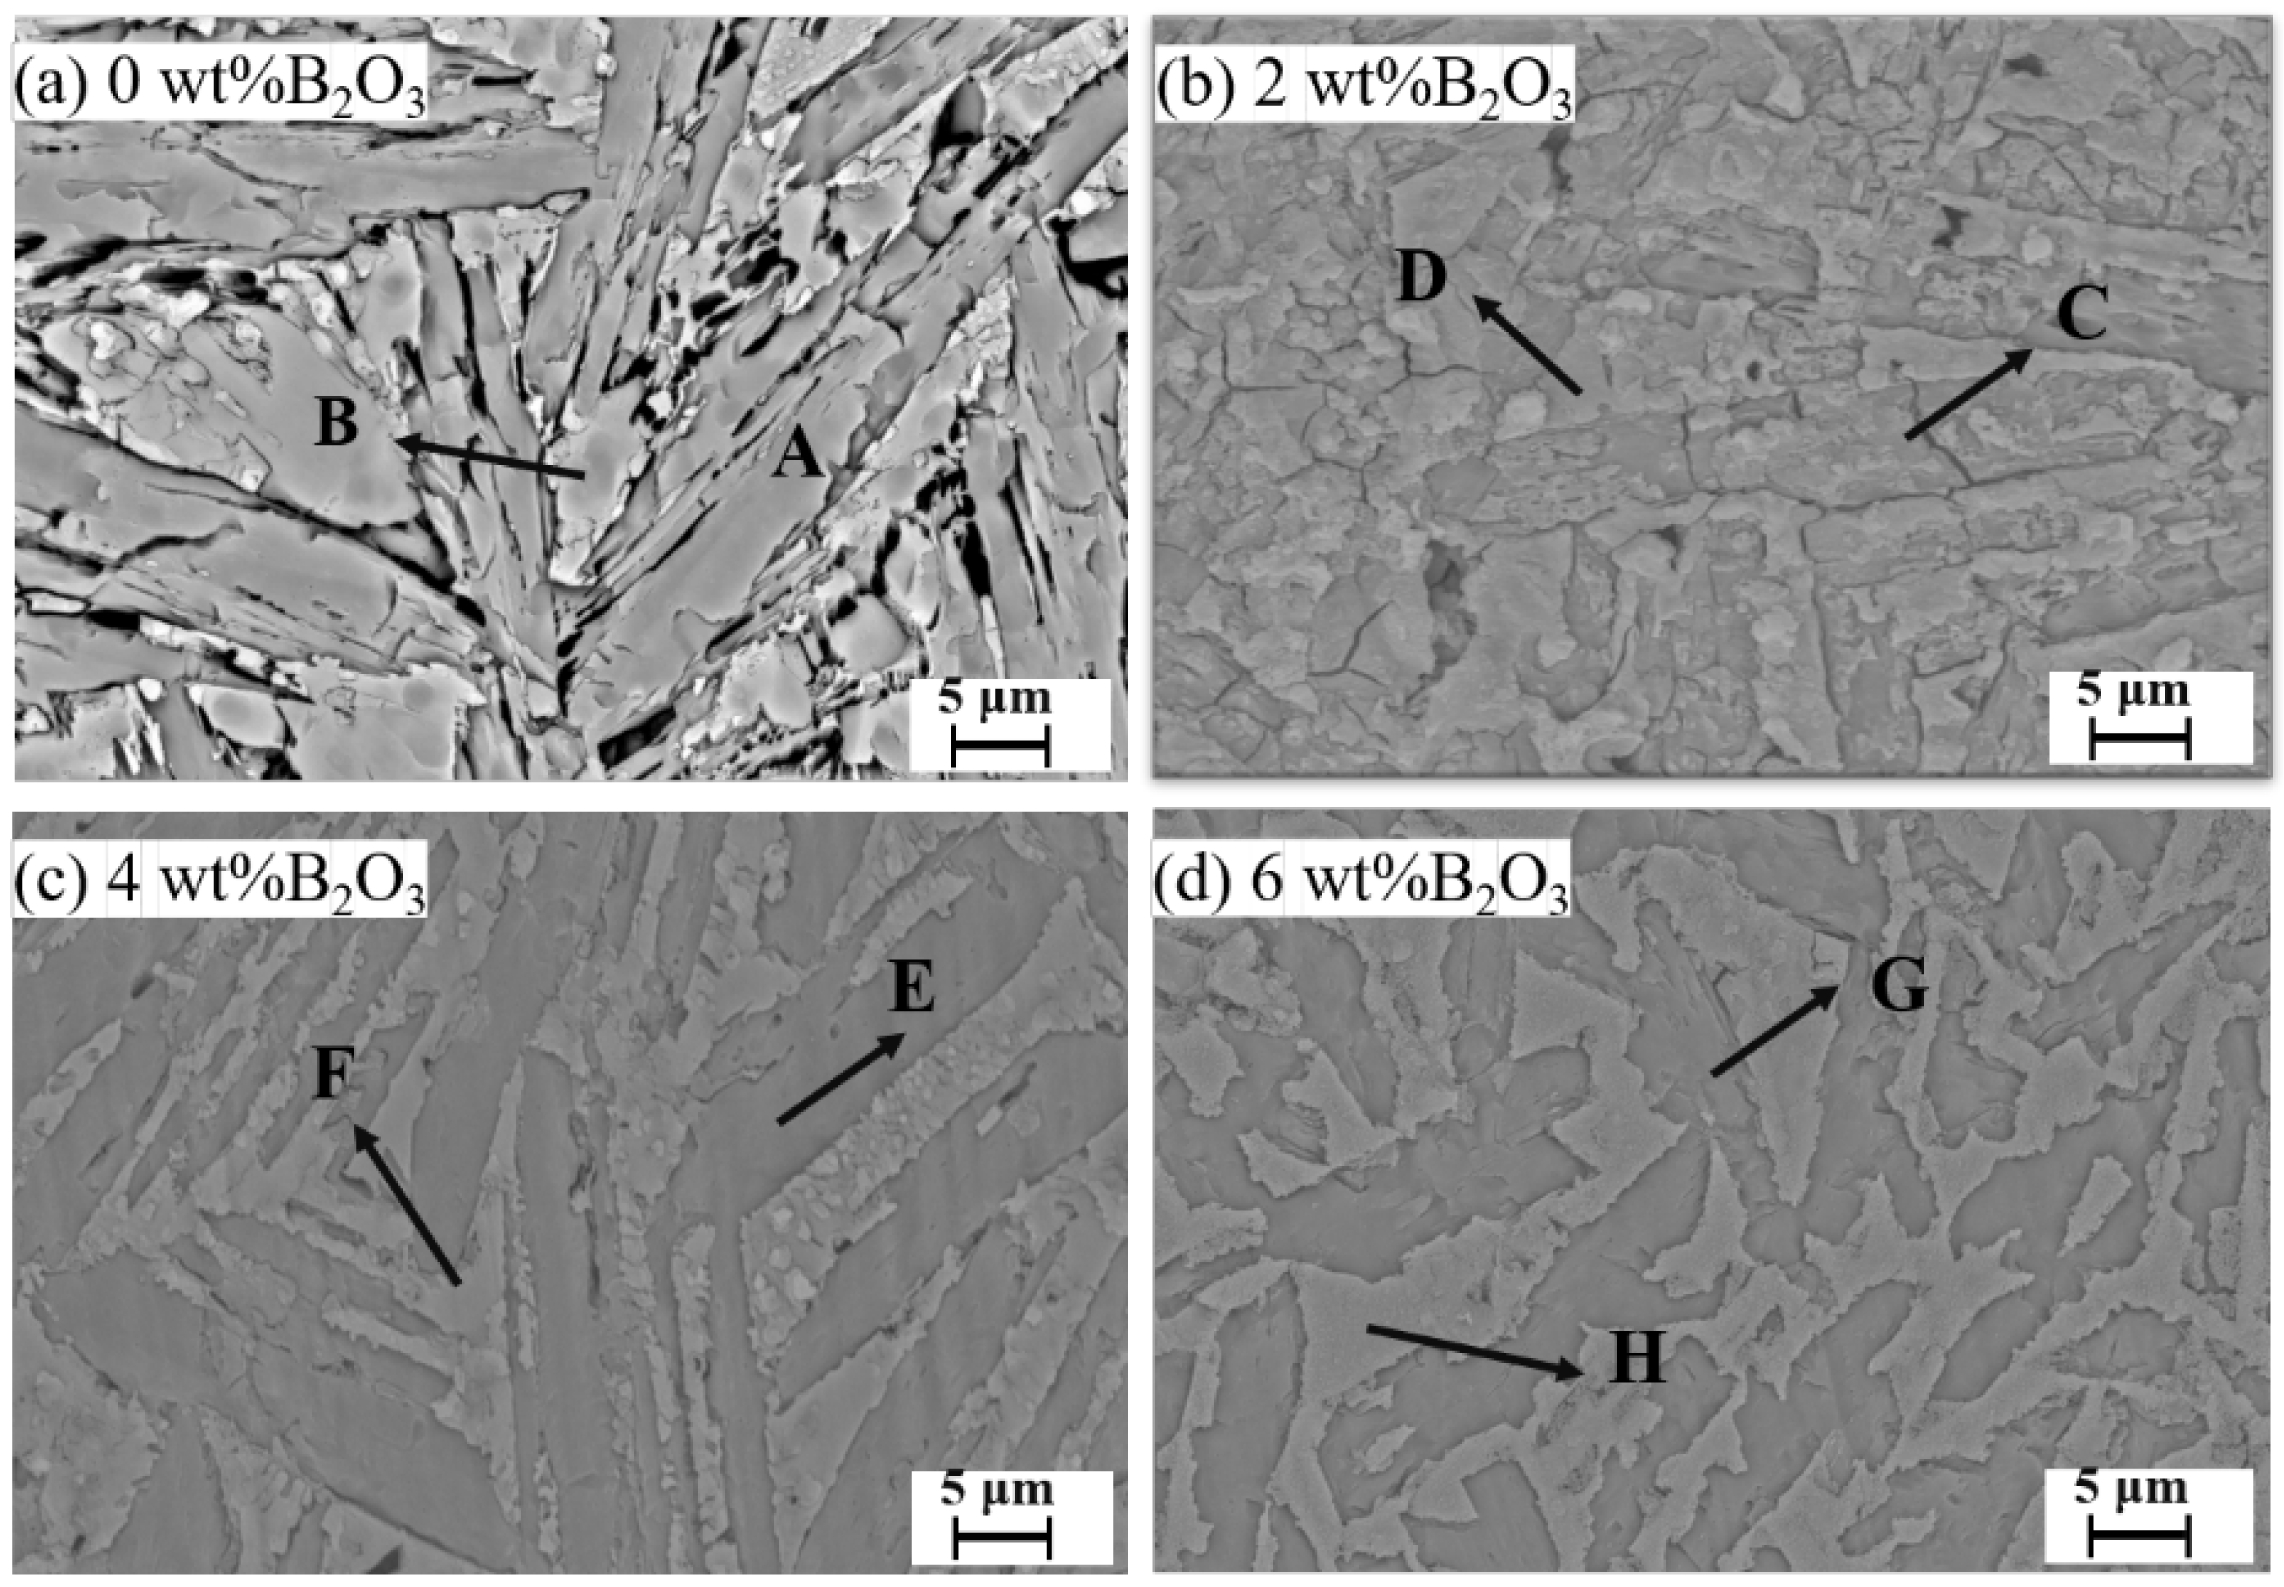
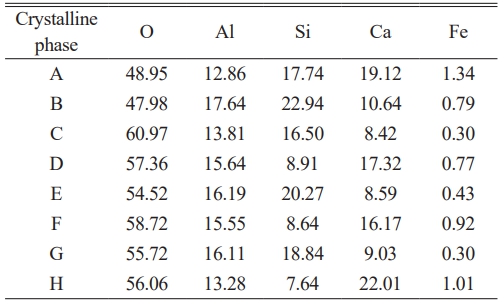
Fig. 6 shows the SEM images of glass-ceramics with varying B2O3 contents, and Table 5 presents the atomic ratios of the crystalline phases in these samples. Combined with the data in Table 6, it can be observed that the crystalline phases precipitated in the glass-ceramics include anorthite (CaAl2Si2O8), wollastonite (CaSiO3), and gehlenite (Ca2Al2SiO7). With increasing B2O3 content, a noticeable reduction in the gaps between crystalline phases is observed, and the grain size of the anorthite phase gradually decreases.
When the B2O3 content is 4 wt%, the overall crystalline phase distribution is uniform, and the crystal interfaces are well-defined. In contrast, when the B2O3 content is below 4 wt%, pores and cracks are observed within the glass-ceramics. This is attributed to the predominance of surface crystallization at lower B2O3 levels, where crystallization mainly occurs at the surface. The high viscosity of the glass impedes bubble escape during heat treatment, resulting in the formation of pore defects.
Effect of different B2O3 contents on the properties of glass-ceramics
Effect of different B2O3 contents on the physical properties of glass-ceramics
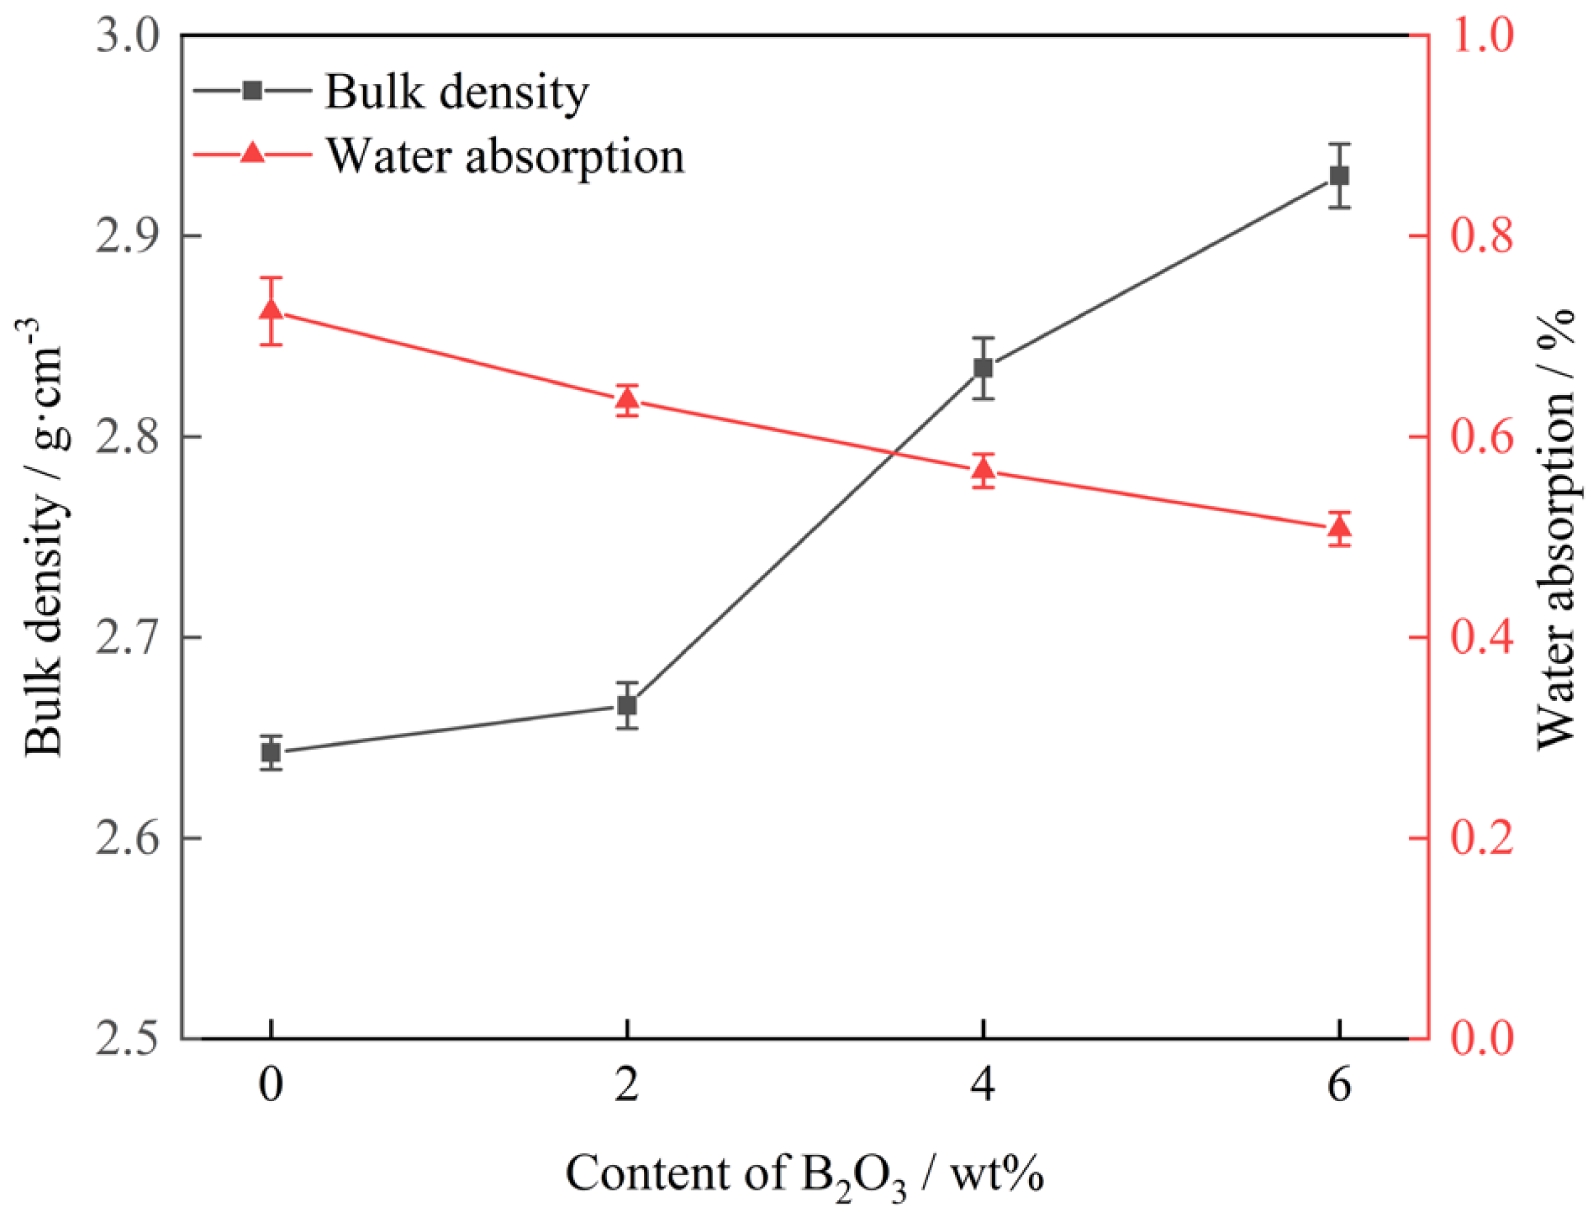
Fig. 7 displays the water absorption and bulk density of glass-ceramic samples with different B2O3 contents. The measured average water absorption values were 0.75%, 0.64%, 0.57%, and 0.51%, respectively. The corresponding average bulk density values were 2.64 g·cm⁻³, 2.67 g·cm⁻³, 2.84 g·cm⁻³, and 2.95 g·cm⁻³. Moreover, with increasing B2O3 content, the water absorption of the glass-ceramic samples exhibits a decreasing trend, while the bulk density shows a gradual increase. This indicates that the addition of B2O3 leads to a denser crystalline structure in the glass-ceramics, resulting in higher bulk density, reduced porosity, and lower water absorption.
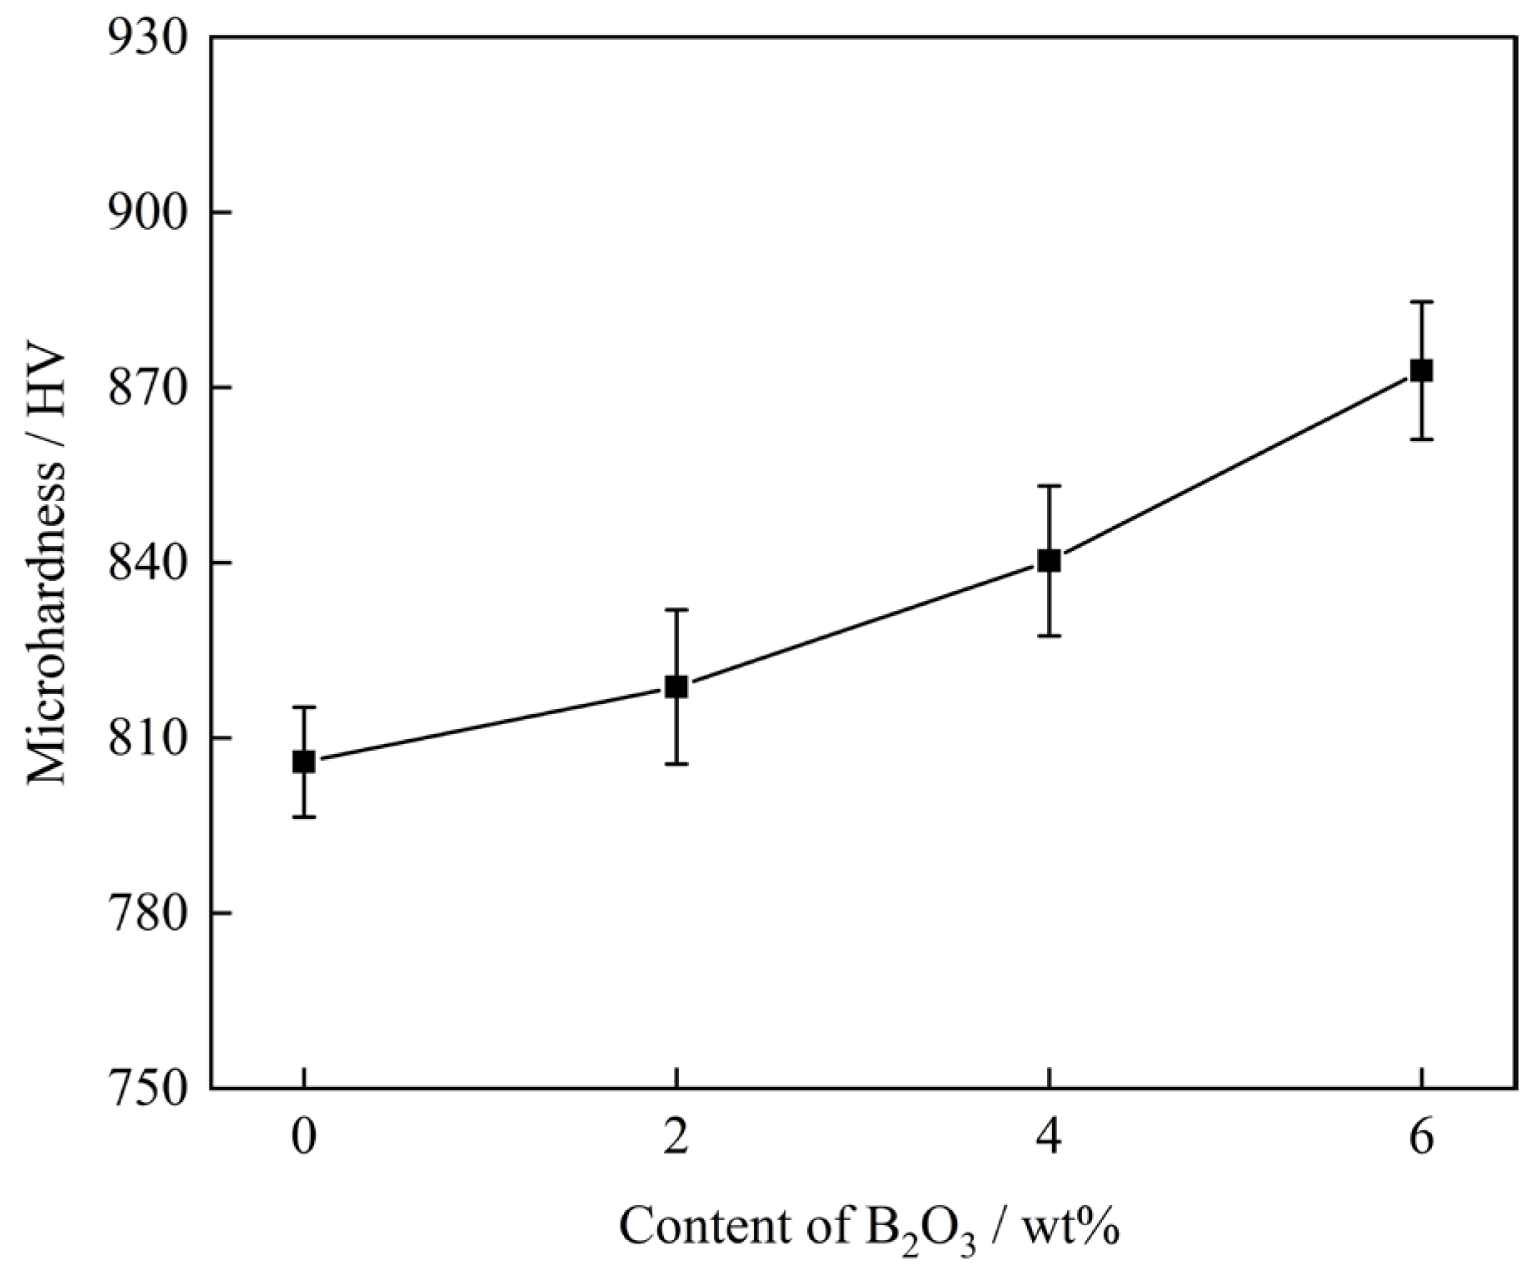
Fig. 8 shows the microhardness test results of the glass-ceramic samples. It is evident from the figure that the addition of B2O3 significantly enhanced the microhardness of the glass-ceramics. Among them, the sample containing 6 wt% B2O3 exhibited the highest hardness value. This can be attributed to the high content of precipitated anorthite phase and the fine-grained crystalline structure, in which the interlocking between crystalline phases further improves the material's resistance to external stress-induced damage.
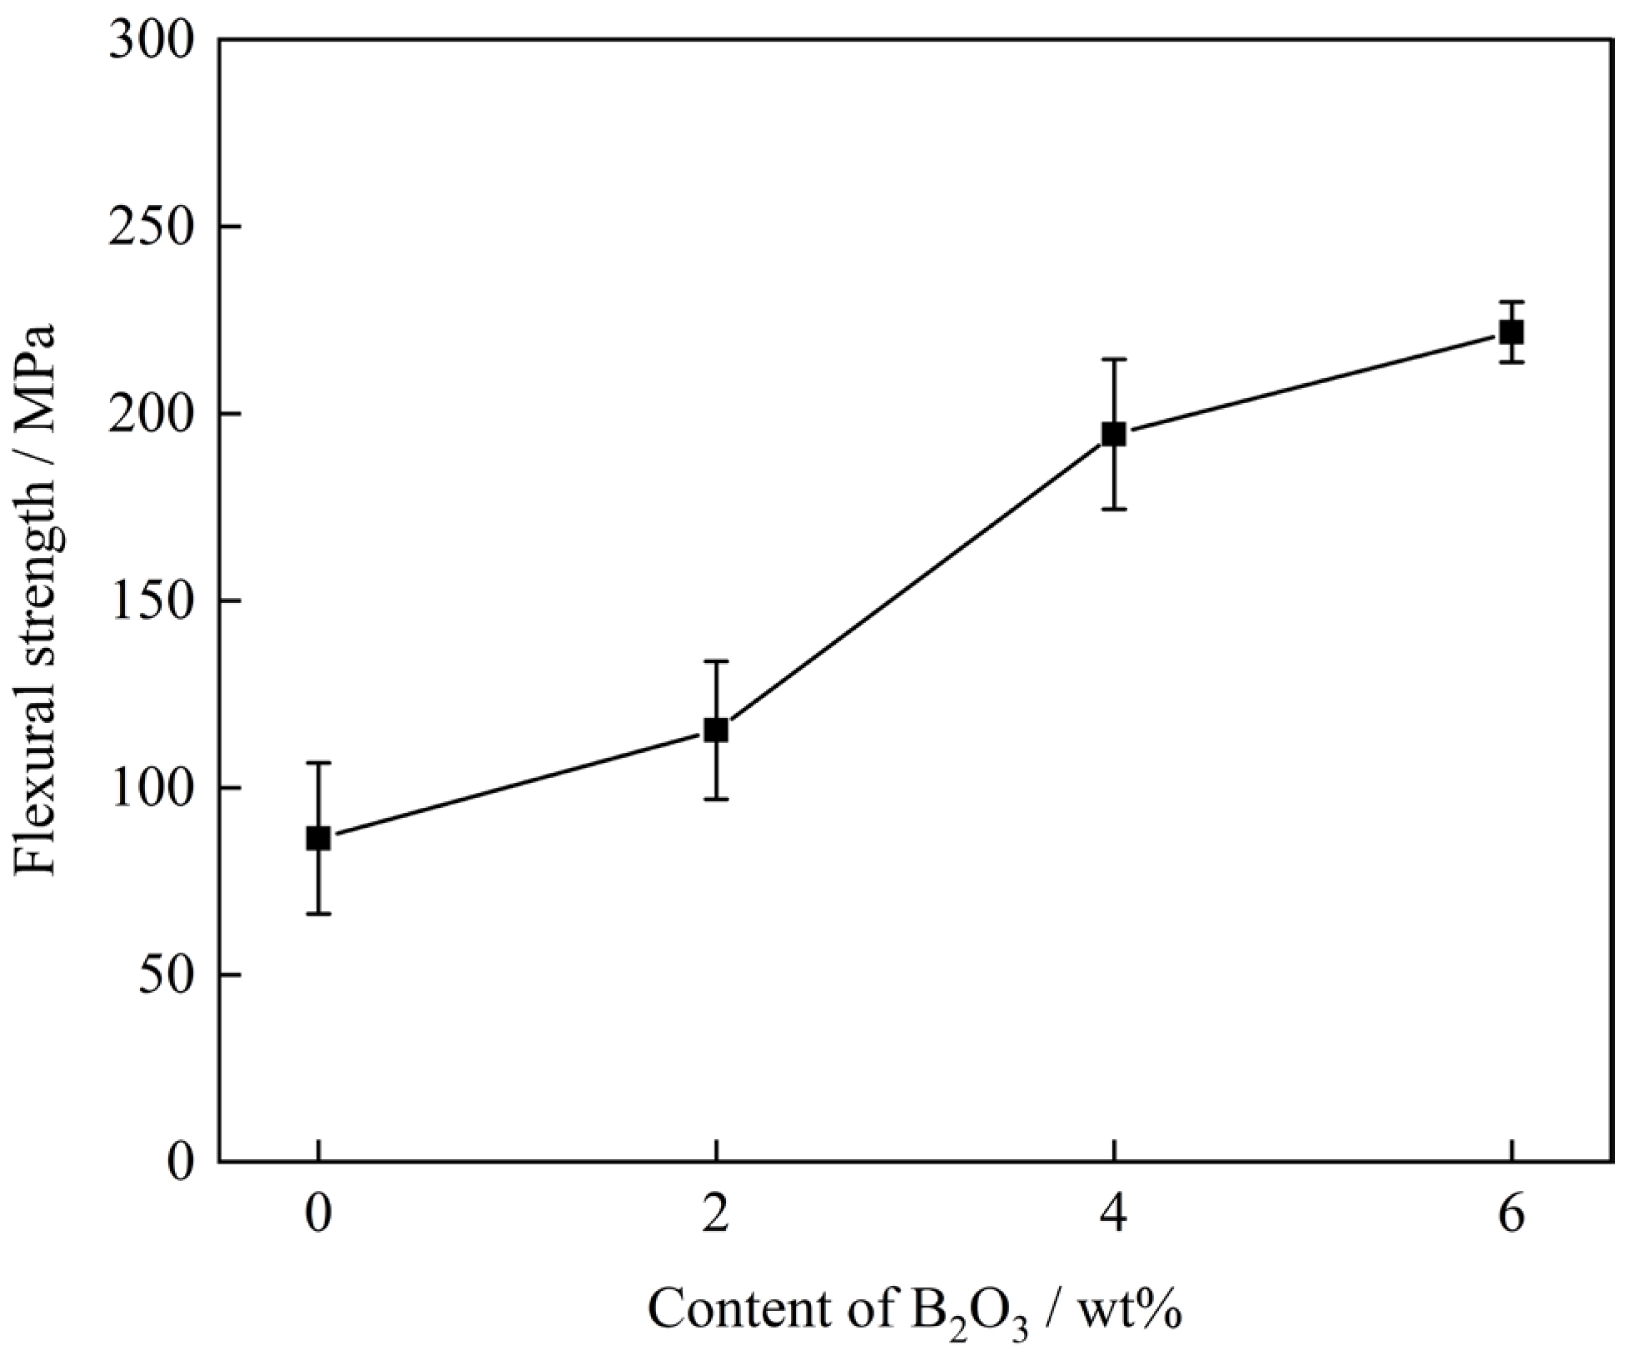
Fig. 9 presents the flexural strength of glass-ceramic samples with different B2O3 contents. The measured average flexural strength values were 86.25 MPa, 115.35 MPa, 194.48 MPa, and 221.75 MPa, respectively. As the B2O3 content increased, the flexural strength of the glass-ceramics improved. The sample with 6 wt% B2O3 exhibited the highest flexural strength. This enhancement is attributed to the refinement of the crystalline phases, which were more uniformly distributed and free from significant defects due to the incorporation of B2O3.
The variation in flexural strength depends on the morphology and size of the crystals as well as the glass phase content in the glass-ceramics [31, 32]. As shown in Fig. 6 and Table 5, when the B2O3 content in the glass-ceramics increases from 0 wt% to 6 wt%, the crystal size gradually decreases, and the glass phase content reduces. Fine crystal particles could effectively disperse external forces, avoid excessive stress concentration, and hinder crack propagation. Meanwhile, crack propagation induced by stress in glass-ceramics occurs more readily in the glass phase than in the crystalline phase [33]. Consequently, the flexural strength of the glass-ceramics increases.
Effect of different B2O3 contents on the corrosion resistance of glass-ceramics
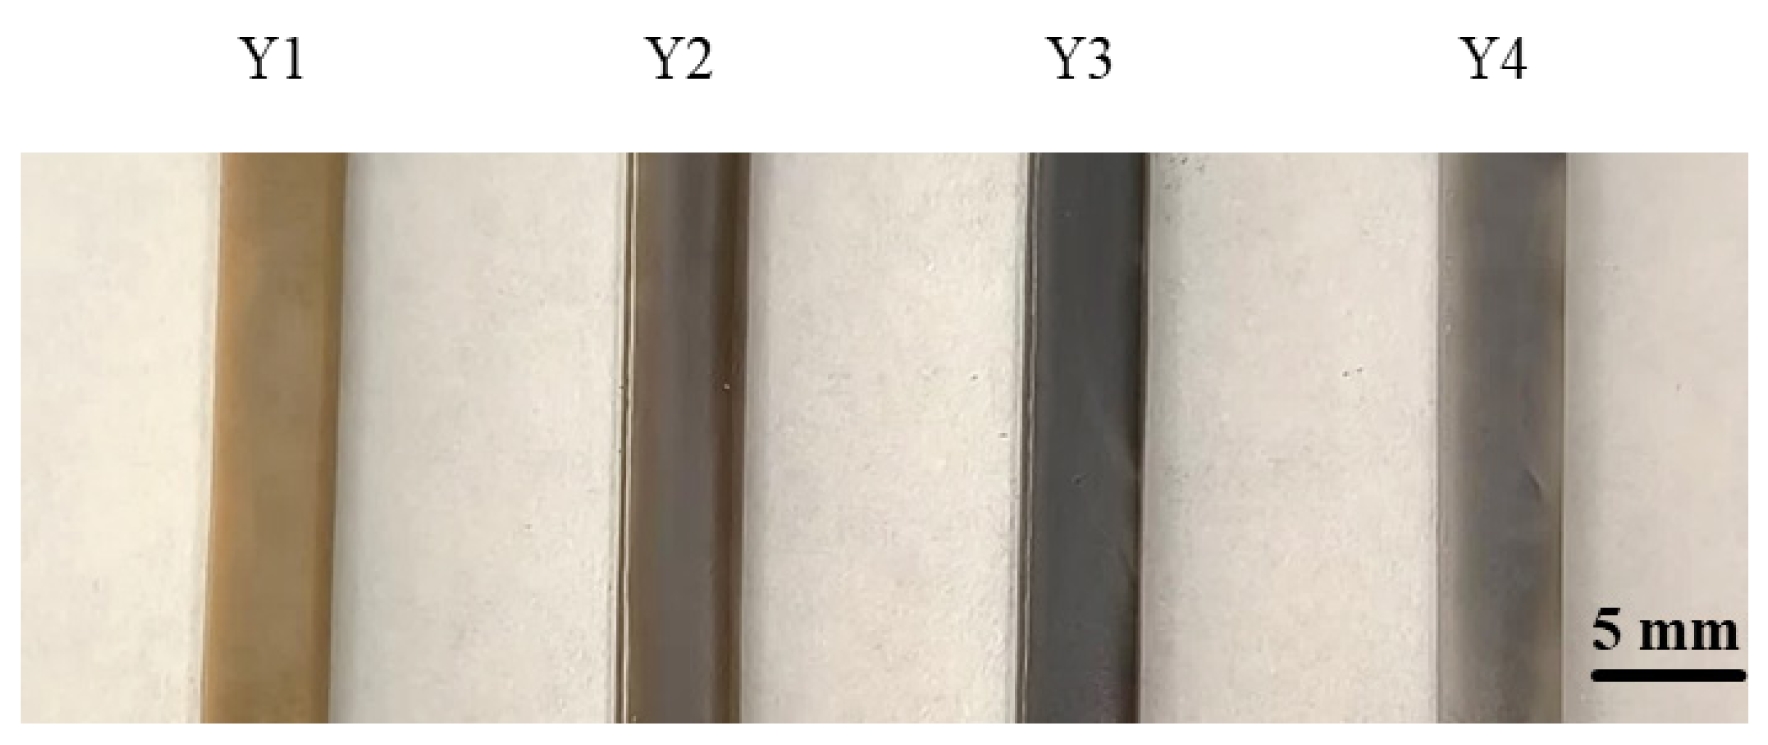
Fig. 10 shows the actual photographs of the glass-ceramic samples. As observed in Fig. 10, with increasing B2O3 content, the color of the glass-ceramics underwent a noticeable change, transitioning from light yellow to brownish green, and finally to a grayish-white tone.
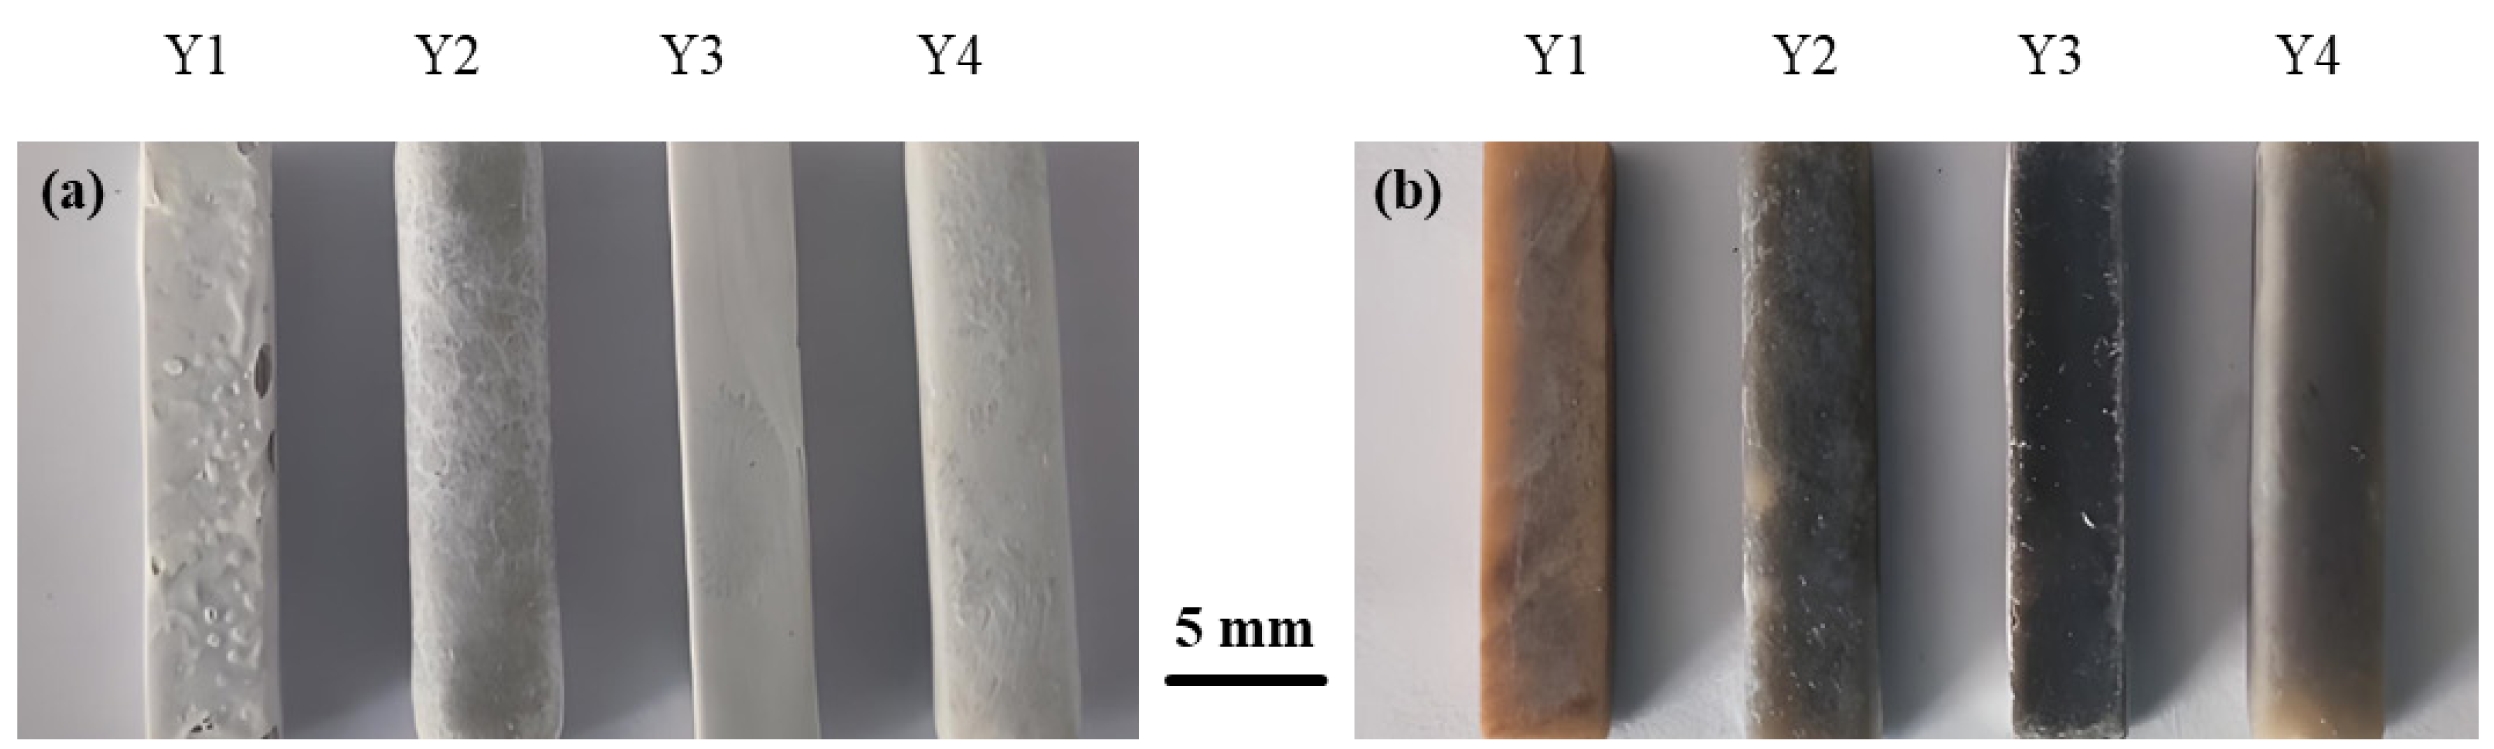
Fig. 11 displays the actual photographs of glass-ceramic samples with different B2O3 contents after corrosion testing. Compared with the uncorroded samples, it was observed that in 20 wt% H2SO4 solution, the surfaces of the glass-ceramics were covered with a white substance regardless of B2O3 content. In 20 wt% NaOH alkaline solution, white deposits were attached to specific areas of the glass-ceramic surfaces.
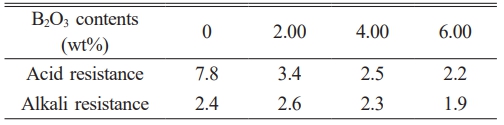
To investigate the effect of the fluxing agent B2O3 on the corrosion resistance of glass-ceramics, the prepared samples were immersed in 20 wt% H2SO4 and 20 wt% NaOH solutions, respectively. The mass of each sample was measured before and after corrosion, and the mass loss rate was calculated. The mass loss results before and after corrosion are presented in Table 7. The mass loss rates of B2O3-containing glass-ceramic samples under acidic conditions were 3.4%, 2.5%, and 2.2%, respectively, while those in alkaline solution were 2.6%, 2.3%, and 1.9%. In acidic environments, the mass loss of the glass-ceramic samples decreased progressively with increasing B2O3 content. In alkaline environments, the mass loss initially increased and then decreased with further B2O3 addition. This behavior can be attributed to the greater stability of Si–O tetrahedral structures and the anorthite phase in alkaline media. As B2O3 content increases, the amount of anorthite precipitated also increases, thereby enhancing the alkali corrosion resistance of the glass-ceramics [34].
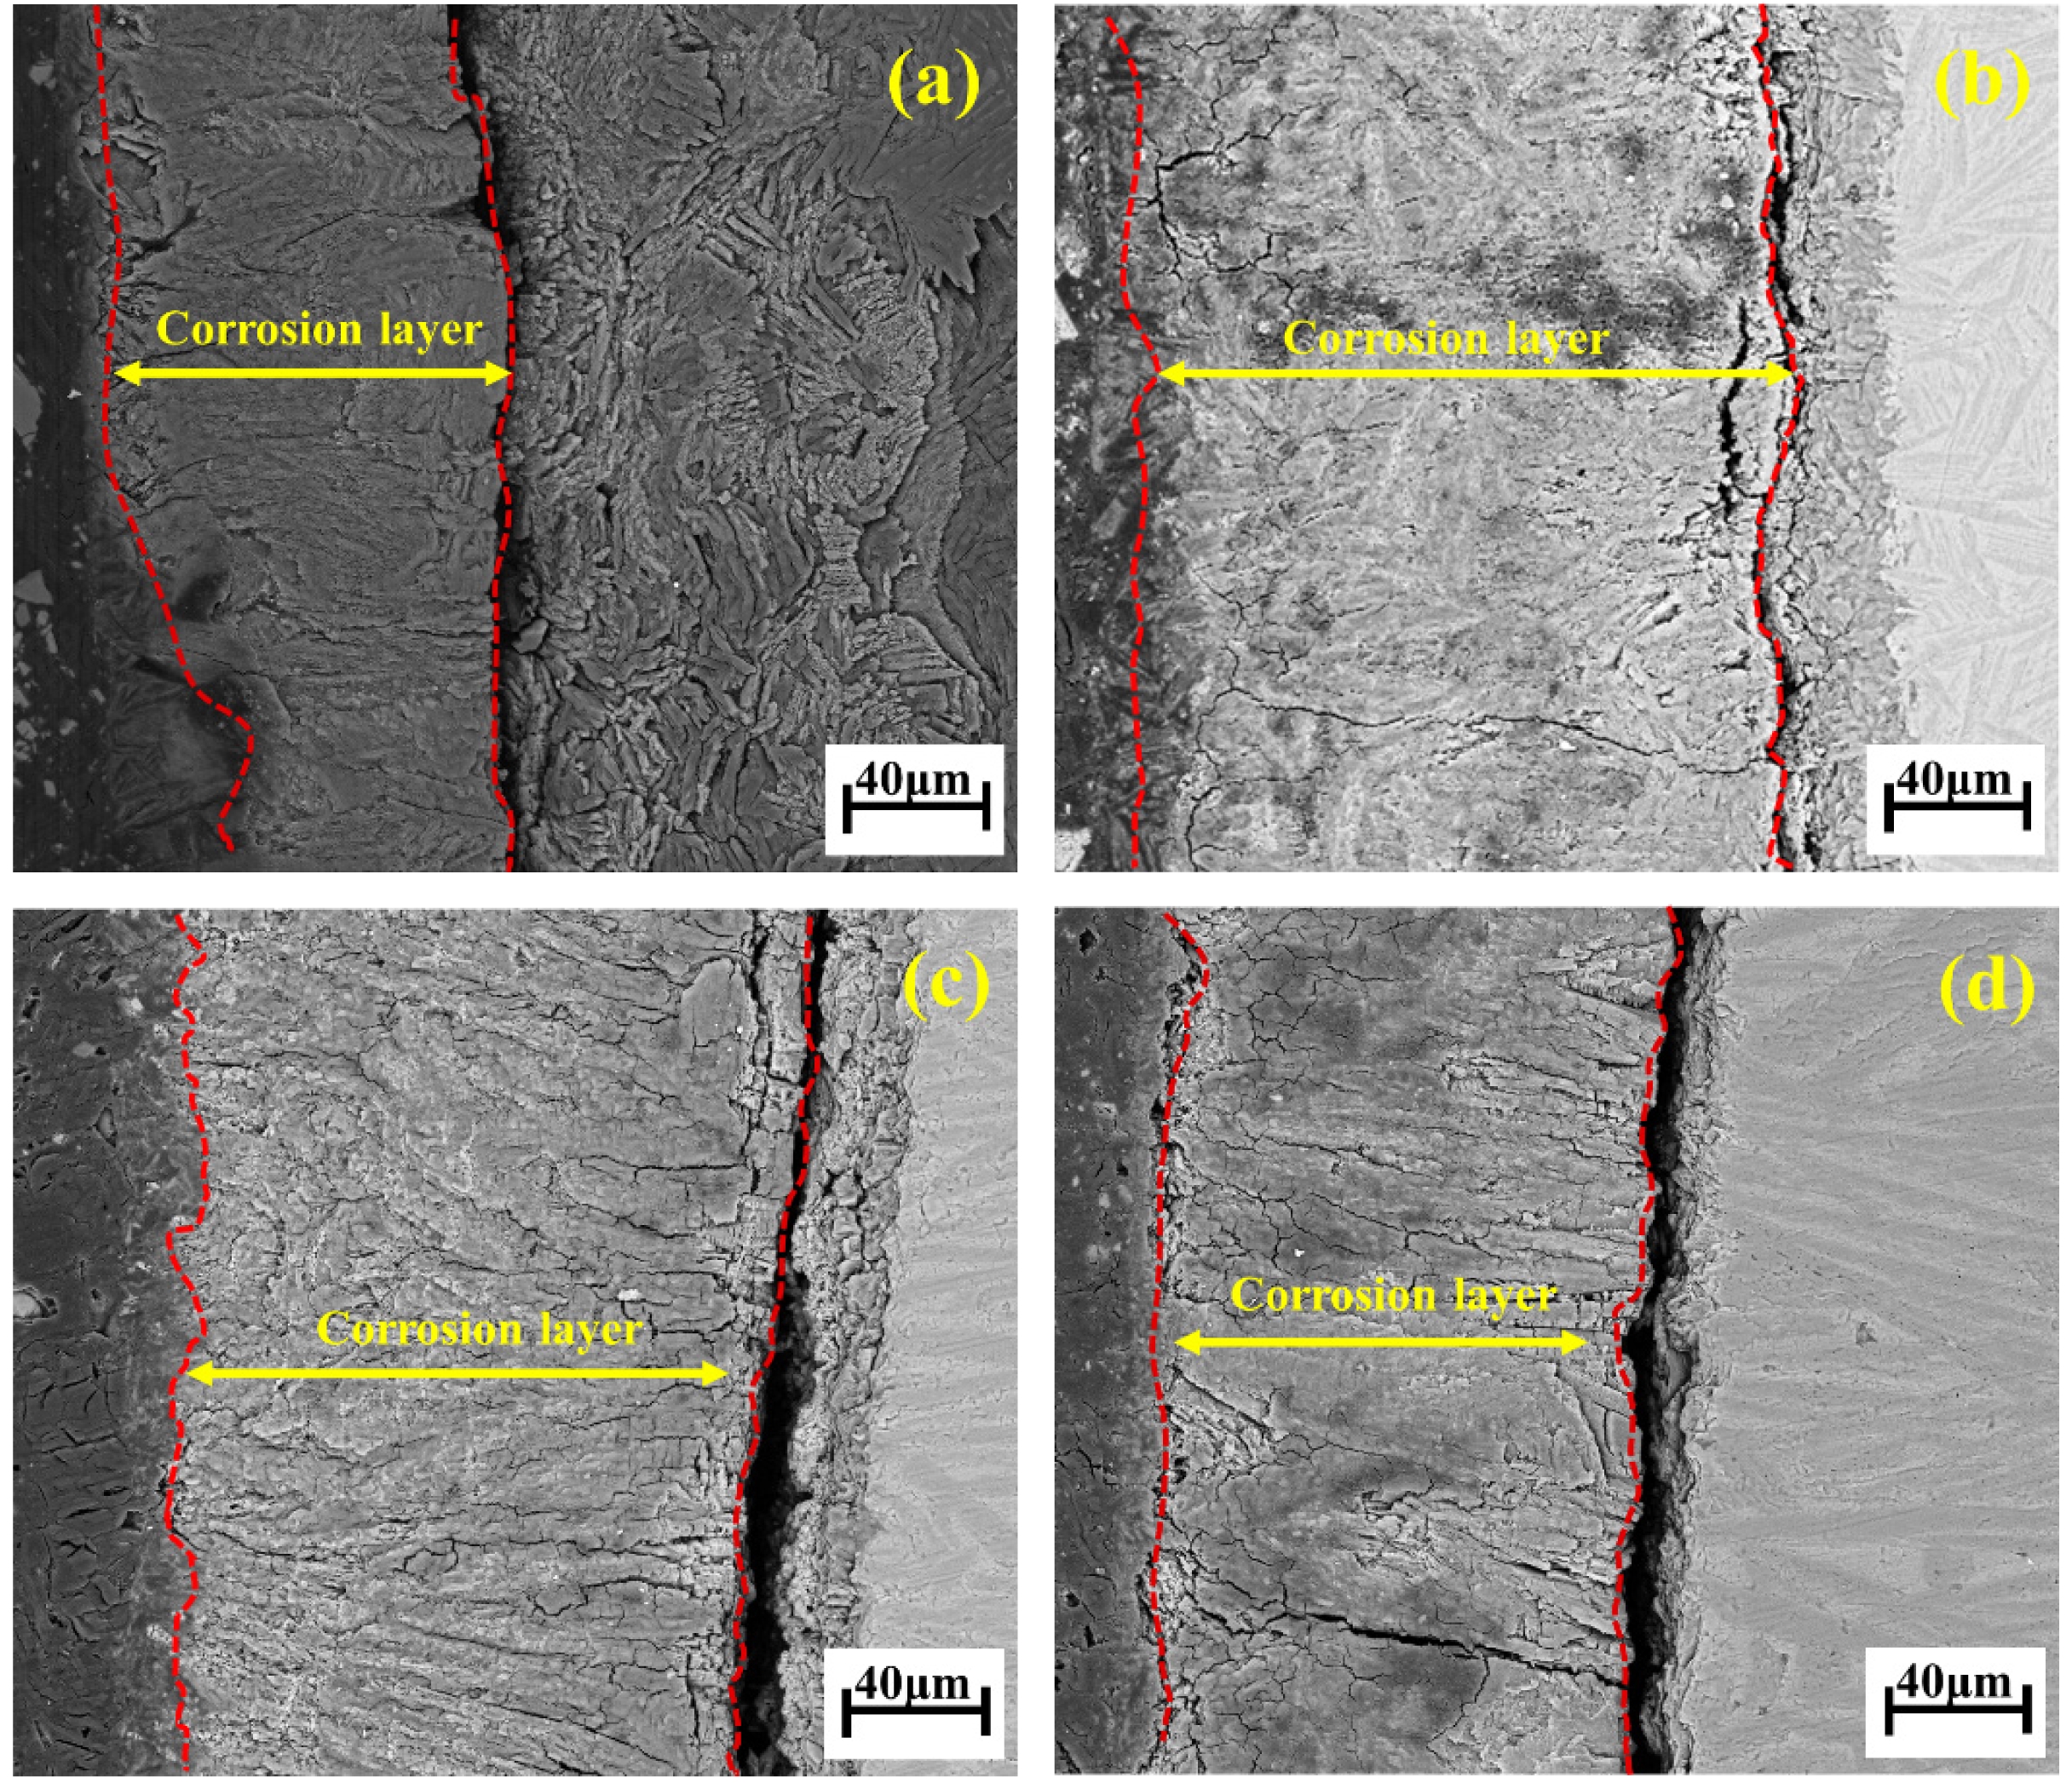
Fig. 12 shows the acid corrosion interface of the glass-ceramic samples. As observed under the electron microscope after polishing, a distinct corrosion layer appears on the surface of the samples subjected to acid solution attack. The thickness of the corroded boundary layer initially increases and then decreases. During the acid corrosion process, hydration reactions occur first, disrupting the glass network and generating micro-voids, which serve as pathways for SO42- ions to diffuse into the crystalline regions. This leads to the corrosion of the anorthite phase, resulting in stress imbalance within the crystal structure of the glass-ceramics, the formation of white particulate matter, cracking, and even exfoliation of the corroded layer as precipitates.
|
Fig. 2 SC curves of samples with different B2O3 contents at various heating rates: s: (a) 0 wt% B2O3; (b) 2 wt% B2O3; (c) 4 wt% B2O3; (d) 6 wt% B2O3. |
|
Fig. 3 Fitting curves of 1/Tp versus ln(Tp²/β) with different B2O3 contents. |
|
Fig. 4 XRD patterns of glass samples with different B2O3 contents. |
|
Fig. 5 Crystalline phase composition of glass-ceramics with different B2O3 contents. |
|
Fig. 6 SEM images of glass-ceramic samples with different B2O3 contents. |
|
Fig. 7 Water absorption and bulk density of glass-ceramic samples with different B2O3 contents. |
|
Fig. 8 Microhardness of glass-ceramic samples with different B2O3 contents. |
|
Fig. 9 Flexural strength of glass-ceramic samples with different B2O3 contents. |
|
Fig. 10 Appearance of glass-ceramics with different B2O3 contents. |
|
Fig. 11 Corrosion resistance of glass-ceramics with different B2O3 contents: (a) Acid resistance; (b) Alkali resistance. |
|
Fig. 12 SEM images of acid corrosion interfaces of glass-ceramics with different B2O3 contents: (a) 0 wt% B2O3; (b) 2 wt% B2O3; (c) 4 wt% B2O3; (d) 6 wt% B2O3. |
|
Table 3 Crystallization activation energy and crystal growth index of glass samples with different B2O3 contents. |
|
Table 4 Nucleation temperature and crystallization temperature of the base glass with different B2O3 contents. |
|
Table 5 Crystallinity and content of crystal phases of glassceramics with different B2O3 contents. |
|
Table 6 Atomic ratios (at.%) of crystalline phases in glassceramics with different B2O3 contents. |
|
Table 7 Corrosion resistance of glass-ceramics with different B2O3 contents (%). |
(1) The addition of B2O3 reduced the crystallization temperature of the glass-ceramics and promoted the crystallization process, shifting the crystallization mechanism from surface crystallization to bulk crystallization. The sample containing 6 wt% B2O3 exhibited the most favorable crystallization behavior.
(2) With increasing B2O3 content, the crystallization activation energy (E) of the glass-ceramics initially decreased and then increased. Both the nucleation and crystallization temperatures gradually declined, and the overall crystallization behavior corresponded to bulk crystallization. The primary crystalline phase precipitated was anorthite, while the amount of wollastonite increased progressively.
(3) As the B2O3 content increased from 0 wt% to 6 wt%, the water absorption of the glass-ceramics exhibited a decreasing trend, while the bulk density showed a corresponding increase. Both flexural strength and hardness improved. In the corrosion resistance tests, the mass loss of the glass-ceramics gradually decreased, with lower mass loss observed in alkaline solution compared to acidic solution. Through comprehensive comparison, it was found that the glass-ceramic exhibited optimal physicochemical properties when the B2O3 content was 6 wt%. At this composition, the bulk density reached 2.95 g·cm⁻³, the water absorption was 0.51%, the microhardness was 8.70 GPa (886.32 HV), and the flexural strength was 230 MPa. The mass loss rates under acid and alkali corrosion conditions were 2.2% and 1.9%, respectively.
This work was financially supported by Iron and Steel Joint Research Fund of National Natural Science Foundation and China BaoWu Steel Group Corp. Ltd (Grant No. U1960108); the Hubei Provincial International Science and Technology Cooperation Program (Grant No. 2023EHA013); and the Key Laboratory for Ferrous Metallurgy and Resources Utilization of Ministry of Education, Wuhan University of Science and Technology, and Hubei Provincial Key Laboratory for New Processes of Ironmaking and Steel making, Wuhan University of Science and Technology (Grant No. FMRUlab25-02); and Hubei Provincial Special Fund for Central-Guided Local S&T Development (2025CSA017).
The authors declare that there are no conflicts of interest and ethical rule that could have appeared to influence the work reported in this paper.
The manuscript was written through the contributions of all authors. Ju Xu: Data curation, Investigation, Resources, Writing – original draft and Writing – review & editing. Guojun Ma: Conceptualization, Investigation, Supervision and Writing – original draft. Zhibo Tong: Conceptualization, Investigation, Resources, Supervision and Writing – original draft. Yunjie Li: Writing – original draft and data curation. All authors have read and agreed to the published version of the manuscript.
- 1. S. Zhang, N. Zhu, W. Shen, X. Wei, F. Li, W. Ma, F. Mao, and P. Wu, Resour. Conserv. Recy. 178 (2022) 106098.
-

- 2. Z. Guo, J. Pan, D. Zhu, and F. Zhang, J. Clean. Prod. 199 (2018) 891-899.
-
- 3. R. Nadirov and G. Karamyrzayev, Minerals 12[8] (2022) 1047.
-
- 4. S. Zhang, N. Zhu, F. Mao, J. Zhang, X. Huang, F. Li, X. Li, P. Wu, and Z. Dang, J. Hazard. Mater. 402 (2021) 123791.
-
- 5. A.T. Heijne, F. Liu, R.V.D. Weijden, J. Weijma, C.J.N. Buisman, and H.V.M. Hamelers, Environ. Sci. Technol. 44[11] (2010) 4376-4381.
-
- 6. Y. Fan, E. Shibata, A. Iizuka, and T. Nakamura, Mater. Trans. 55[6] (2014) 958-963.
-
- 7. P. Sarfo, G. Wyss, G. Ma, A. Das, and C. Young, Miner. Eng. 107 (2017) 8-19.
-
- 8. J.-P. Wang and U. Erdenebold, Sustainability. 12[4] (2020) 1421.
-
- 9. Z. Li, G. Ma, and M. Liu, J. Zou, Metals. 8[9] (2018) 714.
-
- 10. Y. Xu, X. Xue, Z. Pan, H. Zhang, and Y. Du, J. Ceram. Process. Res. 26[4] (2025) 661-671.
-
- 11. Y. Du, Z. Zheng, M. Zhao, H. Zhang, L. Deng, H. Chen, Y. Wei, and Y. Guo, J. Ceram. Process. Res. 25[2] (2024) 268-271.
-
- 12. J. Yu, Z. Peng, W. Shang, Q. Chen, G. Zhu, H. Tang, M. Rao, and G. Li, Ceram. Int. 49[10] (2023) 15947-15958.
-
- 13. F. Pei, G. Zhu, P. Li, H. Guo, and P. Yang, Ceram. Int. 46[11] (2020) 17825-17835.
-
- 14. Y. Shi and L. Gou. Materials Reports. 35[5] (2021) 5027-5031. (in Chinese)
-
- 15. S. Huang, S. Li, F. Wu, and Y. Yue, J. Inorg. Organomet. Polym. 25[4] (2015) 816-822.
-
- 16. X. Luo, L. Ren, Y. Xia, Y. Hu, W. Gong, M. Cai, and H. Zhou, Ceram. Int. 43[9] (2017) 6791-6795.
-
- 17. A.C. Wright, Phys. Chem. Glasses: Eur. J. Glass Sci. Technol. B 59[2] (2018) 65-87.
-
- 18. K.V. Shah, M. Goswami, M.N. Deo, A. Sarkar, S. Manikandan, V.K. Shrikhande, and G.P. Kothiyal, Bull. Mater. Sci. 29[1] (2006) 43-48.
-
- 19. Y. Fu, P. Li, H. Tao, L. Zhang, M. Xin, Y. Chang, Y. Xia, and H. Zhou, J. Mater. Sci: Mater. Electron. 30[15] (2019) 14053-14060.
-
- 20. H.E. Kissinger, Anal. Chem. 29[11] (1957) 1702-1706.
-
- 21. J.A. Augis and J.E. Bennett, J. Therm. Anal. 13[2] (1978) 283-292.
-
- 22. Y. Fan, Y. Li, D. Cang, and G. Zhou, J. Univ. Sci. Technol. Beijing 35[7] (2013) 901-907. (in Chinese)
- 23. Z. Li, G. Ma, D. Zheng, X. Zhang, Mater. Today Commun. 31 (2022) 103516.
-
- 24. Z. Li, G. Ma, D. Zheng, X. Zhang, R.A. Muvunyi, Ceram. Int. 48[15] (2022) 21245-21257.
-
- 25. JC/T 258-1993, Test methods for performance of cast stone products - acid and alkali resistance test, Standards Press of China, Beijing, 1993.
- 26. JC/T 872-2019, Glass-ceramic for building decoration, Standards Press of China, Beijing, 2019.
- 27. S. Hu, K. Zhou, H. Xie, Z. Cao, S. Duo, and J. Shi, Ceramics-Silikaty. 69[1] (2025) 54-62.
-
- 28. Z. Qing, Mater. Lett. 212 (2018) 126-129.
-
- 29. B. Zhang, F. He, X. Cao, M. Wei, C. Zheng, and J. Xie, Ceram. Int. 48[5] (2022) 7013-7023.
-
- 30. T. Zhao, A. Li, Y. Qin, J. Zhu, X. Kong, and J. Yang, J. Non-Cryst. Solids 512 (2019) 148-154.
-
- 31. E. Montoya-Quesada, M.A. Villaquirán-Caicedo, R.M. de Gutiérrez, and J. Muñoz-Saldaña, Ceram. Int. 46[4] (2020) 4322-4328.
-
- 32. S.K. Jung, D.W. Kim, J. Lee, S. Ramasamy, H.K. Kim, J.J. Ryu, and J.S. Shim, Materials 14[9] (2021) 2094.
-
- 33. X.Z. Ren, W. Zhang, Y. Zhang, P. Zhang, and J. Liu, Trans. Nonferrous Metals Soc. China 25[1] (2015) 137-145.
-
- 34. Z. Yan, X. Wang, W. Wang, F. Li, Y. Ye, X. Yin, Z. Zheng, and B. Liu, Conservation and Utilization of Mineral Resources. 42[2] (2022) 157-161. (in Chinese)
-
 This Article
-
2025; 26(6): 1032-1042
Published on Dec 31, 2025
- 10.36410/jcpr.2025.26.6.1032
- Received on Aug 20, 2025
- Revised on Nov 1, 2025
- Accepted on Nov 21, 2025
Services
- Abstract
introduction
experimental
results and discussion
conclusions
- Acknowledgements
- Conflict of Interest
- Author Contributions
- References
- Full Text PDF
Shared
Correspondence to
- Guojun Ma a,c,d, Zhibo Tong a,b
-
aKey Laboratory for Ferrous Metallurgy and Resources Utilization of Ministry of Education, Wuhan University of Science and Technology, Wuhan 430081, China
bSchool of Materials Science & Engineering, Yangtze Normal University, Chongqing 408100, China
cState Key Laboratory of Advanced Refractories, Wuhan University of Science and Technology, Wuhan 430081, China
dJoint International Research Laboratory of Refractories and Metallurgy, Wuhan University of Science and Technology, Wuhan 430081, China
Tel: +86-158-2717-6543 Fax: +86-27-68862529 (Guojun Ma)
Tel: +86-158-7240-6126 (Zhibo Tong) - E-mail: gma@wust.edu.cn (Guojun Ma), 404545023@qq.com (Zhi
Clean-Energy Research Institute(CRI), Hanyang University, 222, Wangsimni-ro, Seongdong-gu, Seoul, 04763, Korea
E-mail: jcpr@hanyang.ac.kr