


- Effect of different additives on the hydration and hardening of magnesium oxysulfate cement
Yuhan Tanga, Xuetao Yuea,*, Youshuai Zhaoa, Xuelei Anb, Xiaopeng Shangc and Chonghao Liud
aSchool of Material Science and Engineering, Shandong Jianzhu University, Jinan 250101, China
bShandong Survey and Design Institute of Water Conservancy Co., Ltd, Jinan 250013, China
cShandong Urban Construction Vocational College, Jinan 250103, China
dJinan Energy Engineering Group Co., Ltd, Jinan 250101, ChinaThis article is an open access article distributed under the terms of the Creative Commons Attribution Non-Commercial License (http://creativecommons.org/licenses/by-nc/4.0) which permits unrestricted non-commercial use, distribution, and reproduction in any medium, provided the original work is properly cited.
Magnesium oxysulfate (MOS) cement has the advantages of early strength, good fire resistance and good decorative properties, but its low mechanical strength limits its wide application in the construction industry. Research indicates that incorporating the right additives into cement can enhance its strength. This study delves into the mechanical strength, hydration reactions, water resistance, phase composition, and microstructure of MOS cement when mixed with citric acid (CA), tartaric acid (TA), oxalic acid (HAC), and ethylenediaminetetraacetic acid (EDTA). The findings revealed that the inclusion of CA, TA, HAC, and EDTA significantly bolstered both the mechanical strength and water resistance of MOS cement. Moreover, these additives promoted the development of the needlelike crystal 517 phase and inhibited the reaction of the hydration layer [Mg(H2O)xOH]+ with OH- to produce Mg(OH)2. With different types of additives, different abilities to chelate Mg2+, different numbers of 517 phase crystals generated, thus the mechanical strength of MOS cements incorporated with different additives is different, CA has the strongest ability to chelate Mg2+ and therefore has superior mechanical strength and water resistance compared to other additives.
Keywords: Magnesium oxysulfate cement, Additive, Mechanical strength, Water resistance, Microstructure.
The ternary cementitious system MgO-MgSO4-H2O known as magnesium oxysulfate (MOS) cement is made up of certain active light-burned magnesium oxide and an aqueous solution of magnesium sulfate [1-5]. High early strength, low heat conductivity, impact resistance, good refractoriness, and good ornamental qualities are some of its benefits [6-10], etc, and can be used as a thermal insulation material [11-13]. Magnesium oxide and magnesium sulfate are the primary basic ingredients used in MOS cement. Magnesite calcination into magnesium oxide requires less energy, the calcination temperature is only 650℃, the resulting CO2 emissions are much smaller compared with other mineral raw materials, thus achieving the goal of energy saving and low carbon. However, because of its weak water resistance and limited mechanical strength, MOS cement is not employed extensively in the construction industry.
The amount and kind of hydration products in MOS cement mostly determine its mechanical strength. Kahle [14] found that when MgO:MgSO4=5:1 and cured in saturated steam, only the 318 phase and the 517 phase were present in MOS cement samples. Urwrong and Sorrell [15] found that the 318 phase in the MgO-MgSO4-H2O ternary system barely exceeds 50% at room temperature, resulting in low mechanical strength of MOS cements. To enhance the strength of MOS cement, researchers have investigated modified MOS cement. Yu [16] synthesized 5Mg(OH)2·MgSO4·7H2O (517 phase), a novel acicular magnesium sulfate hydrate that was shown to increase MOS cement's compressive strength through experimentation.
Researchers have discovered that adding additives to MOS cements can change how the cement hydrates and encourage the formation of acicular crystalline 517 phases, which increases the cement's mechanical strength. Wu [17] found that adding phosphoric acid and phosphate to MOS cement might alter the hydration process of MgO. By preventing the production of Mg(OH)2 and promote the creation of the acicular crystal 517 phase, which would give MOS cement a denser structure. This enhances MOS cement's mechanical properties and water resistance while extending its setting time. Guo [18] added sodium malate to MOS cement, and the chelation reaction between malate and magnesium hydroxylate hindered the conversion of magnesium hydrate into Mg(OH)2, promoted the generation of the 517 phase, while improved strength and water resistance of MOS cement. By adding weak acids to MOS cement, Qin [19] was able to increase the cement's compressive strength, water resistance, and drying shrinkage. This was because the addition of weak acids caused acicular whisker 517 phases to form, which filled the pores and microcracks and improved the cement's mechanical strength and volume stability. Zhang [20] found that incorporation of silicic acid into MOS cement resulted in enhanced mechanical strength, attributed to he formation of magnesium silicate gel with silicate layered structure in the cement. This gel effectively coexisted with the 517 phase, leading to an increase in both the quantity and crystallite size of the 517 phase within the cement.
This research explored the impact of various additives on the mechanical strength and water resistance of cement by incorporating citric acid (CA), tartaric acid (TA), oxalic acid (HAC), and ethylenediamine tetra-acetic acid (EDTA) into MOS cement. The phase compositions and microstructures of the resulting samples were analyzed through a series of testing method, including X-ray diffraction (XRD), Fourier transform infrared spectroscopy (FTIR), X-ray photoelectron spectroscopy (XPS), differential scanning calorimetry (DSC), scanning electron microscopy (SEM), and low field nuclear magnetic resonance (LF-NMR).
Raw materials
Light-burned magnesia (LBM) was the type of magnesia employed in this experiment, which is a yellowish powder. The content of activated magnesium oxide is about 50% as determined by the water method [21], and was produced by Haicheng City, Liaoning Province. 7MgSO4·H2O, CA, TA, HAC, and EDTA were used as analytically pure chemicals (Nanfeng Group, Sinopharm Reagent Co. Ltd.).
Specimen preparation
The constant molar ratio of a-MgO/MgSO4 in the production of MOS cement is 9. Water was used to dissolved 7MgSO4·H2O, forming a 25% mass solution of MgSO4, and on order to create a homogenous mixed solutin, the MgSO4 solution was mixed with the additives (CA, TA, HAC, and EDTA) at a concentration of 2.0% (weight of LBM). After the mixed solution was initially premixed with LBM, a mortar mixer was used to create a MOS cement pastw by slow mixing it for 60 s and the fast mixing it for 120 s. The paste was quickly added into the mold (40 mm × 40 mm × 160 mm) and vibrated and smoothed, marked with a number. The molds were then placed in an incubator for curing (ambient temperature of 20±3℃, standard humidity of 60±10%), and the cement specimen blocks were demolded after 24 h.
Testing method
Compressive strength tests were performed using a universal testing machine at 3 d, 7 d, and 28 d, and the testing procedure followed GB/T 17671-2021. Following curing to the specified age, the MOS cement specimens were tested for compressive strength and documented. After a 28 d curing period for the same proportion of MOS cement specimens, the specimens were immersed in water for 7 d after surface cleaning at a temperature of 20±3 °C and a humidity of 60±10%.
The specimens compressive strength was measured and documented. The ratio of the two compressive strengths, known as the softening factor Rf and computed as follows, is utilized to test the water resistance of MOS cement samples.
where Rf is the softening coefficient, R(w, n) is the cement specimen compressive strength after being submerged in water for n d (MPa), and R(A, 28) is the cement specimen compressive strength after being cured in air for 28 d (MPa).
The cement crystal composition was examined using a Bruker D8 ADVANCE X-ray diffractometer (XRD), scanning from 10° to 70° (2θ) at a pace of 10°/min. Following its combination with spectroscopically pure potassium bromide, grinding, and compression, the sample powder was across using a TENSOR Ⅱ infraed spectrometer with a wave number range of 500 to 4000 cm-1. For X-ray photoelectron spectroscopy (XPS), the Escalab 250Xi model, utilizing Al Kα radiation at hv=1486.6 eV, was employed. Differential thermal analysis was performed under an air atmosphere with a heating rate of 10 °C/min and a flow rate also set at 10 °C/min, covering a temperature span from 22 °C to 1000 °C. To ascertain the impact of admixtures on the hydration rate of MOS cement at various stages, the heat of hydration was measured using isothermal conduction calorimetry with a CHH-CAL-8000 model instrument at a temperature of 20±1 °C. The microstructure at the fracture was characterized by SUPRA55 scanning electron microscope after spraying gold on the fracture of the samples to be tested. Low-field nuclear magnetic resonance (NMR) experiments were conducted utilizing a PQ001 LF-NMR analyzer. The setup maintained a temperature of 32±0.02 °C, an intensity of 0.42T, and a frequency of 18 MHz. MIP was tested using an AutoPore V 9600 weighted automated mercuric piezometer, with the contact angle determined to be 130°, and the applied pressure ranging from 0.10-61000 psia, to observe the modified pore structure of MOS cement.
Effect of additives on the compressive strength of MOS cement
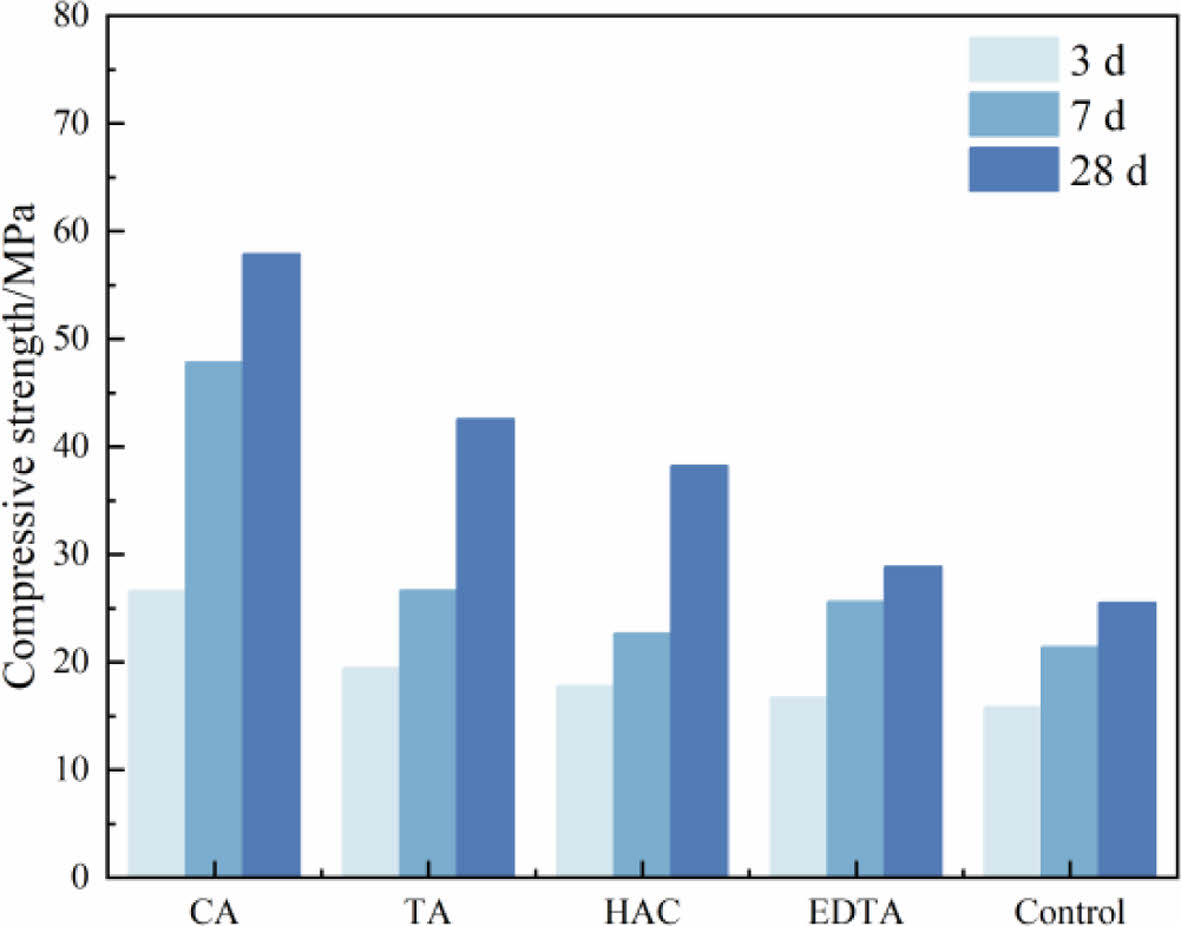
Fig. 1 shows the compressive strength of MOS cement specimens doped with different additives at 3 d, 7 d, and 28 d. At all ages, the MOS cement sample following the addition has a greater compressive strength than the control cement sample. Among them, the greatest strength improvement was obtained with CA, which was 68%, 122%, and 127% greater than that of the control cement specimens; 23%, 26%, and 67% greater than that of the control cement sample when TA was added; 12%, 6%, and 50% greater than that of the control cement sample when HAC was added; 6%, 20%, and 13% greater than that of the control cement sample when EDTA was added. The addition of CA and TA significantly increased the strength of MOS cement, whilst HAC and EDTA were less effective but still had higher strengths than the control sample.
Effect of additives on the water resistance of MOS cement
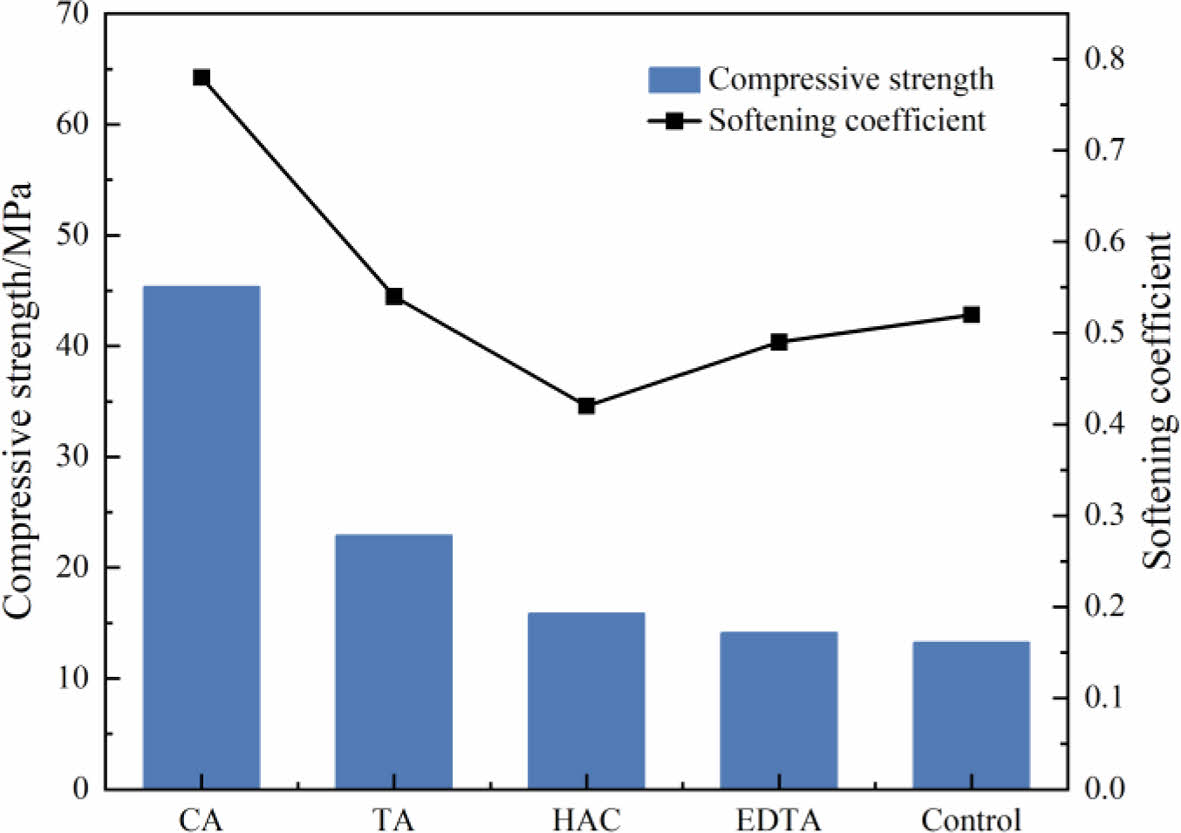
Fig. 2 shows the compressive strength and softening coefficient of MOS cement doped with additives after 7 d of water immersion. After 7 d of immersion, the MOS cement specimens compressive strengths dropped to 45.36, 22.92, 15.86, 14.11, and 13.24 MPa, respectively. The cements water resistance was further enhanced by the addition of additives. The control cement specimens containing four distinct additives had softening coefficients of 0.78, 0.54, 0.42, 0.49, 0.49 and 0.52 in that order. After 7 d of immersion, the specimens with CA added had a higher softening coefficient (0.78) than the control and specimens with other additives,they also performed better in term of water resistance.
Effect of additives on the heat hydration of MOS cement
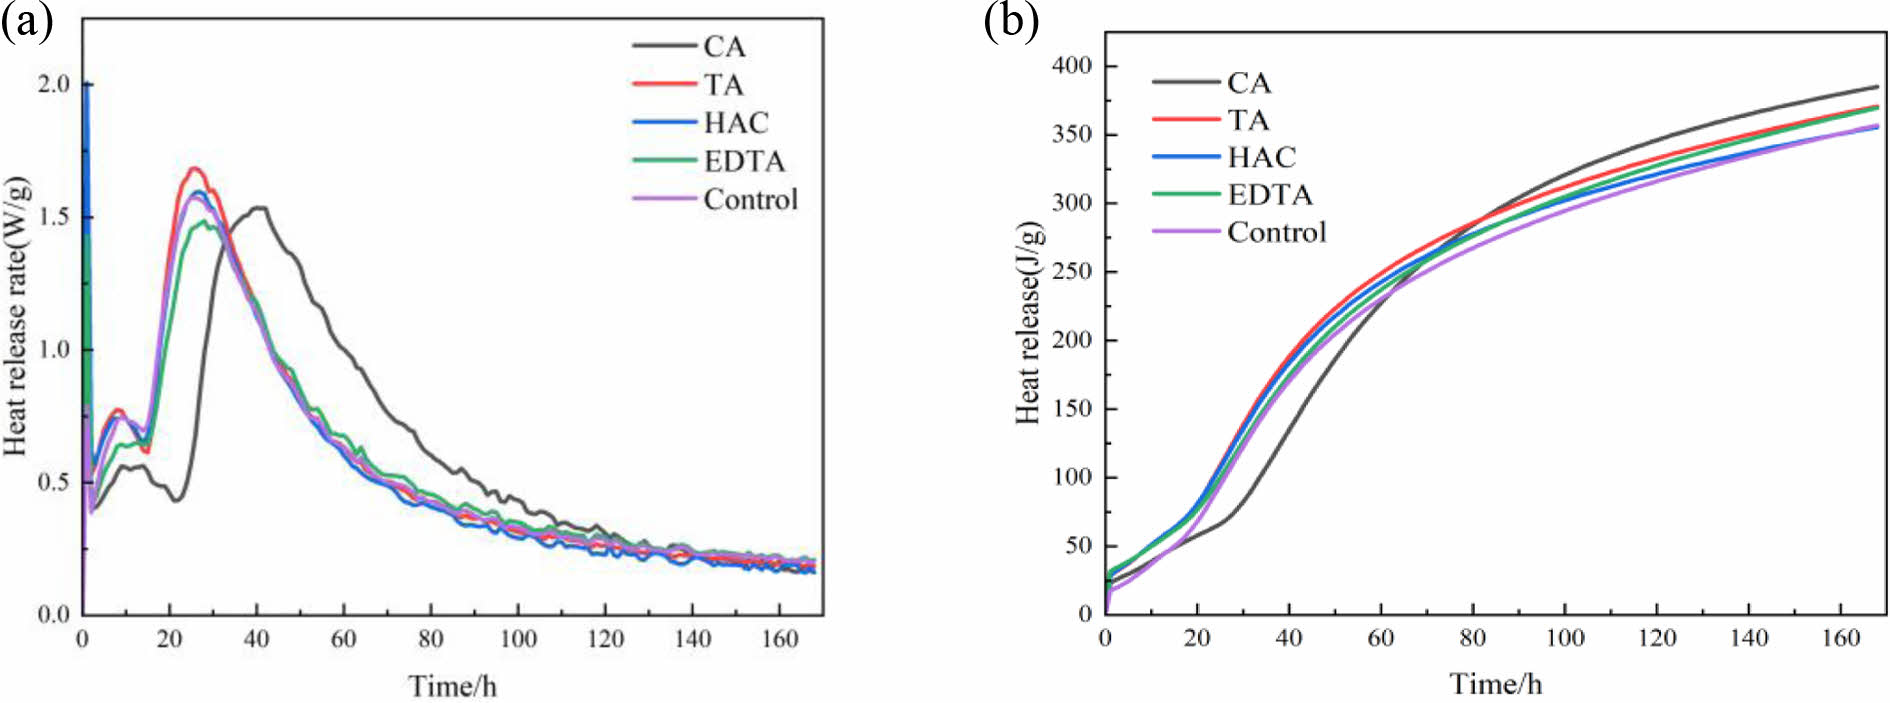
Fig. 3 shows the (a) heat-release rate at different times and (b) cumulative heat release for MOS cement with different additives. MOS cement hydration process can be separated down into five stages: a preinduction period (stage PP), an induction period (stage IP), an acceleration period (stage AP), a deceleration period (stage DP), and a stable period (stage SP) [22]. From Fig. 3(a), it can be seen that it takes 24.8 h for the control sample to reach the maximum put-in rate and 42 h, 26 h, 27 h and 28 h for the cement samples doped with CA, TA, HAC, and EDTA, respectively, which indicates that doping with additives reduces the rate of hydration, and lengthens the time needed to achieve the maximum exothermic rate. The induction time of the control sample was 13.6 h, and the induction times of the cement samples mixed with CA, TA, HAC, and EDTA were 21.3 h, 14.7 h, 14.9 h, and 13.9 h, respectively, which indicated that the additives had a retardation effect on MOS cement [23]. Deprotonated citrate ligands sticking to the surface of MgO caused the most noticeable retardation impact of CA on MOS cement. This prevented the hydration layer [Mg(H2O)xOH]+ from reacting with OH- and impeded the sustained hydration of MgO [24]. Fig. 3(b) shows that the total exothermic amount of cement samples doped with CA was lower than that of other cement samples in the prehydration period, the total exothermic amount exceeded that of other cement samples when hydrated for up to 84 h, and the total exothermic amount of hydration was 384.94 J/g when hydrated for up to 168 h, which exceeded the control group by 28 J/g, attributed to thecontinuous generation of the 517 phase [25].
Effect of additives on the phase composition of MOS cement
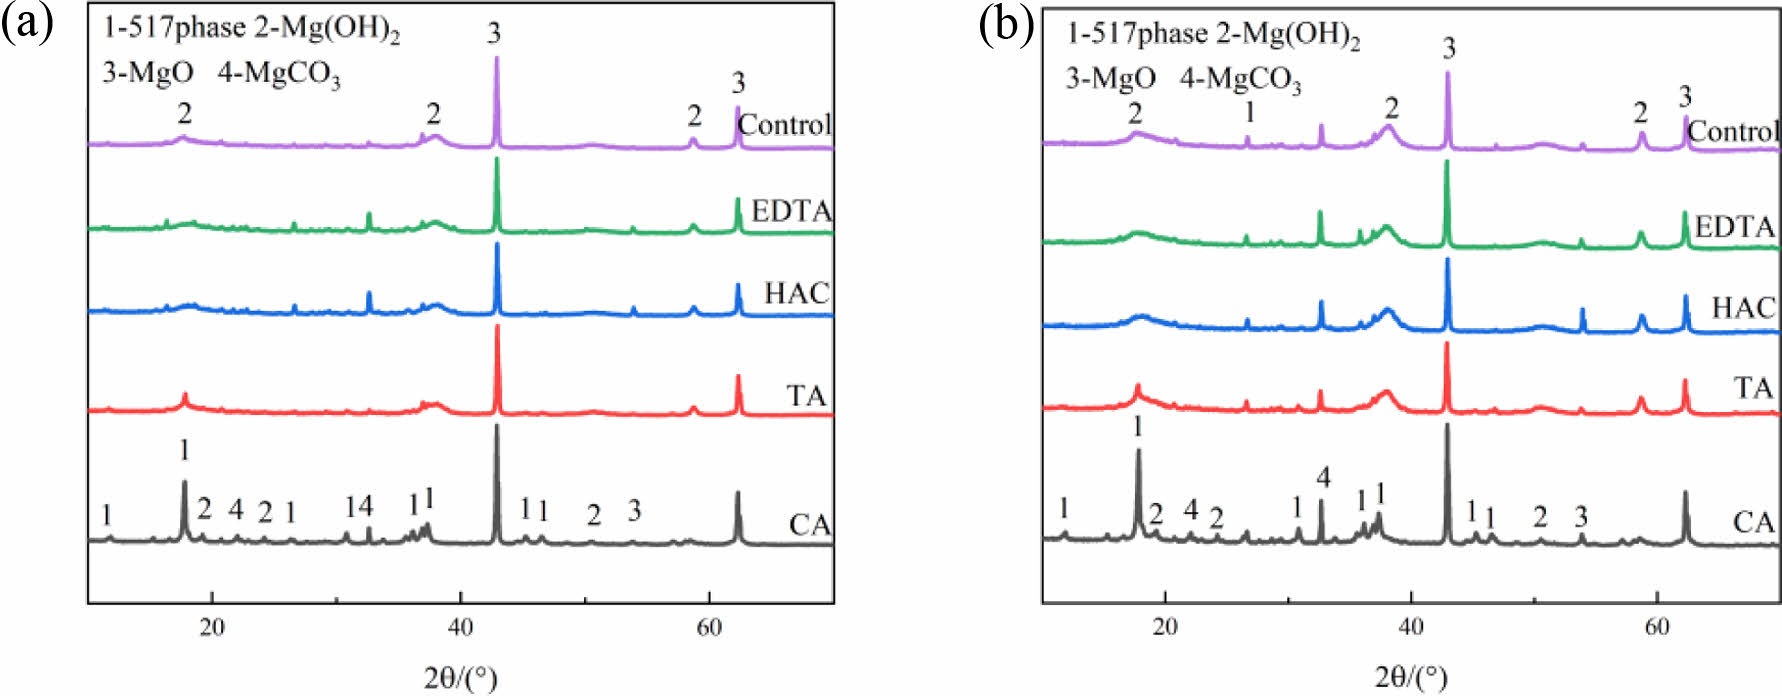
Fig. 4 shows the XRD pattern of MOS cement with the additive at 7 d and 28 d. The hydration products of MOS cement with various additives showed distinct compositions. In the control sample, the hydration products consisted of Mg(OH)2, MgCO3, and unreacted MgO. In contrast, the hydration products with additives had the 517 phase, and there was a noticeable reduction in the diffraction peak of Mg(OH)2. From Fig. 4(b), after 28 d of maintenance, the 517 phase was visible in the control sample; however, its peak strength was lower than that of the additive-doped sample. The 517 phase appeared in all MOS cements after incorporation of the four additives, indicating that the additives can promote the generation of the 517 phase [24]. Due to their elevated concentration of the 517 phase, the cement samples blended with CA exhibited superior mechanical strength and water resistance compared to the other samples.
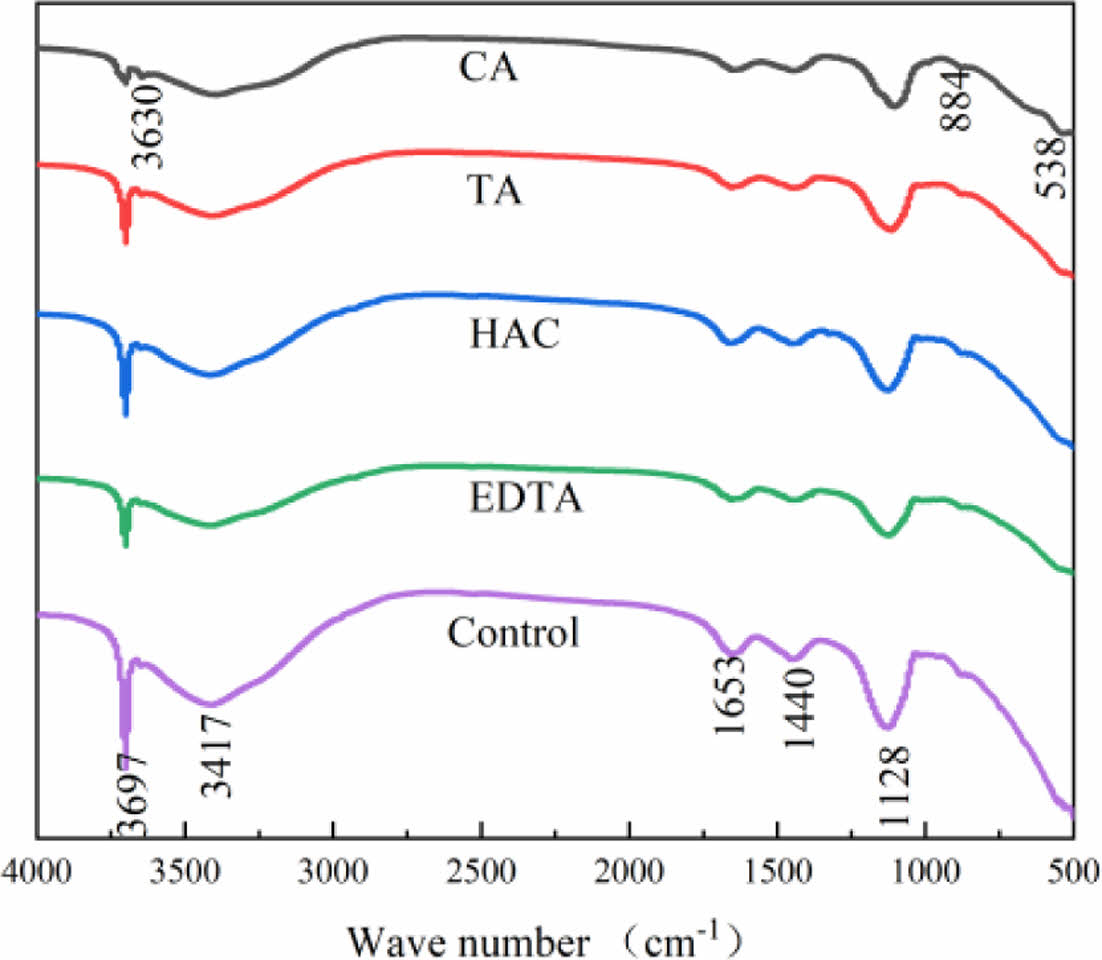
Fig. 5 shows the FTIR pattern of MOS cement with the additive at 28 d. The wide band observed at 3417 cm-1, along with the subdued band at 1653 cm-1, can be attributed to the bending and asymmetric stretching vibrations of the HO-H bonds in the crystalline water. The sharp band at 3697 cm-1 corresponds to the asymmetric stretching vibration of Mg-OH. Furthermore, the broad bands at 1440 cm-1 reflect the stretching vibrations of CO2-O, while the peaks at 538 cm-1 and 1128 cm-1 indicate the bending and stretching vibrations of SO3-O in sulfate. demonstrate the presence of MgCO3 and MgSO4 within the MOS cement [27,28]. The combined vibrations of magnesium and water molecules are what cause the absorption band at 884 cm-1 [27]. Plots reveal an extra band at 3630 cm-1 following CA doping, and the absorption band there is associated with the bending vibration of Mg-OH in the 517 phase [29]. The O-H stretching vibration changed between 3000~3600 cm-1, suggesting that the additive presence prevented Mg(OH)2 from forming [30,31]. This is consistent with the XRD findings.
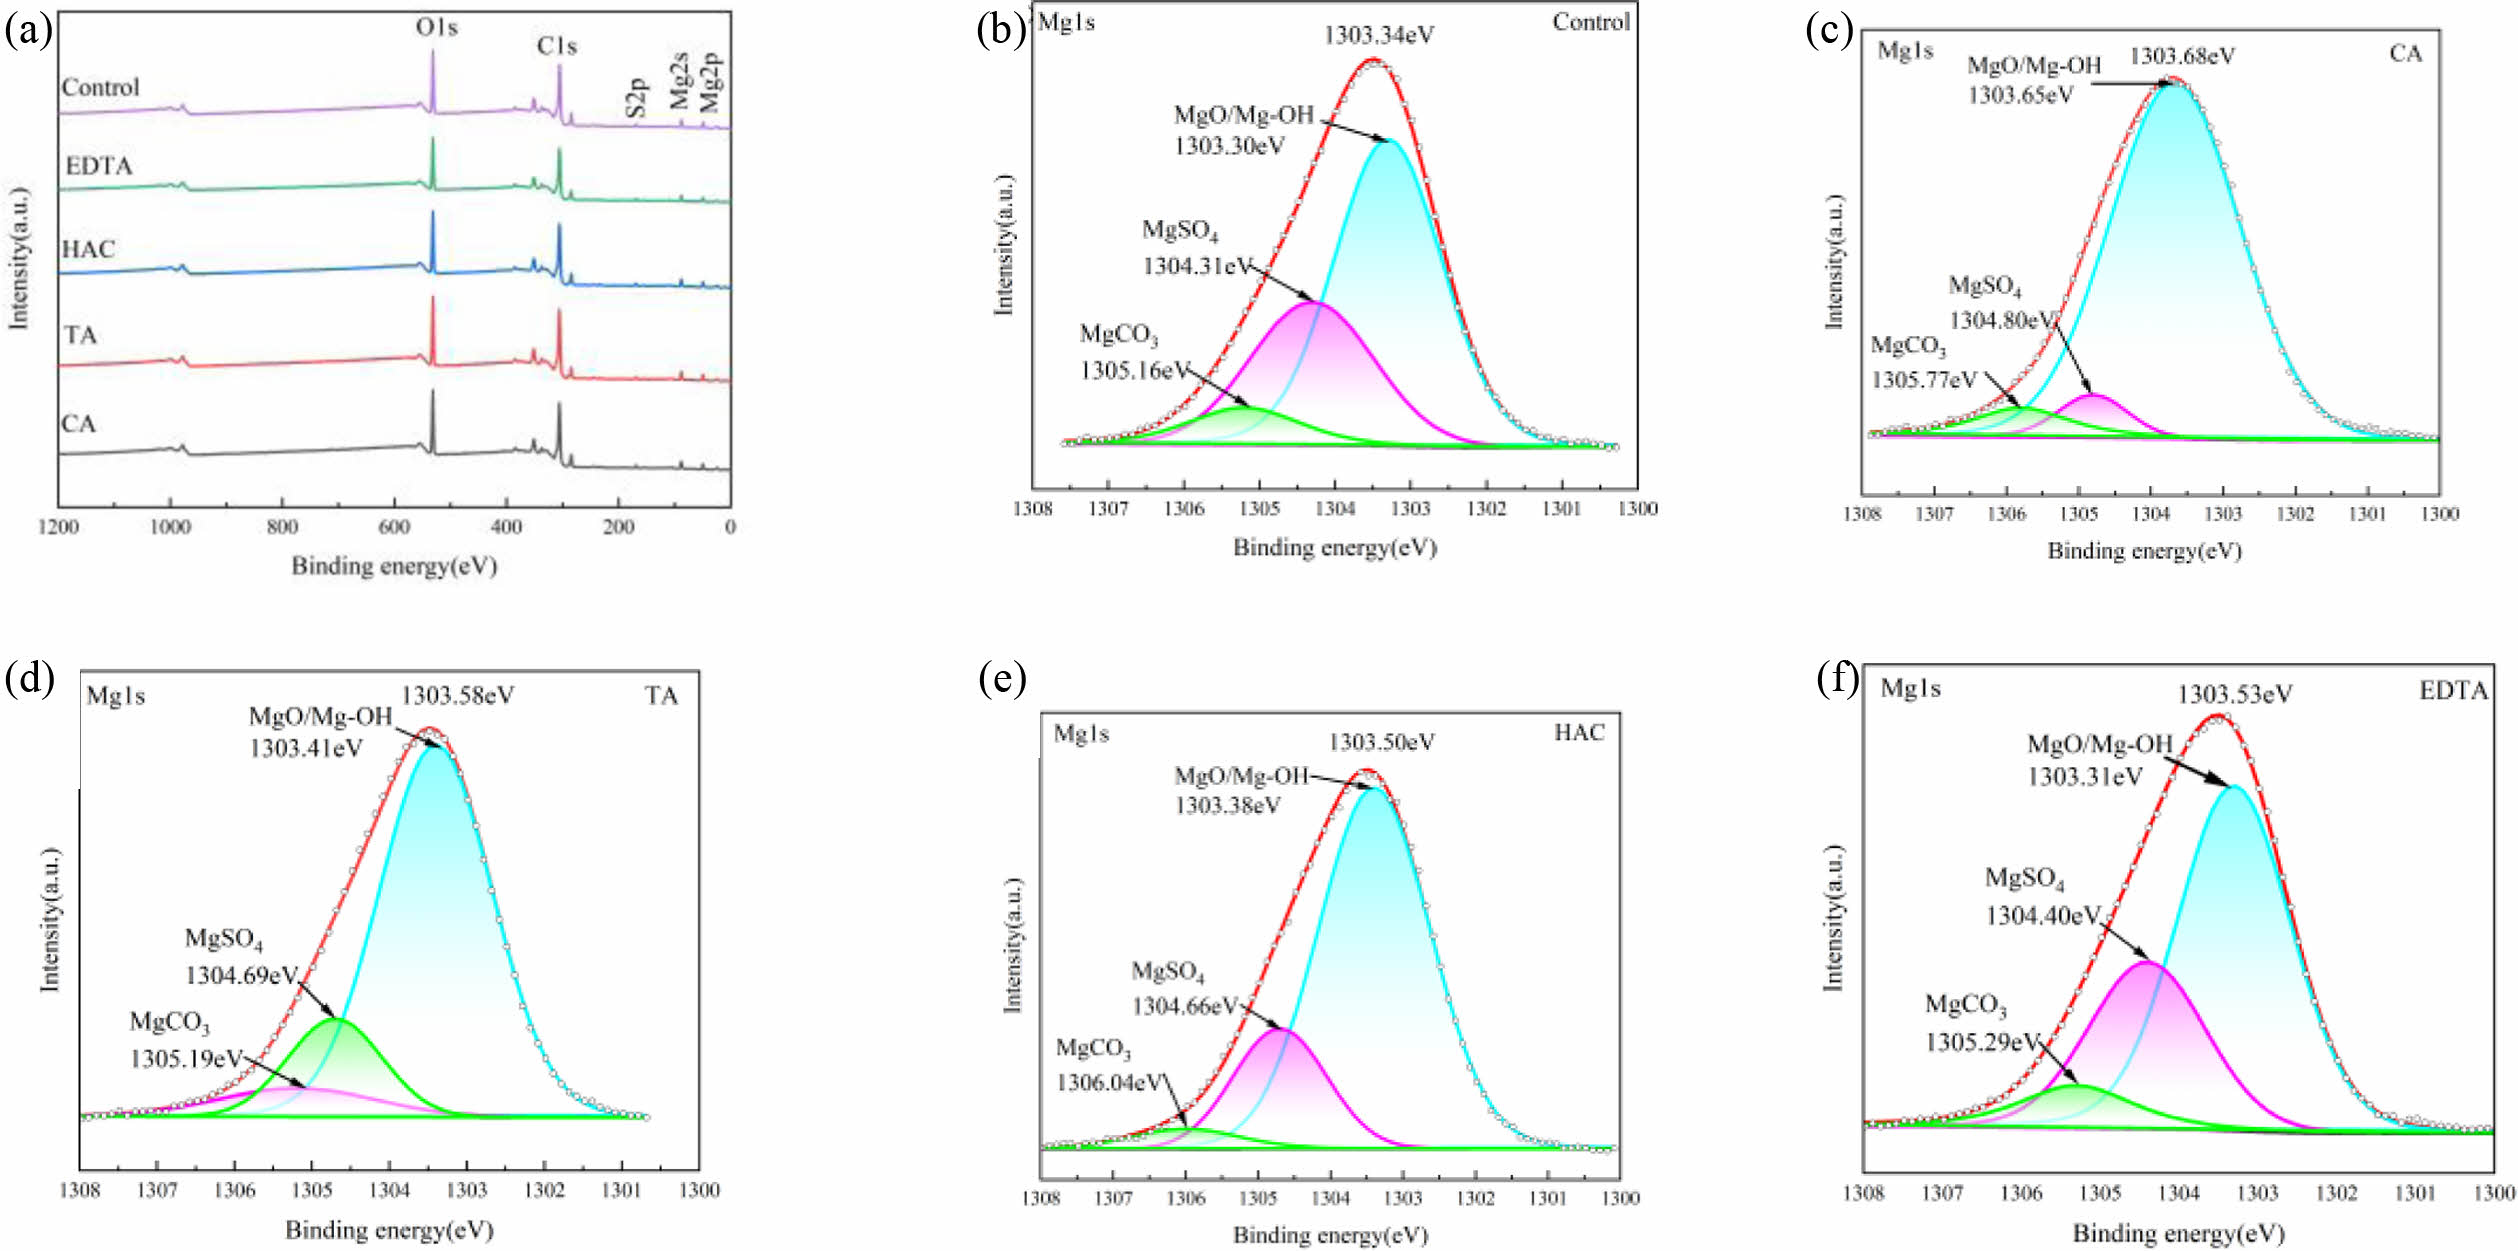
Fig. 6 shows the XPS pattern of MOS cement with the additive at 28 d. As illustrated in Fig. 6(a), the cement samples exhibit notable peaks at approximately 531 eV, 306 eV, 168 eV, 89 eV, and 49 eV. These correspond to the O 1s, C 1s, S 2p, Mg 2s, and Mg 2p, respectively [27]. Analysis of the images indicates that the different types of additives lead to distinct binding energies for the Mg 1s peaks. After the additives were modified, the binding energy for the Mg 1s peak increased from 1303.34 eV in the control sample to 1303.88 eV, 1303.58 eV, 1303.53 eV, and 1303.50 eV for the various modified samples. This change in the Mg 1s binding energy implies that reactions involving magnesium are likely occurring on the surface of the whiskers [32]. The additive chelated Mg2+ and combined with Mg2+ to generate polynuclear complexes, promoting the formation of the 517 phase [31]. As shown in Fig. 6(b), the control sample's Mg 1s band was fitted into three subbands, which correspond to MgO/Mg-OH, MgSO4, and MgCO3 with binding energies of 1303.30 eV, 1304.31 eV, and 1305.16 eV. According to Fig. 6(c-f), the three subbands of the fitted Mg 1s orbitals of the cement samples doped with CA are 1303.65 eV, 1304.80 eV, and 1305.77 eV; the three subbands of the Mg 1s orbitals doped with TA are 1303.41 eV, 1304.69 eV, and 1305.19 eV; the three subbands of the Mg 1s orbitals doped with HAC are 1303.31 eV, 1304.40 eV, and 1305.29 eV; and the three subbands of the Mg 1s orbitals doped with EDTA are 1303.38 eV, 1304.66 eV, and 1306.04 eV. The number of Mg 1s subbands increased to different degrees after the addition of additives, indicating that different types of additives chelate different amounts of Mg2+.
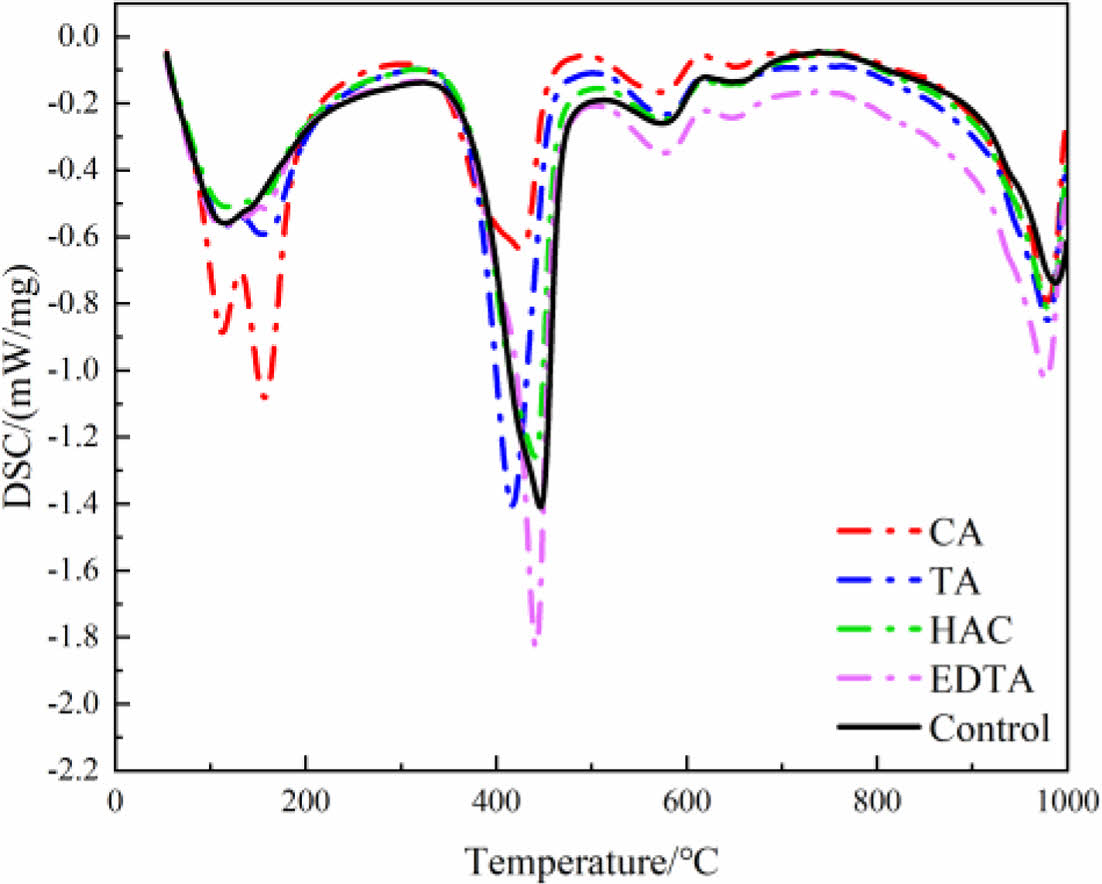
Fig. 7 shows the DSC pattern of MOS cement with additive at 28 d. The endothermic effect was carried out in four steps, and the samples underwent a dehydration reaction at 81~250 °C, which was due to the dehydration of the 517 phase of the cement sample [19, 33], and the wave peaks of the cement samples doped with CA had the largest amplitude, which indicated that the largest amount of 517 phase was generated by doping with CA. The second endothermic event took place at 300~450 °C, primarily associated with the generation of MgSO4 and MgO, resulting from the dehydration of 3Mg(OH)2·MgSO4 and 5Mg(OH)2·MgSO4 [34]. The decarbonization of MgCO3, which releases CO2, is the cause of the third endothermic peak, which appears around 500-600 °C [35]. The last endothermic effect occurs at 900-1000 °C, which is due to the production of SO3 from the desulfurization reaction [19].
Effect of additives on the microstructure of MOS cement
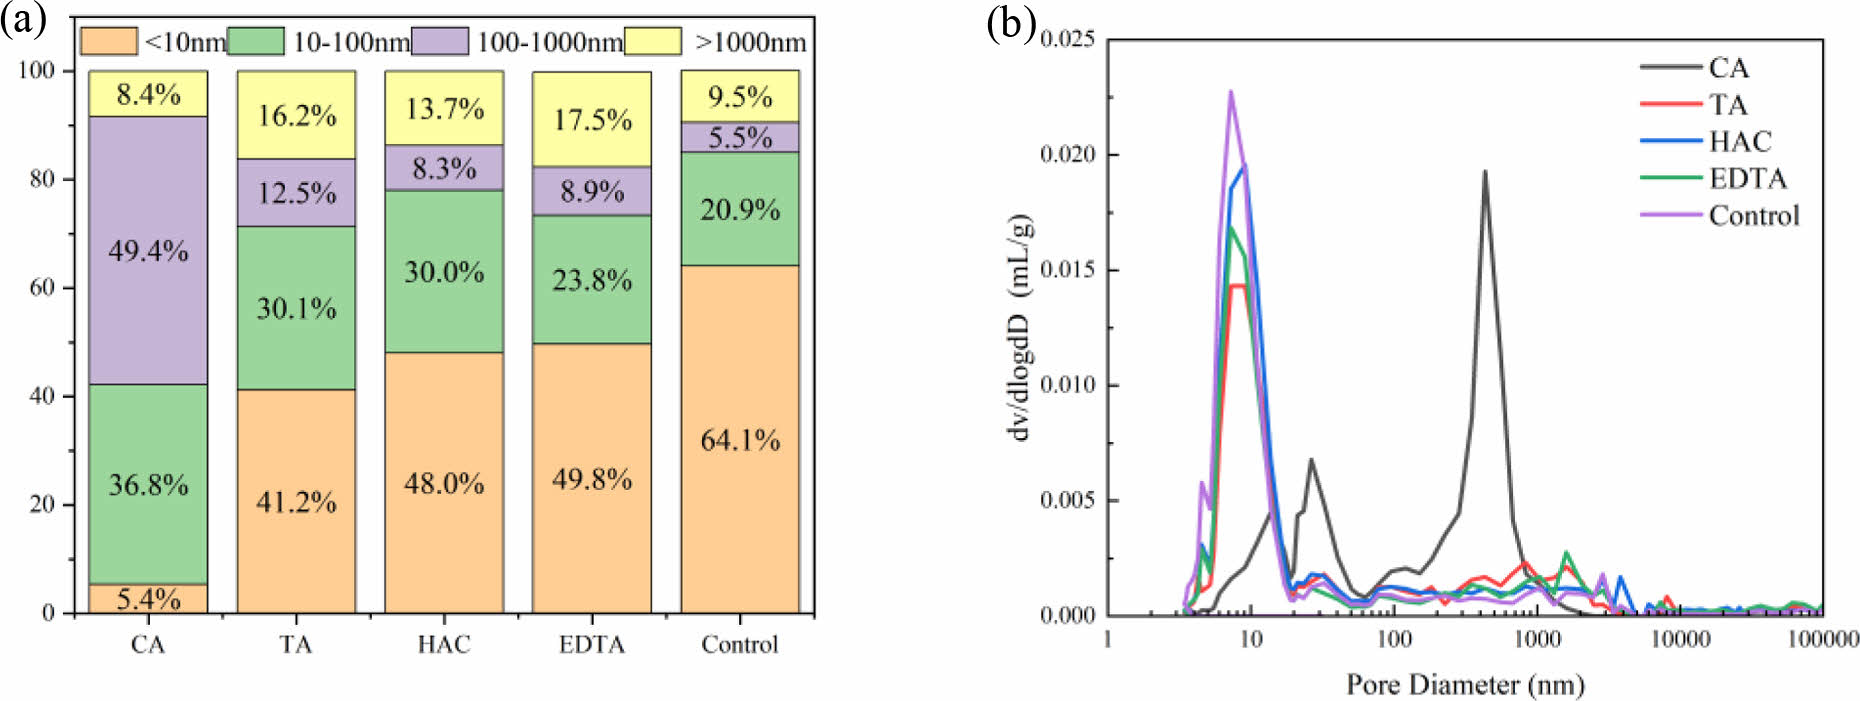
Fig. 8 shows the MIP test results of MOS cement with additive at 7 d. The MOS cement pores were divided into four sections based on the pore size distribution characteristics: gel pores (<10 nm), capillary pores (10-100 nm), transition pores (100-1000 nm), and air pores or cracks (<1000 nm) [36]. As illustrated in Fig. 8(a), the control sample had volumetric proportions of capillary pores and gel pores of 20.9% and 64.1%, respectively; the percentage of capillary pores increased by 76.1%, 44.0%, 43.5%, and 13.9%, while the percentage of gel pores decreased by 91.6%, 35.7%, 25.1%, and 22.3%, respectively, due to the doping of CA, TA, HAC, and EDTA. The microstructure of the hydration products created during cement hydration is intimately linked to the presence of gel holes with a diameter of less than 10 nm. [36], and the capillary pores of 10-100 nm are arbitrarily spaced between large cement hydrates [37]. Following the addition of the additive, the number of gel holes increased, indicating that the 517 phase had crystallized well [23], the cement samples that incorporated CA exhibited the greatest compressive strength while containing the lowest amount of EDTA. This rise in capillary volume percentage can be attributed to the inhibition of Mg(OH)2 and the formation of an amorphous phase by additive doping [24]. Compared with those of the other samples, the pore content between 100 and 1000 nm of the cement samples doped with CA increased, and the pores between 100 and 1000 nm represent the volume that was not filled by the hydration products of the cement [38], which made room for the cement 517 phase to develop.
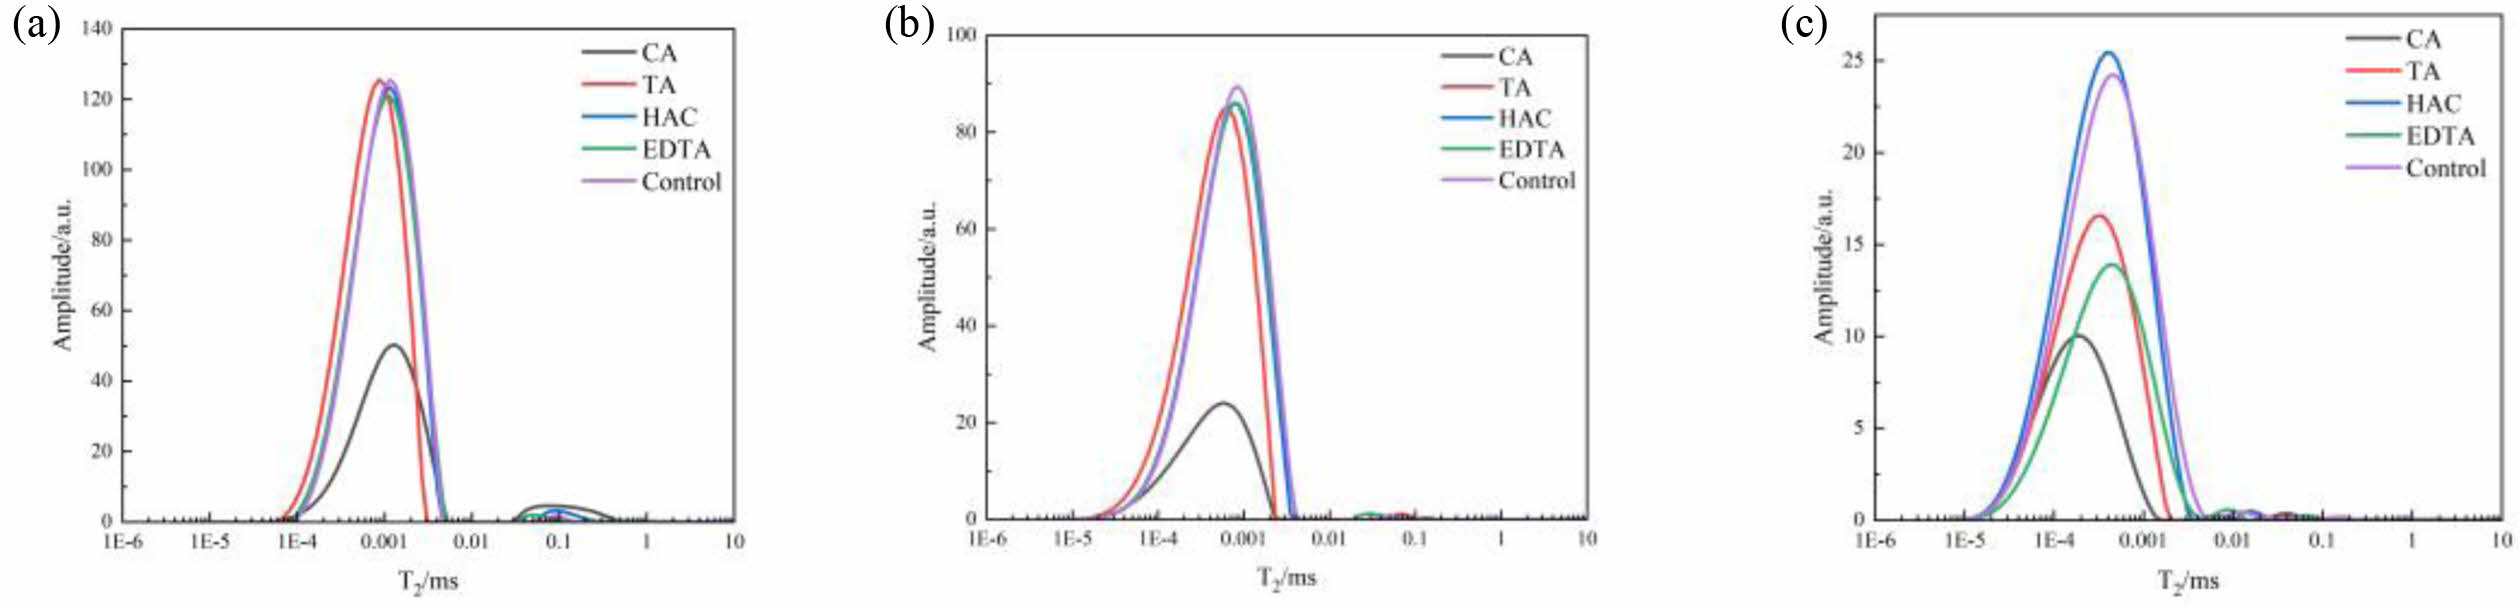
The lateral relaxation time T2 of water molecules on the pore surface and the pore radius r (nm) have the following connection, per Zhao's [39] research :

where: C is the conversion factor, taken as 24 nm/ms [39].
Gel holes, capillary holes, transition holes, air holes, or fractures have transverse relaxation periods of <0.4 ms, 0.4-4 ms, 4-40 ms, and >40 ms, respectively, according to Eq. (2). The LF-NMR test results for MOS cement with additives at 3 d, 7 d, and 28 d are displayed in Fig. 9. Gel pores and capillary pores are the two primary pore types found in cement pastes. As illustrated in Fig. 9, the T2 mapping curves for MOS cement samples, which were blended with different additives and subjected to various curing conditions had a similar morphology, with a larger amplitude of the first peak and a gradual decrease in amplitude [40]. At 3 d of curing, the first peak of the cement sample combined with CA shifts to the right relative to the other samples, which was due to the high water content per unit volume, which formed a dilute structure and a basic skeleton with a large pore size but provided space for the growth of the 517 phase, whose compressive strength increased [39, 41]. As the curing duration extends, the first peak shifts leftward, and its area progressively diminishes, suggesting a reduction in porosity over time. After 28 d of curing, the initial peak of the cement samples enhanced with CA, TA, HAC, and EDTA has moved left in comparison to the control sample. Moreover, the area of the first peak for the samples containing CA, TA, and EDTA is less pronounced than that of the other cement samples. This observation implies that the inclusion of these additives enhances the crystallinity of the 517 phase, which in turn boosts both the mechanical strength and water resistance of the MOS cement [23].
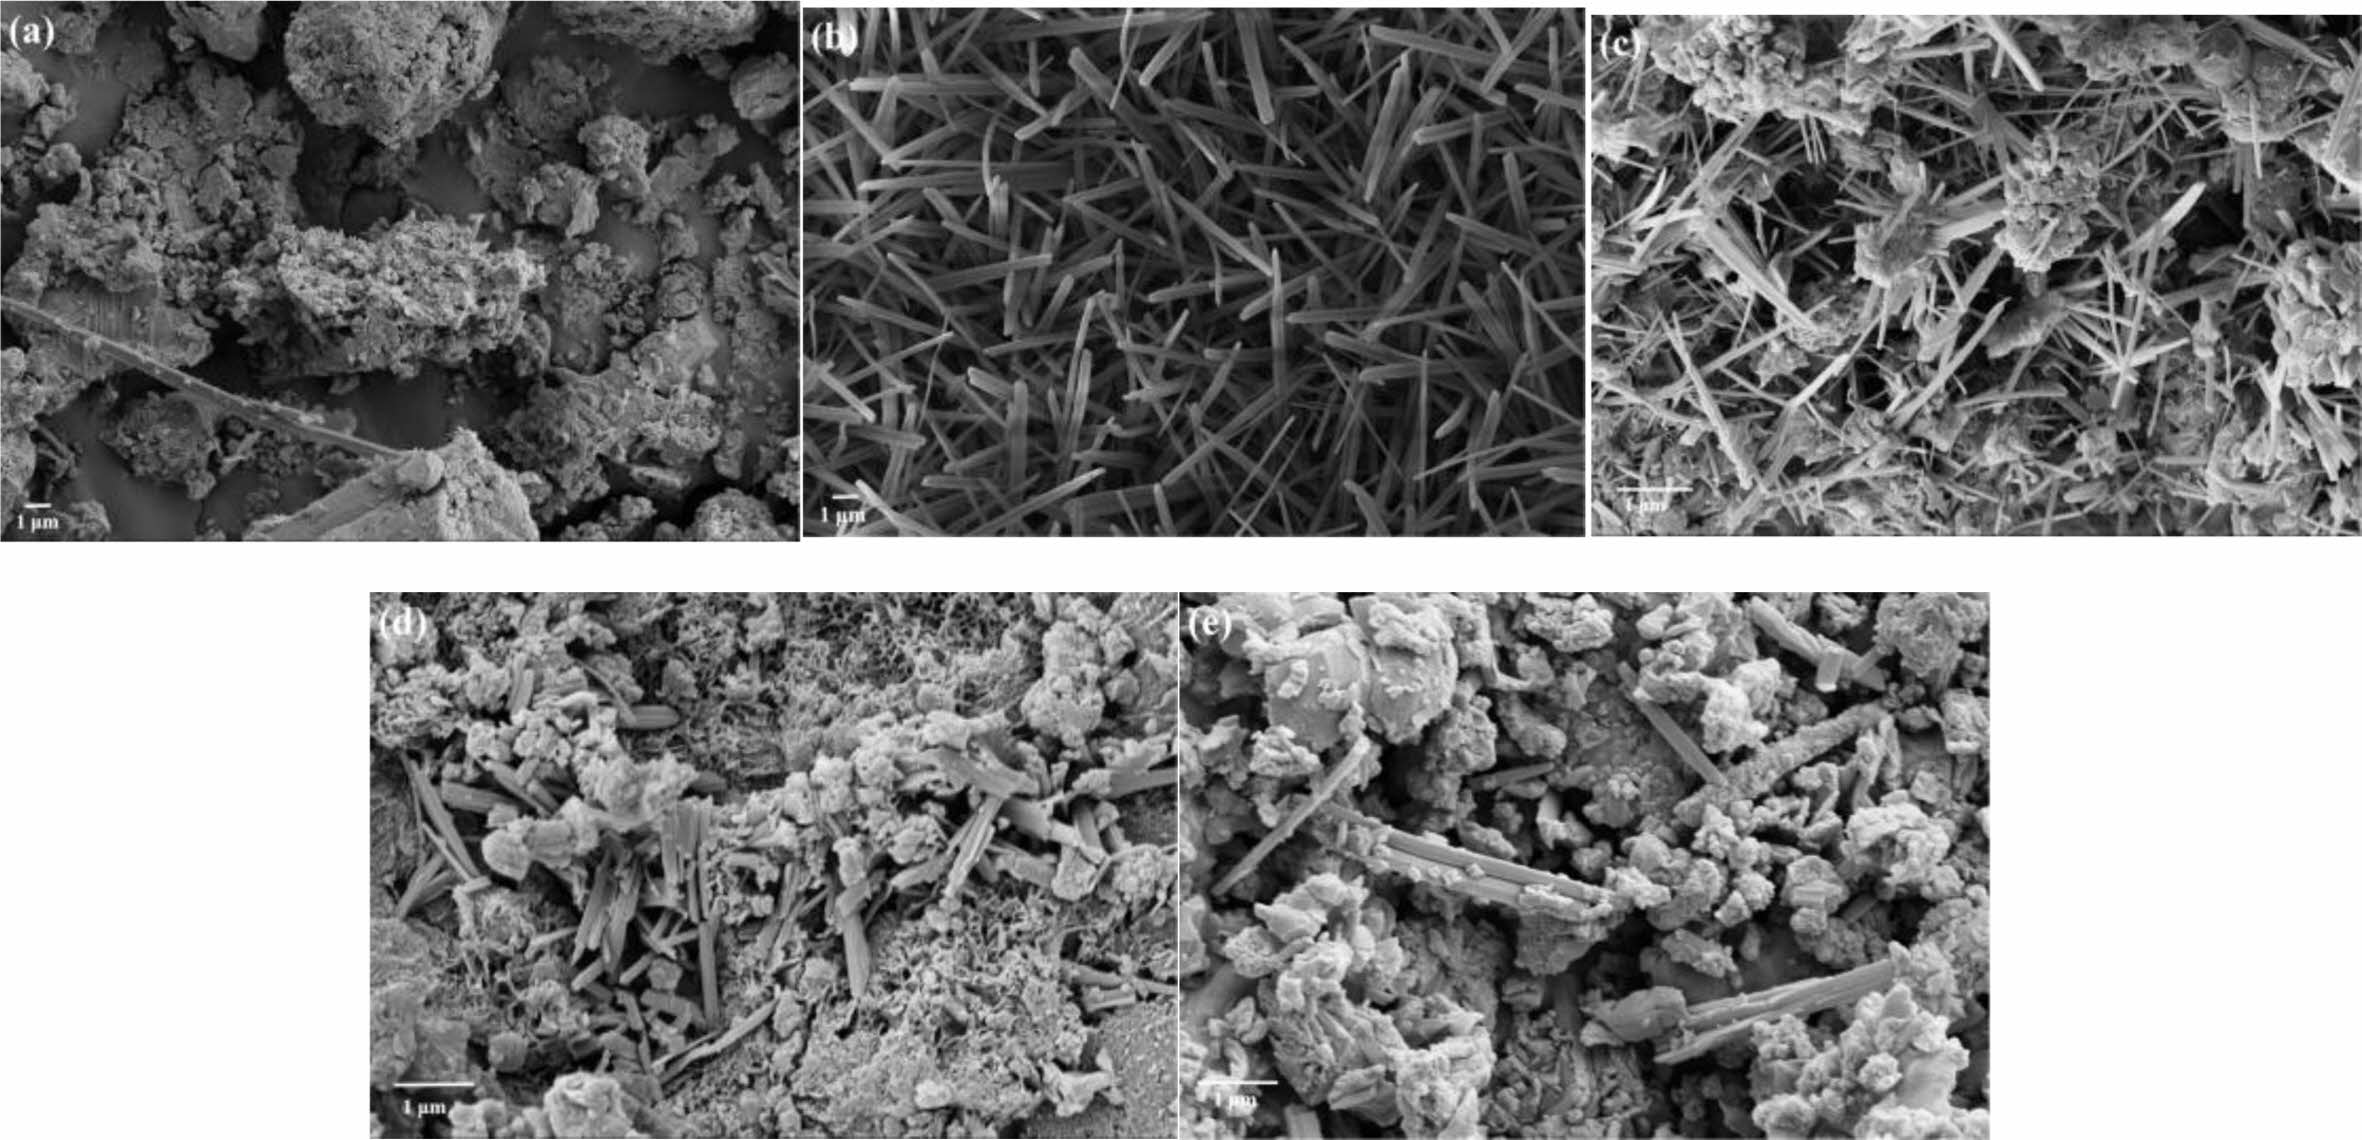
Fig. 10 shows the SEM pattern of MOS cement with the additive at 28 d. Fig. 10(a) demonstrates that the control samples had a higher concentration of loose and porous lamellar Mg(OH)2, which reduced their mechanical strength. [6]. As illustrated in Figures 10(b)-(e), it's clear that the morphology of the cement samples underwent considerable changes following the addition of various additives, all of which had different contents of needle-like 517 phase crystals [17, 42]. The cement samples doped with CA and TA contained many needle-like crystals 517 intertwined with each other, forming a crystalline network structure that fills the pores or cracks and makes the cement structure dense, and fewer needle-like crystals were observed in doped HAC and EDTA, which were not tightly bound and structurally dense enough [43, 44]. Therefore, the cement samples mixed with CA and TA were better modified and had higher compressive strengths, while those mixed with HAC and EDTA were poorly modified and had lower strengths.
|
Fig. 1 Compressive strength of MOS cements without (control) and with different additives (CA, TA, HAC, and EDTA). |
|
Fig. 2 Compressive strength and softening coefficients of MOS cements without (control) different additives (CA, TA, HAC, and EDTA) after immersion in water for 7 d. |
|
Fig. 3 (a) Heat-release rate at different times and (b) cumulative heat release for MOS cements without (control) and with different additives (CA, TA, HAC, and EDTA). |
|
Fig. 4 XRD patterns of MOS cements without (control) and with different additives (CA, TA, HAC, and EDTA) cured for (a) 7 d and (b) 28 d. |
|
Fig. 5 FTIR spectra of MOS cements without (control) and with different additives (CA, TA, HAC, and EDTA) cured for 28 d. |
|
Fig. 6 (a) XPS spectra (b-f) XPS analysis of MOS cement Mg 1s without (control) and with different additives (CA, TA, HAC, and EDTA) cured for 28 d. |
|
Fig. 7 DSC of MOS cements without (control) and with different additives (CA, TA, HAC, and EDTA) cured for 28 d. |
|
Fig. 8 (a) Statstics of pore distribution (b) Cumulative intruded pore volume vs pore diameter of MOS cements without (control) and with different additives (CA, TA, HAC,and EDTA) cured for 7 d. |
|
Fig. 9 LF-NMR spectra of MOS cements without (control) and with different additives (CA, TA, HAC,and EDTA) cured for (a) 3 d (b) 7 d and (c) 28 d. |
|
Fig. 10 SEM images of MOS cements without (a) the control and with different additives (b) CA, (c) TA, (d) HAC,and (e) EDTA cured for 28 d. |
The following conclusions can be made in light of the experimental data mentioned above:
(1) A comparison of the effects of four additives blended into MOS cement—CA, TA, HAC, and EDTA—on compressive strength showed that CA significantly increased compressive strength, followed by TA, HAC, and EDTA. The MOS cement specimens treated with CA had a softening coefficient of 0.78 and improved water resistance.
(2) The primary element influencing MOS cement's strength is the 517 phase. The incorporation of additives can inhibit the hydration layer [Mg(H2O)xOH]+ from interacting with OH- ions, thereby preventing the formation of Mg(OH)2. This process promote the development of the acicular 517 phase, which contributes to the creation of a crystalline network structure, resulting in improved mechanical strength of the cement、enhanced density of the cement structure the bonding force.
(3) The different types of additives contained have different amounts of chelated Mg2+, so the amount of 517 phase crystals generated differed. The chelating power of the four additives decreased in the order CA>TA>HAC>EDTA, and the number of crystals generated was greatest in the cement sample mixed with CA. Additionally, the chelating power decreased in the cement sample mixed EDTA, so the cement sample containing CA had the greatest mechanical strength.
- 1. J.J. Beaudoin and V.S. Ramachandran, J. Cement. Concrete. Res. 8[1] (1978) 103-112.
-

- 2. Y. Li, H. F. Yu, L. Zheng, J. Wen, C.Y. Wu, and Y.S. Tan, J. Constr. Build. Mater. 38 (2013) 1-7.
-
- 3. K.V.B. Krishnan, K. Nirmalkumar, V. Sampathkumar, and P.C. Murugan, J. Constr. Build. Mater. 24[4] (2023) 714-722.
- 4. Y.S. Zhao, X.T. Yue, Y.H. Tang, X.L. An, and X.P. Shang, J. Ceram. Process. Res. 25[5] (2024) 862-870.
-
- 5. K. Yuvaraj, M. Sakthival, M. Dhivakar, T. Pradeep, M. Veerapathran, and S. Gowtham, J. Ceram. Process. Res. 25[2] (2024) 254-260.
-
- 6. T. Demediuk and W.F. Cole, J. Aust. J. Chem. 10[3] (1957) 287-294.
-
- 7. J.J. Beaudoin and V.S. Ramachandran, J. Cement. Concrete. Res. 8[1] (1978) 103-112.
-
- 8. T. Demediuk, J. Nature 170[4332] (1952) 799-799.
-
- 9. C. Sailaja, K.T. Thilagham, K.T. Anand, P. Ganeshan, S. Kannan, A.H. Seikh, and A. Ghosh, J. Ceram. Process. Res. 24[4] (2023) 617-625.
-
- 10. S. Janani, G.S. Rampradheep, P. Kulanthaivel, and P.C. Murugan, J. Ceram. Process. Res. 23[6] (2022) 884-891.
-
- 11. L. Qin, X. Gao, and T. Chen, J. Clean. Prod. 191 (2018) 220-232.
-
- 12. R. Sivabalan, K.R. Thangadurai, and K. Lenin, J. Ceram. Process. Res. 22[6] (2021) 605-614.
-
- 13. M. Kim and Y. Kim, J. Ceram. Process. Res. 22[1] (2021) 39-47.
-
- 14. K. Kahle, J. Silikatechnik. 23[5] (1972) 148-151.
- 15. L. Urwongse and C.A. Sorrell, J. Am. Ceram. Soc. 63[9-10] (1980) 523-526.
-
- 16. T. Runčevski, C.Y. Wu, H.F. Yu, B. Yang, and R.E. Dinnebier, J. Am. Ceram. Soc. 96[11] (2013) 3609- 3616.
-
- 17. C.Y. Wu, H.F. Yu, H.F. Zhang, J.M. Dong, J. Wen, and T.S. Tan, J. Mater. Struct. 48 (2015) 907-917.
-
- 18. T. Guo, H.F. Wang, H.J. Yang, X.S. Cai, Q. Ma, and S.M. Yang, J. Constr. Build. Mater. 150 (2017) 844-850.
-
- 19. L. Qin, X.J. Gao, W.G. Li, and H. Ye, J. Mater. Civil. Eng. 30[9] (2018) 04018209.
-
- 20. T.T. Zhang, J.B. Zhang, J. Chang, W.L. Bi, C. Cheeseman, and X.Y. Chen, J. Compos. Part B: Eng. 268 (2024) 111081.
-
- 21. J.M. Dong, H.F. Yu, and L.M. Zhang, J. Salt. Lake. Res. 18[1] (2010) 4.
- 22. H.H. Du, J.J. Li, W. Ni, C.C. Hou, and W.C. Liu, J. Mater. Res. Technol. 17 (2022) 1211-1220.
-
- 23. C.Y. Wu, W.H. Chen, H.F. Zhang, H.F. Yu, W.Y. Zhang, N.S. Jiang, and L.X. Liu, J. Constr. Bulid. Mater. 144 (2017) 516-524.
-
- 24. N. Wang, H.F. Yu, W.L. Bi, Y.S. Tan, N. Zhang, C.Y. Wu, H.Y. Ma, and S. Hua, J. Constr. Bulid. Mater. 169 (2018) 697-704.
-
- 25. C.Y. Wu, K.J. Luo, H.F. Zhang, and H.F. Yu, J. Adv. Concr. Technol. 17[10] (2019) 603-615.
-
- 26. X.X. Yan, D.L. Xu, and D.F. Xue, J. Acta Mater. 55[17] (2007) 5747-5757.
-
- 27. L. Dang, X.Y. Nai, D.H. Zhu, Y.W. Jing, X. Liu, Y.P. Dong, and W. Li, J. Appl. Surf. Sci. 30 (2014) 325-331.
-
- 28. R.E. Dinnebier, M. Pannach, D. Freyer, and J.Z. Anorg, Allg. Chem. 639[10] (2013) 1827-1833.
-
- 29. G. Anbalagan, S. Mukundakumari, K.S. Murugesan, and S. Gunasekaran, J. Vib. Spectrosc. 50[2] (2009) 226-230.
-
- 30. X.Y. Chen, S.Y. Wang, Y.X. Zhou, C.S. Cheeseman, W.L. Bi, and T.T. Zhang, J. Cement. Concrete. Comp. 134 (2022) 104813.
-
- 31. W.G. Zhou, A. Zhang, J.F. Cao, Q.Q. Ye, Z.R. Zhao, W.R. Zhou, C. Li, and J.Z. Li, J. Constr. Build. Mater. 408 (2023) 133683.
-
- 32. P. Wu, B. Zhang, X.Y. Nai, X. Liu, Y.P. Dong, and W. Li, J. Appl. Surf. Sci. 622 (2023) 156940.
-
- 33. Q. Y. Li, L.C. Zhang, X.J. Gao, and J.Y. Zhang, J. Constr. Build. Mater. 230 (2020) 116990.
-
- 34. K. Gu, B. Chen, H.F. Yu, N. Zhang, W.L. Bi, and Y. Guan, J. Cement. Concrete. Comp. 121 (2021) 104091.
-
- 35. N. Zhang, H.F. Yu, W. Gong, T. Liu, N. Wang, Y.S. Tan, and C.Y. Wu, J. Constr. Build. Mater. 230 (2020) 116951.
-
- 36. X.L. Lan, X.H. Zeng, H.S. Zhu, G.C. Long, and Y.J. Xie, J. Cement. Concrete. Comp. 130 (2022) 104509.
-
- 37. Q. Zeng, M.Y. Luo, X.Y. Pang, L. Li, and K.F. Li, J. Appl. Surf. Sci. 282 (2013) 302-302.
-
- 38. Q. Zeng, K.F. Li, T. Fen-Chong, and P. Dangla, J. Appl. Surf. Sci. 257[3] (2010) 762-768.
-
- 39. H.T. Zhao, X. Qin, J.P. Liu, L.L. Zhou, Q. Tian, and P.G. Wang, J. Constr. Build. Mater. 189 (2018) 934-946.
-
- 40. D. Suastiyanti, M. Wijaya, and B. G. Pandita, J. Ceram. Process. Res. 25[2] (2024) 261-267.
-
- 41. U. Önen and T. Boyraz, J. Ceram. Process. Res. 25[4] (2024) 624-632.
-
- 42. K. Minjeong and K. Yootaek, J. Ceram. Process. Res. 23[2] (2022) 158-168.
-
- 43. M. Kim and Y. Kim, J. Ceram. Process. Res. 22[2] (2021) 158-168.
-
- 44. C.H. Li, W. Zhao, J.L. Zhang, W. Lu, P. Li, B.J. Yan, and H.W. Guo, M. Varuthaiya, C. Palanisamy, V. Sivakumar, and G. Pushpanathan, J. Ceram. Process. Res. 23[6] (2022) 912-918.
-
 This Article
-
2025; 26(2): 299-306
Published on Apr 30, 2025
- 10.36410/jcpr.2025.26.2.299
- Received on Dec 19, 2024
- Revised on Feb 25, 2025
- Accepted on Feb 28, 2025
Services
Shared
Correspondence to
- Xuetao Yue
-
School of Material Science and Engineering, Shandong Jianzhu University, Jinan 250101, China
Tel : +86 13589035658 Fax: +86 053186367285 - E-mail: yuexuetao11@sdjzu.edu.cn
Clean-Energy Research Institute(CRI), Hanyang University, 222, Wangsimni-ro, Seongdong-gu, Seoul, 04763, Korea
E-mail: jcpr@hanyang.ac.kr