


- Hydrothermal synthesis of CuO@TiO2@ZnO ternary nanocomposites as electron transport materials for photovoltaic applications
S. Tekereka,*, F. Gödeb and E.B. Yılmazc
aKahramanmaraş Sütçü İmam University, Vocational School of Health Services, Department of Medical Services and Techniques, Kahramanmaraş 46050, Türkiye
bBurdur Mehmet Akif Ersoy University, Faculty of Arts and Sciences, Department of Physics, Burdur 15030, Türkiye
cKahramanmaraş Sütçü İmam University, Graduate School of Natural and Applied Sciences, Department of Materials Science and Engineering, Kahramanmaraş 46050, TürkiyeThis article is an open access article distributed under the terms of the Creative Commons Attribution Non-Commercial License (http://creativecommons.org/licenses/by-nc/4.0) which permits unrestricted non-commercial use, distribution, and reproduction in any medium, provided the original work is properly cited.
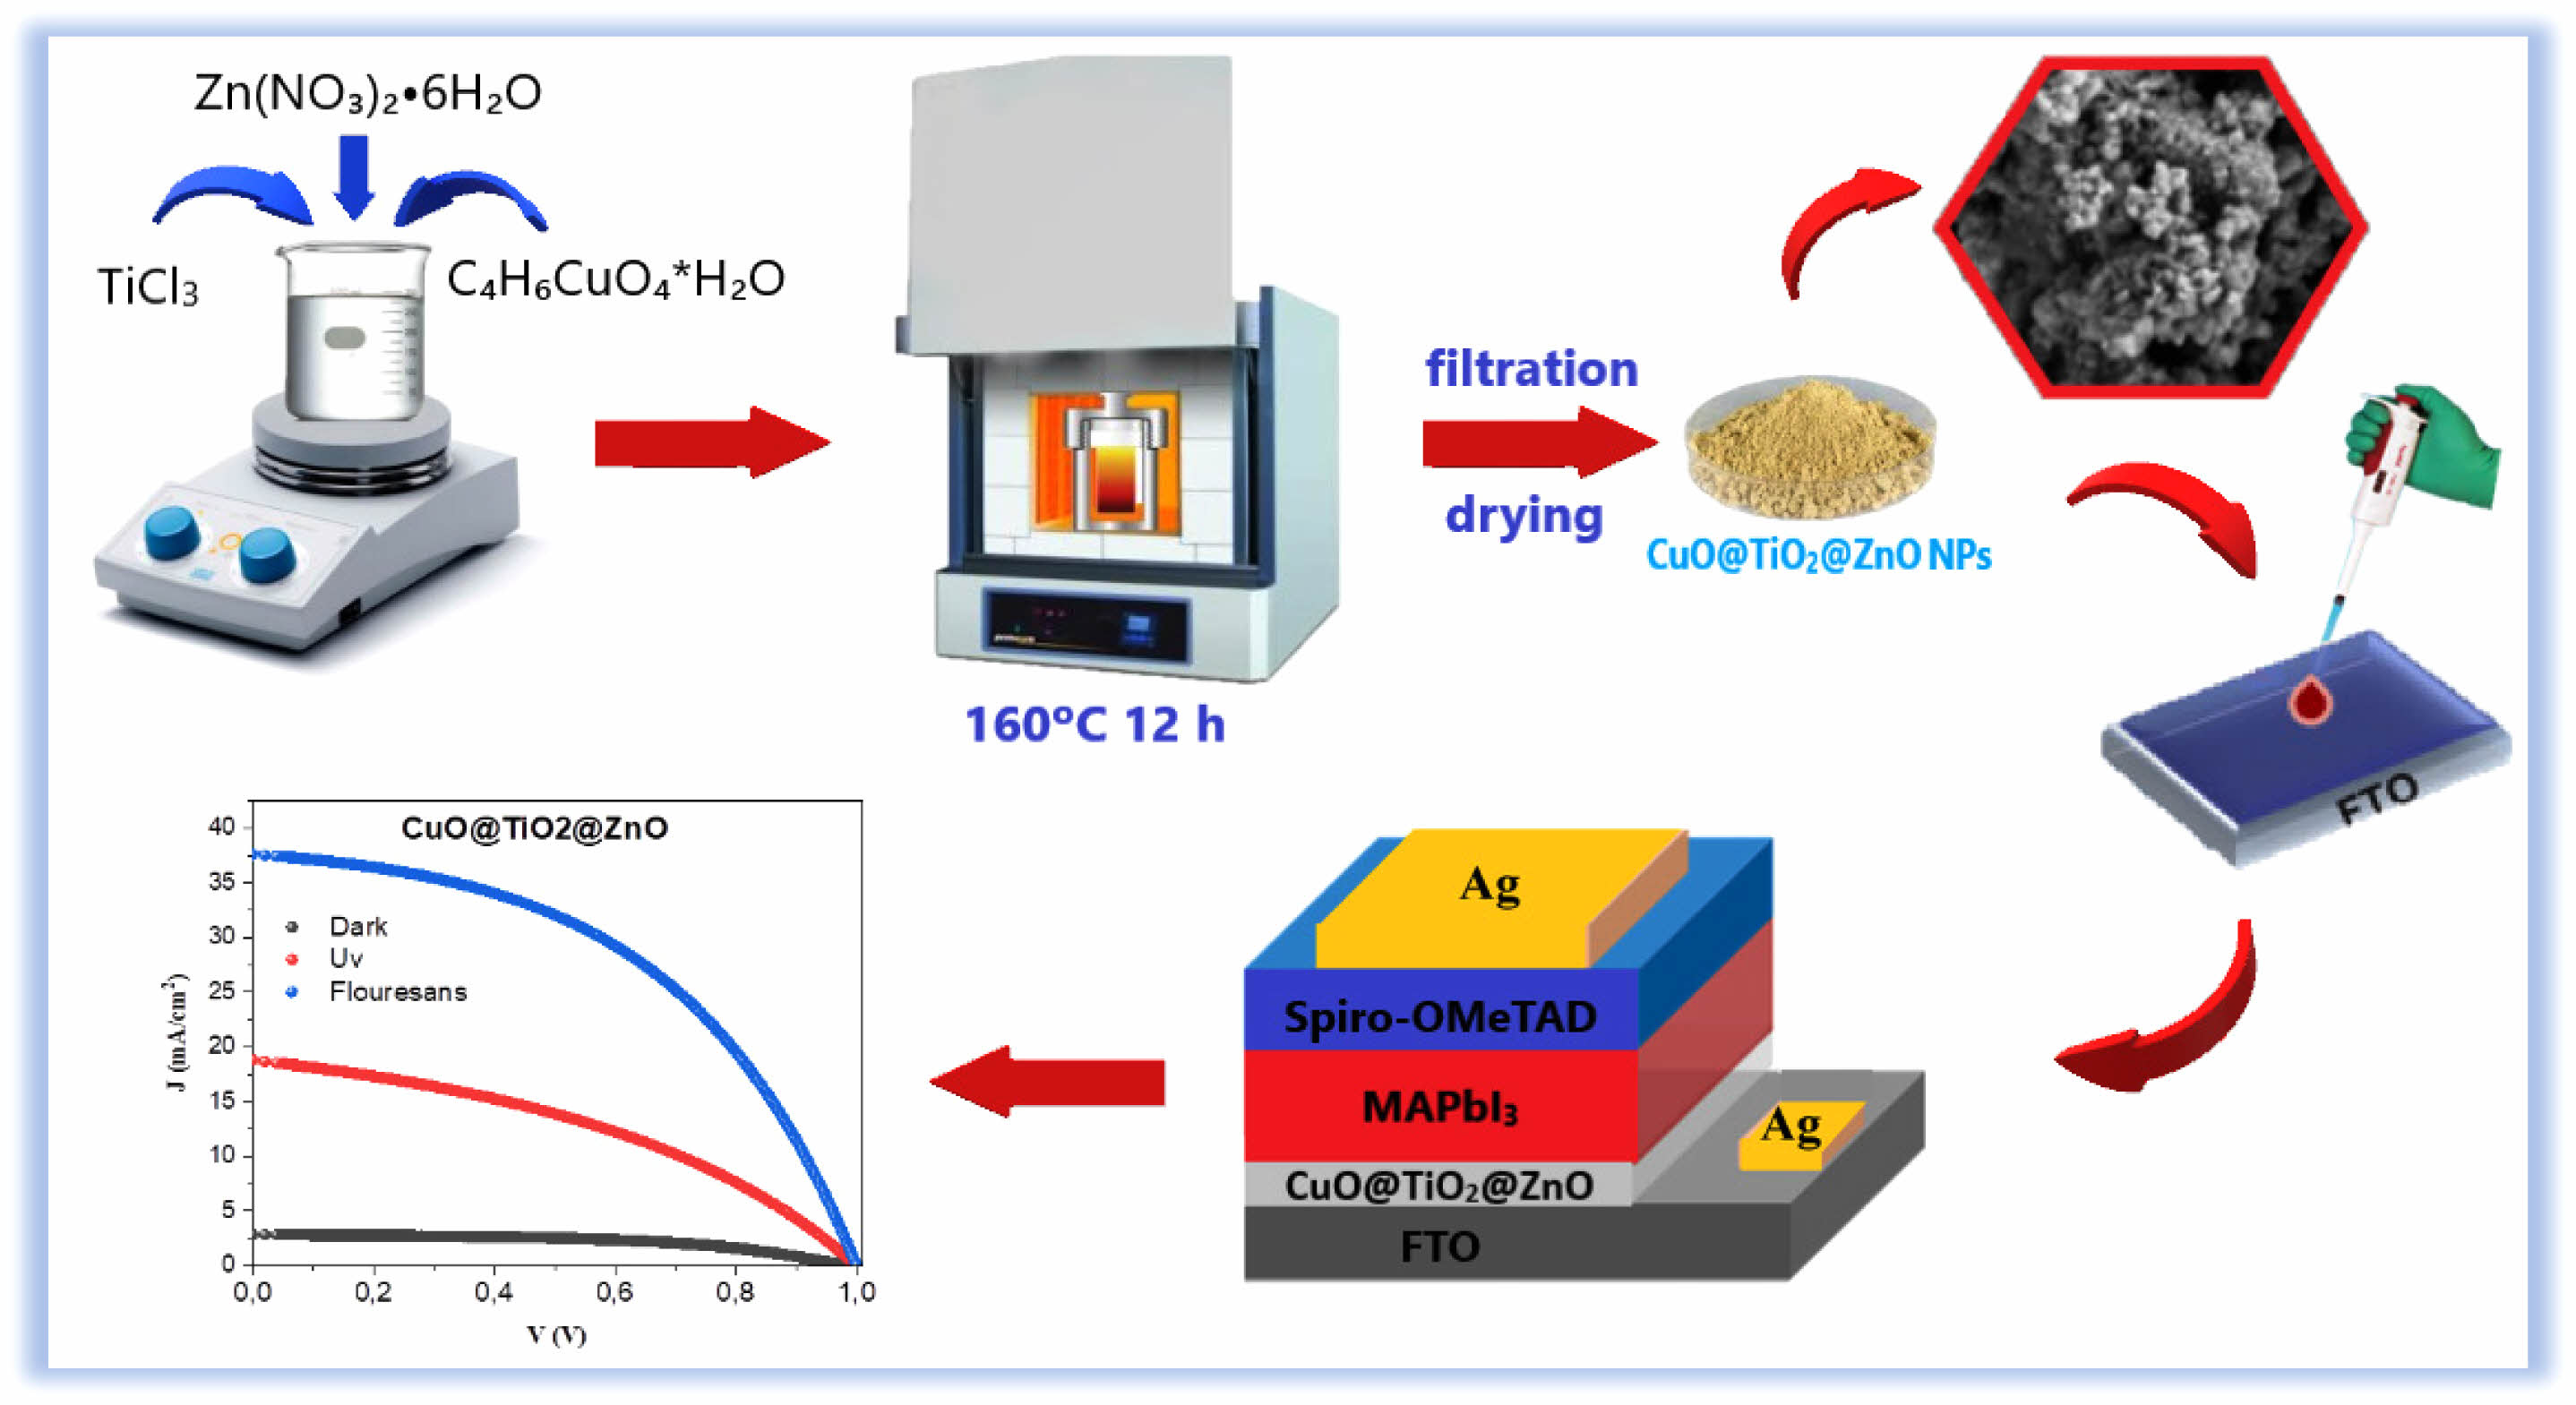
In this work, a CuO@TiO2@ZnO nanocomposite (CTZ NC) material was synthesized via a hydrothermal method. To fabricate perovskite solar cells (PSCs), the CTZ NC material was coated onto fluoride-doped tin oxide (FTO) glass substrates via a dip coating procedure. The produced CTZ NC material was investigated using X-ray diffraction (XRD), scanning electron microscopy (SEM), energy dispersive X-ray spectroscopy (EDS), UV‒vis spectroscopy, Fourier transform infrared (FTIR) spectroscopy, thermogravimetric analysis (TGA), and differential thermal analysis (DTA). The XRD results revealed three combinations of monoclinic CuO, tetragonal TiO₂, and hexagonal ZnO phases in the CTZ NC powder material. These phases were further confirmed by FTIR analysis. Moreover, SEM measurements showed agglomerated nanoparticles of different sizes. The optical direct band gap energy of the CTZ NCs on the FTO substrate was determined to be 3.06 eV. Furthermore, the photovoltaic performance of the PSCs under different illuminations (including daylight, a 6 W UV lamp, and a 7 W LED lamp) was evaluated. Notably, after illumination with a 7 W LED lamp, the optimal photovoltaic performance was obtained for FTO/Ag/CTZ/perovskite/spiro-OMeTAD/Ag, with a maximum open-circuit voltage (1 V), short-circuit current (37.5 mA cm⁻²), and fill factor (0.46), as well as the highest cell efficiency (17.54%). These findings suggest that using a ternary CTZ NC material for the fabrication of PSCs could enhance cell efficiency compared to other materials.
Keywords: CuO@TiO2@ZnO nanocomposite, hydrothermal method, dip coating, perovskite solar cell.
In recent years, metal oxide-based perovskite solar cells (PSCs) have gained significant attention due to their rapidly increasing efficiency, superior optoelectronic properties, defect tolerance, and ease of processing at relatively lower temperatures [1-5]. Among their notable advantages are low cost, high absorption coefficient, lightweight structure, outstanding charge carrier mobility, and flexibility. Additionally, the solubility of active layers in solar cell production and their easy application on large surfaces are key features that distinguish perovskite solar cells. The power conversion efficiency of perovskite solar cells has significantly increased to 29% [6], bringing them close to conventional silicon solar cells.
Recent studies have demonstrated that the efficiency of metal oxide-based PSCs remains insufficient; however, it can be improved through various methods such as doping [7-11], incorporating ferroelectric materials [12, 13], or using two-component metal oxide nanocomposite (NC) materials. Manibalan et al. [14] reported that the efficiencies of bare cerium oxide (CeO2) and CeO2-CuO NC PSCs were 5.56% and 10.58%, respectively. Chen et al. [15] demonstrated that the efficiencies of CuO-Cu2O-based PSCs at 300°, 350°, and 400° were 3.15%, 7.32%, and 6.49%, respectively. Ali et al. [16] indicated that the photovoltaic performance of a graphene oxide‒silver‒zinc oxide (GO‒Ag‒ZnO) NC-based PSC was 8.72% Beyond PSC applications, NC materials have also been utilized in other fields, such as improving supercapacitor performance [17, 18]. Moreover, NC materials are employed in silicon solar cells and copper indium gallium selenide (CIGS) solar cells [19, 20]. Recently, NC materials have attracted attention in the field of photocatalyst degradation due to their remarkable performance, cost-effectiveness, reliability, and energy efficiency [21-23].
PSCs typically consist of a mesoporous metal oxide layer, such as CuO, copper(I) oxide (Cu2O), ZnO, nickel oxide (NiO), tungsten trioxide (WO3), tin oxide (SnO2), or TiO2, deposited on conductive substrates, along with a perovskite sheet, a hole transport layer, and a metal electrode. Previous studies have indicated that CuO, TiO2, and ZnO nanoparticles can be utilized in PSC fabrication; however, until recently, CTZ NCs had not been employed in PSCs. Considering its potential, the CTZ NC material is expected to provide superior electron transport characteristics and synergistic compatibility with the perovskite absorber layer. Therefore, a ternary CuO@TiO2@ZnO nanocomposite (CTZ NC) electron transport layer (ETL) was selected for integration into a planar PSC. Furthermore, the perovskite methylammonium lead iodide (CH3NH3PbI3) was chosen as a hole transport layer (HTL) due to its well-documented efficiency in solar cells [10]. Similarly, spiro-OMeTAD was used as an HTL to enhance the light conversion efficiency of PSCs [24].
In this study, for the first time, we examined the application of a three-component CTZ NC material in the manufacturing of PSC devices. The primary objective was to develop a novel ternary ETL layer within the structure of CTZ NCs that could be incorporated into solar cells. This NC material was hydrothermally synthesized and applied to PSC fabrication using the dip coating method. We anticipate that our research will offer a simple and cost-effective approach to fabricating high-efficiency PSCs using low-temperature solution techniques such as hydrothermal synthesis and dip coating, which present significant advantages over conventional high-temperature production methods for manufacturing compact layer devices. The hydrothermal method is widely employed for the synthesis of nanoparticles due to its ability to produce materials with precise control over size, shape, and crystallinity. This technique involves the reaction of precursor materials in an aqueous environment under high temperature and pressure, facilitating the formation of nanostructures. One of the key advantages of the hydrothermal process is its versatility, enabling the synthesis of a wide range of materials, including metals, oxides, and composites [25]. Additionally, it allows for fine-tuned control over the morphology and composition of nanoparticles, which is essential for tailoring material properties for specific applications. The method is also considered environmentally friendly, as it typically uses water as a solvent, minimizing the need for hazardous chemicals. Moreover, hydrothermal synthesis can be easily scaled up, making it suitable for industrial production. These advantages make the hydrothermal method an attractive approach for producing high-quality nanoparticles, particularly for applications in catalysis, solar cells, sensors, and various other fields.
Titanium (III) chloride (TiCl3, 20% solution in hydrochloric acid, 250 mL, Sigma‒Aldrich), copper (II) acetate monohydrate (C4H6CuO4, Sigma‒Aldrich), and zinc nitrate hexahydrate (Zn(NO3)2·6H2O, Merck) salts were used at a molar ratio of 1:0.5:0.5. Separate dissolution processes were carried out for each precursor salt. First, zinc nitrate (Zn(NO₃)₂·6H₂O; 2.8 g/20 mL) was mixed with hexamethylenetetramine (C6H12N4; 1.4 g/20 mL) in ultrapure water and stirred for 10 minutes to prepare the ZnO solution. Next, a copper(II) oxide precursor solution was prepared by dissolving copper(II) acetate monohydrate (2.9 g/75 mL) in water. Simultaneously, 1.6339 g of NaOH pellets were dissolved in 25 mL of water in a separate beaker, and this NaOH solution was then added to the CuO solution. Finally, 10 mL of TiCl3 was mixed with 11.5 mL of HCl. The three prepared solutions were combined, and the total volume was adjusted to 200 mL with distilled water. The mixture was stirred for 30 min at room temperature. A color change from white to light blue was observed in the final solution.
The solution was then subjected to a hydrothermal process, where it was transferred to a Teflon vessel, sealed tightly with linen tape, and placed in an autoclave. The mixture was heated at 160 °C for 12 hours to facilitate the formation of the ternary nanocomposite. The resulting CTZ nanocomposite powder was washed three times with distilled water for purification, precipitation, and filtration. After the final wash, the powders were dried at room temperature and then calcined at 450 °C for 1 hour to remove hydroxyl groups and promote crystallization. The experimental procedure for the synthesis of the CTZ NCs is shown in Fig. 1.
First, MAI was synthesized using the following materials: dimethylformamide (DMF), chlorobenzene (CB; Sigma‒Aldrich ReagentPlusR; 99% purity), lead iodide (PbI2, Strem Chemicals; 99.9% purity), and methylamine (CH3NH2; Sigma; 33% by weight ethanol solution) [26]. An aqueous solution of 12 ml of HCI (57% by weight aqueous solution, Sigma‒Aldrich) and 24 ml of methylamine iodide (MAI; CH3NH2I) were sequentially added to 100 ml of ethanol, which was left in an ice bath and mixed with a magnetic stirrer for 2.5 hours. The color of the solution changed from dark red to bright yellow over this period. A rotary evaporator was then used to remove the remainder of the solution. The resulting powder was rinsed three times with a mixture of diethyl ether and ethanol. MAI crystals with a white color were obtained after drying at ambient temperature [27]. Second, 553 mg of PbI2 was dissolved in 1 ml of DMF and heated at 55 °C, while both 30 mg of MAI and 100 µl of 4-tert-butylpyridine (TBP) were dissolved in 1 ml of 2-isopropanol (IPA) at room temperature. To prepare the perovskite solution, PbI2 solution was added to the MAI solution at a 1:2 volume ratio [28-31].
First,72.3 mg of spiro-OMeTAD and 520 mg of lithium bis(trifluoromethylsulfonyl)imide were dissolved in 1 ml of CB and 1 ml of acetonitrile (ACN; CH3CN), respectively. To prepare the HTL material, 0.1 ml of spiro-OMeTAD, 28.8 μL of TBP, and 17.5 μL of lithium bis(trifluoromethylsulfonyl)imide were added and mixed rigorously for 45 minutes at 45 °C [32, 33].
AnFTO substrate with a 14 Ω/sq resistivity and dimensions of 3 × 15 × 15 mm3 was used for the fabrication of the PSCs. Prior to deposition, the substrate was sequentially cleaned in detergent, ultrapure water and isopropyl alcohol solutions for approximately 10 minutes and then dried in a drying oven for 10 minutes. To fabricate PSCs using prepared solutions, the FTO substrate was coated with CTZ nanoparticles in the form of a thin film via the dip coating technique [34]. For this method, the substrate was dipped into the prepared solutions for five minutes and lifted vertically from the solution (CTZ NC in ethanol) for two minutes of drying. This process was repeated five times until the desired thickness was achieved. The coated CTZ film was sintered at 450 °C for 30 minutes. Thus, an ETL layer was formed on FTO. The perovskite material was coated onto the ETL layer by dropping. To reduce the crystal size, achieve homogeneity, and ensure even distribution over the surface, approximately 100 μl of CB was added to the coating. The coated layer was subsequently annealed at 450 °C for 30 minutes to eliminate the solvent, after which crystal alignment was achieved. The same procedure for coating perovskite was also applied for coating spiro-OMeTAD as an HTL. A transparent conductive layer (FTO), an ETL (CTZ), an HTL (spiro-OMeTAD), a perovskite (MAPbI3), and a metal contact are the typical components of planar regular heterojunction PSCs [35]. The structure of the PSC is shown in Fig. 1. The PSC was characterized via I-V measurements. Silver contact was made by hand using silver paste (Electrodag 1415, Agar Scientific, 25 g).
|
Fig. 1 Schematic diagram of CTZ NC material synthesis via a hydrothermal method and PSC fabrication. |
Structural characterization was performed by recording the X-ray diffraction patterns of the film with a Bruker A8 advanced X-ray diffractometer (XRD) with Cu Kα (0.154 nm) radiation. The surface morphologies of the materials were studied via EVO40-LEO scanning electron microscopy (SEM). Compositional analysis of the CTZ NCs was performed via energy dispersive X-ray spectroscopy (EDS) connected to SEM. The absorption spectra of the materials were obtained on a UV‒Vis spectrophotometer (Shimadzu UV-2600). Fourier transform infrared (FTIR) spectroscopy was used in the wavenumber range of 4000-400 cm-1 (Perkin Elmer Spectrum400 Shimadzu, Japan). Thermogravimetric analysis (TGA) was performed with a Perkin Elmer Pyris 1 instrument, whereas differential thermal analysis (DTA) was carried out via a Perkin Elmer DSC 4000 apparatus. The J-V characteristics of the PSCc with an area of 1 cm2 were measured via a computer-controlled Keithley 2400 source meter and LabTracer 2.0 data processing software. During the measurements, the responses of the PSC were analysed by using daylight and two different light sources: a UV lamp (6 W) and an LED lamp (7 W).
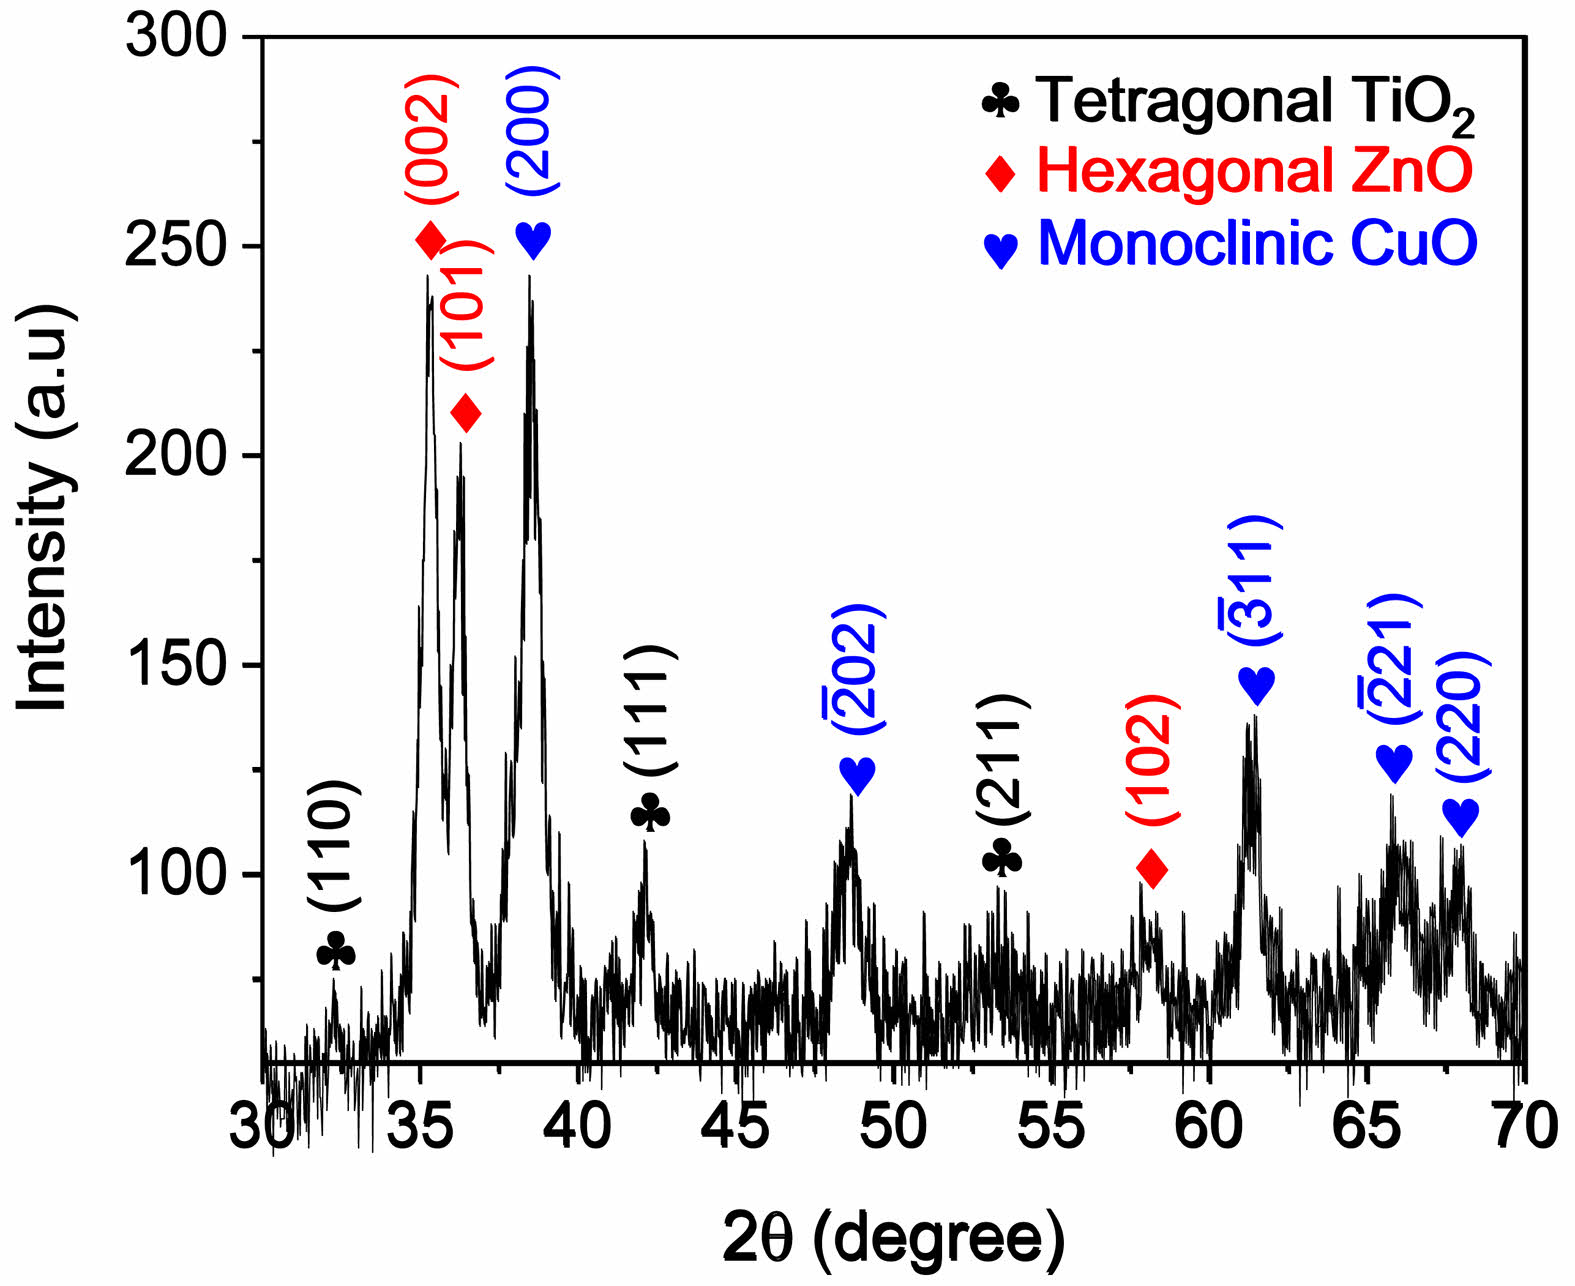
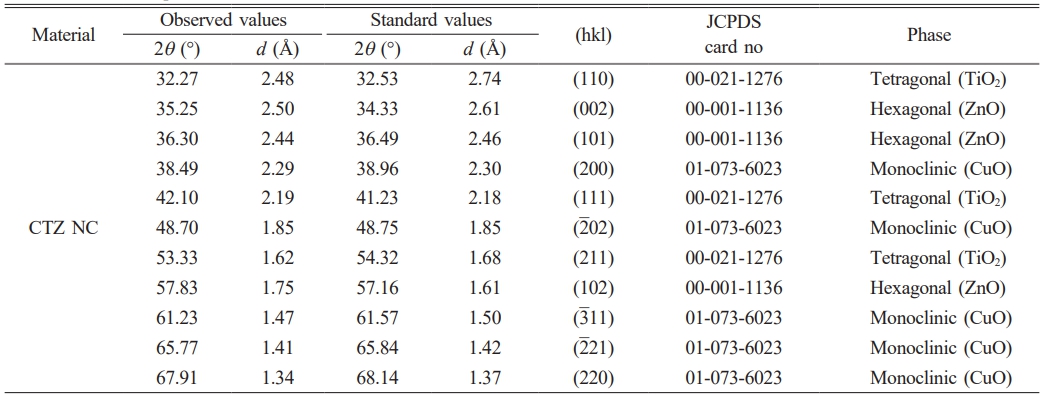
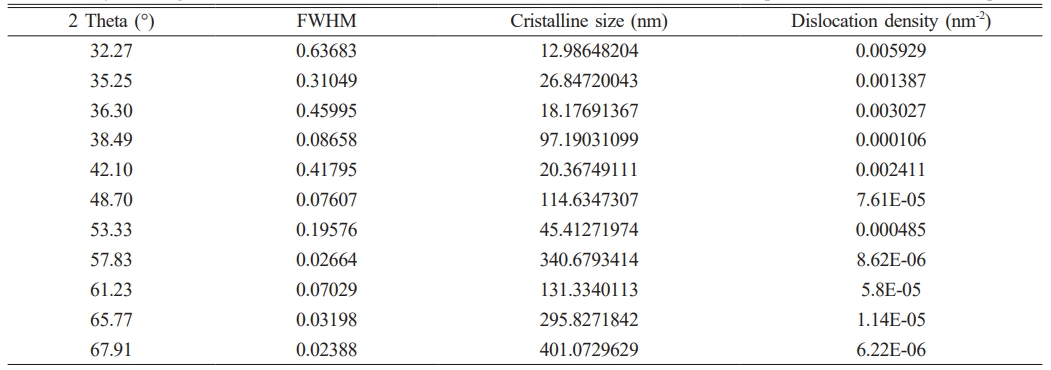
XRD was employed to identify the crystalline phases in the prepared CTZ NC material. The XRD pattern of the CTZ NC material obtained via the hydrothermal technique is shown in Fig. 2. The CTZ NC material consisted of a mixture of three phases: monoclinic CuO, tetragonal TiO2, and hexagonal ZnO. Similar XRD patterns have been reported in the literature [36-39]. Additionally, the observed and standard structural data are listed in Table 1. Based on the XRD peak analysis, the average crystallite size of the CTZ nanocomposite was calculated to be 136.7754 nm, and the observed data are listed in Table 2. Additionally, dislocation density [39] was calculated and is given in Table 2.
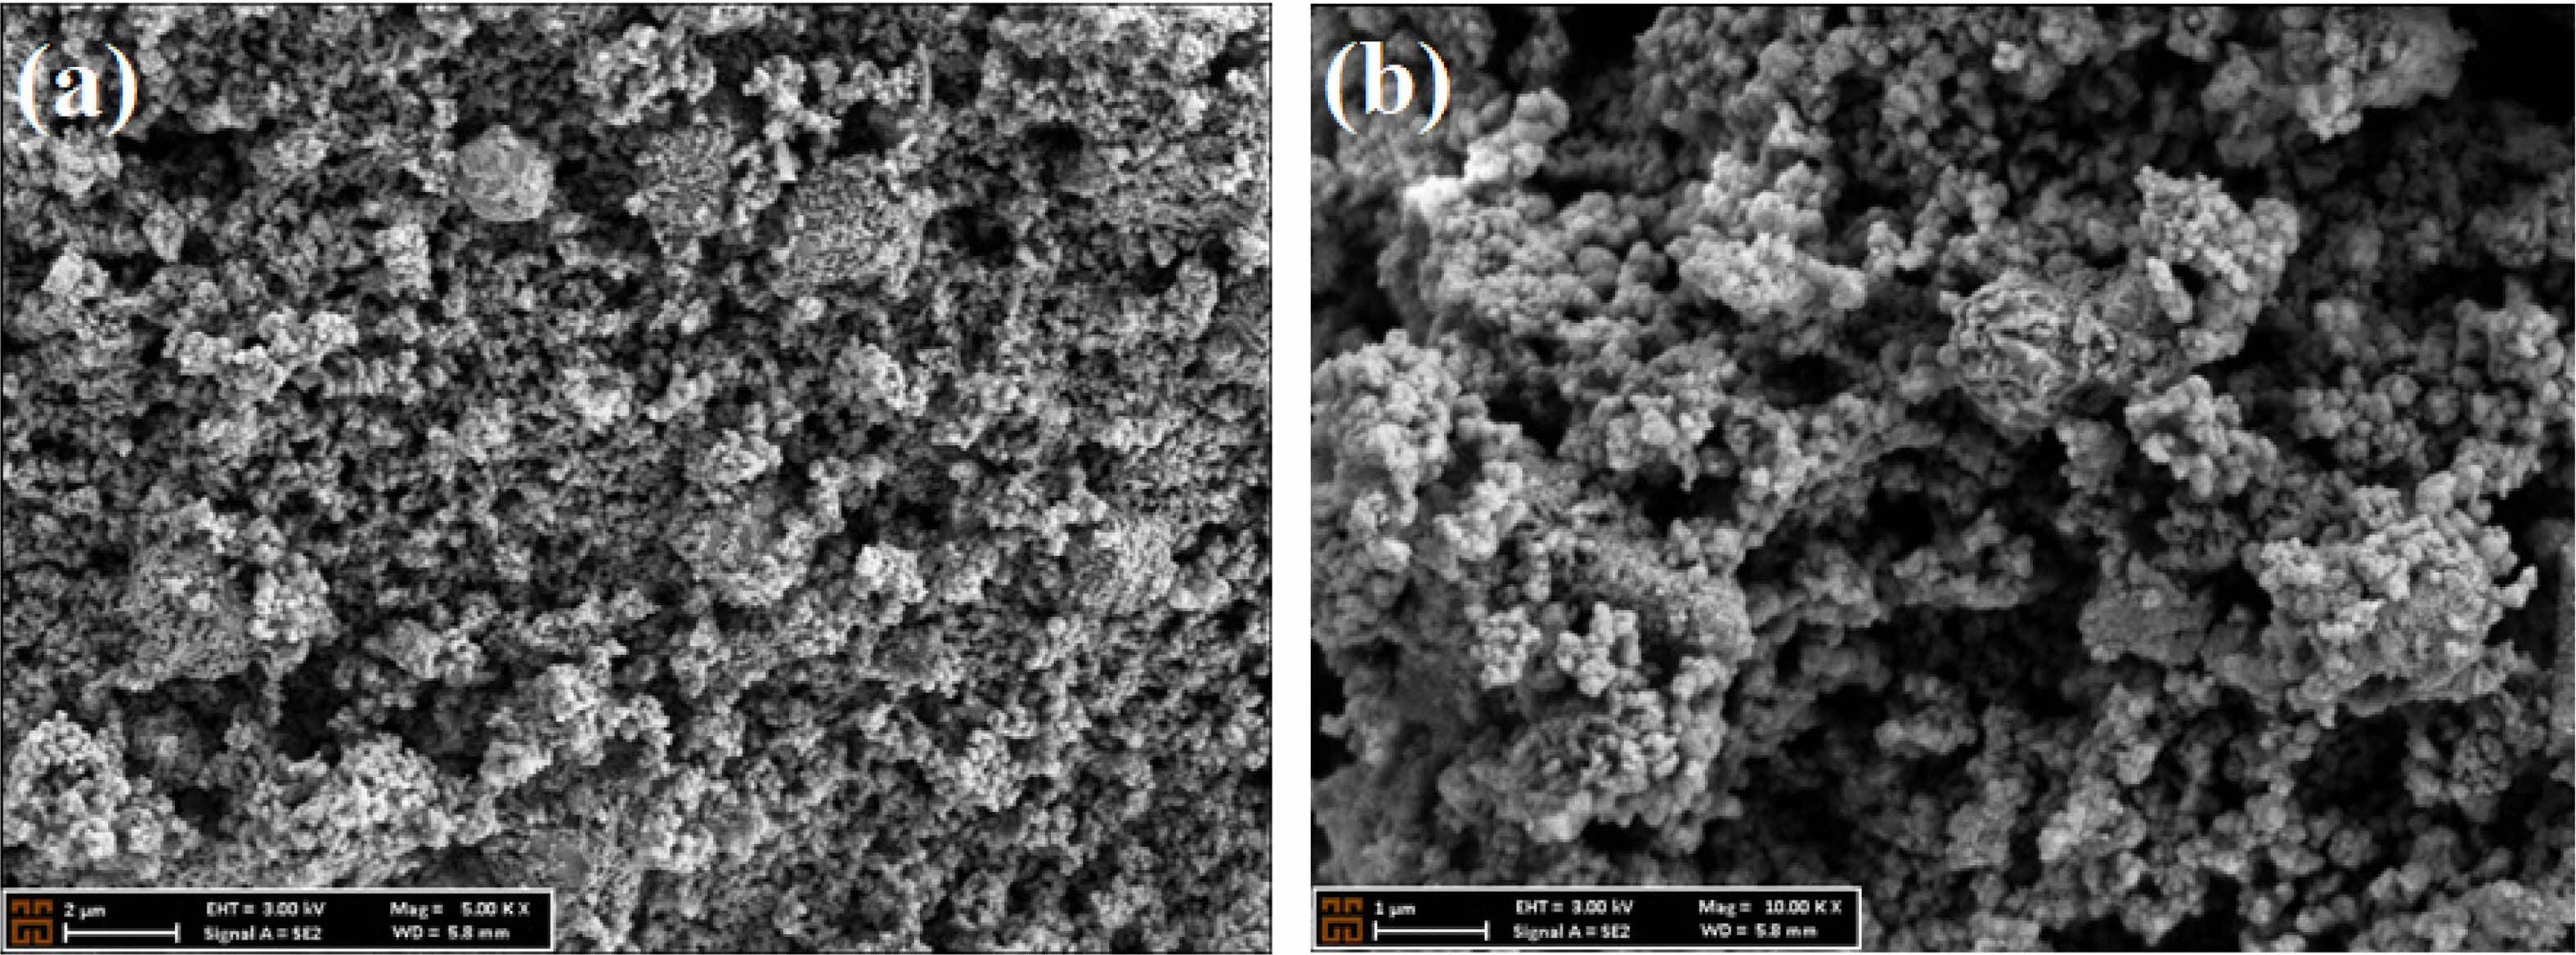
Generally, the surface morphology of the CTZ NC material strongly influences the physical and electrical properties of PSC. The surface morphology of the CTZ NC material was evaluated via SEM, and the results at magnifications of 5.00 K × and 10.00 K × are illustrated in Figs. 3 a and b, respectively. According to the SEM image, a very small and nearly spherical morphology with a mesoporous surface was observed.
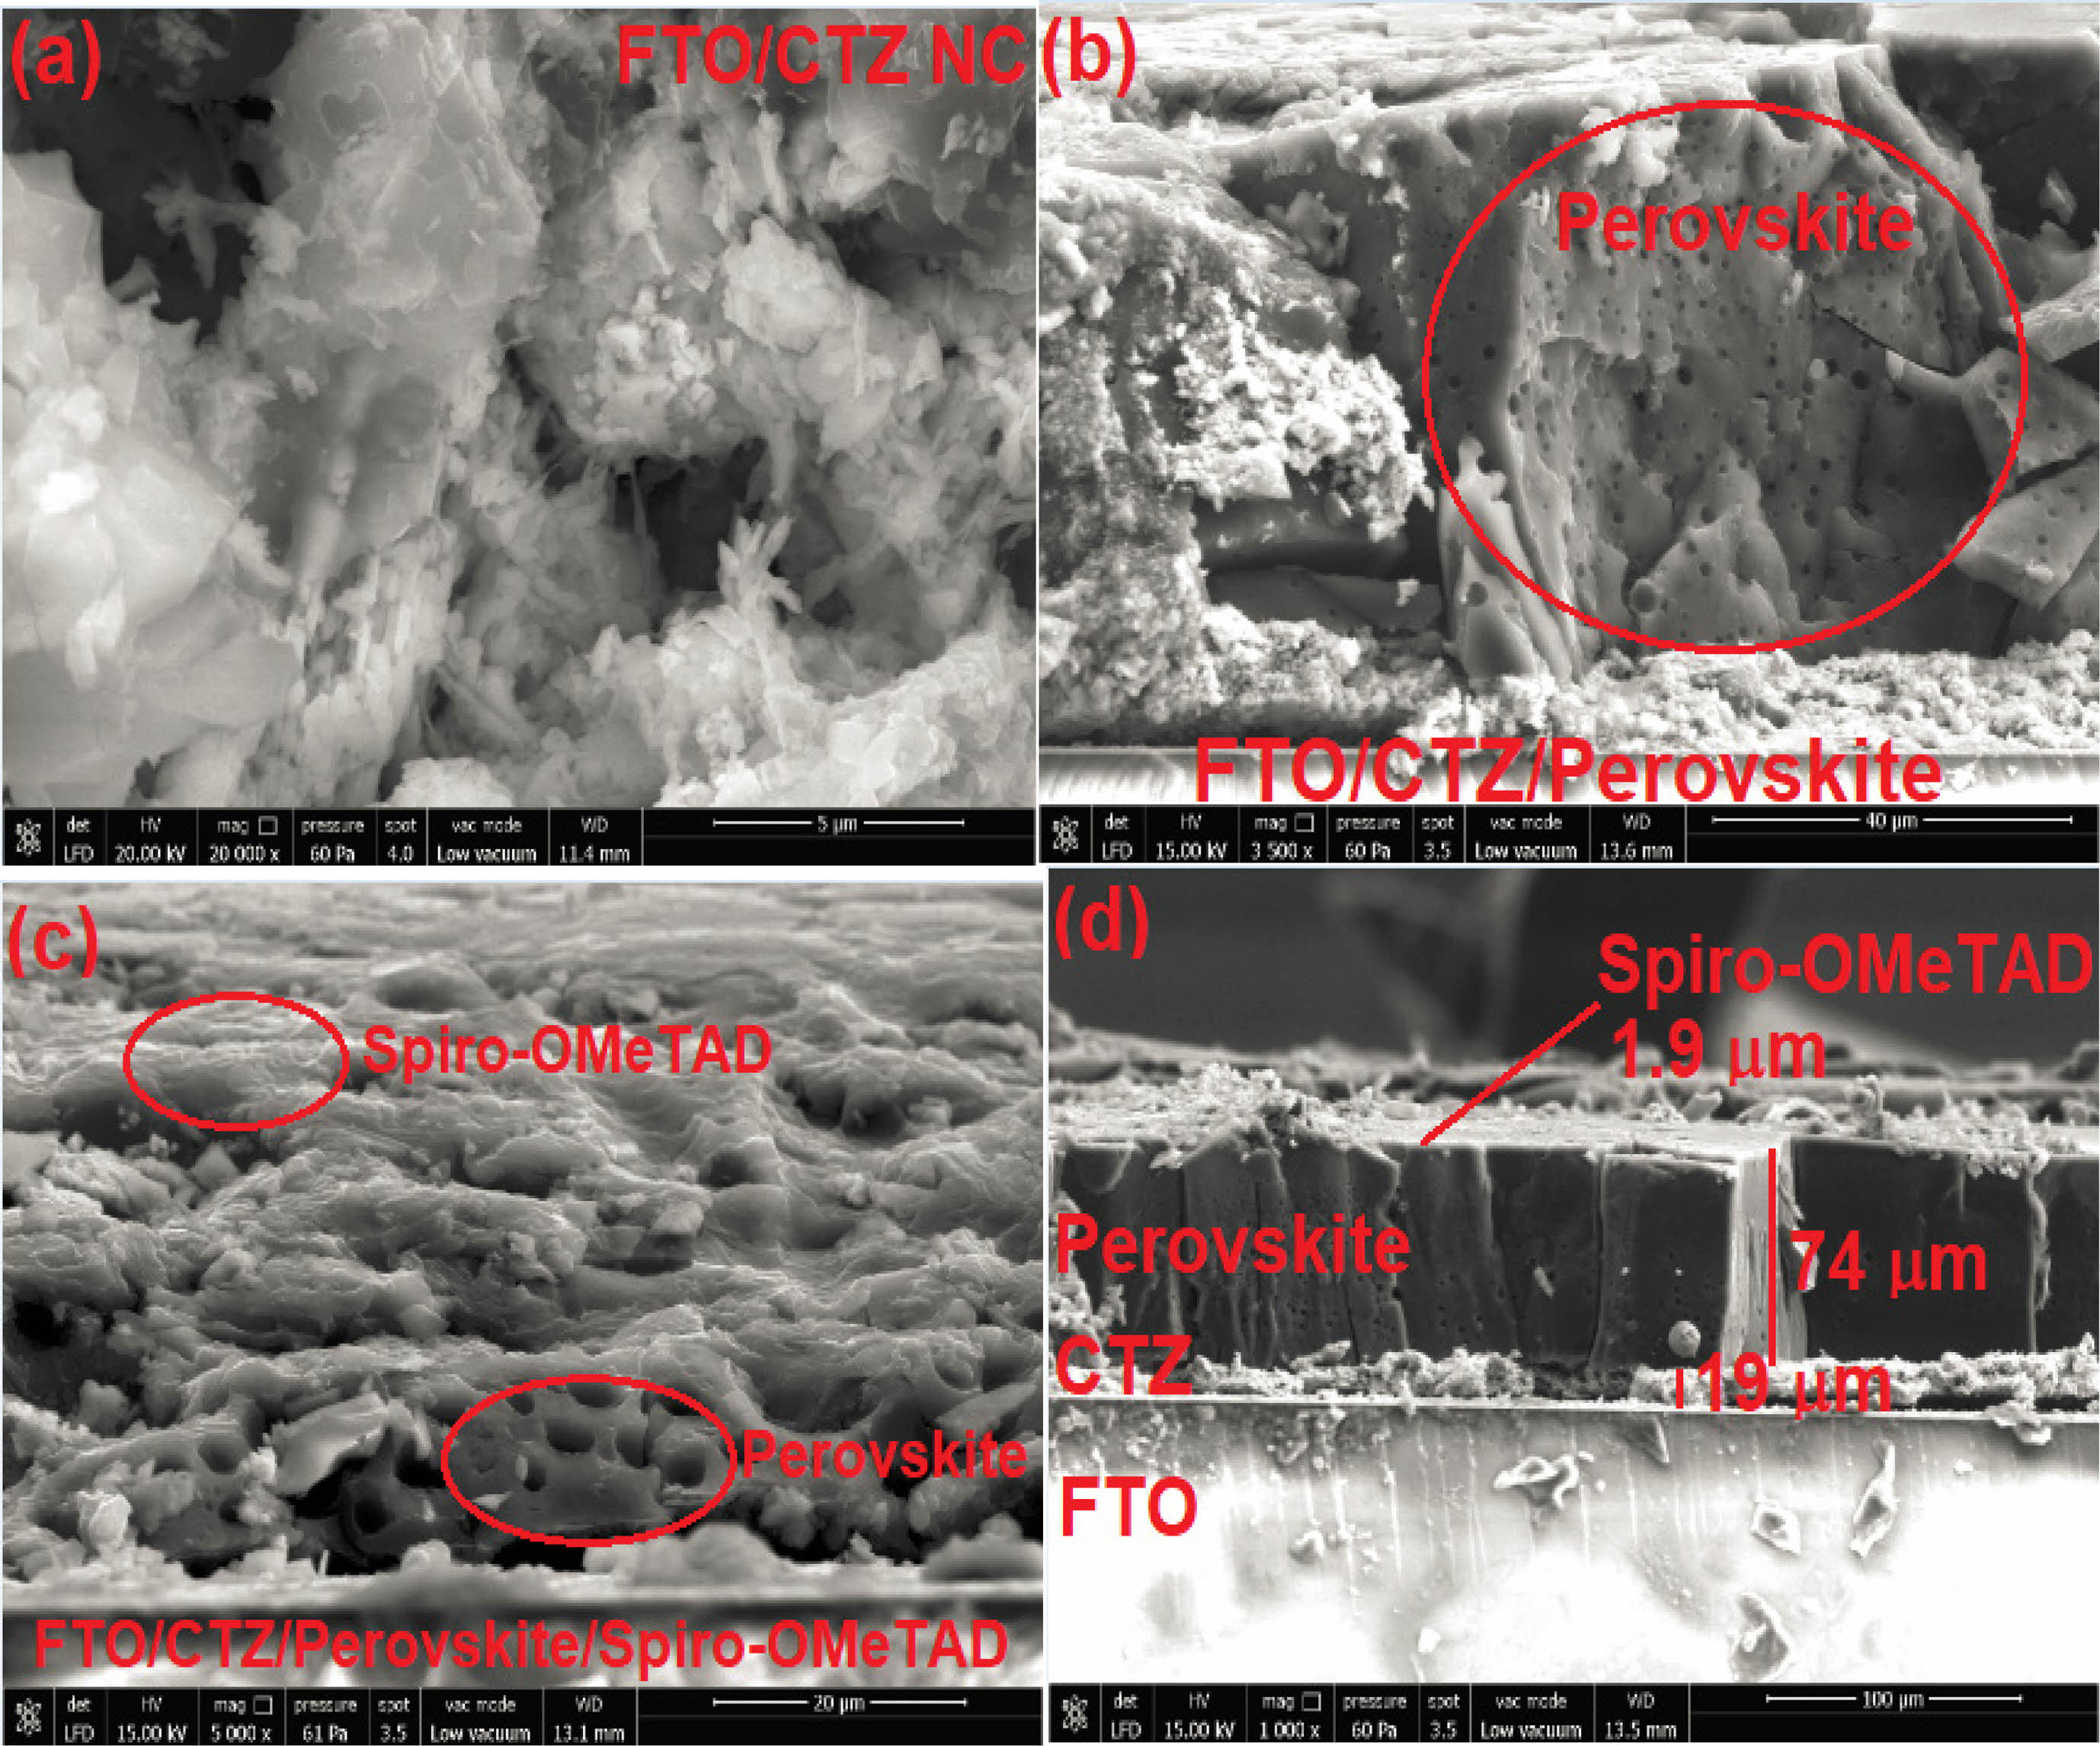
Fig. 4 shows micrographs of the PSC device obtained using the CTZ NC material. Fig. 4(a) shows that the SEM image of the CTZ NC material coated onto the FTO substrate indicated that both nanoplates and nanorods of different sizes and shapes had spaces between them. Similar results were reported by Maheswari et al. [36] for TiO2/CuO/ZnO NC materials. Figs. 4(b) and (c) present the mesoscopic perovskite image and top view of the PSC device morphology, respectively. Fig. 4d shows a cross-sectional SEM image of the FTO/Ag/CTZ/perovskite/spiro-OMeTAD/Ag structure. As shown in this figure, the thicknesses of the CTZ NC, perovskite, and spiro-OMeTAD were 19 µm, 74 µm, and 1.9 µm, respectively.
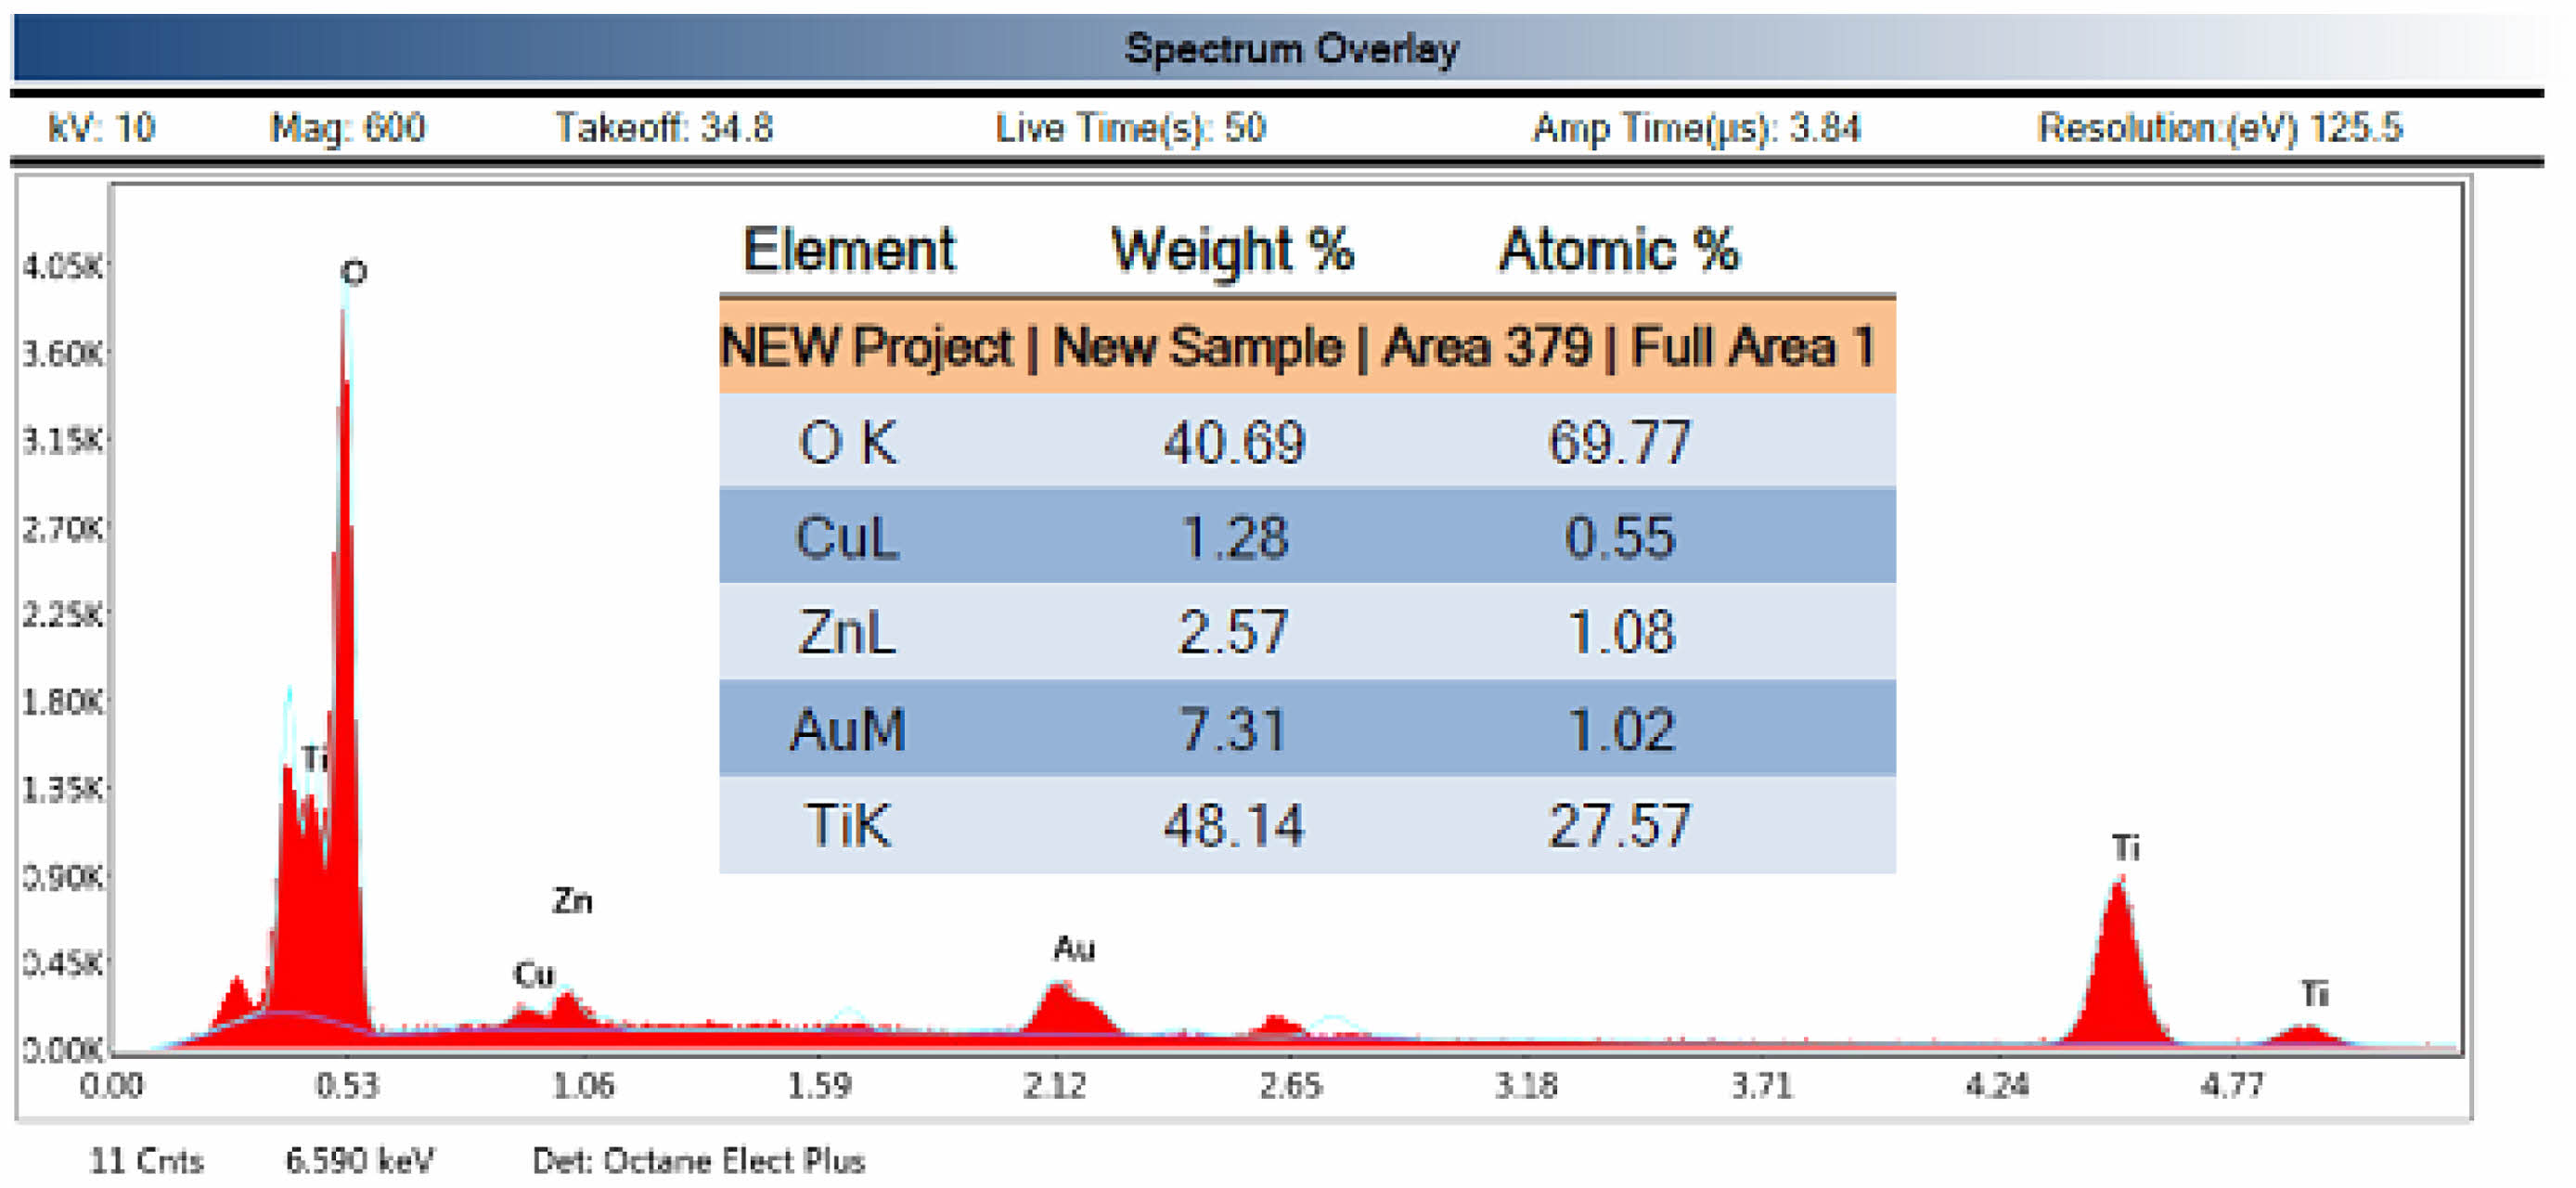
Fig. 5 presents the elemental analysis (EDS) of the CTZ NC material. The EDS spectrum verified the existence of peaks for CuO, TiO₂, and ZnO, suggesting that the three metal oxides were successfully integrated into a single structure to create a three-component metal oxide. According to the elemental distribution map, the weight percentages of Cu, Ti, Zn, and O were 1.28%, 48.14%, 2.57%, and 40.69%, respectively, whereas the atomic percentages of Cu, Ti, Zn, and O were 0.55%, 27.5%, 1.08%, and 69.77%, respectively. The Au peak in the EDS spectrum is due to the sample surface being coated with gold, according to the SEM image.
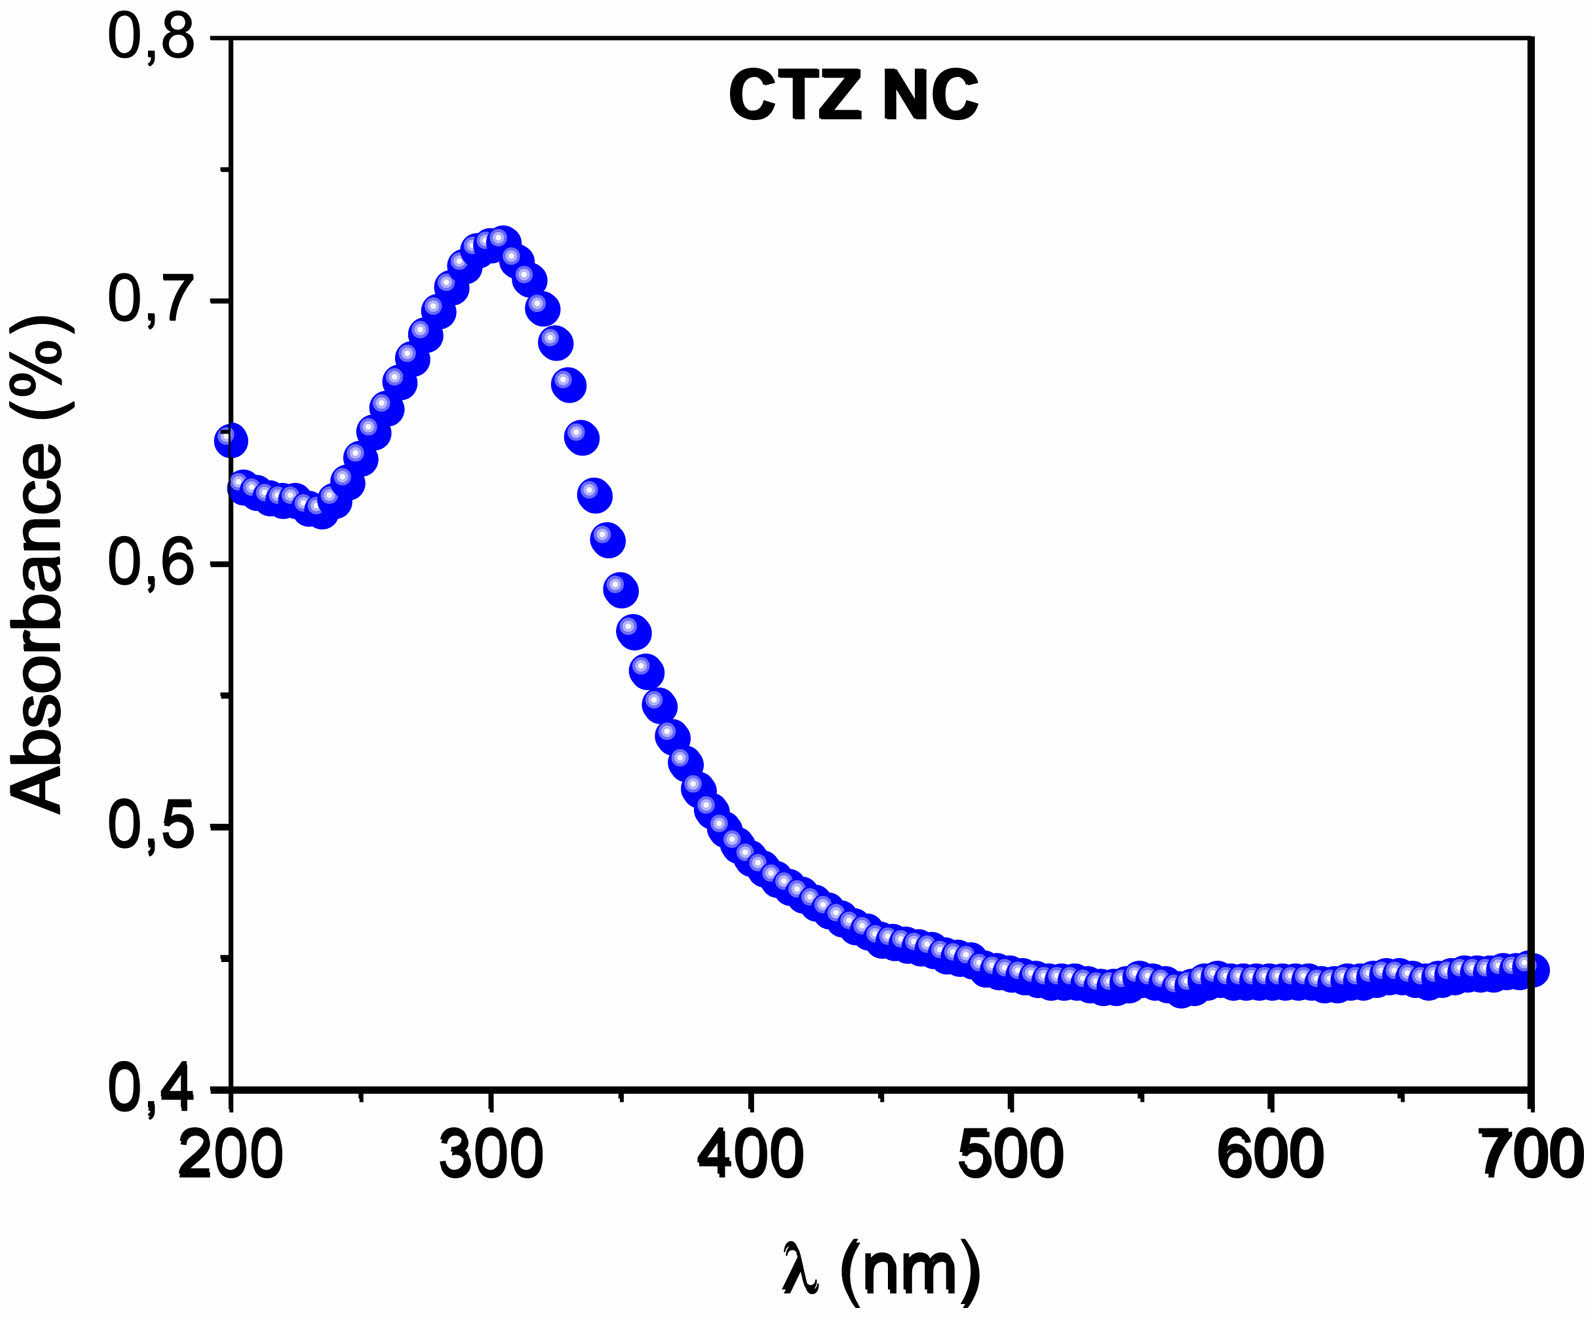
Fig. 6 shows the absorbance curves of the CTZ NC material. The absorption (A) edge of the CTZ NC powder is related to the electron transition from the valence band to the conduction band and can be used to calculate the bandgap of the material.
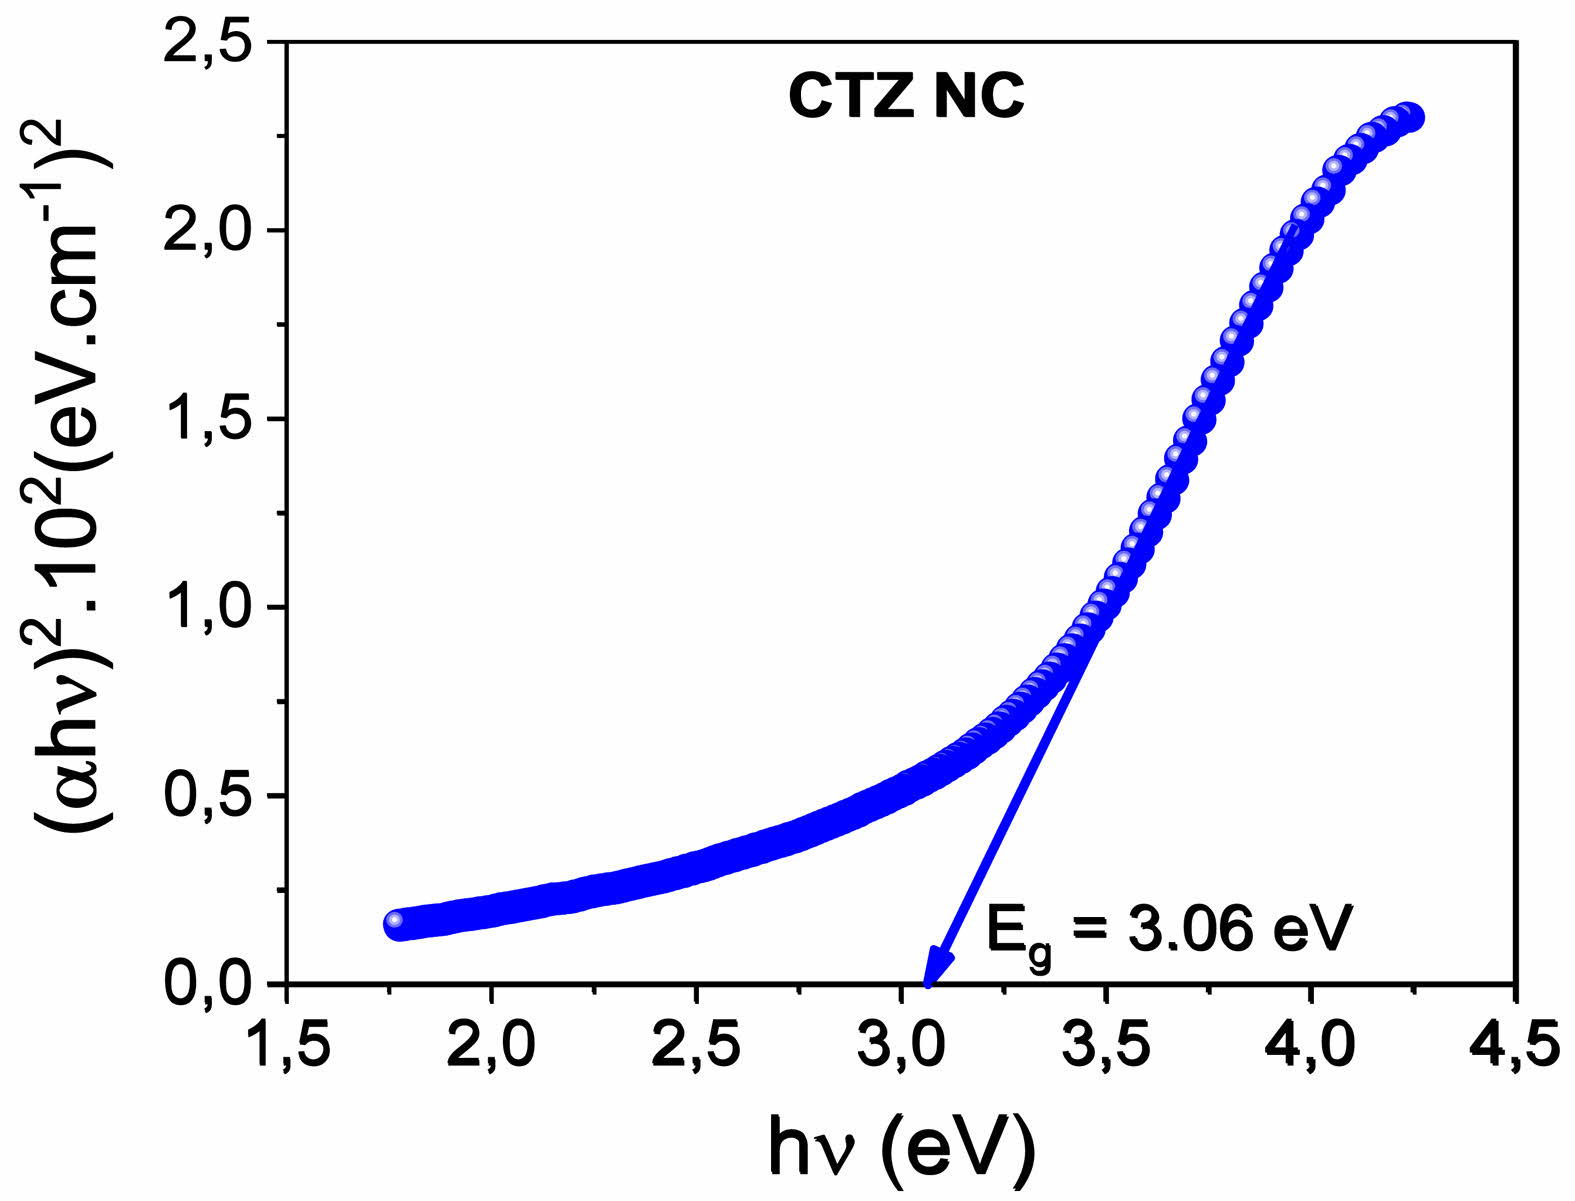
The direct optical band gap energy (Eg) is calculated via Tauc’s relation according to the following formula [40]. Fig. 7
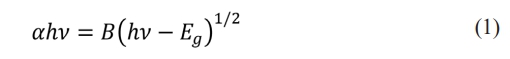
where B is the independent constant of energy, h is the Plank constant, and n is the incident photon frequency. The absorption coefficient (a) of the material was evaluated via the following formula [41].

where T is the normalized transmittance and where d is the thickness. The direct optical band gap energy was determined by plotting (ahv)2 as a function of photon energy hv, as shown in Fig. 6b. The direct optical band gap energy value for the CTZ NC material was calculated as 3.06 eV by plotting the intercept of the versus (hv) curve.
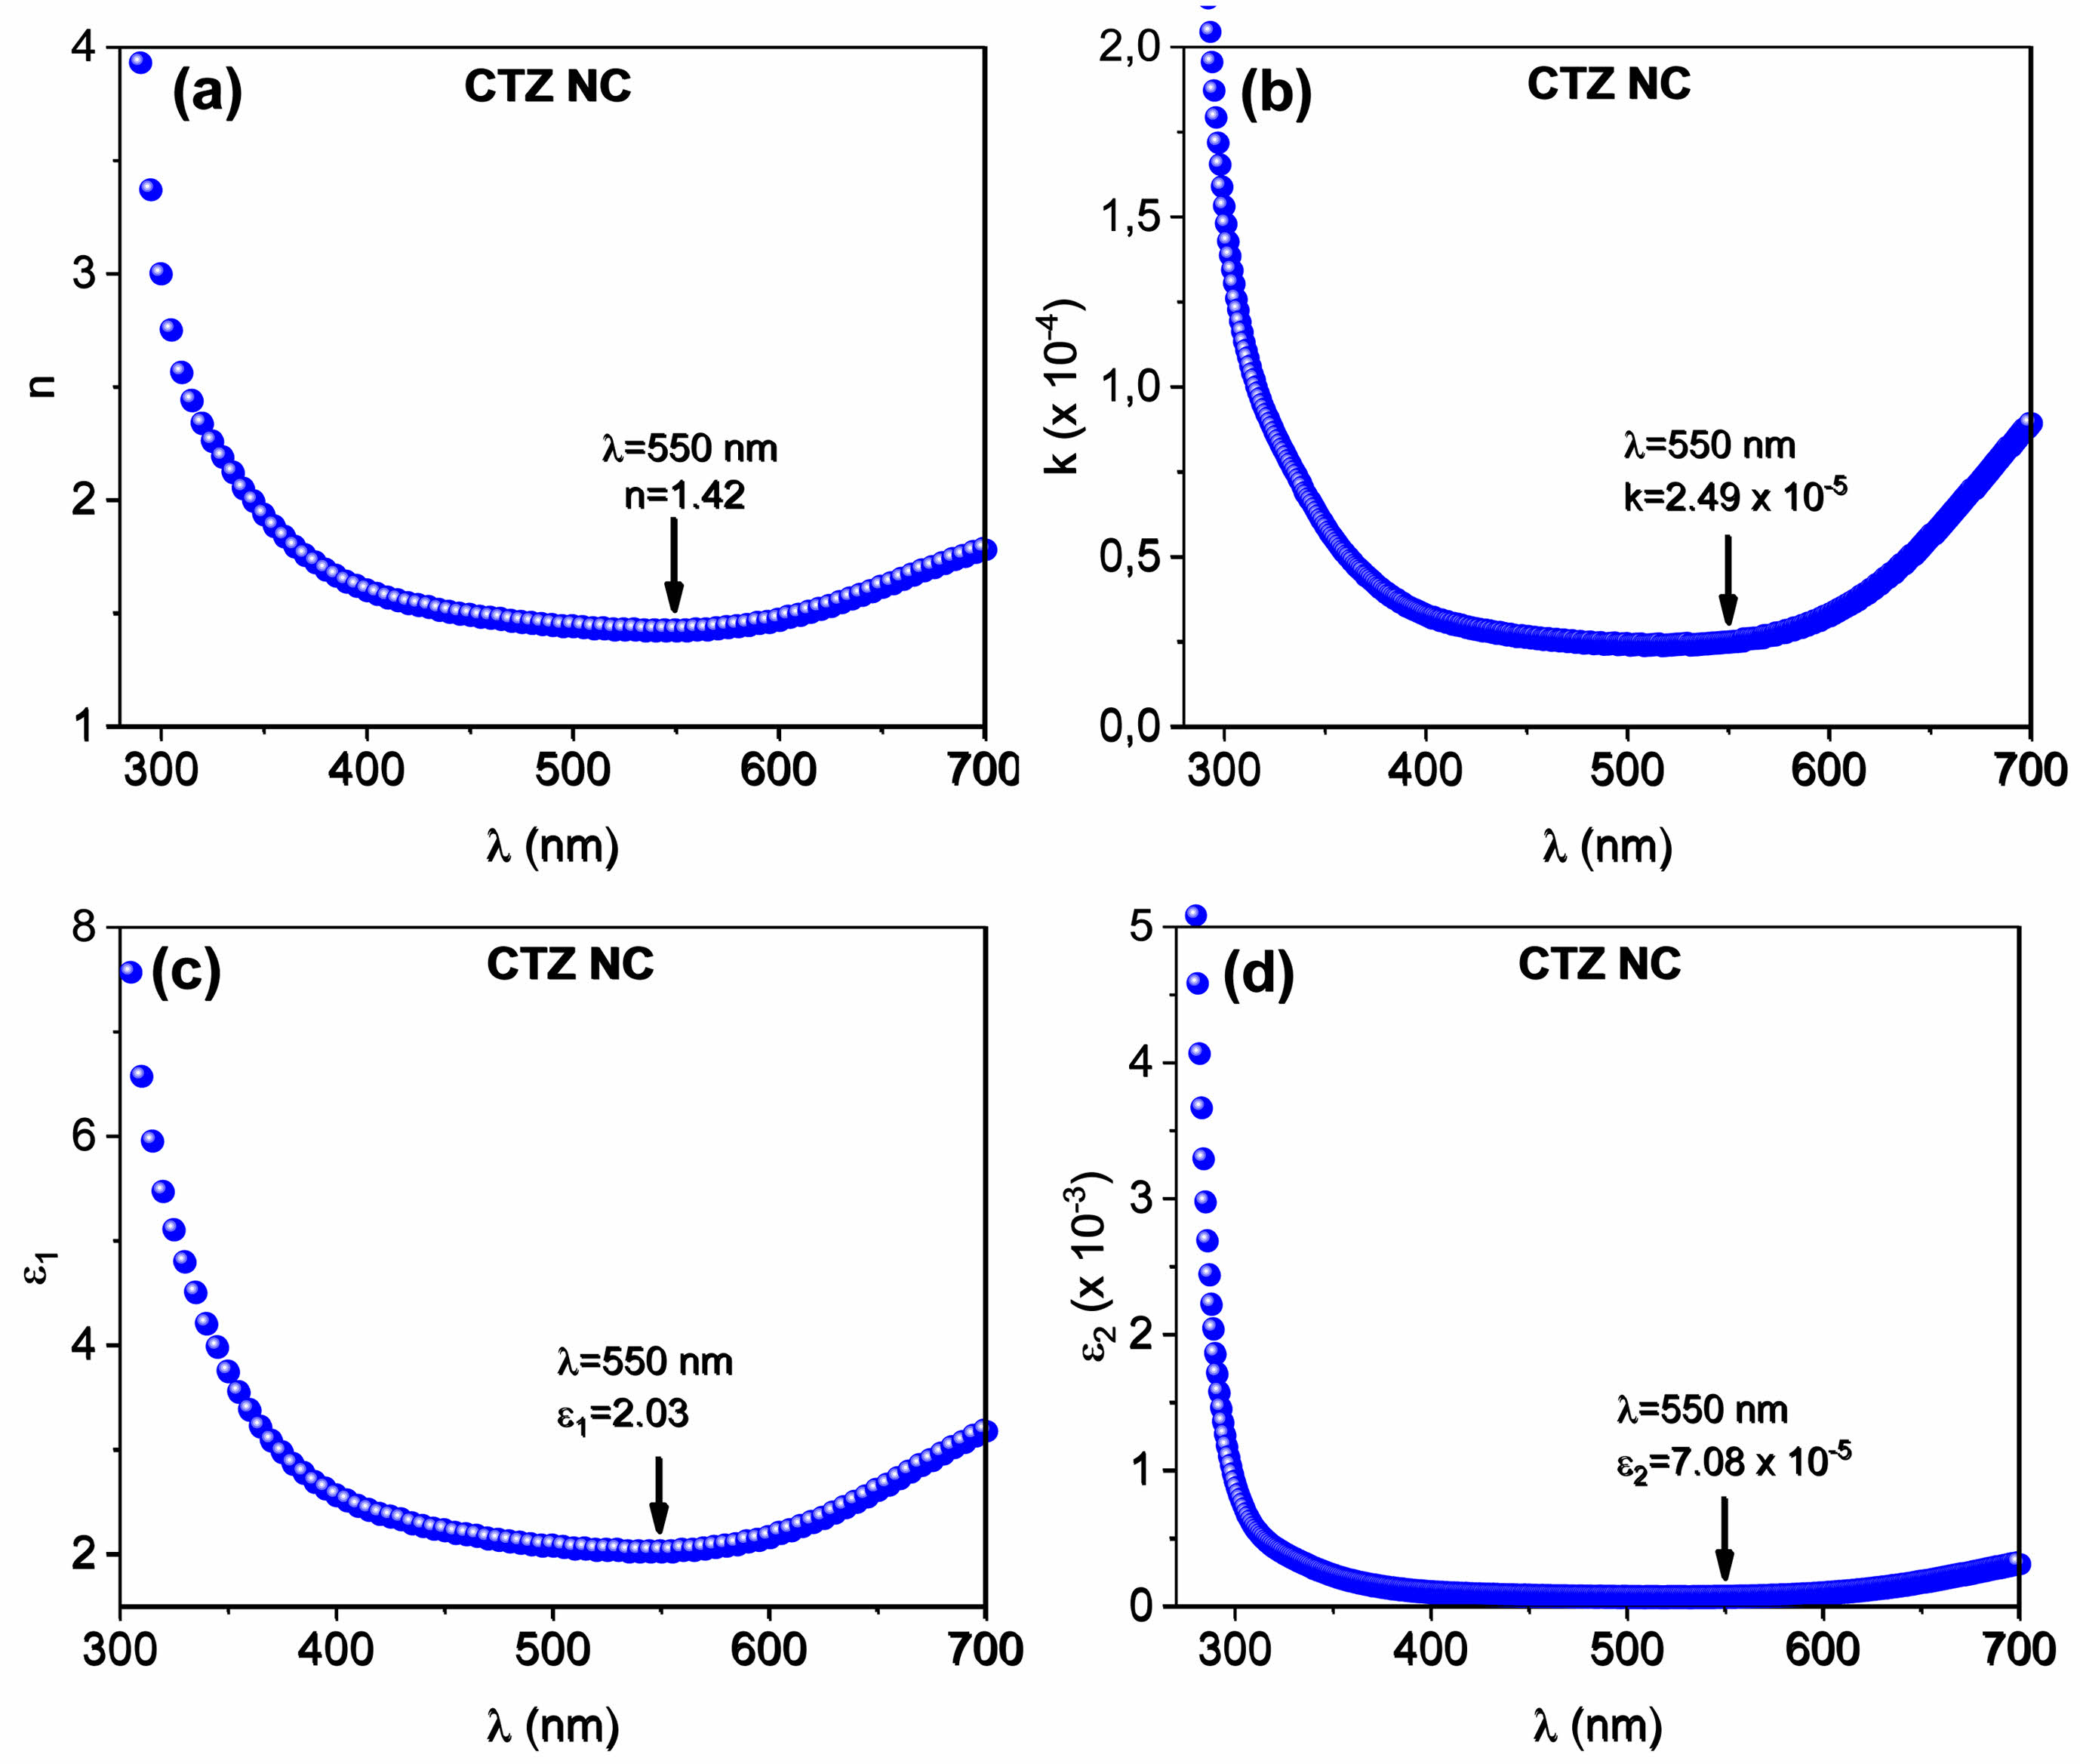
Optical parameters such as the refractive index (n), extinction coefficient (k), reel (ε1), and imaginary (ε2) parts of the complex dielectric constant can be evaluated via UV‒vis spectroscopy via the following relationships [42, 43].
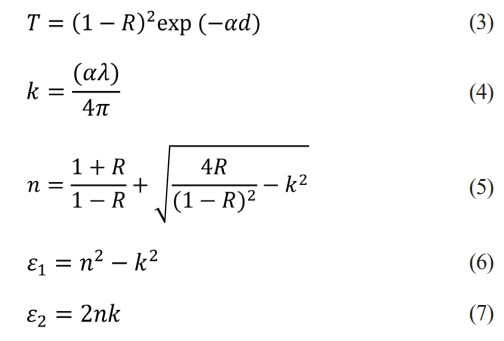
where R is the reflectance. Plots of n, k, ε1, and ε2 as a function of wavelength are shown in Figs. 8a, b, c, and d, respectively. At a wavelength of 550 nm, the n, k, e1, and e2 values of the CTZ NC material were determined to be 1.42, 2.49 × 10⁻⁵, 2.03, and 7.08 × 10⁻⁵, respectively.
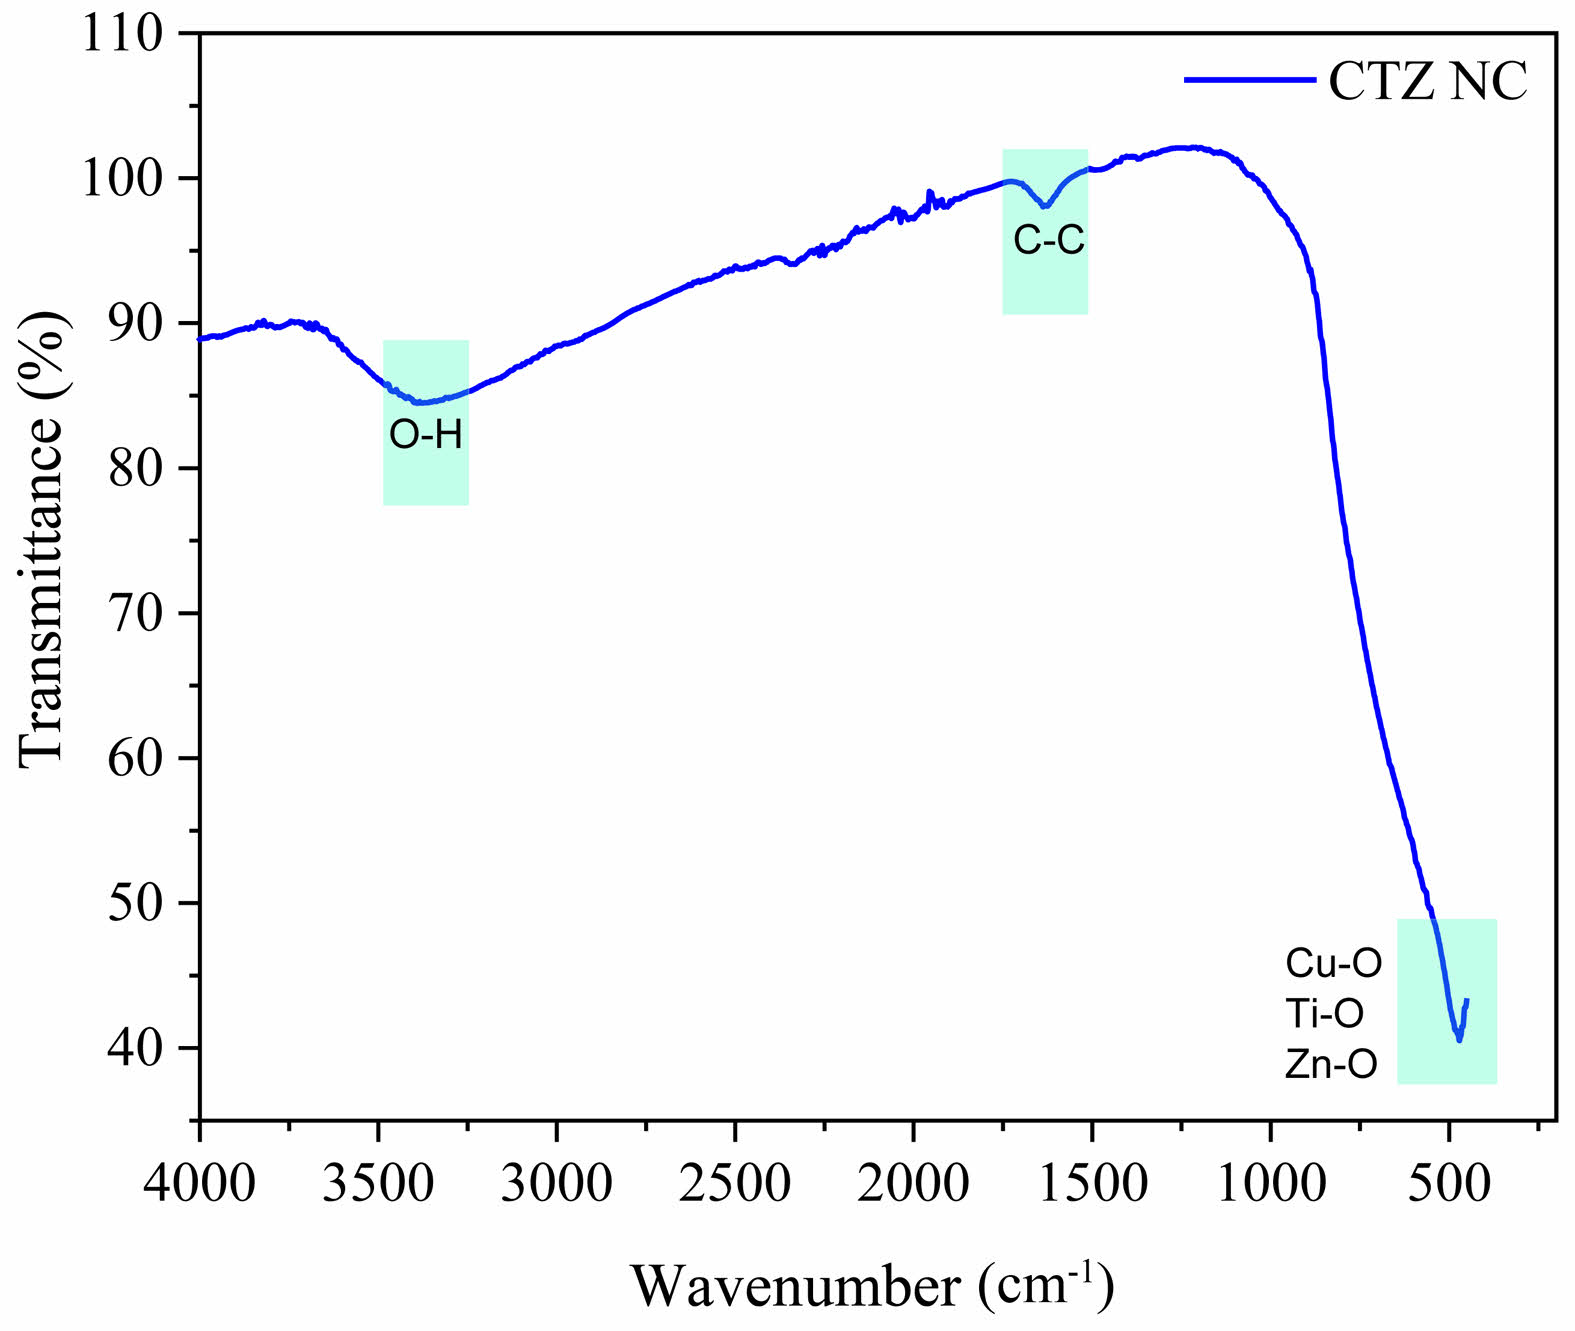
Fig. 9 shows the FTIR spectrum of the ternary nanocomposite calcined at 400 °C. The FTIR spectrum of the CTZ NCs was recorded in the range of 400-4000 cm⁻¹. FTIR spectroscopy (Shimadzu, Japan) was employed to analyse the chemical bonds in the synthesized nanoparticles. Metal oxides typically exhibit absorption bands below 1000 cm⁻¹ due to interatomic vibrations [44]. FTIR analysis of the CTZ nanocomposite revealed multiple peaks associated with various functional groups and vibrations. Upon analysing the FTIR spectrum, a peak at 740.2 cm⁻¹ was identified, which was attributed to the formation of the CTZ NCs. The prominent absorption band at 3901.1 cm⁻¹ is associated with the O–H stretching and bending modes of water [45]. It has been reported in the literature that copper oxide nanoparticles in CTZ NCs exhibit specific Cu‒O peaks in the 400-675 cm⁻¹ range, which serve as structural confirmation of the molecules present in the sample [46]. The peak observed at 740.2 cm⁻¹ in the CTZ NC spectrum confirms the presence of Cu in the structure. For ZnO in the CTZ NC, the absorption peak observed at 740.2 cm⁻¹ corresponds to the stretching vibration mode of ZnO [47, 48].
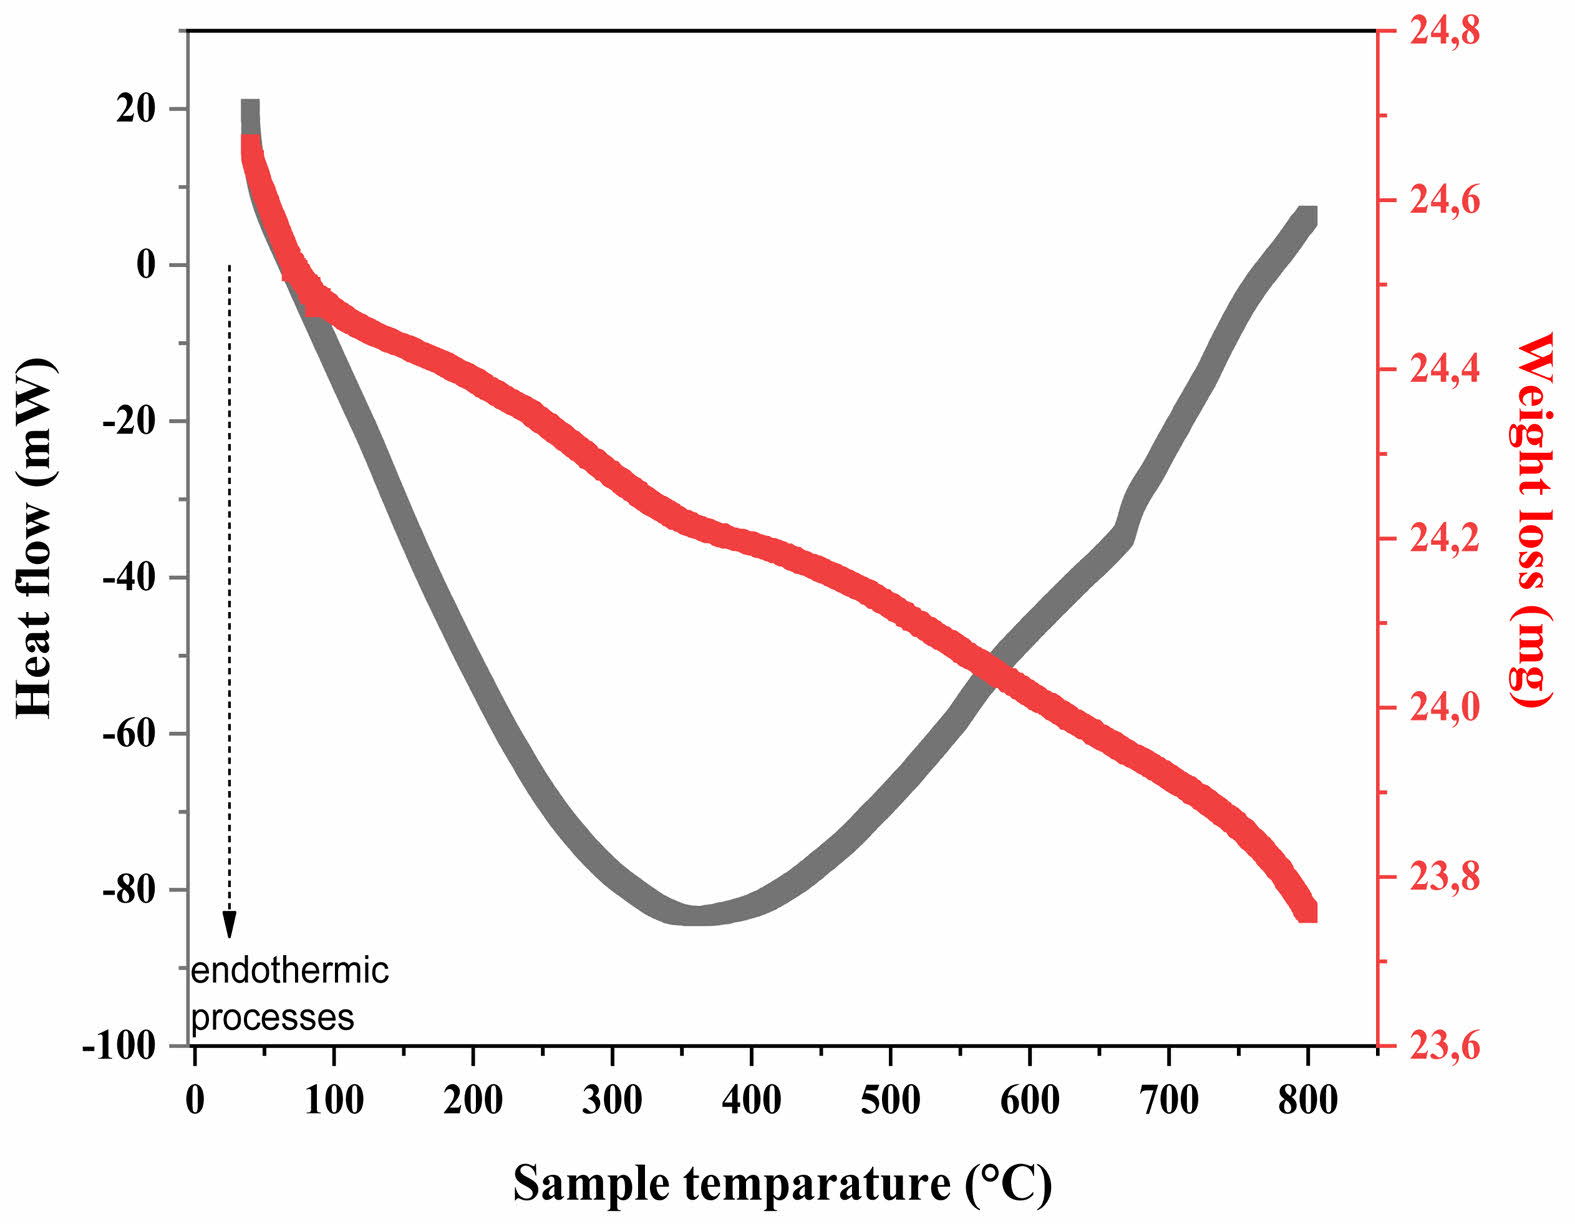
To investigate the thermal properties of the CTZ NCs, thermogravimetric analysis (TGA) was conducted. Additionally, to confirm the coordination of the CTZ nanocomposites, simultaneous differential scanning calorimetry (DSC) and TGA analyses were performed over a temperature range of 50 °C to 800 °C. The DSC‒TGA curve is shown in Fig. 10. According to this curve, a single endothermic peak was observed at 363 °C for the CTZ NCs. This peak, attributed to the dehydration process, decomposition of organic species, and crystallization, marks the beginning of the formation of the ternary nanocomposite phase at 363 °C [49]. Notably, weight loss occurred between 50 °C and 800 °C, which is believed to be associated with the transformation of the ternary nanocomposite due to the evaporation of absorbed water and decomposition of salts.
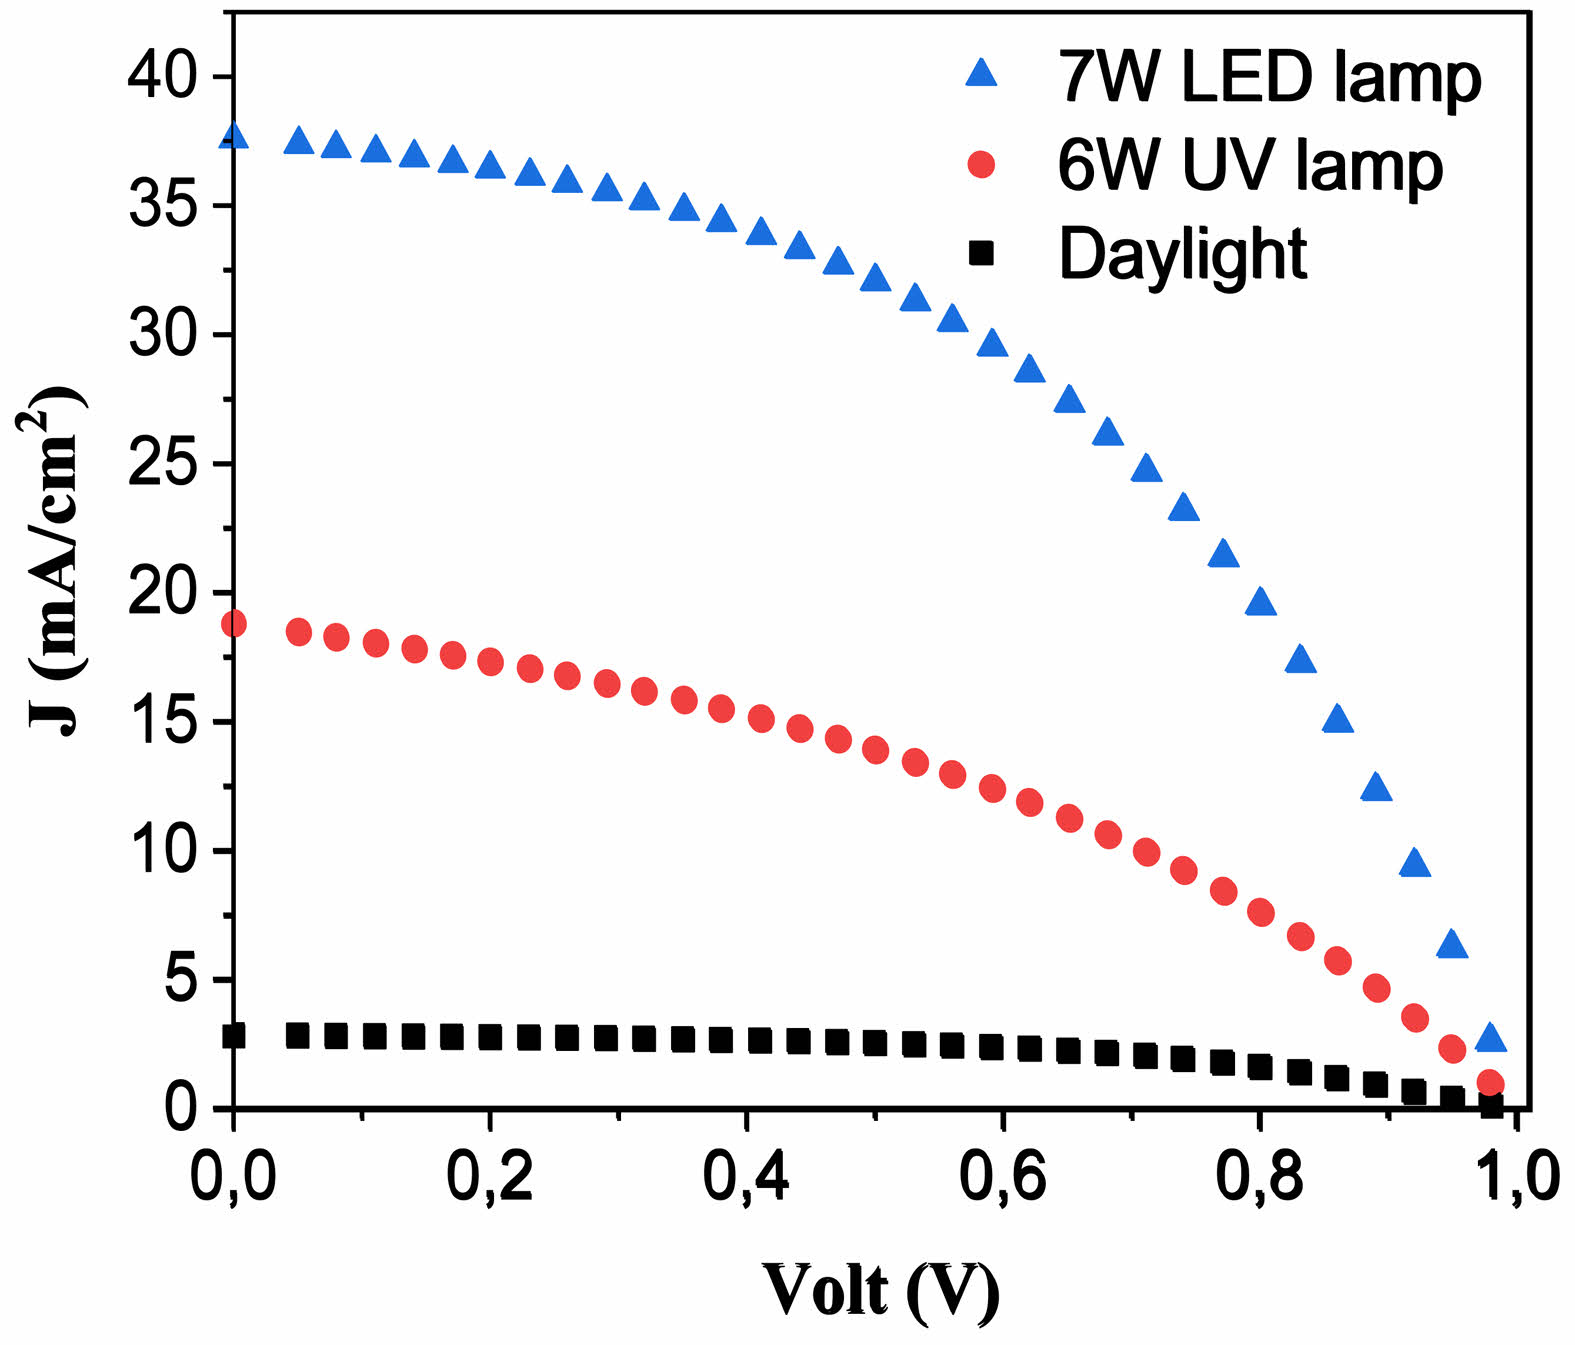
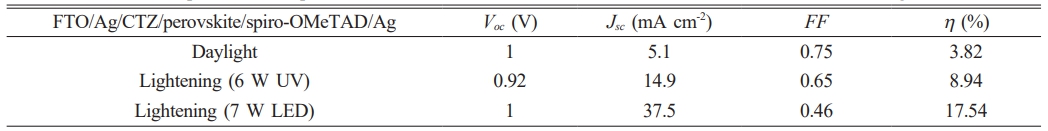
The current‒voltage (I‒V) characteristics of the PSC device were analyzed to evaluate key cell parameters, including the open-circuit voltage (Voc), short-circuit current (Jsc), fill factor (FF), and cell efficiency (η). Fig. 11 presents the J‒V curves of the PSCs assembled with the CTZ NC materials. J‒V measurements were conducted under daylight and illuminated conditions using two different light sources: a 6 W UV lamp and a 7 W LED lamp. The cell parameters for the PSC with the CTZ layer are listed in Table 3. The efficiency of the PSCs improved with the use of a 7 W LED lamp, reaching 17.54%. This enhancement in efficiency can be attributed to the reduced charge recombination observed in PSC devices incorporating the ternary CTZ NC material [50].
|
Fig. 2 XRD patterns of the CTZ NC material produced via a hydrothermal method. |
|
Fig. 3 SEM image of a CTZ NC taken at magnifications of (a) 5.00 K × and (b) 10.00 K ×. |
|
Fig. 4 SEM micrographs of the PSC device: (a) FTO/CTZ structure, (b) FTO/CTZ/perovskite structure, (c) FTO/CTZ/perovskite/ spiro-OMeTAD structure, and (d) device thickness. |
|
Fig. 5 EDS spectrum of the ternary CTZ NC material. |
|
Fig. 6 Plot of absorbance versus wavelength for the CTZ NC material. |
|
Fig. 7 Plots of (ahv)2 vs. hn for the CTZ NC. |
|
Fig. 8 Dependence of (a) n, (b) k, (c) ε1, and (d) ε2 of the CTZ NC material on the wavelength. |
|
Fig. 9 FTIR spectrum of the CTZ NC material. |
|
Fig. 10 DTA‒TGA curve of the CTZ NC material produced via the hydrothermal method. |
|
Fig. 11 J‒V characteristics of the PSC device (FTO/Ag/CTZ/ perovskite/spiro-OMeTAD/Ag) under daylight and with different light intensities: 6 W UV lamp and 7 W LED lamp. |
|
Table 2 Crystalline grain size and Full Width at Half Maximum (FWHM) values of the XRD peaks for the CTZ nanocomposite. |
|
Table 3 Photovoltaic parameters of perovskite solar cell-based CTZ NC materials with different intensities of light. |
In this work, a CTZ NC material was successfully synthesized via a hydrothermal method. XRD analysis confirmed its polycrystalline structure, comprising monoclinic CuO, tetragonal TiO₂, and hexagonal ZnO phases. Additionally, SEM images revealed a mesoporous surface with a nearly spherical morphology. The optical analysis demonstrated that the direct optical band gap energy of the CZT NC material was 3.06 eV. Furthermore, optical parameters such as the refractive index, extinction coefficient, and real and imaginary parts of the dielectric constants were evaluated based on the absorption data. The hydrothermally synthesized CTZ NC material was employed for PSC fabrication using the dip coating method. The photovoltaic performance analysis showed that the PSC device fabricated with the ternary CTZ NC material exhibited an efficiency of 17.54%. These findings highlight the potential of a ternary electron transport layer synthesized via hydrothermal methods and applied via dip coating as an alternative approach for enhancing solar cell efficiency.
Saniye Tekerek: Conceptualization, Project administration, Resources, Software, Data curation, Methodology, Validation, Writing – original draft, Supervision, Formal analysis, Investigation, Writing – review & editing.
Fatma Göde: Investigation, Formal analysis, Software, Writing – original draft, Writing – review & editing, Validation Esra Beyza Yılmaz: Formal analysis, Investigation.
This work was supported by a grant from the Kahramanmaras Sutcu Imam University Scientific Research Projects Unit, Project Number: 2023/3-1 YLS.
No datasets were generated or analysed during the current study.
Conflict of interest The authors declare that they have no competing interests.
- 1. M.I. Hossain, Y. Tong, A. Shetty, and S. Mansour, Sol. Energy. 265 (2023) 112128.
-

- 2. M.A. Aditama, M. Nu'man Al Farisi, and P. Sambegoro, Sol. Energy. 266 (2023) 112156.
-
- 3. S.Y. Yuan, H. Zhao, Y.T. Wang, Z.Z. Li, X.D. Wang, and W.P. Cao, J. Solid State Chem. 328 (2023) 124299.
-
- 4. C. Duan, M. Zhao, R. El-Bashar, S.S.A. Obayya, M. Hameed, and J. Dai, Solid-State Electron. 210 (2023) 108799.
-
- 5. A.K. Chaudhary, S. Verma, and R.K. Chauhan, Mater. Today: Proc. 104 (2024) 40-44.
-
- 6. S. Baruah, J. Borah, S. Bhattarai, and S. Maity, Sol. Energy. 263 (2023) 111939.
-
- 7. X. Gu, Y. Li, Y. Mu, M. Zhang, T. Lu, and P. Wang, RSC Adv. 17 (2018) 9409.
-
- 8. J. Zhang, Q. Daniel, T. Zhang, X. Wen, B. Xu, L. Sun, U. Bach, and Y.B. Cheng, ACS Nano. 12 (2018) 10452.
-
- 9. Q. Liu, L. Fan, Q.E. Zhang, A.A. Zhou, B. Wang, H. Bai, and T. Zhang, ChemSusChem. 10 (2017) 3098-3104.
-
- 10. F. Bastianini, A.I.C. Hidalgo, D.Z. Hook, J.A. Smith, D. Cumming, and A. Dunbar, Sol. Energy. 268 (2024) 112318.
-
- 11. M.I. Khan, A. Mujtaba, S. Hussain, M. Atif, I.-ul haq, A.I. Qureshi, W. Shahid, and A. Ali, Phys. B: Condens. Matter. 678 (2024) 415758.
-
- 12. Y. Zou, C. He, P. Zhao, Q. Bai, H. Luo, Y. Bai, and S. Zhao, J. Phys. Chem. C. 127 (2023) 21999-22014.
-
- 13. L. Zhang, X. Bao, C. He, Y. Bai, and S. Zhao, J. Phys. Chem. C. 127 (2023) 14599-14612.
-
- 14. G. Manibalan, G. Murugadoss, R. Jayavel, M.R. Kumar, and M.A. Pugazhendhi, Environ. Res. 228 (2023) 115853.
-
- 15. L.C. Chen, C.C. Chen, K.C. Liang, S.H. Chang, Z.L. Tseng, S.C. Yeh, and C.G. Wu, Nanoscale Res. Lett. 11 (2016) 1-7.
-
- 16. U. Ali, A.A. Qureshi, S. Javed, G. ur Rehman, and M.A. Akram, Results Opt. 12 (2023) 100486.
-
- 17. M.Z.U. Shah, M. Sajjad, H. Hou, S. ur Rahman, A. Mahmood, U. Aziz, and A. Shah, J. Energy Storage. 55 (2023) 105492.
-
- 18. C.K. Maitya, G. Hatuia, K. Vermab, G. Udayabhanua, D.D. Pathaka, and G.C. Nayaka, Vacuum. 157 (2018) 145-154.
-
- 19. A. Chatterjee, A.V. Ravindra, G.K. Kumar, and C. Rajesh, J. Indian Chem. Soc. 99 (2022) 100653.
-
- 20. M. Hajji, M. Ajili, N. Jebbari, S. Dabbabi, A. Garcia-Loureiro, and N.T. Kamoun, Mater. Lett. 357 (2024) 135806.
-
- 21. A. Yousefinia, M. Khodadadi, and S. Mortazavi-Derazkola, Environ. Technol. Innov. 32 (2023) 103340.
-
- 22. O. Długosz, N. Wąsowicz, K. Szostak, and M. Banach, Mater. Chem. Phys. 260 (2021) 124150.
-
- 23. U. Baig, M.A. Dastageer, M.A. Gondal, and A.B. Khalil, J. Photochem. Photobiol. B. 242 (2023) 112698.
-
- 24. K. Ahmad and H. Kim, Mater. Sci. Eng. B. 289 (2023) 116227.
-
- 25. B. Tripathi, S. Chauhan, M.Z.A. Yahya, S.N.F. Yusuf, M. Diantoro, and R.C. Singh, Ionics. (2025) 1-15.
-
- 26. M. Zhang, M. Lyu, H. Yu, J.-H. Yun, Q. Wang, and L. Wang, Chem. Eur. J. 20 (2014) 1-7.
-
- 27. M.R. Ahmadian-Yazdi, F. Zabihi, M. Habibi, and M. Eslamian, Nanoscale Res. Lett. 11 (2016) 408.
-
- 28. Z. Wang, X. Zhu, J. Feng, C. Wang, C. Zhang, X. Ren, S. Shashank Priya, S.F. Liu, and D. Yang, Adv. Sci. 8[13] (2021) 2002860.
-
- 29. D. Yang, X. Zhang, K. Wang, C. Wu, R. Yang, Y. Hou, Y. Jiang, S. Liu, and S. Priya, Nano Lett. 19[5] (2019) 3313-3320.
-
- 30. Y. Deng, E. Peng, Y. Shao, Z. Xiao, Q. Dong, and J. Huang, Energy Environ. Sci. 8[5] (2015) 1544-1550.
-
- 31. A. Listorti, E.J. Juarez-Perez, C. Frontera, V. Roiati, L. Garcia-Andrade, S. Colella, A. Rizzo, P. Ortiz, and I. Mora-Sero, J. Phys. Chem. Lett. 6[9] (2015) 1628-1637.
-
- 32. S. Tekerek, J. Nanopart. Res. 26 (2024) 216.
-
- 33. K. Kara, D.A. Kara, C. Kırbıyık, M. Ersoz, O. Usluer, A. L. Briseno, and M. Kus, RSC Advances. 6 (2016) 26606-26611.
-
- 34. S.H. Chaki, M.P. Deshpande, and J.P. Tailor, Thin Solid Films 550 (2014) 291-297.
-
- 35. X. Zhang, Y. Zhang, Y. Wang, Q. Wang, Z. Liu, R. Geng, H. Wang, W. Jiang, and W. Ding, J. Alloys Compd. 929 (2022) 167278.
-
- 36. P. Maheswari, S. Sugapriya, N. Krishnaveni, and T.S. Senthil, Braz. J. Phys. 52 (2022) 142.
-
- 37. M. Sundaram, S. Kalpana, V. Sivaganesan, and E. Nandhakumar, Mater. Res. Express. 6[12] (2019) 125043.
-
- 38. S.H. Cho, Journal of Ceramic Processing Research. 17[1] (2016) 41-45.
-
- 39. M.A. Alam, S. Ahmed, R.K. Bishwas, S. Mostofa, and S.A. Jahan, South African Journal of Chemical Engineering. 51 (2025) 68-77.
-
- 40. J. Tauc, “Amorphous and Liquid Semiconductors” (Plenum Press, New York, 1974).
-
- 41. S. Perkowitz, “Optical Characterizations of Semiconductors: Infrared, Raman, and Photoluminescence Spectroscopy” (Academic Press Inc, San Diego, 1993).
-
- 42. T.S. Moss, G.J. Burrell, and B. Ellis, “Semiconductor Opto-electronics” (John Willey & Sons, New York, 1973).
-
- 43. F. Wooten, “Optical Properties of Solids” (Academic Press, New York, 1972).
-
- 44. H. Kumar, and R. Rani, International Letters of Chemistry, Physics and Astronomy. 14 (2013) 26-36.
-
- 45. B. Khodadadi, A. Yeganeh Faal, and A. Shahvarughi, Journal of Applied Chemical Research. 13[3] (2019) 51-65.
- 46. S. Anwaar, Q. Maqbool, N. Jabeen, M. Nazar, F. Abbas, B. Nawaz, T. Hussain, and S.Z. Hussain, Frontiers in plant science. 7 (2016) 1330.
-
- 47. N. Jayarambabu, B.S. Kumari, K.V. Rao, and Y.T. Prabhu, Int. J. Multidiscip. Adv. Res. Trends. 2[1] (2015) 273-282.
- 48. O. Gultepe, F. Atay, and Z. Dikmen, Materials Chemistry and Physics. 307 (2023) 128170.
-
- 49. M.J. Uddin, F. Cesano, A.R. Chowdhury, T. Trad, S. Cravanzola, G. Martra, L. Mino, A. Zecchina, and D. Scarano, Frontiers in Materials. 7 (2020) 192.
-
- 50. S. Yasin, T. Al Zoubi, and M. Moustafa, Optik. 229 (2021) 166258.
-
 This Article
-
2025; 26(2): 286-294
Published on Apr 30, 2025
- 10.36410/jcpr.2025.26.2.286
- Received on Feb 28, 2025
- Revised on Mar 15, 2025
- Accepted on Apr 1, 2025
Services
- Abstract
introduction
experimental
characterization
results and discussion
conclusions
- Author Contributions
- Funding
- Data availability statement
- Declaration
- References
- Full Text PDF
Shared
Correspondence to
- S. Tekerek
-
Kahramanmaraş Sütçü İmam University, Vocational School of Health Services, Department of Medical Services and Techniques, Kahramanmaraş 46050, Türkiye
Tel : +90 (344) 300 47 26 Fax: +90 (344) 300 28 02 - E-mail: saniye1580@gmail.com
Clean-Energy Research Institute(CRI), Hanyang University, 222, Wangsimni-ro, Seongdong-gu, Seoul, 04763, Korea
E-mail: jcpr@hanyang.ac.kr