


- Chromogenic mechanisms of the celadon glaze for the Southern Song Official Kilns
Zhipeng Chenga,b, Zhenxin Zhangb, Huan Yuc, Kun Liud, Yan Xua, Weixia Donga,*, Jianer Zhoua and Qifu Baoa,*
aJingdezhen Ceramic University, Jingdezhen 333400, Jiangxi, China
bJingdezhen Vocational University of Art, Jingdezhen 333000, Jiangxi, China
cJingdezhen University, Jingdezhen 333032, Jiangxi, China
dKey Laboratory of Inorganic Coating Materials CAS, Shanghai Institute of Ceramics, Chinese Academy of Sciences (SICCAS), Shanghai 200050, P. R. ChinaThis article is an open access article distributed under the terms of the Creative Commons Attribution Non-Commercial License (http://creativecommons.org/licenses/by-nc/4.0) which permits unrestricted non-commercial use, distribution, and reproduction in any medium, provided the original work is properly cited.
The glaze color of Southern Song Guan ware is soft and lustrous like jade. While extensive studies have focused on its historical and artistic value, the underlying mechanisms of its color formation have not been systematically explored. This study investigates the color characteristics and formation mechanisms of the Guan ware glaze by analyzing the types and oxidation states of iron ions, as well as the microstructural phase separation. The results show that, despite significant variations in the RO and R2O components of the glaze, it falls within the typical categories of calcium and calcium-alkali glazes. The color formation mechanism is primarily driven by the interaction between the Fe2+/Fe3+ ratio and structural coloration effects. The blue hues of Qing-tian (sky green) and Fen-lu (pinkish green) glazes arise from a higher Fe2+/Fe3+ ratio and phase separation structures around 50 nm, which induce Rayleigh scattering. In contrast, the pale yellow color of Mi-huang (beige yellow) glaze is formed by a lower Fe2+/Fe3+ ratio and phase separation structures around 180 nm. Additionally, the presence of crystals, bubbles, and phase separations enhances the emulsification effect, contributing to the unique jade-like texture of the glaze.
Keywords: Southern Song Official Kiln, Ancient celadon glaze, Color mechanism, Microstructure, Fe3+/Fe2+.
The Song Dynasty’s official kilns, one of China’s Five Famous Kilns (along with Ru, Ge, Ding, and Jun kilns), were directly managed by the government and primarily produced ceremonial and daily-use porcelain exclusively for the emperor [1-4]. The celadon glaze of these wares is unique, with a jade-like quality, translucent and lustrous, highly appreciated by people throughout history [5, 6]. The rich archaeological sites and artifacts of the Southern Song official kilns provide valuable resources for studying the characteristics of their celadon glaze. However, despite research on the historical and artistic value of Southern Song official kilns’ celadon, the coloration mechanism of celadon glaze, especially the role of iron ions, has not been thoroughly explored.
Previous scientific and technological studies mainly focused on the composition, iron ion valence, microstructure and emulsion effect, etc. Wood et al. [1, 7-9] found celadon glaze belonged to the low-iron and low-titanium green glazes. Li Weidong et al. [10, 11] reported that the split phase and crystals make the celadon glaze a high emulsion effect. Zhao Weijuan et al. [12] showed that the celadon glaze color was mainly related to Fe2+/Fe3+ ratio by neutron activation analysis (NAA). Shi Lei et al. [13, 14] found that separate-phase amorphous structures make the glaze blue. However, there is a lack of comprehensive analysis of different color glazes in the Southern Song Official Kilns from the perspectives of iron ion state and microstructure. Therefore, there are still many technical difficulties in imitating celadon glaze in Southern Song Dynasty Imperial Kiln. It is interesting for obtaining the interrelationship law between the chemical composition, the state of iron ions, the microstructure and the coloration and thus providing theoretical basis to the imitation process technology of celadon glaze in the Southern Song Dynasty kilns.
This paper selects three typical color samples of celadon glaze from the Southern Song Official Kilns: sky green, pinkish green, and beige yellow. A systematic study of their coloring mechanisms is conducted, summarizing the interrelationships between the chemical composition of the glaze, the state of iron ions, the microstructure, and the glaze color. Based on relevant literature and experimental results, the colorimetric characteristic ranges for sky green, pinkish green, and beige yellow glazes are derived. This provides a theoretical foundation for the imitation process technology of Southern Song celadon glazes and offers an important reference for the identification of celadon glaze color types.
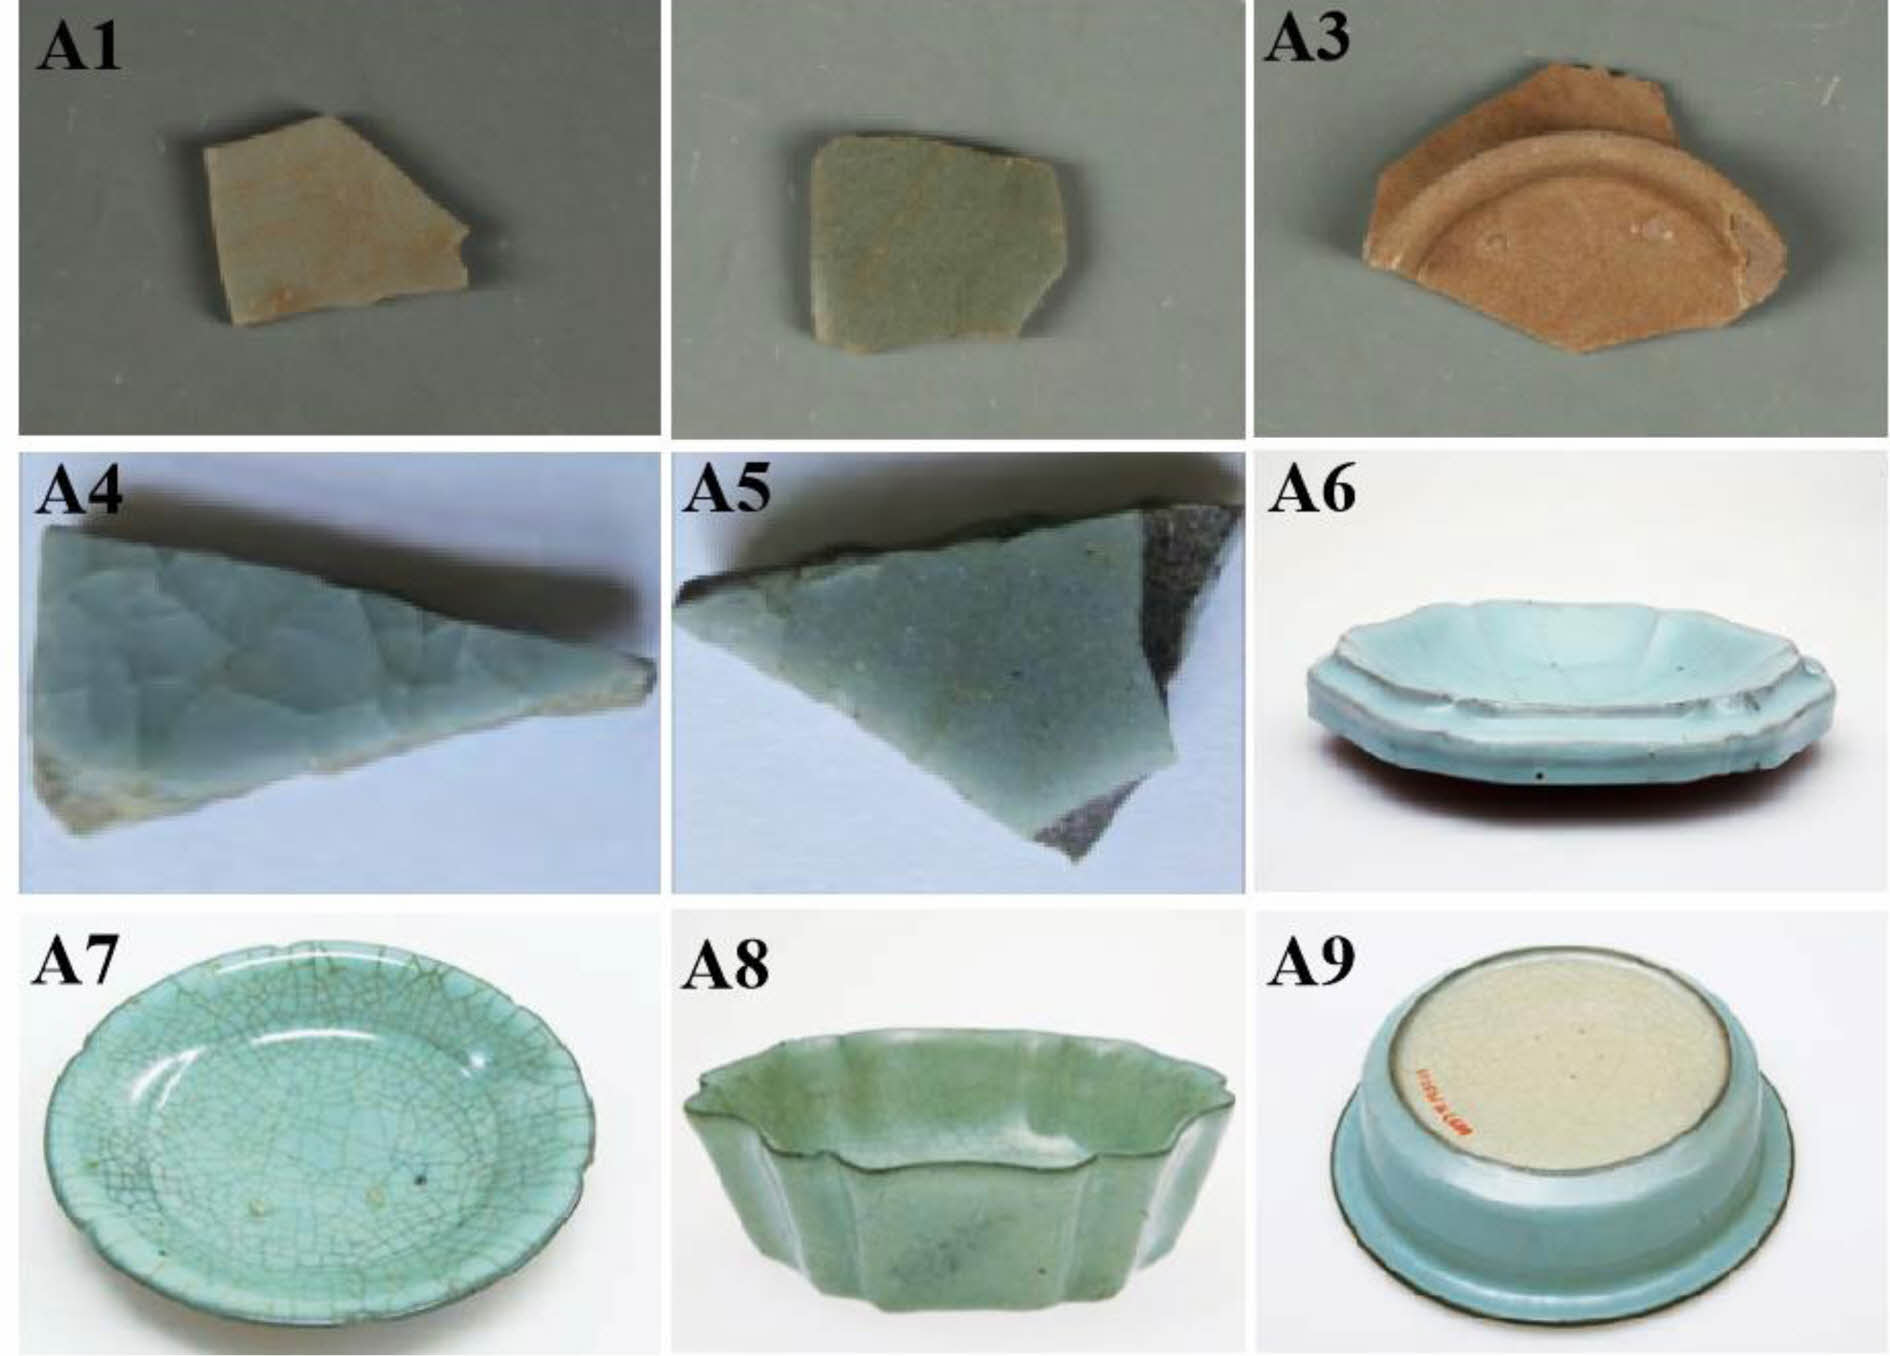
Three pieces of ancient celadon porcelain glaze (numbered A1, A2, A3) relicts in the Southern Song Official Kilns under the Jiaotanxia in Hangzhou, are provided by the Institute of Famous Porcelain of the Song Dynasty in Xiaoshan, Zhejiang Province. two pieces of celadon glaze relicts in the Southern Song Dynasty Guan kiln (numbered A4, A5) researched by Shi Pei [15] from the University of Science and Technology in Shaanxi Province and Four pieces of ancient celadon porcelain glaze relicts with different colors (numbered A6, A7, A8, A9) come from the National Palace Museum [16]. The photos and its appearance characteristics of ancient celadon glaze relicts are shown in Fig. 1 and Table 1.
The color of the specimens was measured using a whiteness colorimeter (Beijing Kangguang WSD-3C, China). UV-Vis-NIR reflection and absorption spectra of the opalescent glazed surfaces were obtained using a spectrophotometer (Agilent Cary 5000, USA). The glaze’s physical phase composition was qualitatively analyzed with an X-ray diffractometer (XRD, Bruker D8 Advance, Germany). Reflectance spectra of the glaze were recorded using a UV-visible photometer (Perkin-Elmer Lambda 850, USA). Bubble size distribution was analyzed with ImagePro Plus image processing software. X-ray photoelectron spectroscopy (XPS, Thermo Fisher Escalab 250xi, USA) was employed to investigate the valence state of iron in the glaze. Microstructural characterization of the samples, etched with 5 vol% HF for 20 s, was performed using scanning electron microscopy (SEM, JEOL JSM-6700F, Japan) and transmission electron microscopy (TEM, JEOL JEM-2010, Japan).
|
Fig. 1 Digital photos of ancient celadon glaze relicts in the Southern Song Official Kilns [11, 12]. |
|
Table 1 Appearance characteristics of ancient porcelain pieces from Official Kilns in the Southern Song Dynasty [11, 12]. |
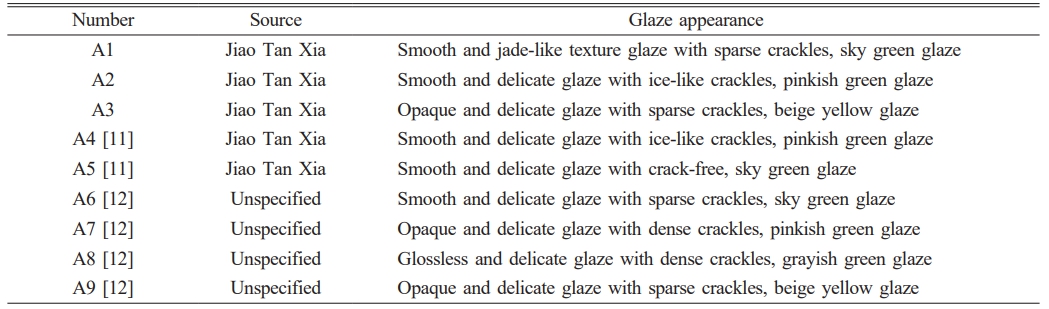
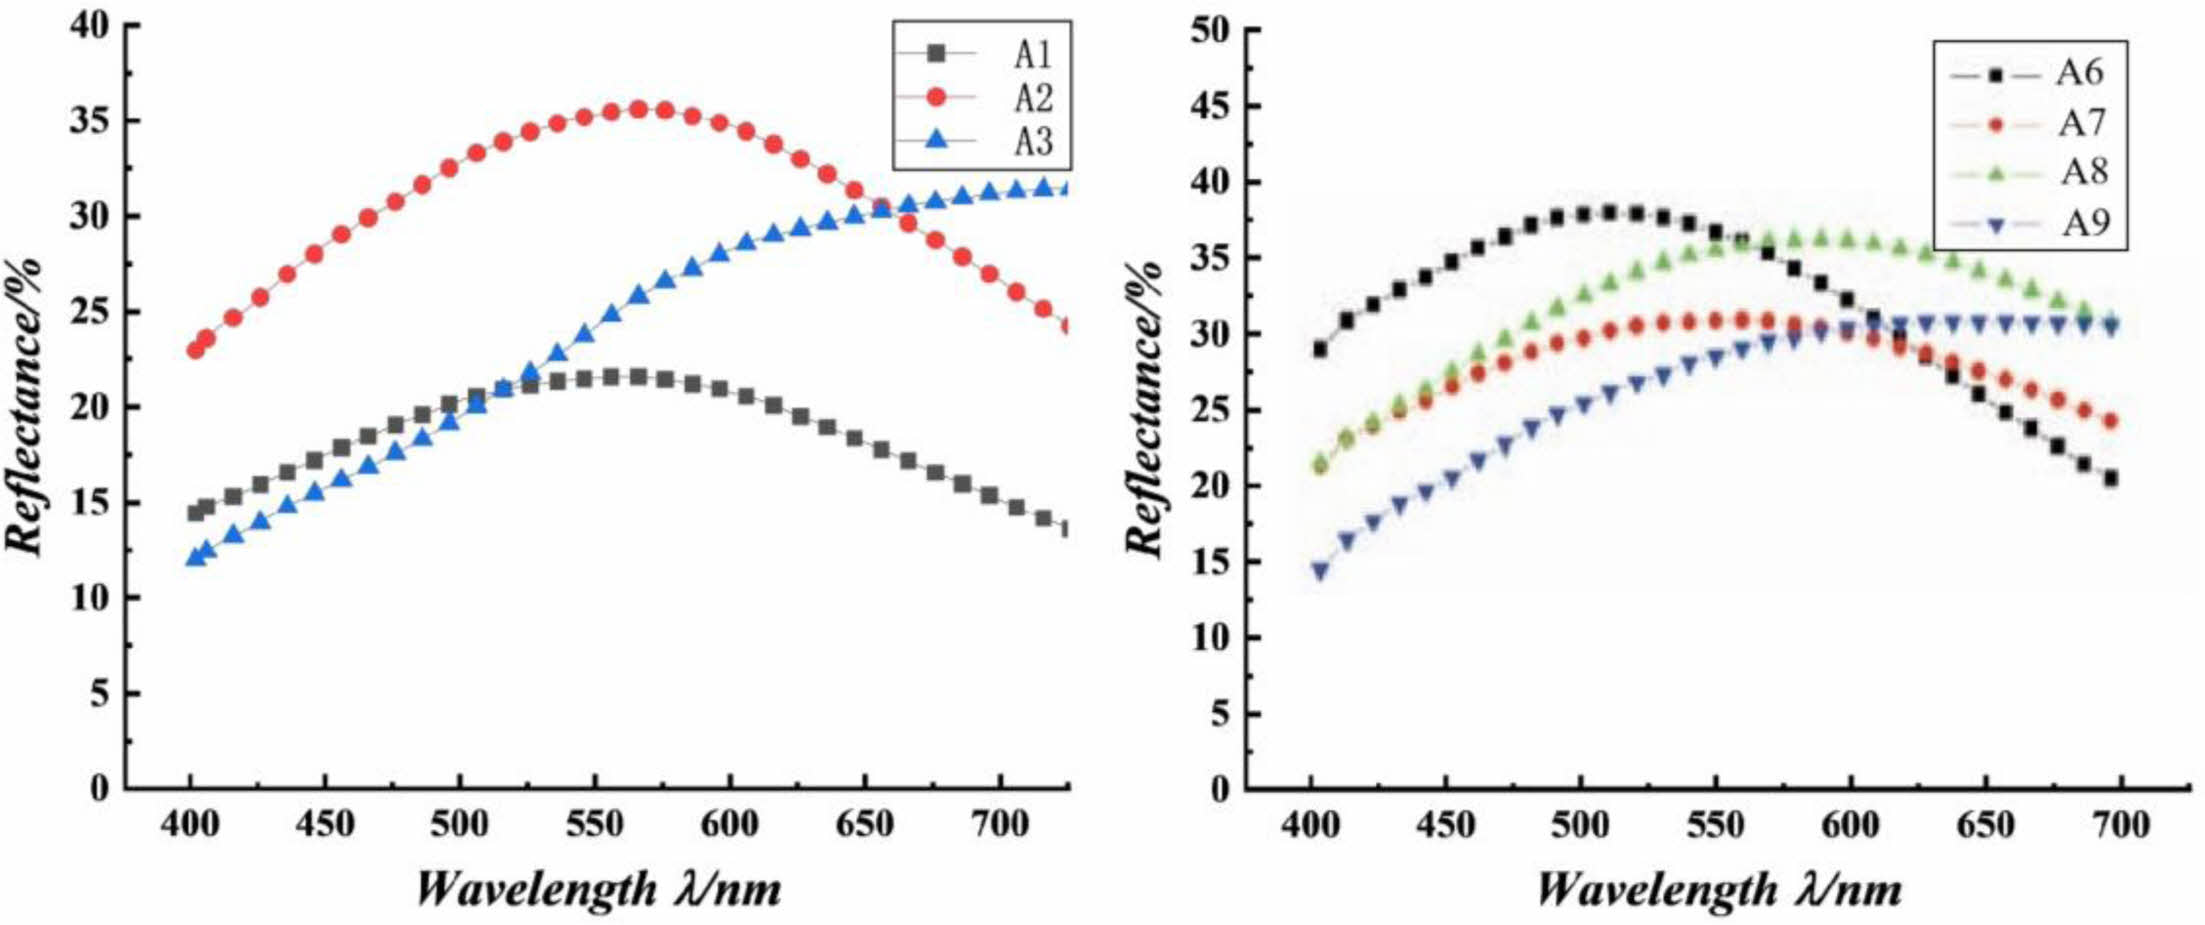
Fig. 2 shows UV-visible reflectance spectra of ancient celadon glaze in the Southern Song Official Kilns. Combined with Fig. 1 and Table 1, it could be seen that the color of the celadon glaze in the Southern Song official kilns could be divided into four categories: sky green, pinkish green, grayish green and beige yellow, which is similar with the results in the literature [17]. The reflectance peak of A1, A2, A6 and A7 samples are about 550 nm, respectively, which presents the sky green or pinkish green color. Compared with A1, A2, A6 and A7 samples, the reflective peak of A8 sample increases at about 600 nm, which indicates a grayish green. The reflective peak of A3 and A9 sample further increase about 700 nm, indicating the beige yellow color [16].
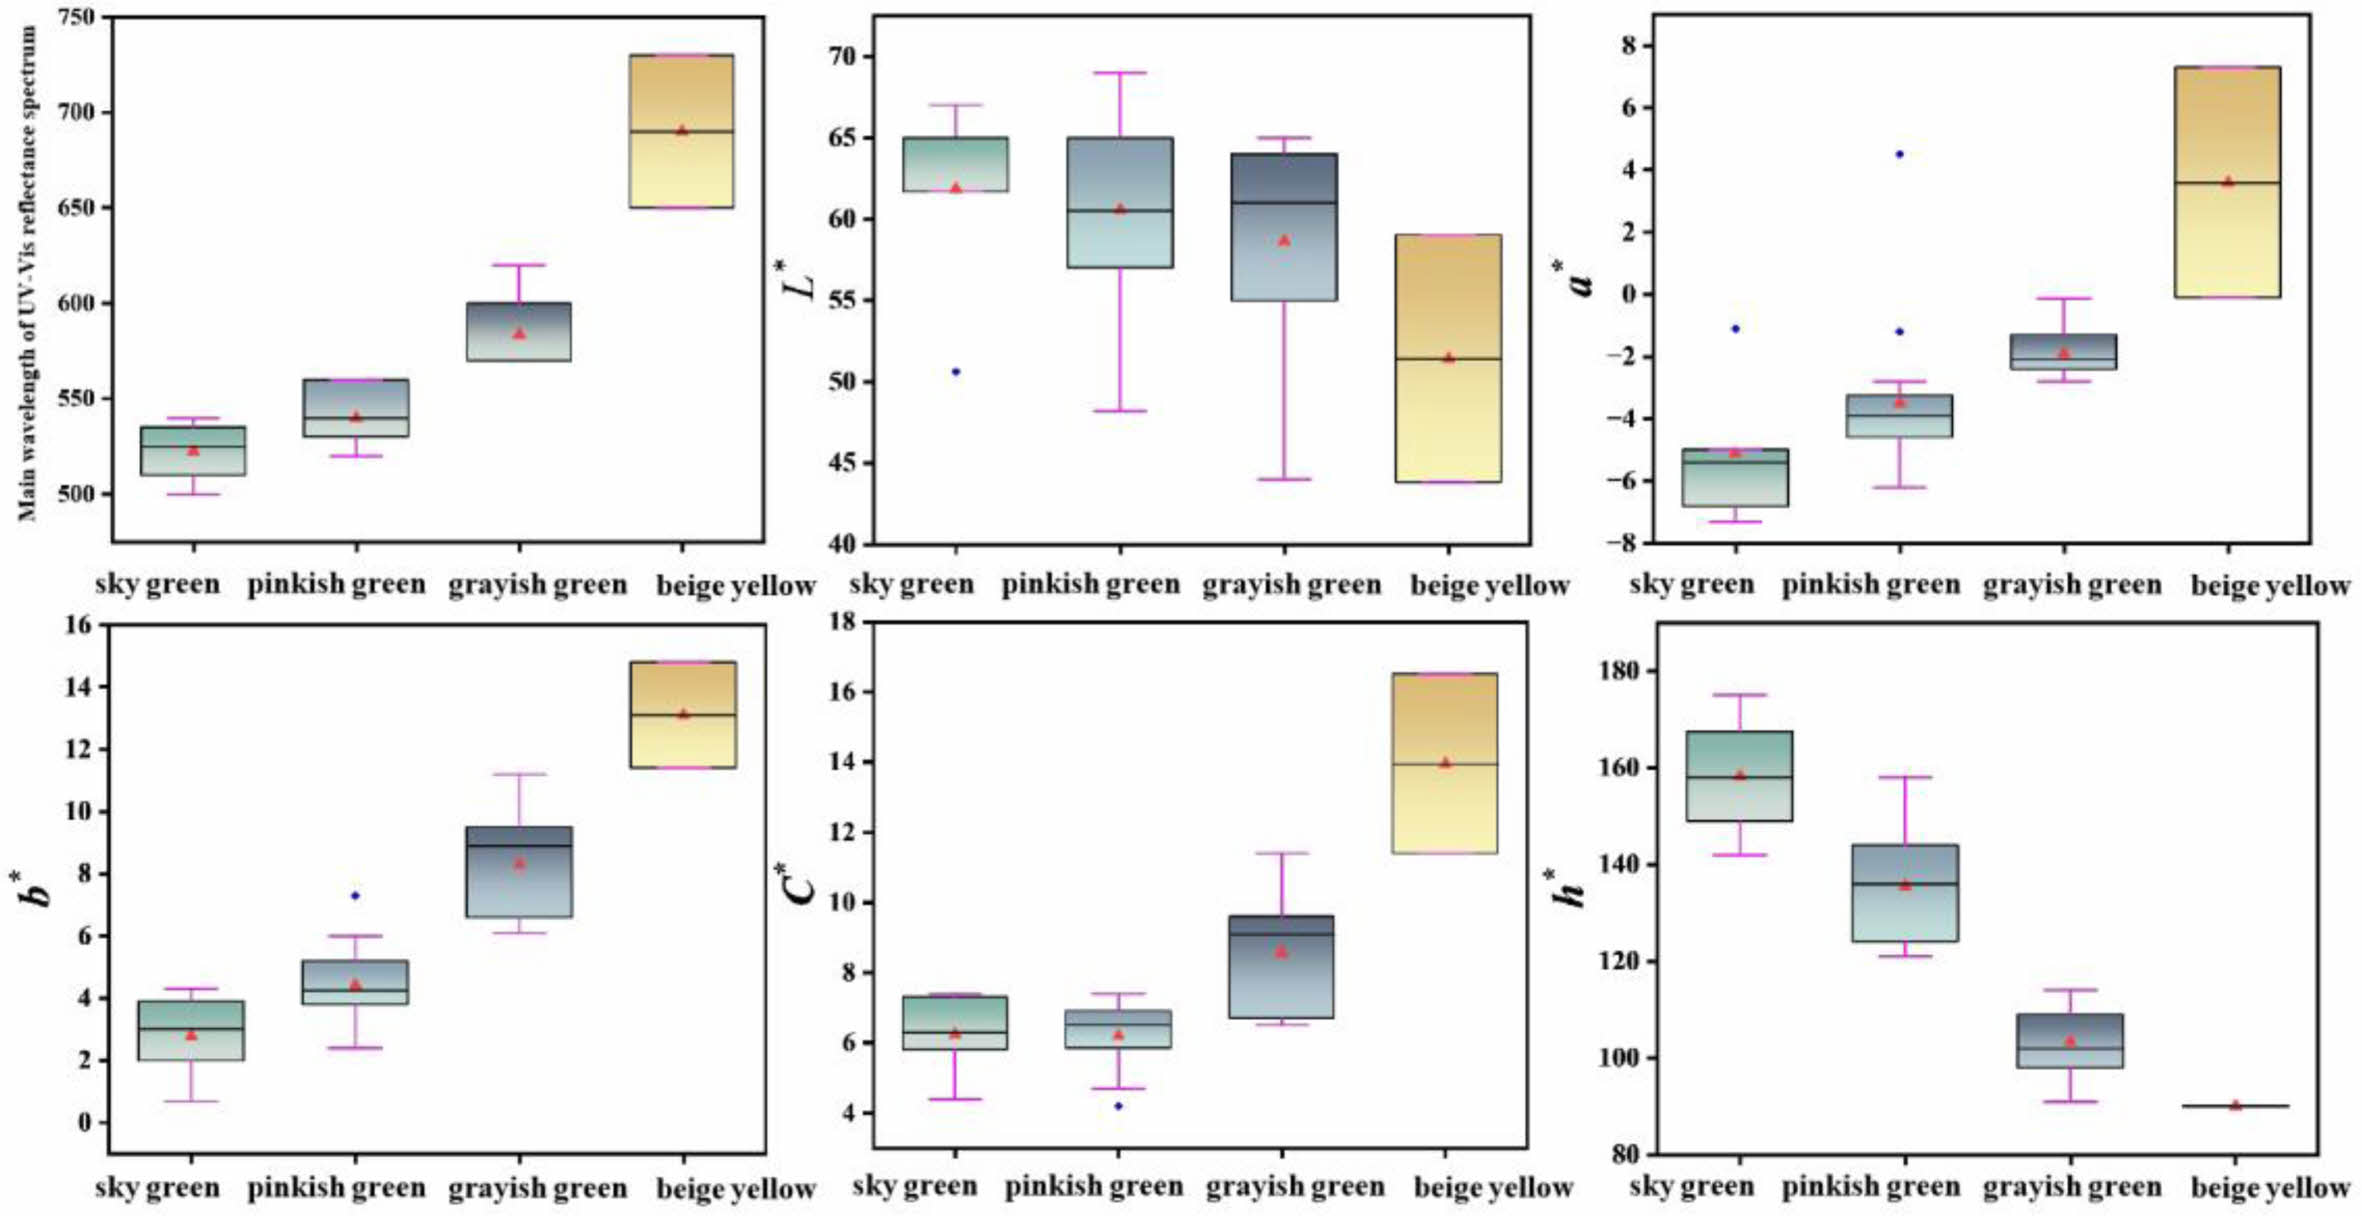
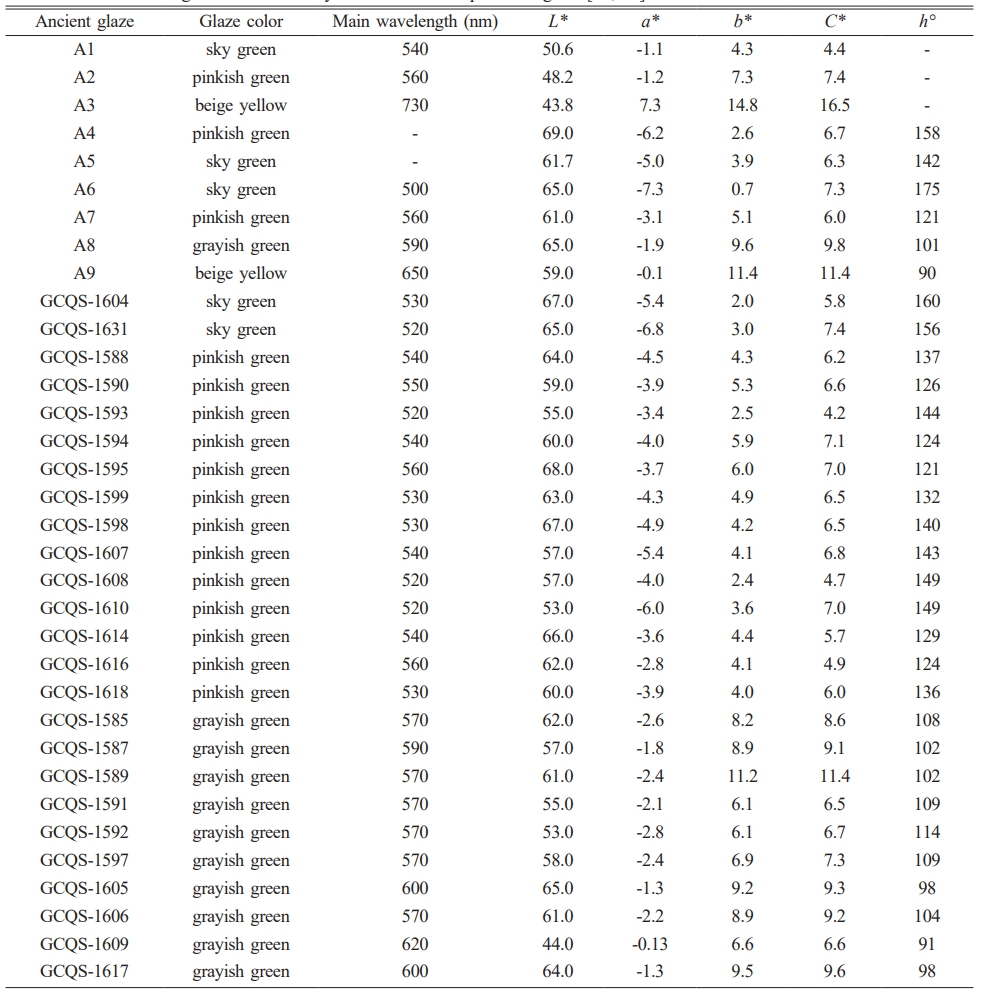
In order to conclude the chromaticity characteristics of celadon glaze in the Southern Song Official Kilns, Table 2 shows the main wavelength and chromaticity values of ancient celadon glaze. The corresponding main wavelength and chromaticity values by the statistical analysis and its corresponding box plots are analysized as shown in Table 1S and Fig. 3. It can be seen that the range of L* and C* values of all the samples are relatively close. The main wavelength and chromaticity values (a*, b*, h°) of all the samples is different, which can be used as a criterion for distinguishing the different colors. The main wavelength range of different color glazes are as follows: sky green (500~540 nm), pinkish green (520~560 nm), grayish green (570~620 nm), beige yellow (650~730 nm); the a* values of different color glazes are as follows: sky green (-7.3~1.1), pinkish green (-6.2~-1.2), grayish green (-2.8~-0.1), beige yellow (0.1~7.3), the a* values of sky green, pinkish green and grayish green glazes are all negative indicating a greenish tone, while the a* value of beige yellow glaze is positive indicating a reddish tone; the b* values of the different color glazes are as follows: sky green (0.7~4.3), pinkish green (2.4~7.3), grayish green (6.1~11.2), beige yellow (11.4~14.8). It can be seen that the yellow tone of the sky green glaze is the weakest visually, while the yellow tone of the beige yellow glaze is the strongest visually, which is consistent with the actual color of the glaze. h° value of the glaze locates in the range of 90~156°, which indicates yellow-green region (yellow area ≈ 75~95°, green area ≈ 95~235°). h° value of the glaze is in sequence: sky green (142~156°) > pinkish green (121~149°) > grayish green (91~114°) > beige yellow (90°). h° value of the sky green, pinkish green and grayish green is large for 91~156°, which is close to the green area.
In summary, grayish green glaze and beige yellow glaze can be discriminated by wavelength value or h°. The main wavelength and h° of grayish green and beige yellow glaze is 570~620 nm 650~730 nm, 91~114° and 90°, respectively. The chromaticity and wavelength value of sky green and pinkish green glaze is relatively close. However, it can be roughly discriminated by h°. h° of the sky and pinkish green is 142~156° and 121~149°, respectively. If h° is 149~156°, it can be determined based on the main wavelength and b* value.
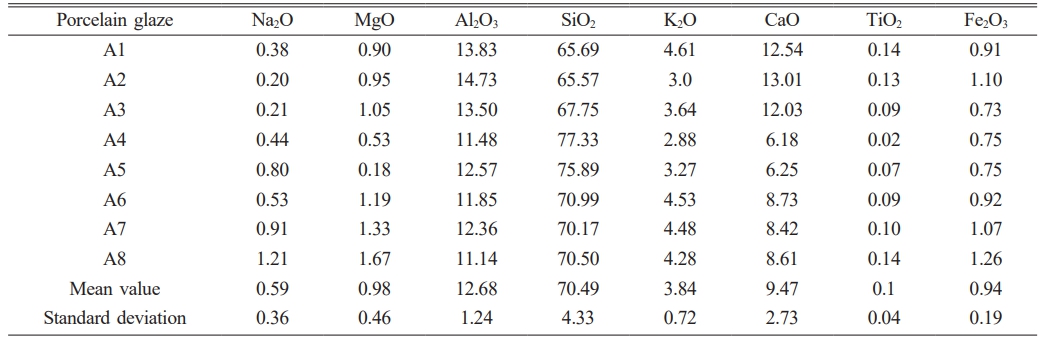
From Table 3, it can be seen that the elemental content of almost all the sample is relatively close. MgO content is mainly concentrated in 1 wt% or so, and the standard deviation is only 0.46, indicating that MgO content is stable. The actual and average Fe2O3 content of the glaze is in the range of 0.73~1.26 wt% and 0.94 wt%, espectively, which has a small standard deviation, indicating the low iron is the main colorant for ancient celadon glaze. SiO2 and Al2O3 content of all almost the samples is 65~71 wt% and 11~15 wt%. Hence, thus the standard deviation is large for 4.33% and 1.24%, respectively, indicating that SiO2 and Al2O3 content in the glaze composition is unstable. In addition, the alkaline earth metal (RO, CaO+MgO) and alkaline metal (R2O, K2O+Na2O) as the main flux have a large standard deviation value of 3.19 and 1.08, respectively. Based on the chemical composition (Table 3), b value of the sample is calculated by the equation b = (RO/(RO+R2O)). b value of A1~A5 glaze is 0.82, 0.88, 0.85, 0.77 and 0.71, respectively. b value of A6~A8 glaze is 0.77, 0.75 and 0.75, respectively. b value range of all the sample is located in 0.71~0.88, which belongs to the calcium glaze (b ≥ 0.76) and calcium-alkali glaze (0.76 > b ≥ 0.50) series [18]. Based on the experimental results, it could be concluded that the celadon glaze color (i.e. sky green, pinkish green, grayish green and beige yellow) in the Southern Song dynasty is affected by chemical composition and low Fe2O3 content, etc.
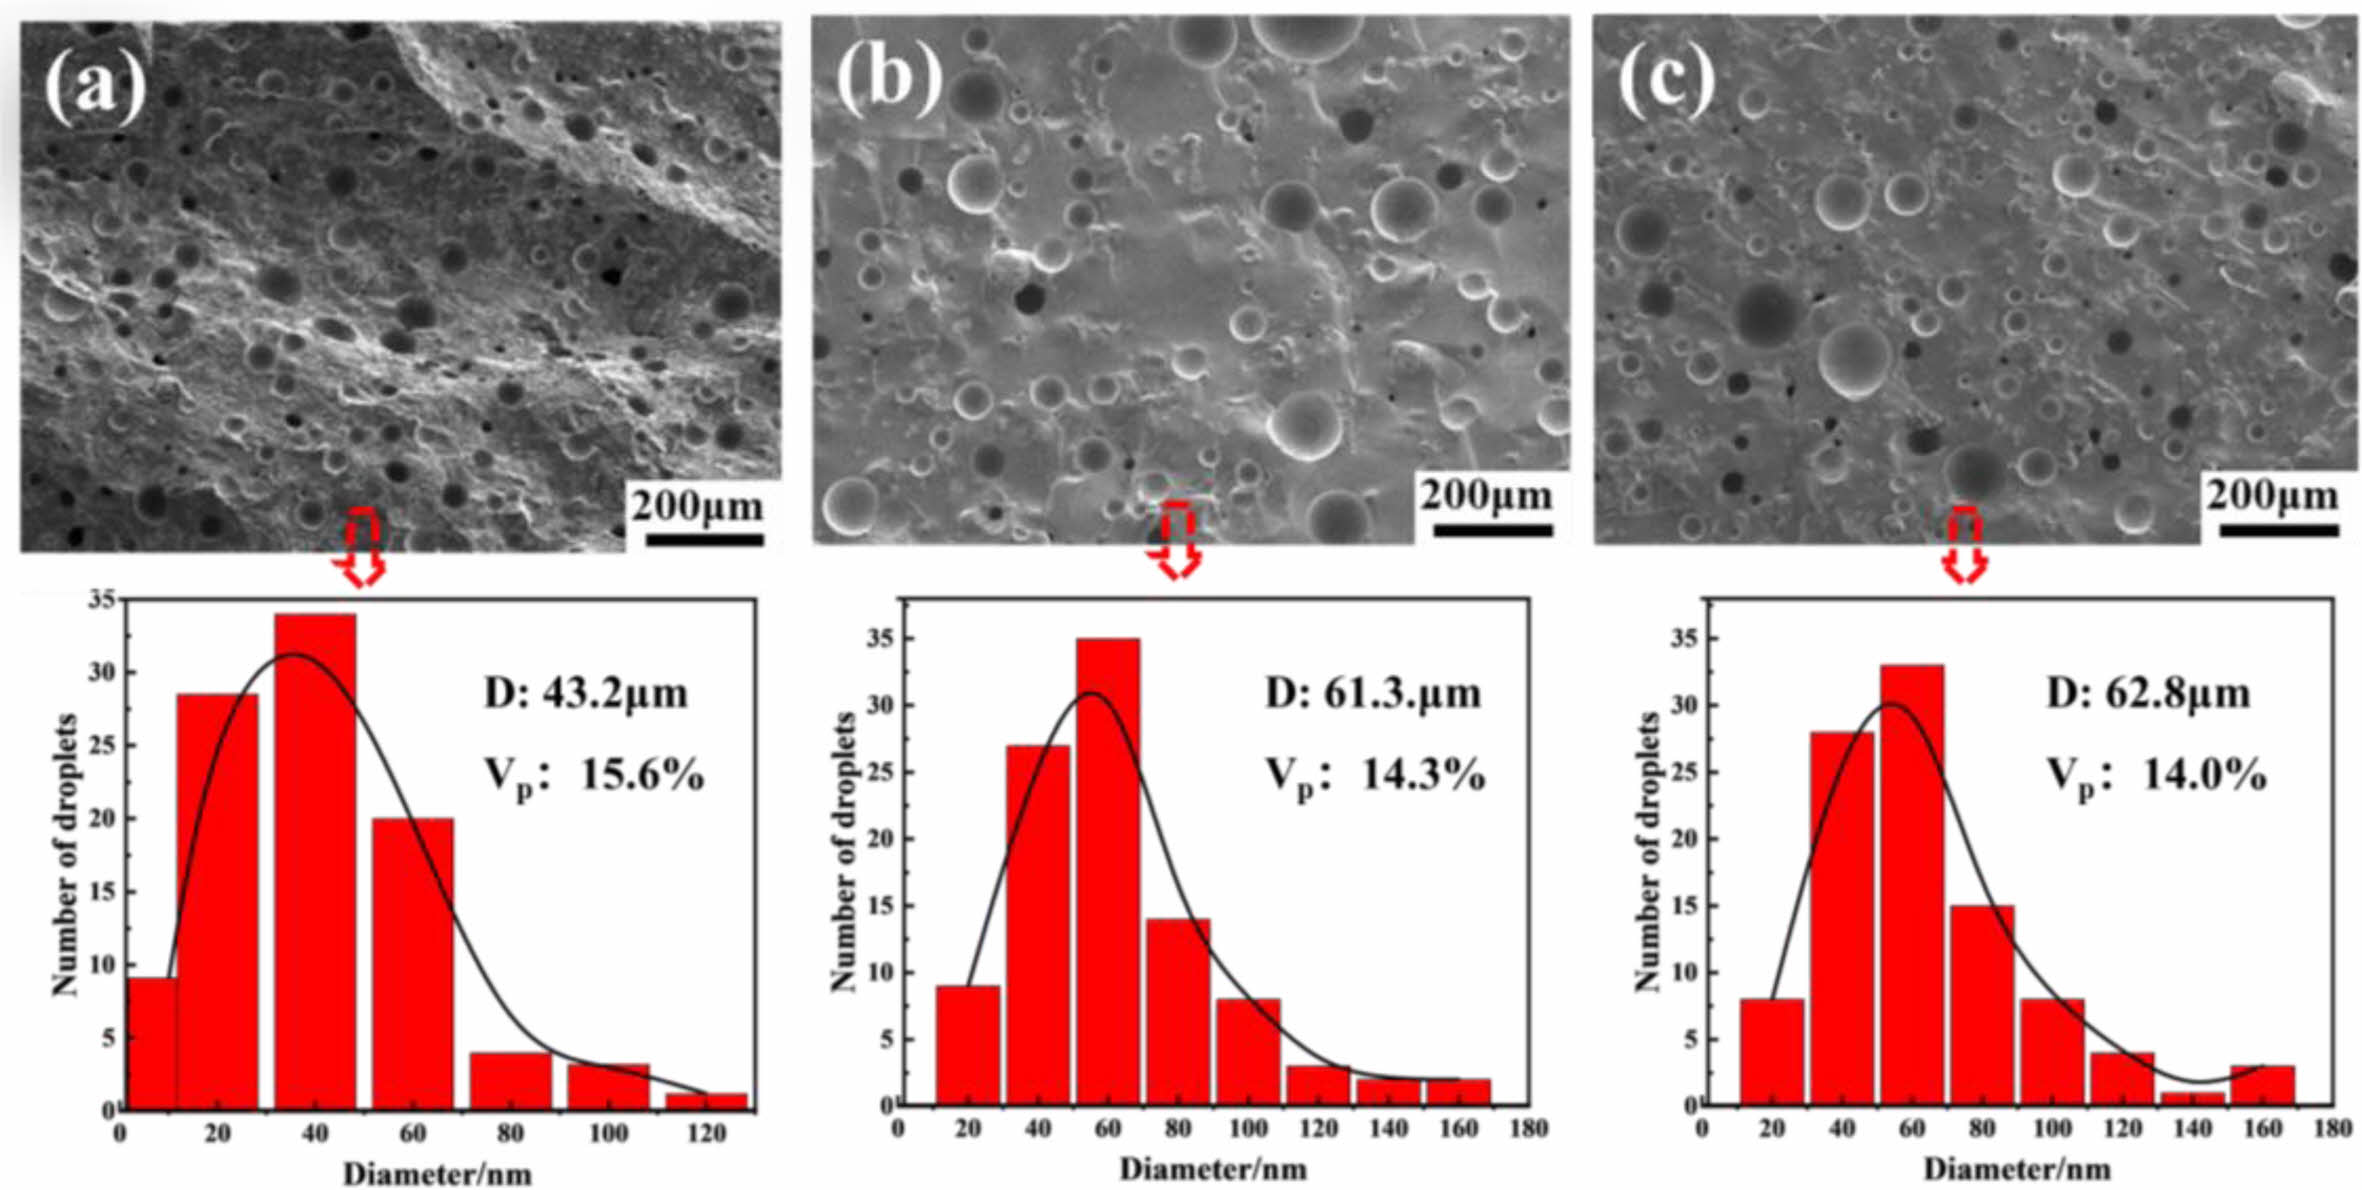
In order to understand the law of the microstructure on the glaze color, SEM images of the typical A1, A2 and A3 glaze in the Southern Song Official Kilns are shown in Fig. 4. All the samples are densely distributed with different sizes of bubbles. It can be seen that the average size of bubbles in A1, A2 and A3 are 43.2 μm, 61.3 μm and 62.8 μm, respectively. In addition, compared with those of A2 and A3 samples, the volume fraction (15.6%) of bubbles in A1 is more (Fig. 4). As is well known, the glaze jade-like texture is inversely proportional to the bubbles size and directly proportional to the volume fraction of the bubbles [10]. Based on Beer-Lambert equation[19]: 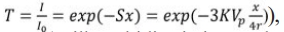 where T is the transmittance (Milk turbidity is inversely proportional to T), I0 is the original light intensity, I is the light intensity through the glaze layer, S is the scattering coefficient (or turbidity coefficient), X is the medium thickness by the light (i.e., the thickness of the glaze layer), K is the scattering factor (0~4), Vp is the volume fraction of emulsion particles, r is the radius of emulsion particles, it could be concluded that jade-like texture depends on the size and volume fraction of the bubbles keeping the glaze thickness unchanged. Compared with that of samples A2 and A3, A1 has smaller bubbles size and more volume fraction, therefore, A1 glaze has strongest jade-like texture.
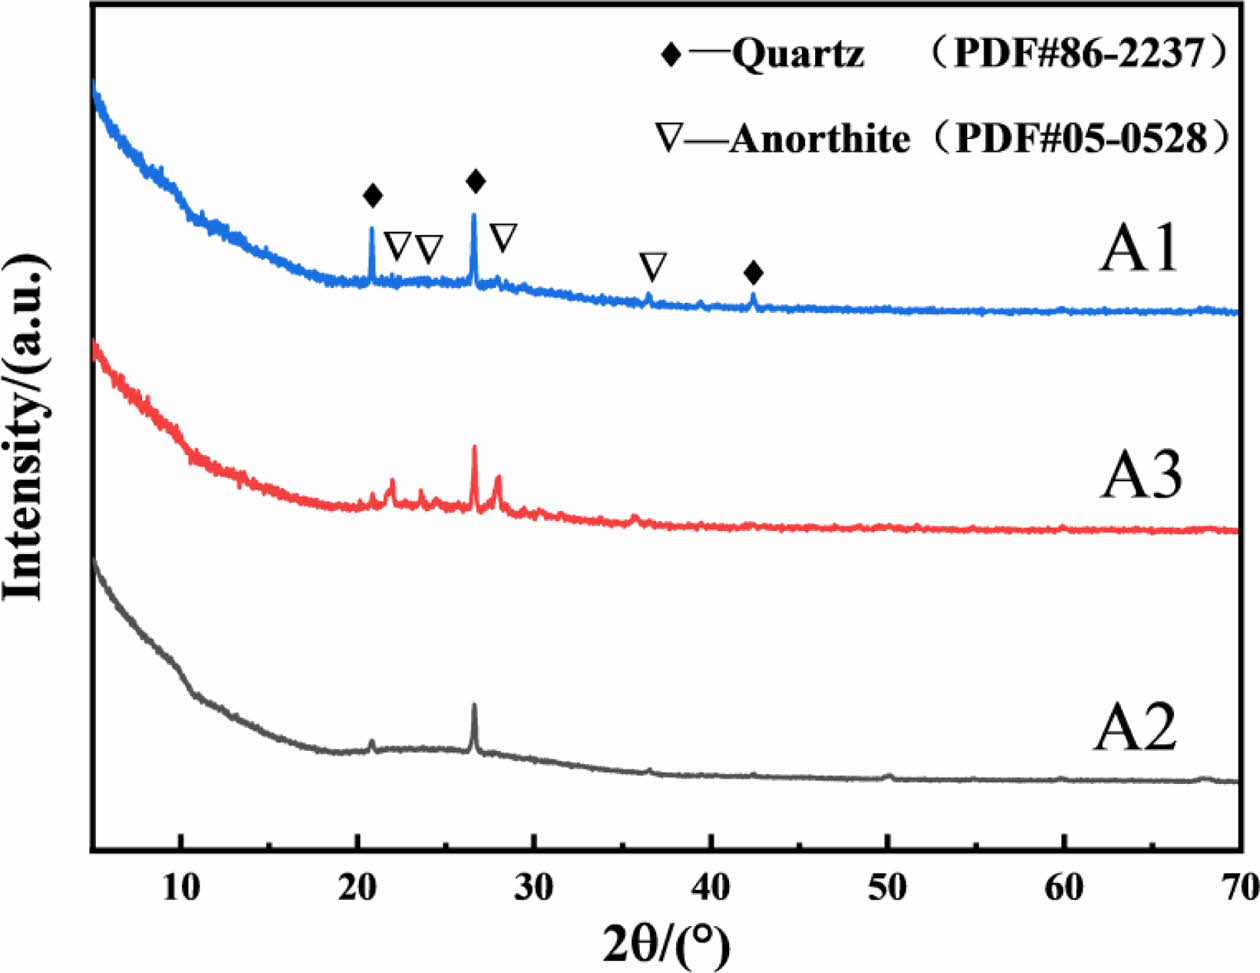
Fig. 5 shows XRD patterns of the typical celadon glaze in Southern Song Official Kilns. A1, A2, A3 are all composed of quartz (SiO2, PDF#86-2237) and anorthite crystals (CaAl2Si2O8, PDF# 05-0528). Compared with that of A3 and A2, the diffraction peaks of quartz and anorthite crystals in A1 are highest, indicating the crystallinity in A1 are highest. It maybe be explained that A1 glaze exhibits the higher jade-like texture due to the smaller size, larger volume fraction of bubbles (Fig. 4) and more crystals distributed in the glaze surface and layer (Fig. 5), which resulting in the reflection light increase and thus improving the jade-like texture of the celandon glaze.
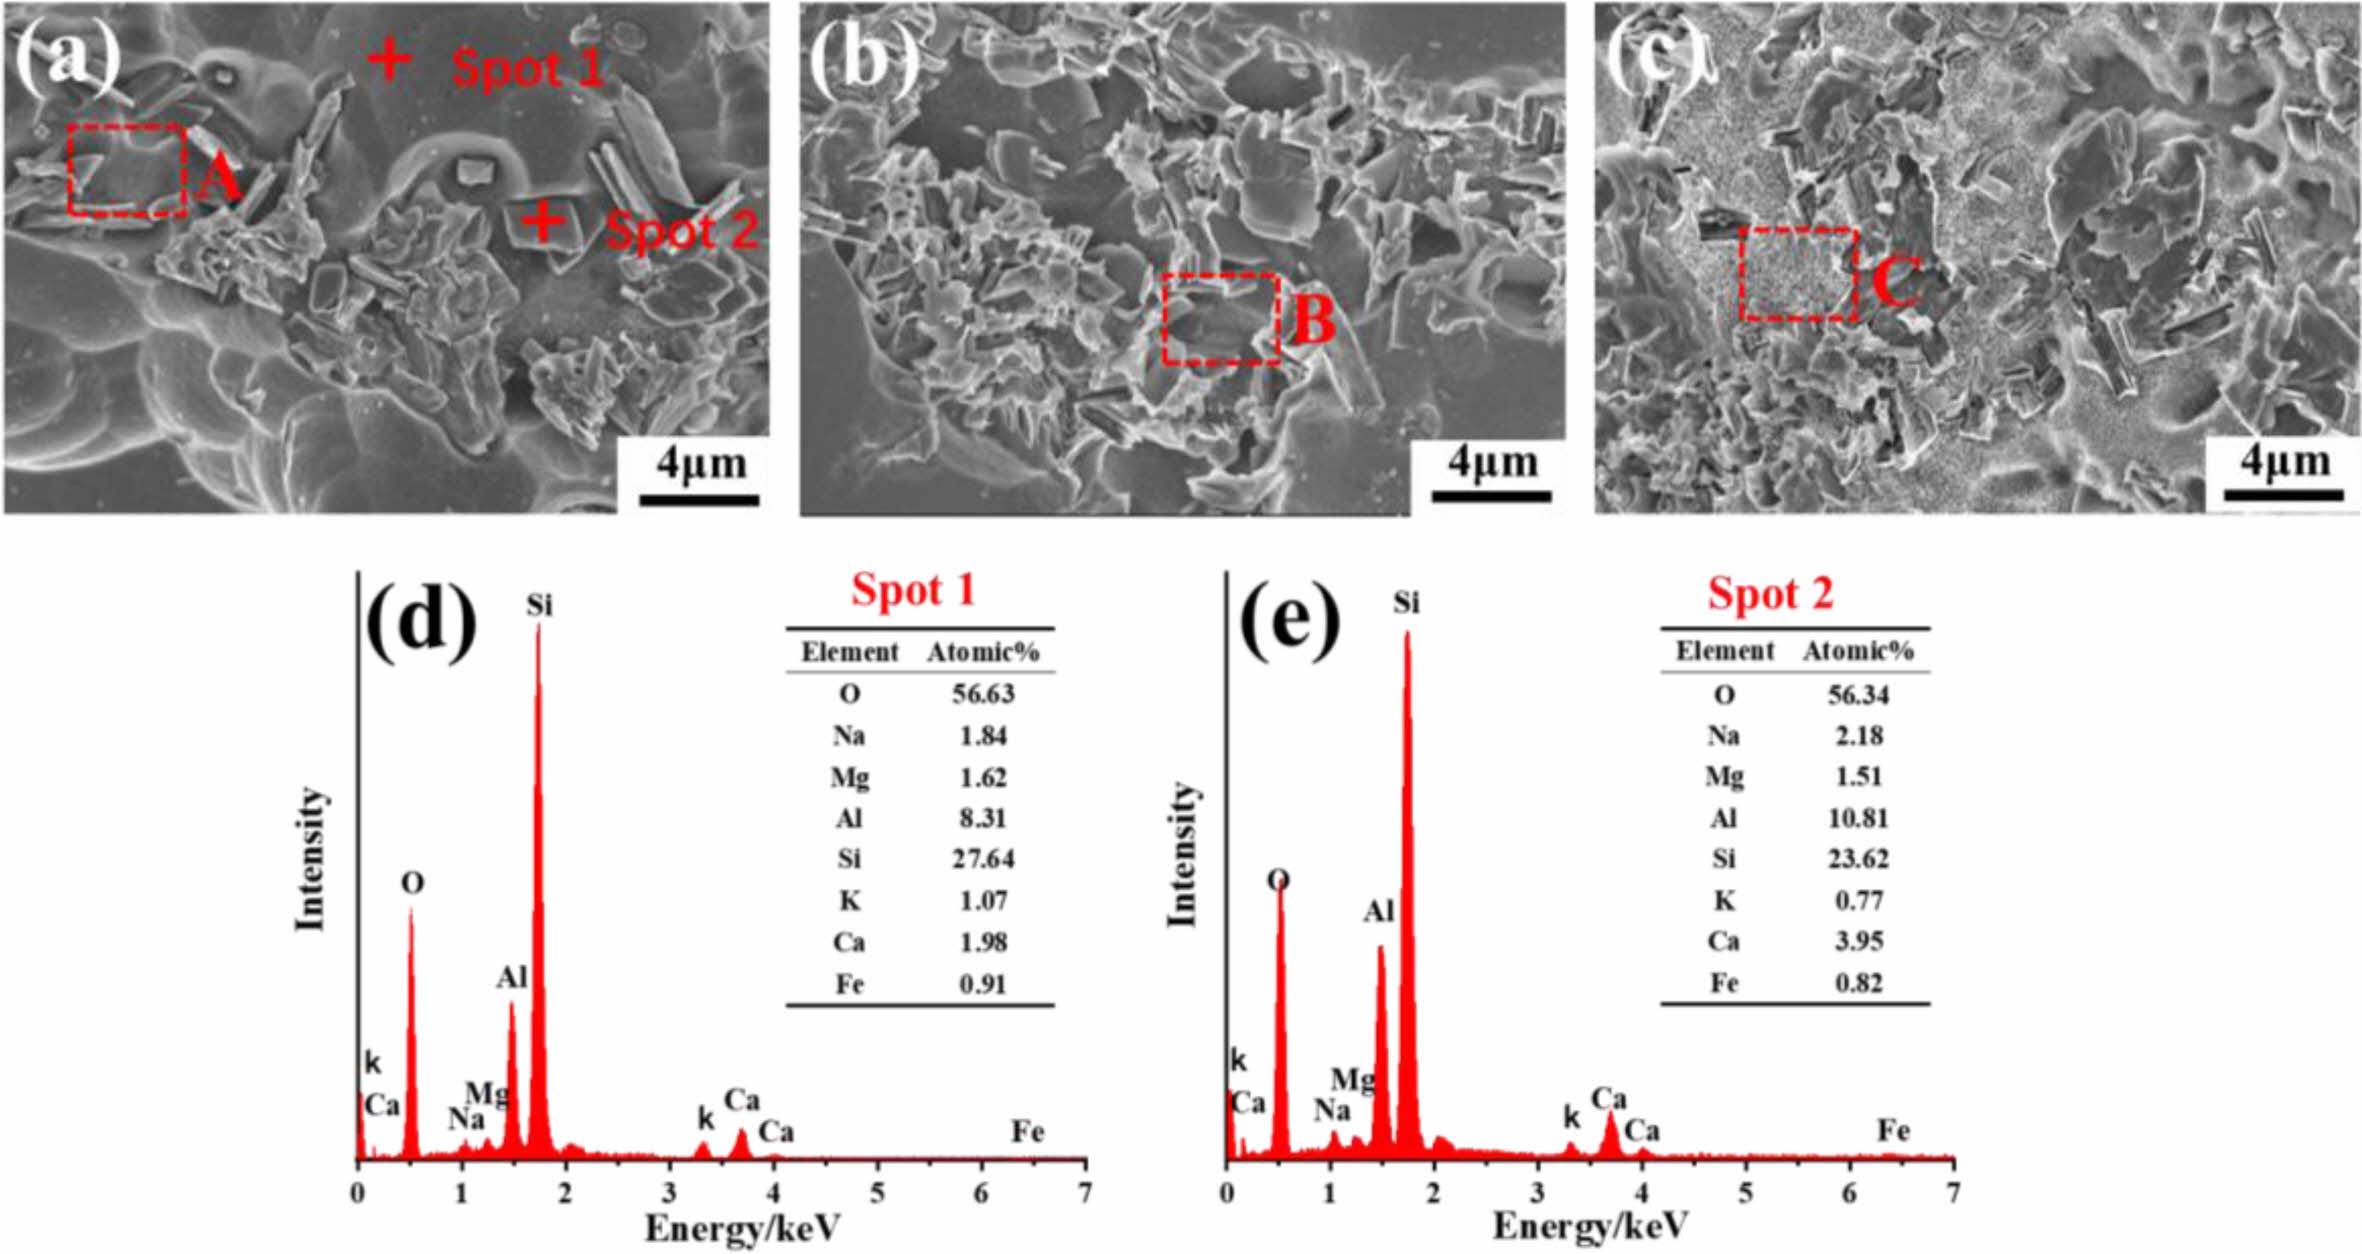
Fig. 6 shows the enlarged SEM images and the corresponding EDS spectrum of the typical A1, A2 and A3 glaze in Southern Song Official Kilns. It can be seen that all the glaze samples are distributed with plate-like crystals. The plate crystals in A1 glaze have high Ca, Al and Si contents with an atomic ratio of about 1:2:2 which is close to the stoichiometry of anorthite crystals (Fig. 5).
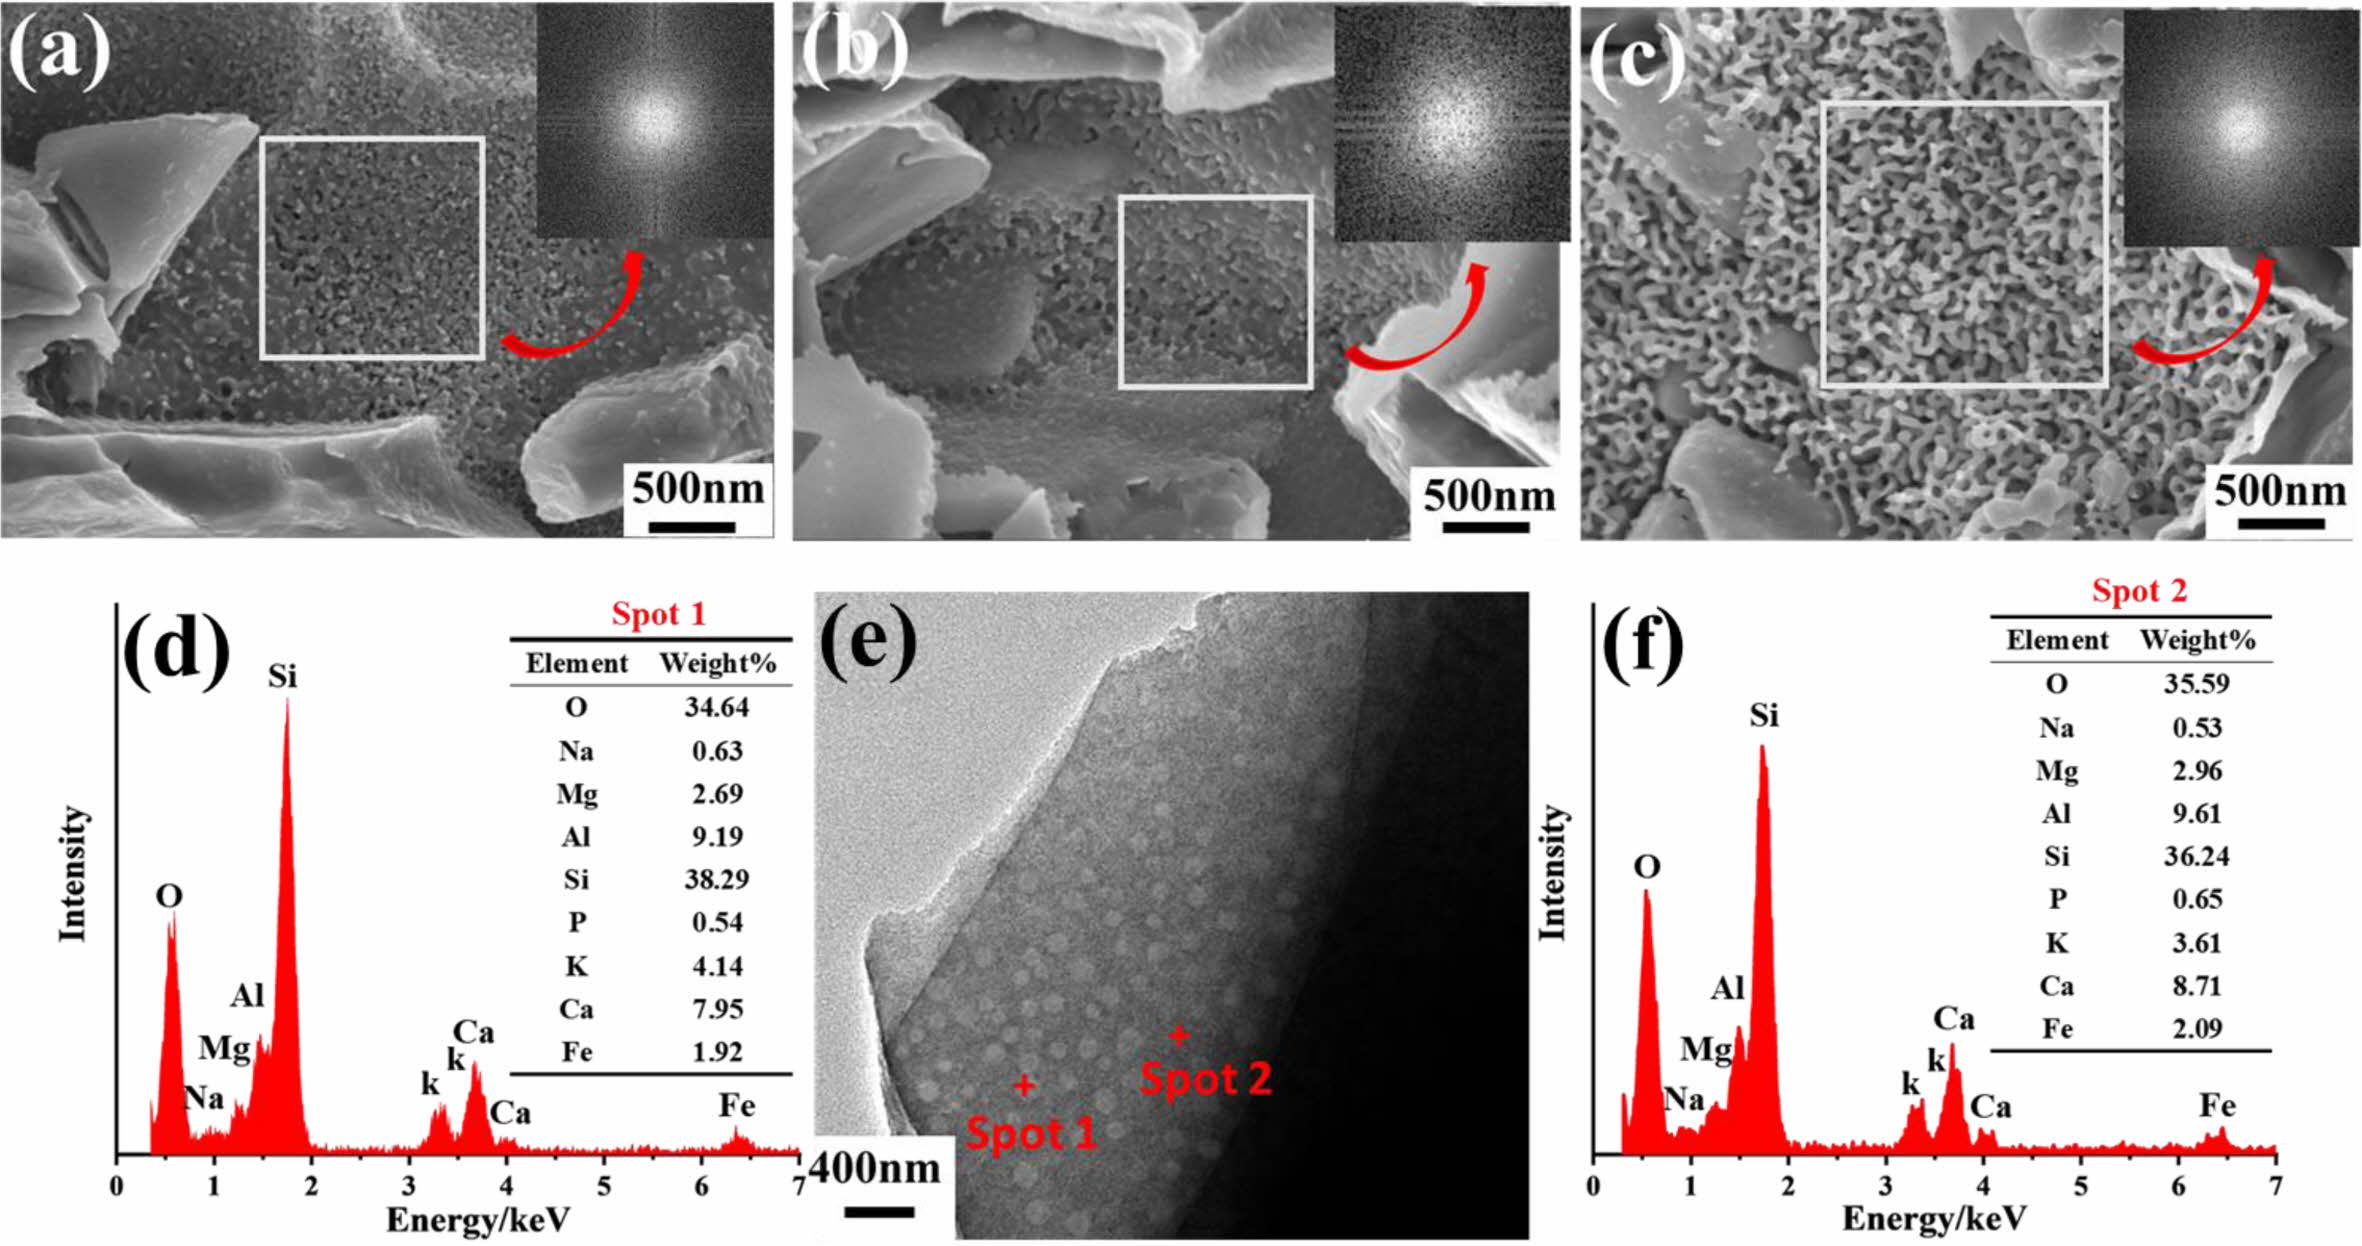
Fig. 7(a-c) shows the enlarged SEM and the corresponding Fourier transform images of anorthite crystal in the typical celadon glaze. All the samples are composed of the separated phases and the anorthite crystals (Fig. 5 and Fig. 6), which is similar with the reported literature [10]. All the samples are uniformly distributed in the angular direction without characteristic structures, and the radial direction has short-range ordering without long-range ordering, indicating that the separated phase structures are all amorphous [13,14,20-22]. Literature [23] analyzed by Rayleigh’s scattering law pointed out that when the size of the separated phase in the glaze is much smaller than the visible wavelength (5 nm < d < 100 nm), it can form the Rayleigh scattering to make the glaze surface appear as a blue color, and it can be seen from the SEM pattern of the glaze in Fig. 7 that the size of the separated phases of A1 and A2 is about 50 nm, so the blue structural color is formed in the glaze surface of A1 and A2. The worm-like separated phases of beige yellow glaze in A3 can be seen in Fig. 7c, with a particle size of approximately 180 nm. Effective refractive index (ne) of A3 glaze calculated by the summation formula: n = n1p1 + n2p2 + n3p3 + nipi, Where n is the calculated coefficient of the refractive index of oxides in blue glaze, and p is the molar fraction of oxides. Two spots in the phase separated particles of A3 glaze were taken for EDS point sweep analysis of the chemical composition of the split phase particles as shown in Fig. 7d. Based on the summation formula, the refractive index of the microphase (n1) was 1.600, and the refractive index of the basic phase (n2) was 1.580. Furthermore, we applied the Maxwell-Garnett equation to calculate the effective refractive index (ne) of the phase-separation glaze, where φ was the volume fraction of microphase. Based on the Maxwell-
Garnett equation: 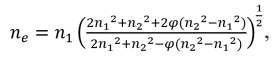 the theoretical calculation of ne was 1.597 with assuming φ = 90%. According to the Bragg equation, In the phase-separated glaze, d is close to the average diameter of phase-separation droplets. The Bragg equation is expressed as [20]: λ = 2dne. The theoretical calculation of λ was 574 nm with d = 180 nm and ne = 1.597, which was within the range of yellow light wavelength (565-590 nm) [24]. Hence, the size of the worm-like separated phase in A3 is about 180 nm, which can form yellow structural colors. Fig. 9(d-f) shows TEM images and the corresponding EDS spectra. It can be seen that many separated drops with size of evenly distributed in the glaze. Compared with those of the glassy phase, the separation drops contain more Mg, Ca, and Fe content, while Si content is abundant in the glassy phase. Difference refractive index values between the two phases enhance the scattering effect in the glaze layer and thus increase the glaze opacification [19].
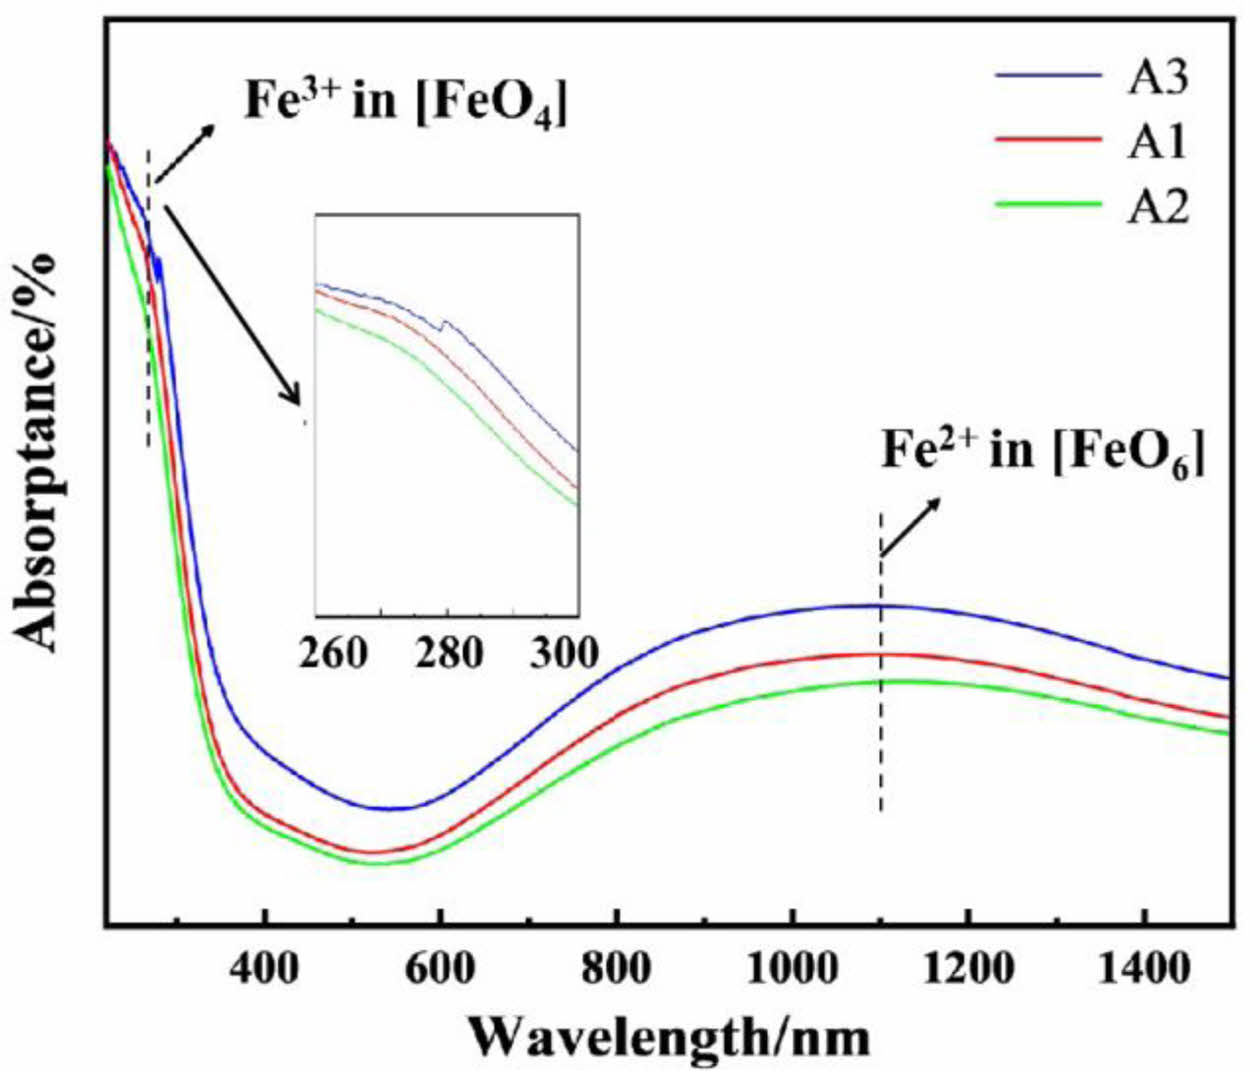
Fig. 8 shows UV-vis-NIR absorption spectrum of the typical samples.The absorption peak at 280 nm is attributed to the electron transfer type of Fe3+in [FeO6](2T2g→2Eg) [25]. The strong absorption peak at 1100 nm is attributed to the strong charge transfer of Fe2+ in [FeO6] tetrahedral coordination [26]. The absorption peak intensity of Fe3+ at 280 nm in A3 glaze is significantly stronger than that in A1 and A2 sample, indicating that the network structure of Fe3+ in the beige yellow glaze A3 is higher than that in A1 (the sky green glaze) and A2 (pinkish green glaze).
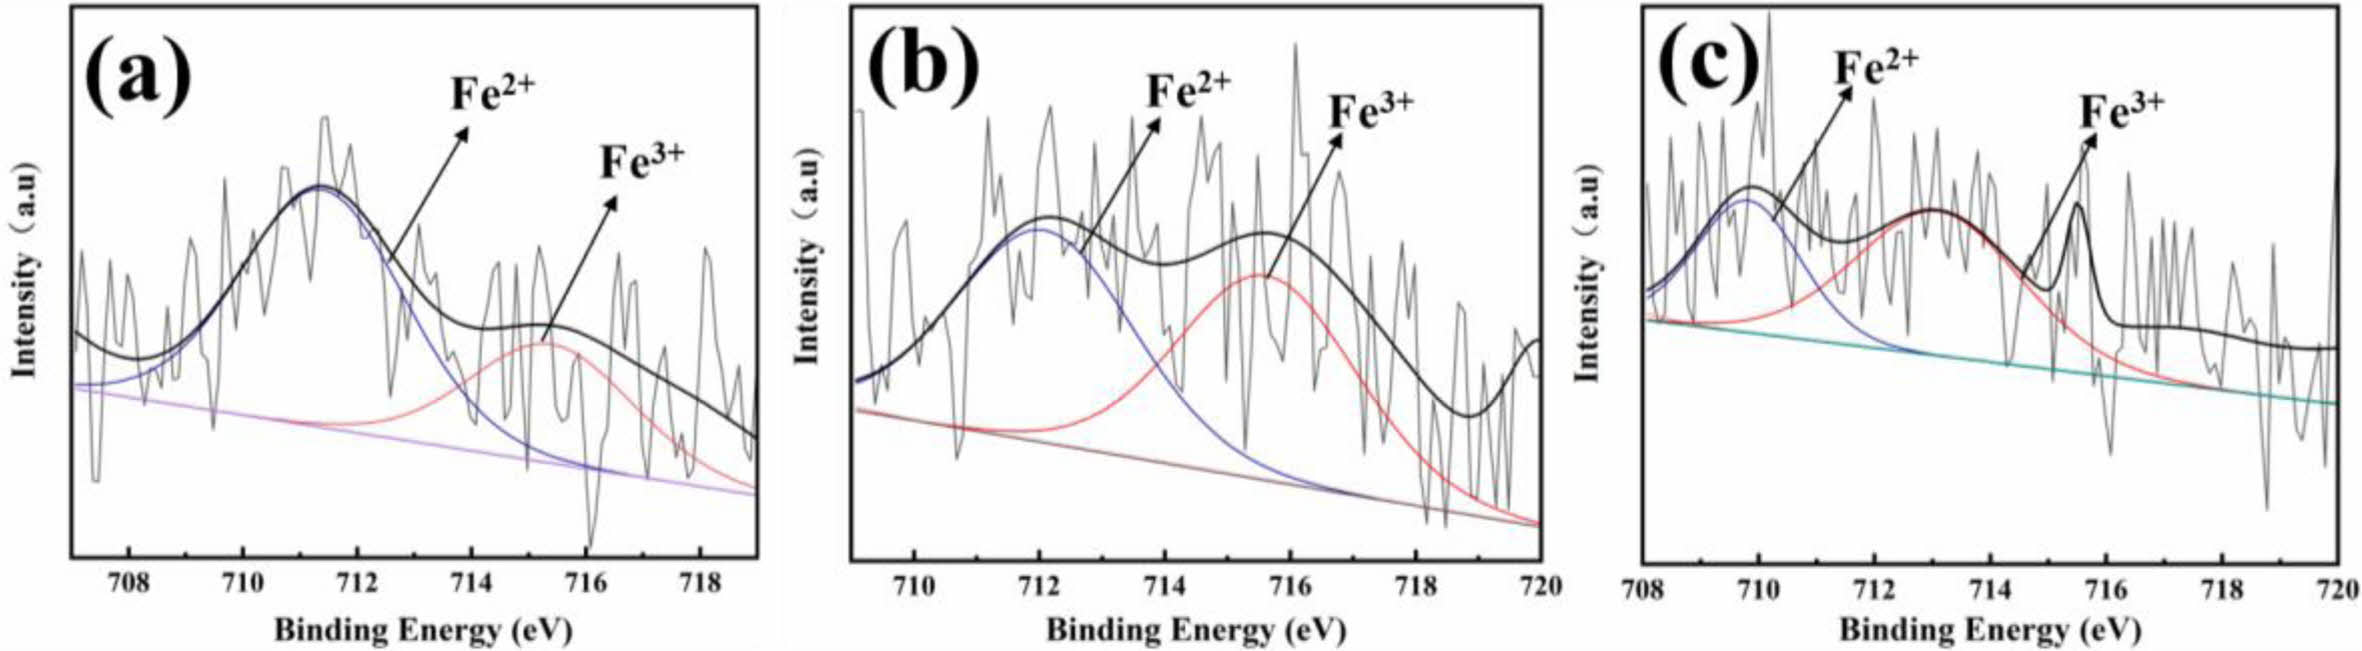
Fig. 9 shows Fe2p3/2 peaks of the XPS fitting spectrum of the typical A1, A2, A3 celadon glaze in Southern Song Official Kiln. It could be seen that Fe2+/Fe3+ values of A1, A2, and A3 glaze are 66.60/33.40, 50.84/49.16 and 36.53/63.47, respectively. Combined with the analysis of the chromatic test of the glaze (Table 2), it can be seen that with the decrease of Fe2+/Fe3+, the main wavelength of the glaze increases from 540 nm, 560 nm to 730 nm (Table 2 and Fig. 2), and the glaze color transform from the greenish-blue color to orange-yellow color (Table 2 and Fig. 2), and thus the actual glaze color is expressed as sky green, deep pinkish green and beige color (Fig. 1). Outer nuclear electron layer arrangement of iron element is 3d64s2, which is easy to lose two electrons for the outermost to form Fe2+ ions (3d64s0). Further losing an electron, Fe3+ ions (3d54s0) forms. Iron ions in the amorphous state of the silicate network exist a dynamic equilibrium: the reaction is possible to bidirectional, which is difficult to carry out in one direction, and thus Fe2+ and Fe3+ ions always coexist in the amorphous state of the silicate network [14,27]. It had bee reported that although alternative colorants or secondary chromphores might contribute to subtle variations in the observed hues, the color of the glaze is mainly dependent on the ratio of Fe2+/Fe3+ [1,7,12]. Fe2+ ions have a strong absorption in the infrared region [29,30], which make the glaze to exhibit a light greenish-blue color. Fe3+ ions in the ultraviolet region has a strong absorption, so that the glaze shows a yellow or brown color.
Based on the experimental results, color mechanism of the celadon glaze is due to Fe2+/Fe3+ in the glassy phase and the structural color formed by the separated phase. When Fe2+/Fe3+ value is 66.60/33.40 and 50.84/49.16 for A1 and A2, respectively, Fe2+/Fe3+ is the key factor affecting the glaze coloring. At the same time, a small amount of separated phase structure (≈50 nm) in the glaze forms a weak Rayleigh-scattered blue colour that deepens the green hue of the sky green glaze (A1) and pinkish green glaze (A2), and a small amount of particulate nanoscale separated phases, bubbles, and crystals together enhance the jade-like texture. With the decrease of Fe2+/Fe3+ (36.53/63.47), the large separated phase (≈180 nm) would also participate in the color presentation, which makes the glaze besige yellow (A3, Fig. 1, Table 1 and Fig. 2).
|
Fig. 2 UV-visible reflectance spectra of ancient porcelain glaze in the Southern Song Official Kilns [12]. |
|
Fig. 3 Main wavelength and chromaticity values box plots of ancient celadon glaze. |
|
Fig. 4 SEM images and corresponding bubbles size distribition curves of the typical samples: (a) A1; (b) A2; (c) A3. |
|
Fig. 5 XRD patterns of the typical celadon glaze in Southern Song Official Kilns. |
|
Fig. 6 Enlarged SEM images and the corresponding EDS spectrum of the typical glaze in Southern Song Official Kilns: (a) A1; (b) A2; (c) A3; (d) and (e) EDS spectrum in A1 glaze. |
|
Fig. 7 SEM image and corresponding EDS spectra of the typical glaze in Southern Song Official Kilns: (a), (b) and (c) enlarged images of A, B, C in Fig. 6; (d-f) TEM image and EDS spectra in A3 glaze. |
|
Fig. 8 UV-vis-NIR absorption spectra of the typical glaze in Southern Song Official Kilns. |
|
Fig. 9 Fe2p3/2 peaks of the XPS fitting spectrum of the typical glaze in Southern Song Official Kilns: (a) A1; (b) A2; (c) A3. |
|
Table 2 Main wavelength and chromaticity values of ancient porcelain glaze [11, 12]. |
This study systematically summarizes a method for distinguishing the glaze colors of Southern Song Dynasty Guan Kiln celadon based on wavelength range and colorimetric values of a*, b*, and h°. Chemical composition analysis reveals that the chemical compositions of Guan Kiln celadon glaze are relatively consistent across different kiln sites. However, the alkaline earth and alkali metals, which serve as major co-solvents, exhibit significant variation, indicating that these glazes are typical calcium and calcium-alkali glazes. Further investigation shows that the Fe2+/Fe3+ ratio and the presence of separated phases are key factors influencing glaze color. As the Fe2+/Fe3+ ratio decreases, the glaze color transitions from blue-green or pale green to beige. The glaze contains approximately 3 μm-sized anorthite crystals, quartz crystals, and gas bubbles in the range of 10-100 μm, with short-range disordered separated phases around the anorthite crystals. The study finds that small-scale separated phases (around 50 nm) enhance the green hue of the sky green and pinkish green glazes via Rayleigh scattering, while larger separated phases (around 180 nm) form an amorphous structural color that promotes the yellow hue in the beige yellow glaze. The presence of crystals, bubbles, and separated phases strengthens the emulsification effect, giving the Southern Song Guan Kiln celadon glaze its distinctive jade-like texture. These findings not only reveal the microstructural mechanisms behind the color changes in Southern Song Guan Kiln celadon glazes but also provide an important theoretical foundation for subsequent experimental replication and future studies in modern ceramic technology. This research holds significant academic value and practical implications for the restoration and replication of historical ceramics.
Our research work presented in this paper was supported by Major Project of Natural Science Foundation of Jiangxi Province (20232ACB204017), Jingdezhen Technology Bureau (20212GYZD009-18 and 20224GY008-16), Project of Jiangxi Province department of Education (GJJ2201048).
The authors confirm that the data supporting the findings of this study are available within the article.
The authors declare no conflict of interest.
Qifu Bao: Project administration. Weixia Dong: Formal analysis, Writing-review & editing. Zhenxin Zhang and Huan Yu: Resources. Kun Liu and Yan Xu: Investigation. Jianer Zhou: Methodology, Project administration.The first draft of the manuscript was written by Zhipeng Cheng and all authors commented on previous versions of the manuscript. All authors read and approved the final manuscript.
- 1. N. Wood and H. Li, Archaeometry. 57[4] (2015) 617-635.
-

- 2. Z.X. Du, J. Cultural Reuics. 4[10] (2002) 31.
- 3. Z.C. Z, Ceram. Sci. & Art. 58[06] (2024) 143-144.
- 4. H. Xu, Ceram. Chin. 58[11] (2022) 126-129.
- 5. S.L. Chen and X. Jin, Ceram. Sci. & Art. 57[08] (2023) 68-69.
- 6. Y. Zhong and L. Jin, Designs. [07] (2022) 67-69.
- 7. Z. Sang, F. Wang, X. Yuan, S. Shen, J. Wang, and X.H. Wei, J. Ceram. Process. Res. 23[6] (2022) 758-765.
-
- 8. H. Li, Y. Fang, Z. Li, W.X. Dong, J.R. Zhou, and Q.F. Bao, J. Aust. Ceram. Soc. [60] (2024) 1637-1643.
-
- 9. M. Hao, M.L. Zhang, Y.J. Weng, and Z. Xiong, J. Ceram. Process. Res. 25[5] (2024) 827-841.
-
- 10. W.D. Li, J.Z. Li, Z.Q. Deng, J. Wu, and J.K. Guo, J. Build Mater. 7[3] (2004) 245-245.
- 11. Y. Kim, U.S. Kim, and K.S. Han, J. Ceram. Process. Res. 24[6] (2023) 1001-1009.
-
- 12. W.J. Zhao, Zhang. B, R.W. Li, G.X. Li, J.Z. Xie, M. Guo, G.F. Yao, and Z.Y. Gao, Atomic Energy Sci. Technol. 38[1] (2004) 92-96.
- 13. L. Shi, Y. Zhang, B.Q. Dong, T.R. Zhan, X.H. Liu, and J. Zi, Adv. Mater. [25] (2013) 5314-5320.
-
- 14. F. Li, F. Wang, H.J. Luo, J.F. Zhu, M.L. Wang, C. Yang, J.X. Sun, and T. Wang, J. Eur. Ceram. Soc. 43[14] (2023) 6581-6589.
-
- 15. P. Shi, F. Wang, H. J. Luo, B. Zhang, J.F. Zhu, T. Wang, and H.B. Yang, J. Chin. Silic. Soc. 48[12] (2020) 1935-1943.
- 16. Y.Z. Ding, L. Zhao, W.W. Huang, J.Y. Hou, and J.M. Miao, Palace Museum J. 203[05] (2010) 146-152.
- 17. H.M. Ye, F.S. Lao, G.Z. Li, and G.Z. Ye, J. Chin. Silic. Soc. 01[21-34] (1983) 131-133.
- 18. H.J. Luo, J.Z. Li, and L.M. Gao, Bull. Chin. Silic. Soc. 2 (1995) 50-53.
- 19. W. Vogel, J. Non-Cryst. Solids. 25[1] (1977) 170-214.
-
- 20. P. Shi, F. Wang, J.F. Zhu, H.B. Yang, Y. Fang, B. Zhang, and J.H. Wang, J. Eur. Ceram. Soc. 38 (2018) 2228-2233.
-
- 21. F. Li, F. Wang, H.J. Luo, and B.X. Qiu, Dyes Pigm. 210 (2023) 111019.
-
- 22. I. Avramov, J. Non-Cryst. Solids. 355 (2009) 745-747.
-
- 23. B. Zhang, J.F. Zhu, P. Shi, F. Wang, J.H. Wang and Z. Ren, J. Eur. Ceram. Soc. 39[5] (2019) 1925-1931.
-
- 24. S.G. Romanov, T. Maka, C.M. Sotomayor-Torres, M. Muller, R. Zentel, and D. Cassage, Phys. Rev. E. 63[5] (2001) 056603.
-
- 25. V. Vercamer, G. Lelong, H. Hijiya, Y. Kondo, L. Galoisy, and G. Calas, J. Non-Cryst. Solids 428 (2015) 138-145.
-
- 26. L.B. Glebov and E. Boulos, J. Non-Cryst. Solids. 242 (1998) 49-62.
-
- 27. T. Yamashita and P. Hayes, Appl. Surf. Sci. 254[8] (2008) 2441-2449.
-
- 28. Q.Q. Chen, Y.S. Zhou, and S.H. Zhou, J. Ceram. 01 (1996) 42-47.
- 29. C.W. Zhang, Glass Enamel & Ophthalmic Opt. 38[06] (2004) 42-46.
- 30. S.B. Donald, A.M. Swink, and H.D. Schreiber, J. Non-Cryst. Solids. 352[6-7] (2006) 539-543.
-
 This Article
-
2025; 26(2): 248-256
Published on Apr 30, 2025
- 10.36410/jcpr.2025.26.2.248
- Received on Dec 9, 2024
- Revised on Feb 24, 2025
- Accepted on Apr 1, 2025
Services
- Abstract
introduction
samples and tests
results and discussion
conclusion
- Acknowledgements
- Data availability statement
- Conflict of Interest
- Author Contributions
- References
- Full Text PDF
Shared
Correspondence to
- Weixia Dong and Qifu Bao
-
Jingdezhen Ceramic University, Jingdezhen 333400, Jiangxi, China
Tel: +86-798-8480007 Fax: +86-798-8480007 - E-mail: Weixia_dong@sina.com, dwxbqf0727@163.com
Clean-Energy Research Institute(CRI), Hanyang University, 222, Wangsimni-ro, Seongdong-gu, Seoul, 04763, Korea
E-mail: jcpr@hanyang.ac.kr