


- Effect of Nb doping on the microstructure and DC electrical conductivity of nickel ferrite
Baogang Liu*, Jingyao Xia, Yang Yu and Huixin Liu
School of Energy and Electromechanical Engineering, Hunan University of Humanities, Science and Technology, Loudi 417000, China
This article is an open access article distributed under the terms of the Creative Commons Attribution Non-Commercial License (http://creativecommons.org/licenses/by-nc/4.0) which permits unrestricted non-commercial use, distribution, and reproduction in any medium, provided the original work is properly cited.
Research on the performance of nickel ferrite ceramics is significant for the practical application. This study prepared Ni1-xNbxFe2O4 ceramics (x = 0, 0.02, 0.05, 0.07, 0.10, 0.20) via a solid state reaction, and analyzed how Nb doping affected phase compositions, grain sizes, relative densities as well as DC conductivities was investigated. The results showed that the Ni1-xNbxFe2O4 ceramics contained both NiFe2O4 and NiO phases when the Nb doping amount x was less than 0.20. The grain sizes of the Ni1-xNbxFe2O4 ceramics slowly elevated as the Nb doping amount elevated. The mean grain size of around 50 μm was obtained at the doping amount x of 0.20, 2.5 times higher than that of undoped NiFe2O4 ceramics. The relative densities and DC conductivities of the Ni1-xNbxFe2O4 ceramics first increased and then decreased gradually with the increase of Nb doping amount. When the Nb doping amount x was 0.05, the relative densities and DC conductivities reached the maximum, which were 99.35% and 36.37 S/cm (960 ℃), respectively. The factors affecting the microstructure and DC electrical conductivities of the Ni1-xNbxFe2O4 ceramics were also discussed in detail.
Keywords: Microstructure, Electrical conductivity, Nickel ferrite, Ceramics.
Nickel ferrite is considered a very attractive material because of its unique properties and practical applications [1, 2]. It is widely used in various areas, like supercapacitor [3], data storage [4], catalysts [5], H2O decomposition [6], ferrofluids [7], gas sensors [8], inert anodes [9], magnetic drug delivery [10], glycan analysis [11] and microwave absorbers [12]. The microstructure and electrical conductivity of nickel ferrite ceramics is significant for the applications. Therefore, numerous researchers have carried out extensive research and discussion on this issue. Hassan et al. prepared Al substituted Ni ferrites successfully as energy storage devices [13]. They found that the Al substituted Ni ferrites had increased DC electrical resistivity as Al content elevated within the samples, making the material suitable for high frequency applications. Kamar, et al. synthesized four nickel ferrite powder samples of diverse nanoparticle sizes and morphologies, and studied how particle size and morphology affected electrical performances of NiFe2O4 nanoparticles [14]. Anu et al. analyzed how Zn doping affected electrical property of NiFe2O4 nanoparticles. The results showed that the nanoparticles with critical dopant concentration exhibited higher values of electrical conductivity because of the increased Fe3+ ion hopping at octahedral sites [15]. In our previous research, we found that the relative density and DC conductivity of nickel ferrite ceramics sintered under the nitrogen atmosphere dramatically elevated in comparison with those sintered in air [16]. Doping can effectively enhance the relative density and electrical conductivity of nickel ferrite ceramics. Given the facts that the radius of Nb5+ is relatively closer to that of Ni2+, it could be deduced that Nb atoms could intercalate into the crystal lattice of NiFe2O4 ceramics by partial replacement of Ni atoms [17]. In this work, Ni1-xNbxFe2O4 ceramics (x = 0, 0.02, 0.05, 0.07, 0.10, 0.20) were prepared via traditional powder metallurgy process and sintered under nitrogen at the initial oxygen partial pressure being ~100 ppm, so as to analyze how Nbdoping affected the microstructure and DC electrical conductivities of nickel ferrite.
Ni1-xNbxFe2O4 ceramics (x = 0, 0.02, 0.05, 0.07, 0.10, 0.20) were prepared via a solid state reaction according to the stoichiometry ratio.The high-purity NiO (99.8%, Jinchuan, China), Nb2O5 (99.5%, Shanghai, China) and Fe2O3 (99.8%, Qidong, China) were used to be raw materials. After weighing, the powder underwent 4 h of wet ball-milling within distilled water with WC-8Co cemented carbide balls, at the ball-to-powder mass ratio of 3:1, with polyvinyl alcohol (PVA) being the binder. This resultant mixed sample was heated for 24 hours under 100 oC, followed by 6 h of calcination under 1200 ℃ within a muffle furnace. The calcined powder was later subjected to uniaxial compaction at 120 MPa for forming the cylindrical blocks, and later 4 h of sintering under 1300 ℃ under nitrogen, and the initial oxygen partial pressure was ~100 ppm. After firing, the samples underwent cooling at 0.5 ℃/min for avoiding thermal shock-induced cracking.
The phase compositions of Ni1-xNbxFe2O4 ceramics were detected by X-ray diffraction (Dmax/2550VB+, Tokyo, Japan) under Cu-Kα radiation. The Ni1-xNbxFe2O4 ceramics microstructures were analyzed with the use of scanning electron microscopy (Hitachi S-4800, Tokyo, Japan). Archimedes approach was adopted for measuring bulk densities. Also, DC electrical conductivity was calculated at 300-960 ℃ through the four-point probe approach. Among them, two probes were applied in supplying current, whereas the other two were adopted for measuring voltage.
Phase composition
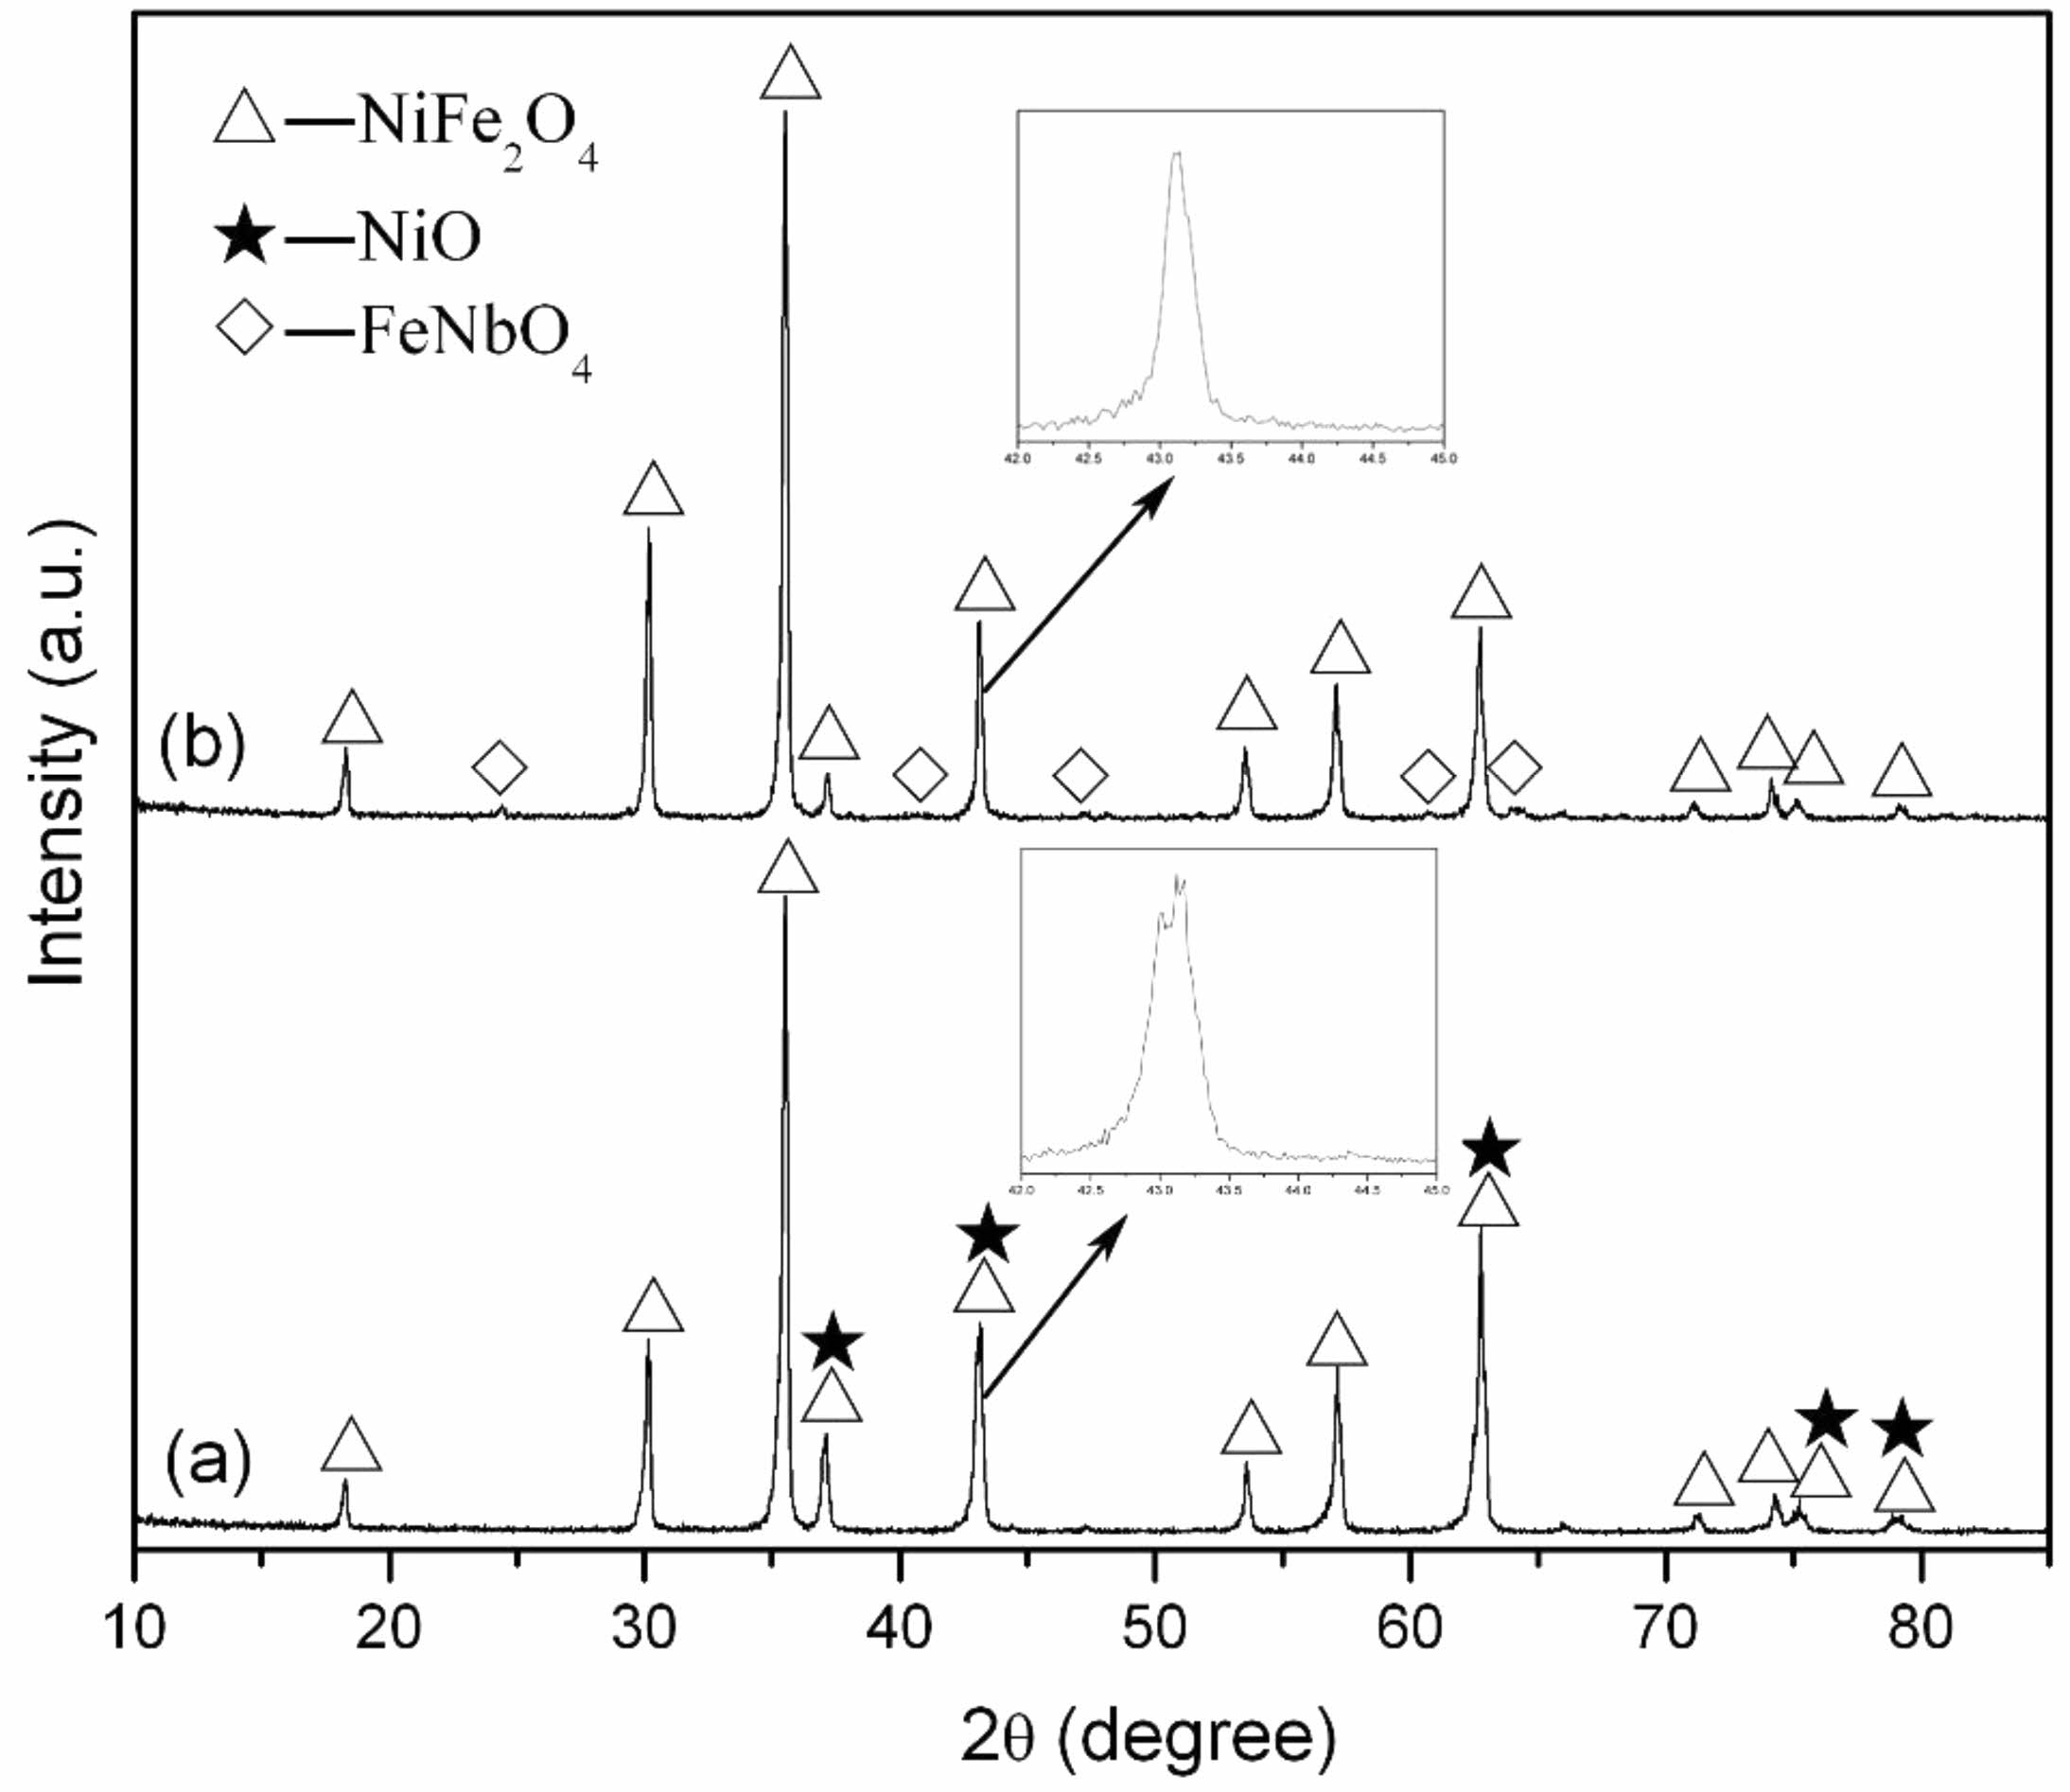
Fig. 1 displays X-ray diffraction patterns for samples
with compositions of Ni0.98Nb0.02Fe2O4 and Ni0.80Nb0.20Fe2O4 sintered at 1300 °C under nitrogen atmosphere. It could be observed that at low doping concentrations of Nb2O5, the samples predominantly exhibited two phases: NiFe2O4 and NiO, with no detectable diffraction peaks corresponding to Nb-containing compounds. However, at a doping concentration of x = 0.20, weaker intensity diffraction peaks of FeNbO4 emerged in the samples, while the diffraction peaks associated with the NiO phase were no longer present.
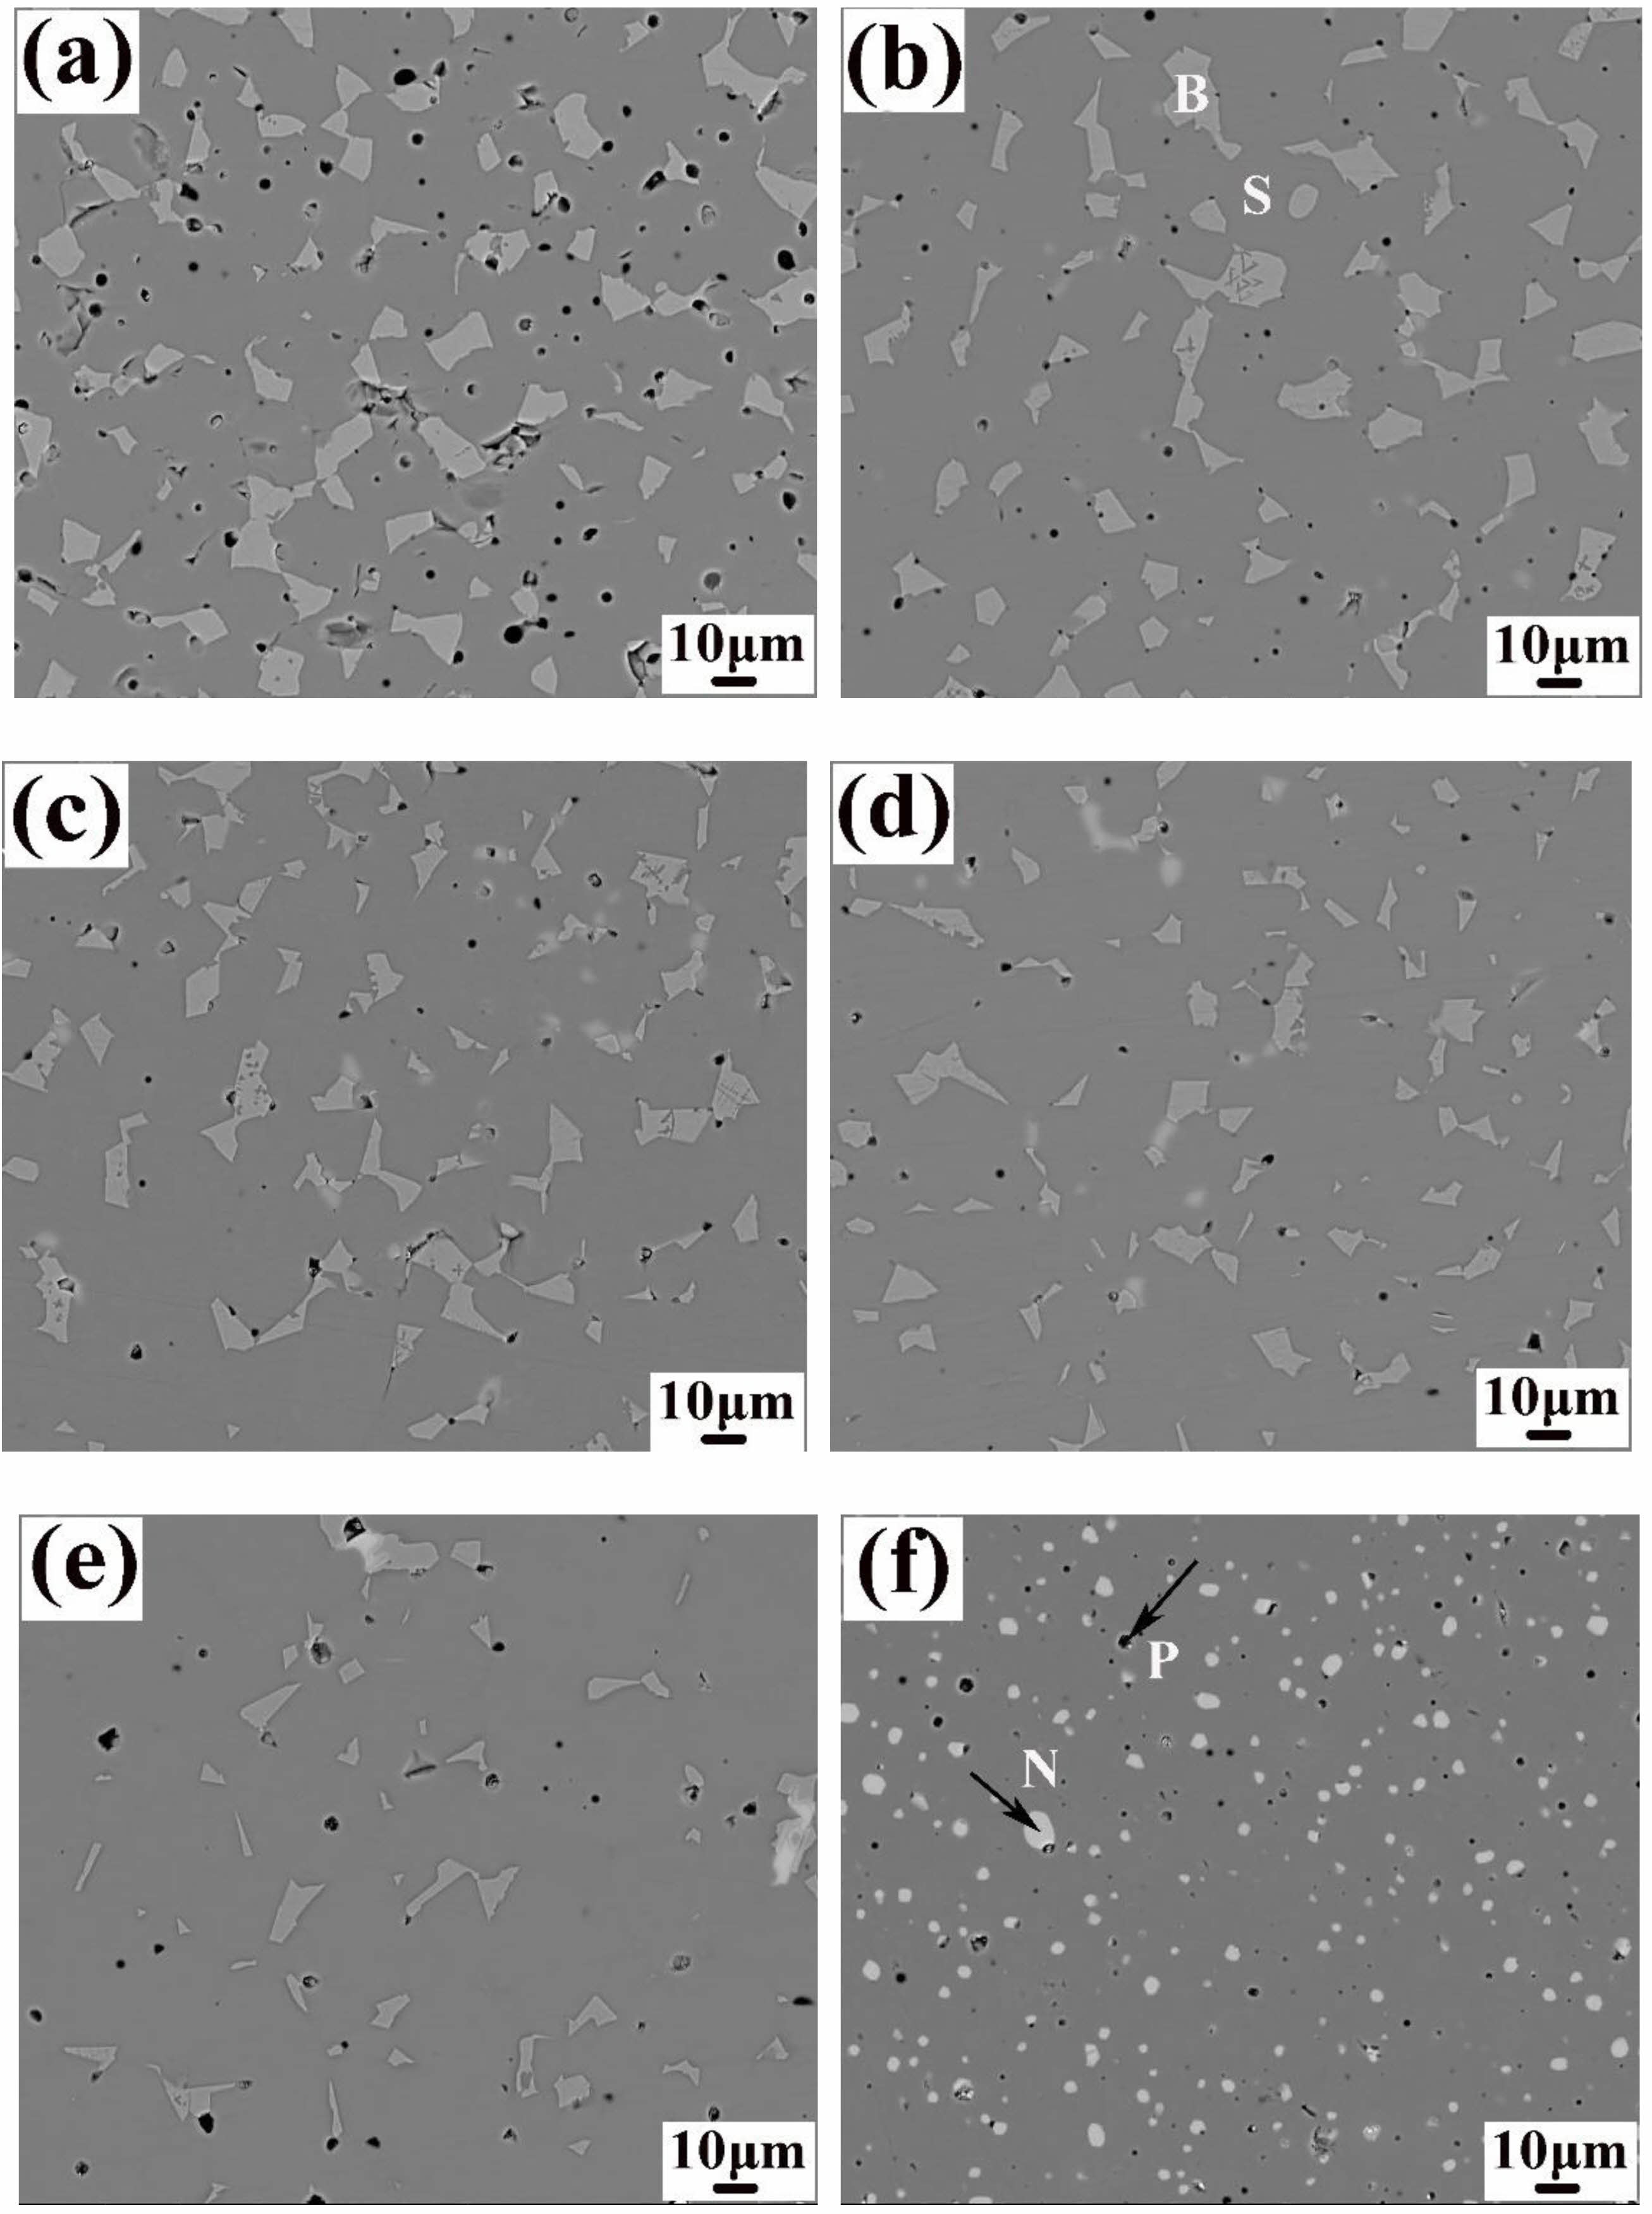
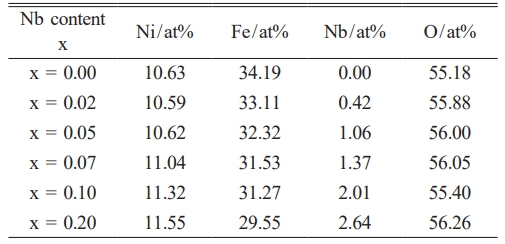
Fig. 2 shows the SEM morphology of Ni1-xNbxFe2O4 ceramics sintered at 1300 °C under nitrogen atmosphere after polishing. It was evident that the number of holes in the doped samples was significantly reduced, resulting in increased density. As the concentration of Nb2O5 doping increased, the NiO phase in the samples diminished until it was no longer detectable. At x = 0.20, a white, speckled FeNbO4 phase emerged in the samples, which aligned with the analytical results obtained from X-ray diffraction (XRD) presented in Fig. 1. Table 1 presents EDX analysis of spinel phase of Ni1-xNbxFe2O4 ceramics. It was evident that as the Nb content increased, the Ni content within the NiFe2O4 ceramic spinel phase continued to rise, even though the Ni content in the sample's composition ratio decreased. This showed that Nb2O5 doping could inhibit the dissociation of NiFe2O4 ceramics to NiO in nitrogen atmosphere. The ionic radii of Nb5+ and Ni2+ were comparable, both measuring 0.69 Å. However, Nb5+ possessed a higher cationic valence, resulting in a more tremendous bonding energy for Nb-O ionic bonds compared to Ni-O ionic bonds. Consequently, Nb-O bonds exhibited greater strength than Ni-O bonds. When Nb5+ partially substituted Ni2+ within the lattice of NiFe2O4 ceramics, it could effectively reduce the oxygen ion vacancy concentration within the lattice. This reduction enhanced the stability of the spinel structure of NiFe2O4 ceramics, thereby inhibiting the dissociation of NiFe2O4 [18].
Grain sizes
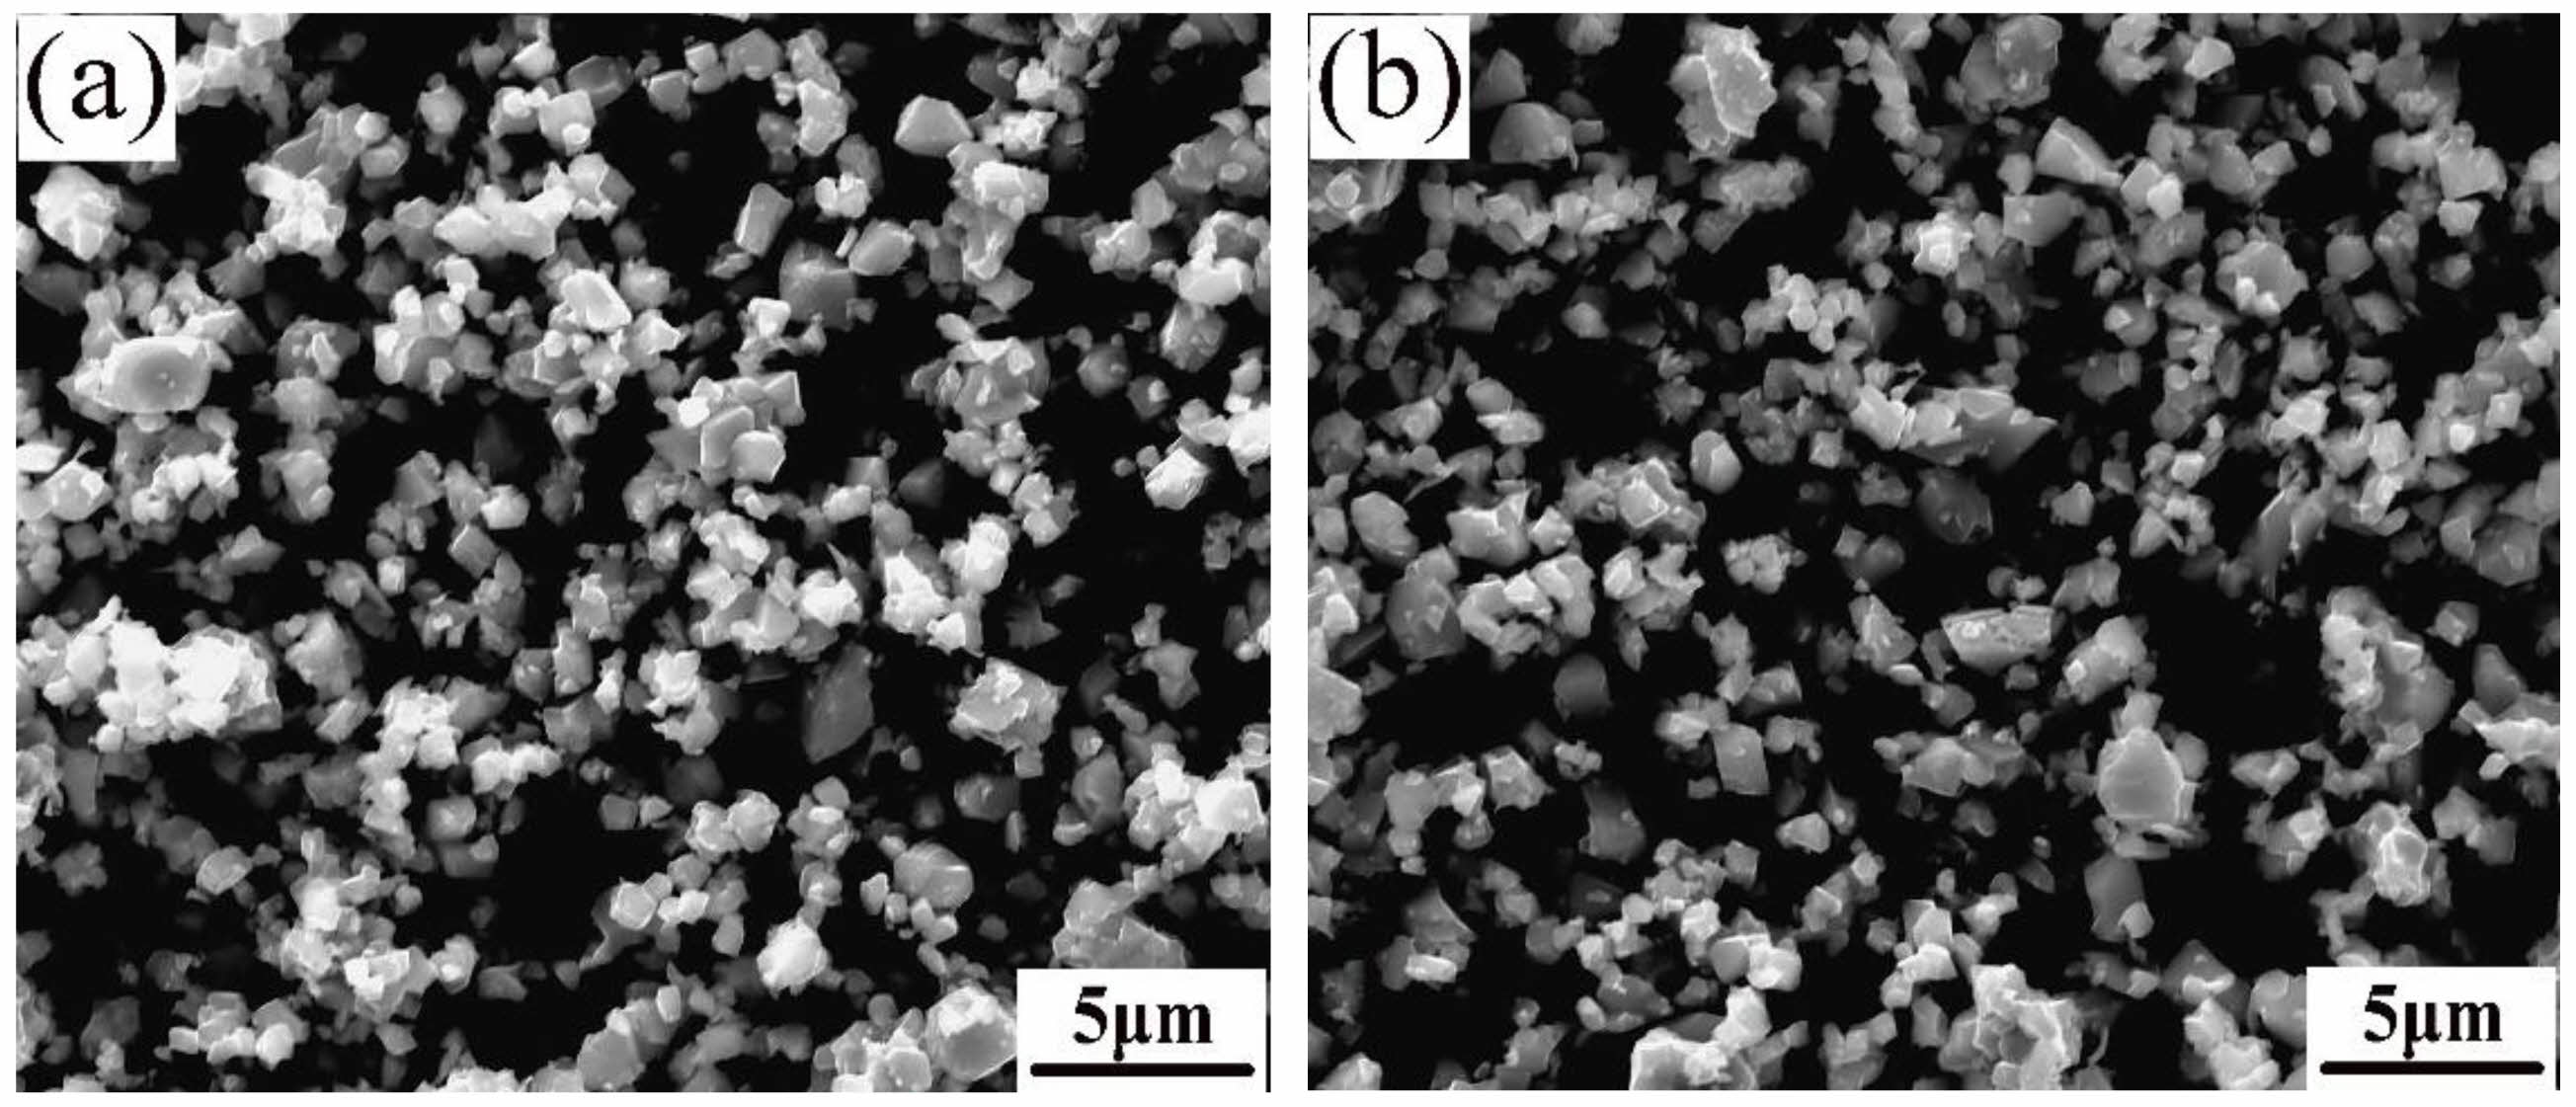
Fig. 3 displays SEM morphology of Ni0.95Nb0.05Fe2O4 and Ni0.90Nb0.10Fe2O4 ceramic powders obtained by calcination at 1200 °C in air. It could be seen that the doped NiFe2O4 ceramic powders were well crystallized, with a slight agglomeration phenomenon between the particles and the mean power grain size of about 2.5 μm.
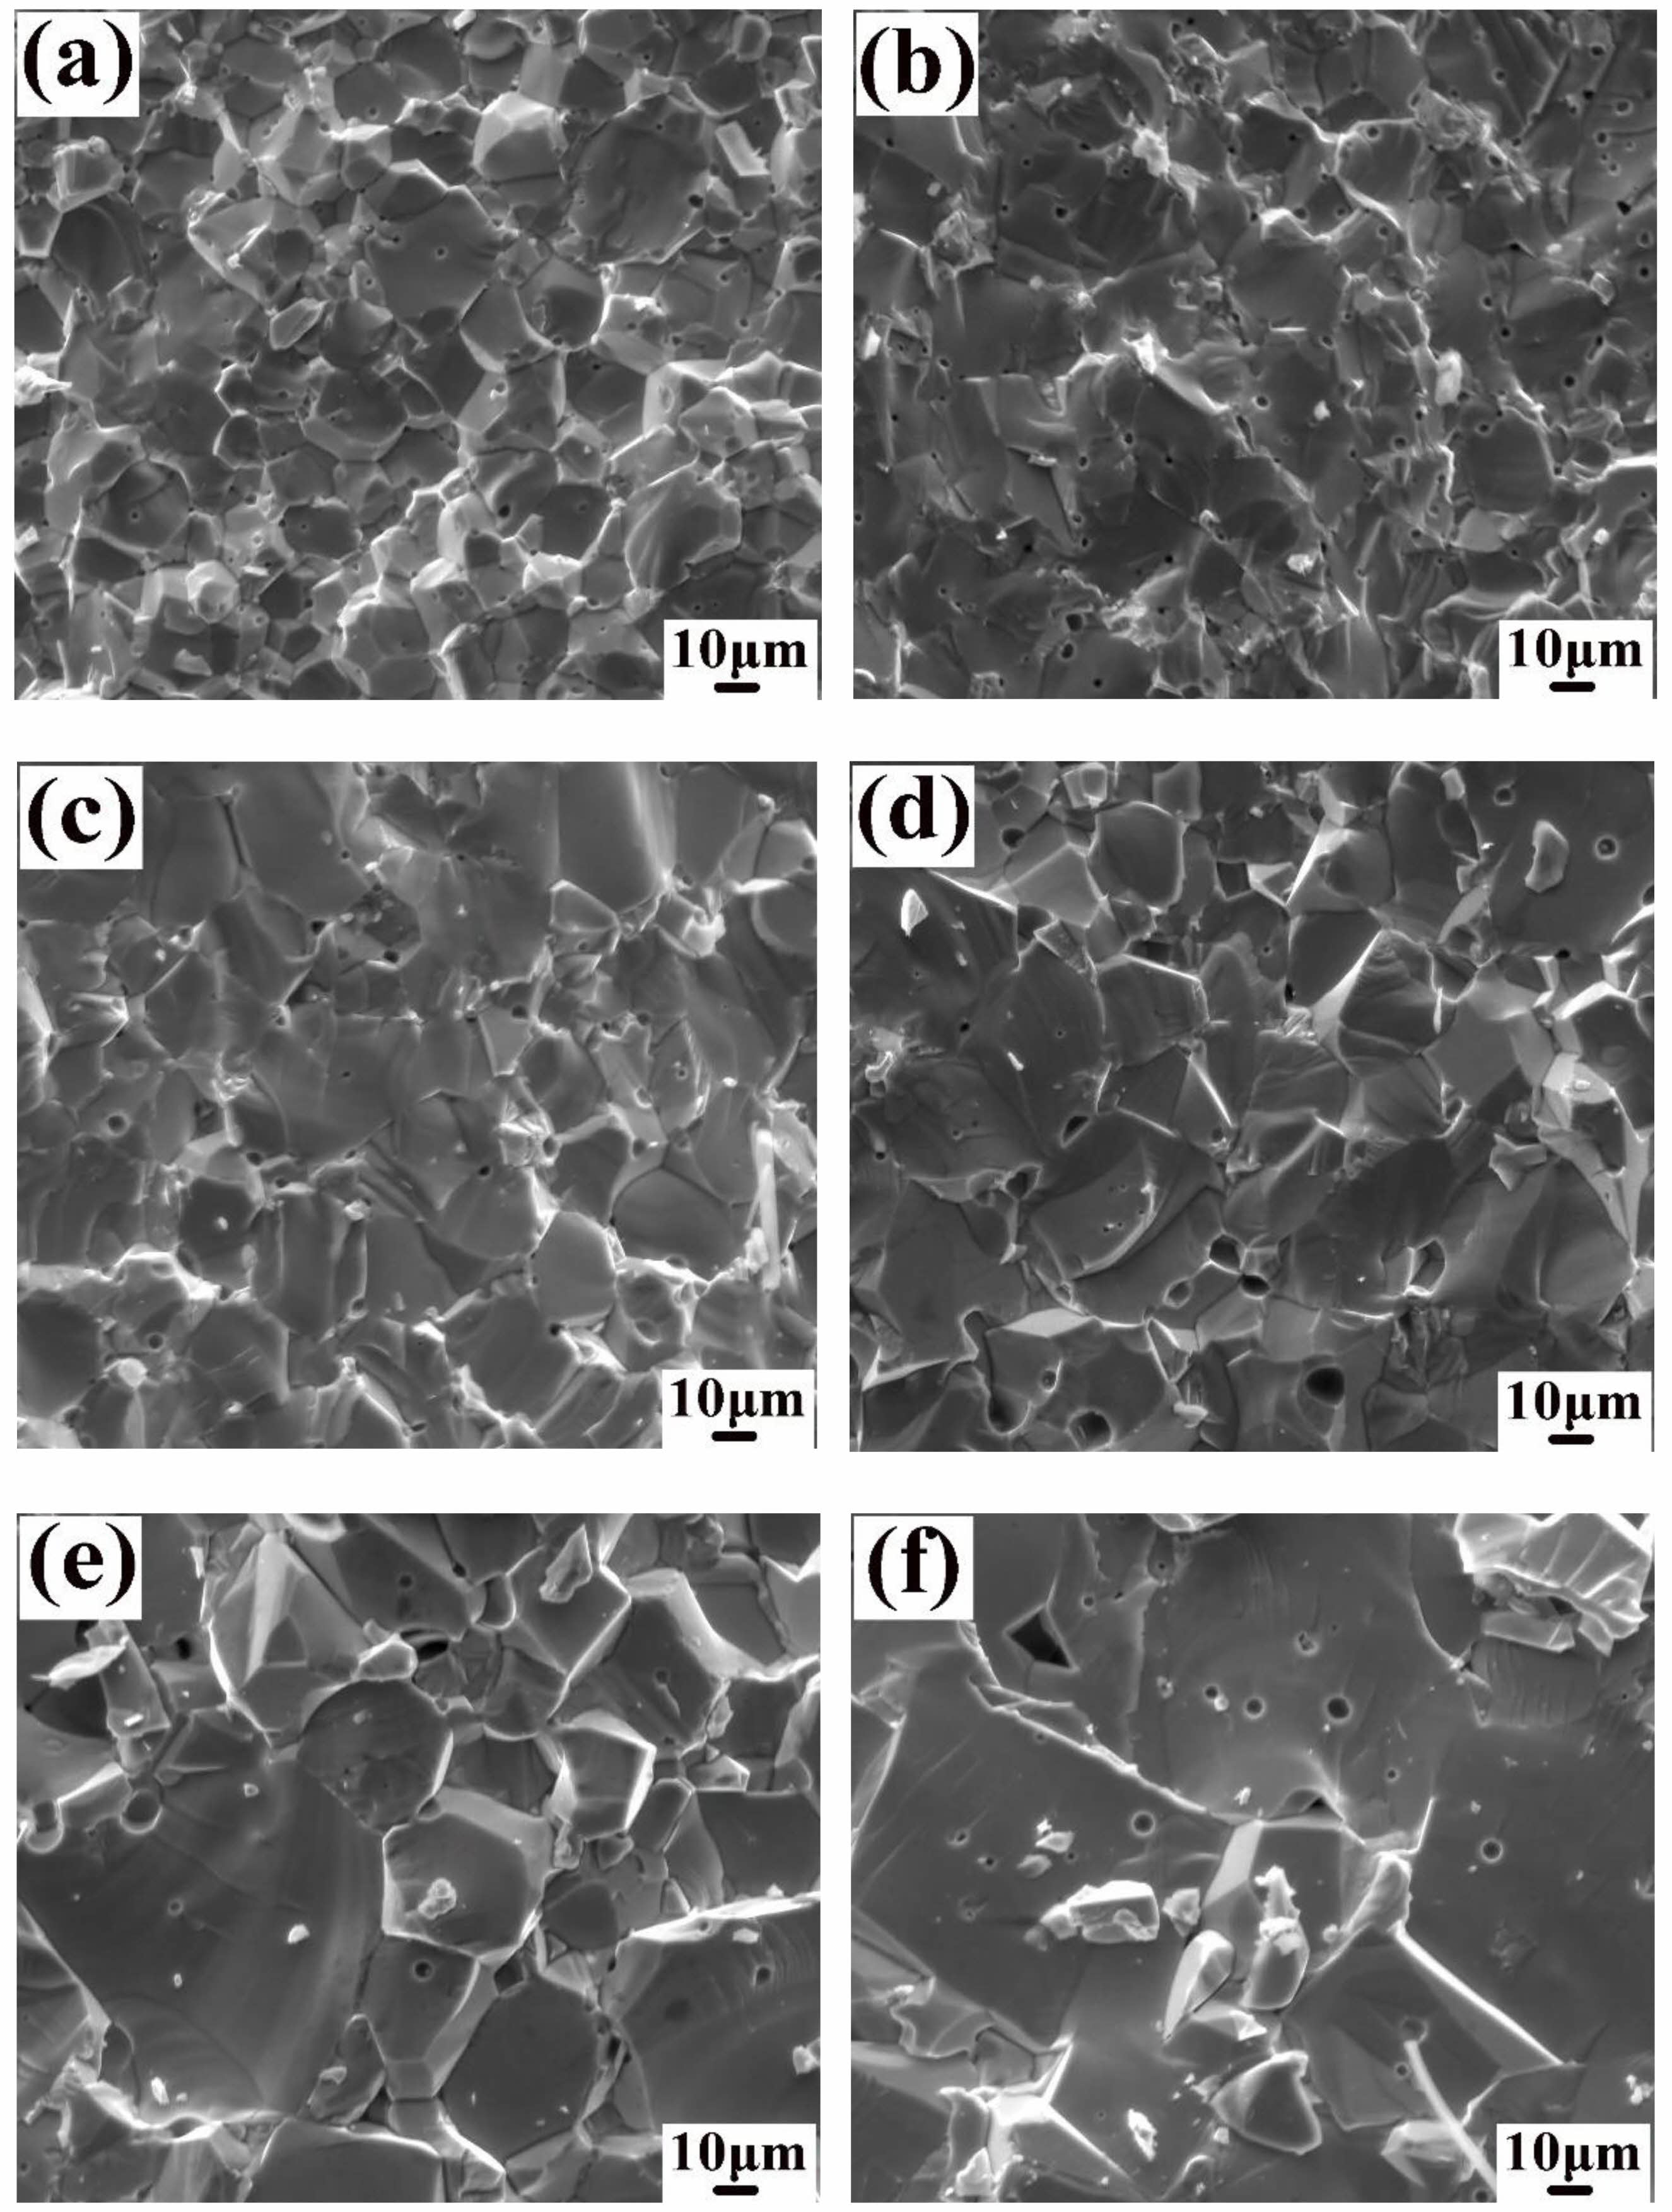
Fig. 4 shows the SEM morphology of Ni1-xNbxFe2O4 (x = 0, 0.02, 0.05, 0.07, 0.10, 0.20) ceramic fracture sintered at 1300 °C under nitrogen atmosphere. It could be found that NiFe2O4 ceramics had gradually increased grain size as Nb2O5 doping elevated. The mean grain size of the undoped samples was about 20 μm, and when the doping amount x = 0.20, grain size reached about 50 μm. This phenomenon could be explained by the following reasons. First of all, Nb5+ ions possessed a higher cationic valence as compared to Ni2+ ions. when Nb5+ replaced Ni2+ into the lattice of NiFe2O4 ceramics, the cationic vacancies of Ni2+ and Fe3+ were formed in the lattice in order to maintain the balance of valences. The concentration of these cationic vacancies increased as doping amount elevated. The increasing cation vacancy concentration accelerated the migration rate of grain boundaries and pores, resulting in continuous grain growth. In addition, the previous analysis indicated that the NiO phase in the NiFe2O4 ceramic samples decreased continuously with the increase of Nb2O5 doping amount. The NiO phase as the second phase hindered the migration of grain boundaries. Therefore, the reduction in the number of NiO phase was also an important reason for promoting the continuous growth of grains with the increase of doping amount.
Relative densities
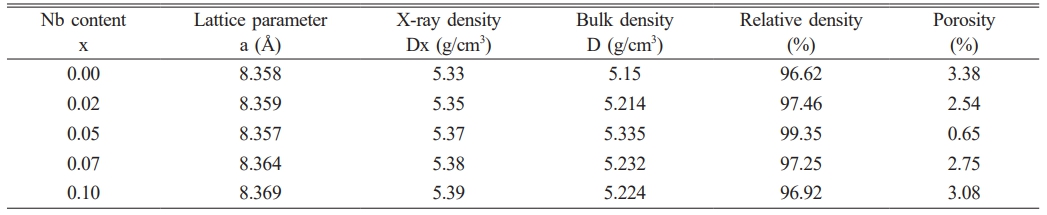
It could be seen from Fig. 2 that the pores of NiFe2O4 ceramics were reduced after doping Nb2O5, and the samples became very dense. For investigating how Nb2O5 doping affected sintering properties of NiFe2O4 ceramics, relative densities and porosities of the samples with different doping amounts were computed (Table 2). Clearly, the lattice constants of NiFe2O4 ceramics exhibited minimal variation after Nb2O5 doping, primarily due to the same ionic radius between Nb5+ and Ni2+ [19-21]. The relative densities of NiFe2O4 ceramics increased and then decreased as Nb2O5 doping increased, and relative densities peaked at 99.35% when Nb Nbdoping amount x was 0.05. According to the sintering mechanism, ceramic sample sintering was mainly attained through cation and anion diffusion, and their diffusion rates together decided the sample sintering properties [22]. NiFe2O4 was classified as the inverse spinel structure wherein the lattice was densely packed with oxygen ions, and the metal cations were filled in the in the tetrahedral and octahedral interstices. The diffusion rate of each ion was closely related to its vacancy concentration. The higher the ion vacancy concentration, the greater the diffusion rate [23, 24]. For the Ni1-xNbₓFe₂O₄ series ceramics, all samples were sintered under nitrogen atmosphere. The effect of vacancy concentration and the diffusion rate of oxygen ions on the sample relative densities was basically the same. The primary reason for the difference in relative densities was the vacancy concentration and the diffusion rate of metal cations. Compared to Ni²⁺ ions, Nb⁵⁺ ions had higher cation valence. When Nb⁵⁺ replaced Ni²⁺ into the lattice of NiFe₂O₄ ceramics, cation vacancies of Ni²⁺ and Fe³⁺ were formed in order to maintain charge balance, and the concentration of these cation vacancies increased with higher doping. According to the sintering mechanism [22], the increase of the cation vacancy concentration of Ni2+ and Fe3+ was conducive to improving the diffusion rate of the corresponding ions, and the sample relative densities eventually elevated with the increase of the doping amount of Nb2O5. However, as Nb2O5 doping further increased, the increasing cation vacancy concentration increased the moving speed of the grain boundaries, resulting in the growth rate of grains too fast so that the pores could not be eliminated in time and remained in the grains, as shown in Fig. 4(f). As a result, the relative densities of the materials showed a downward trend.
Electrical conductivity
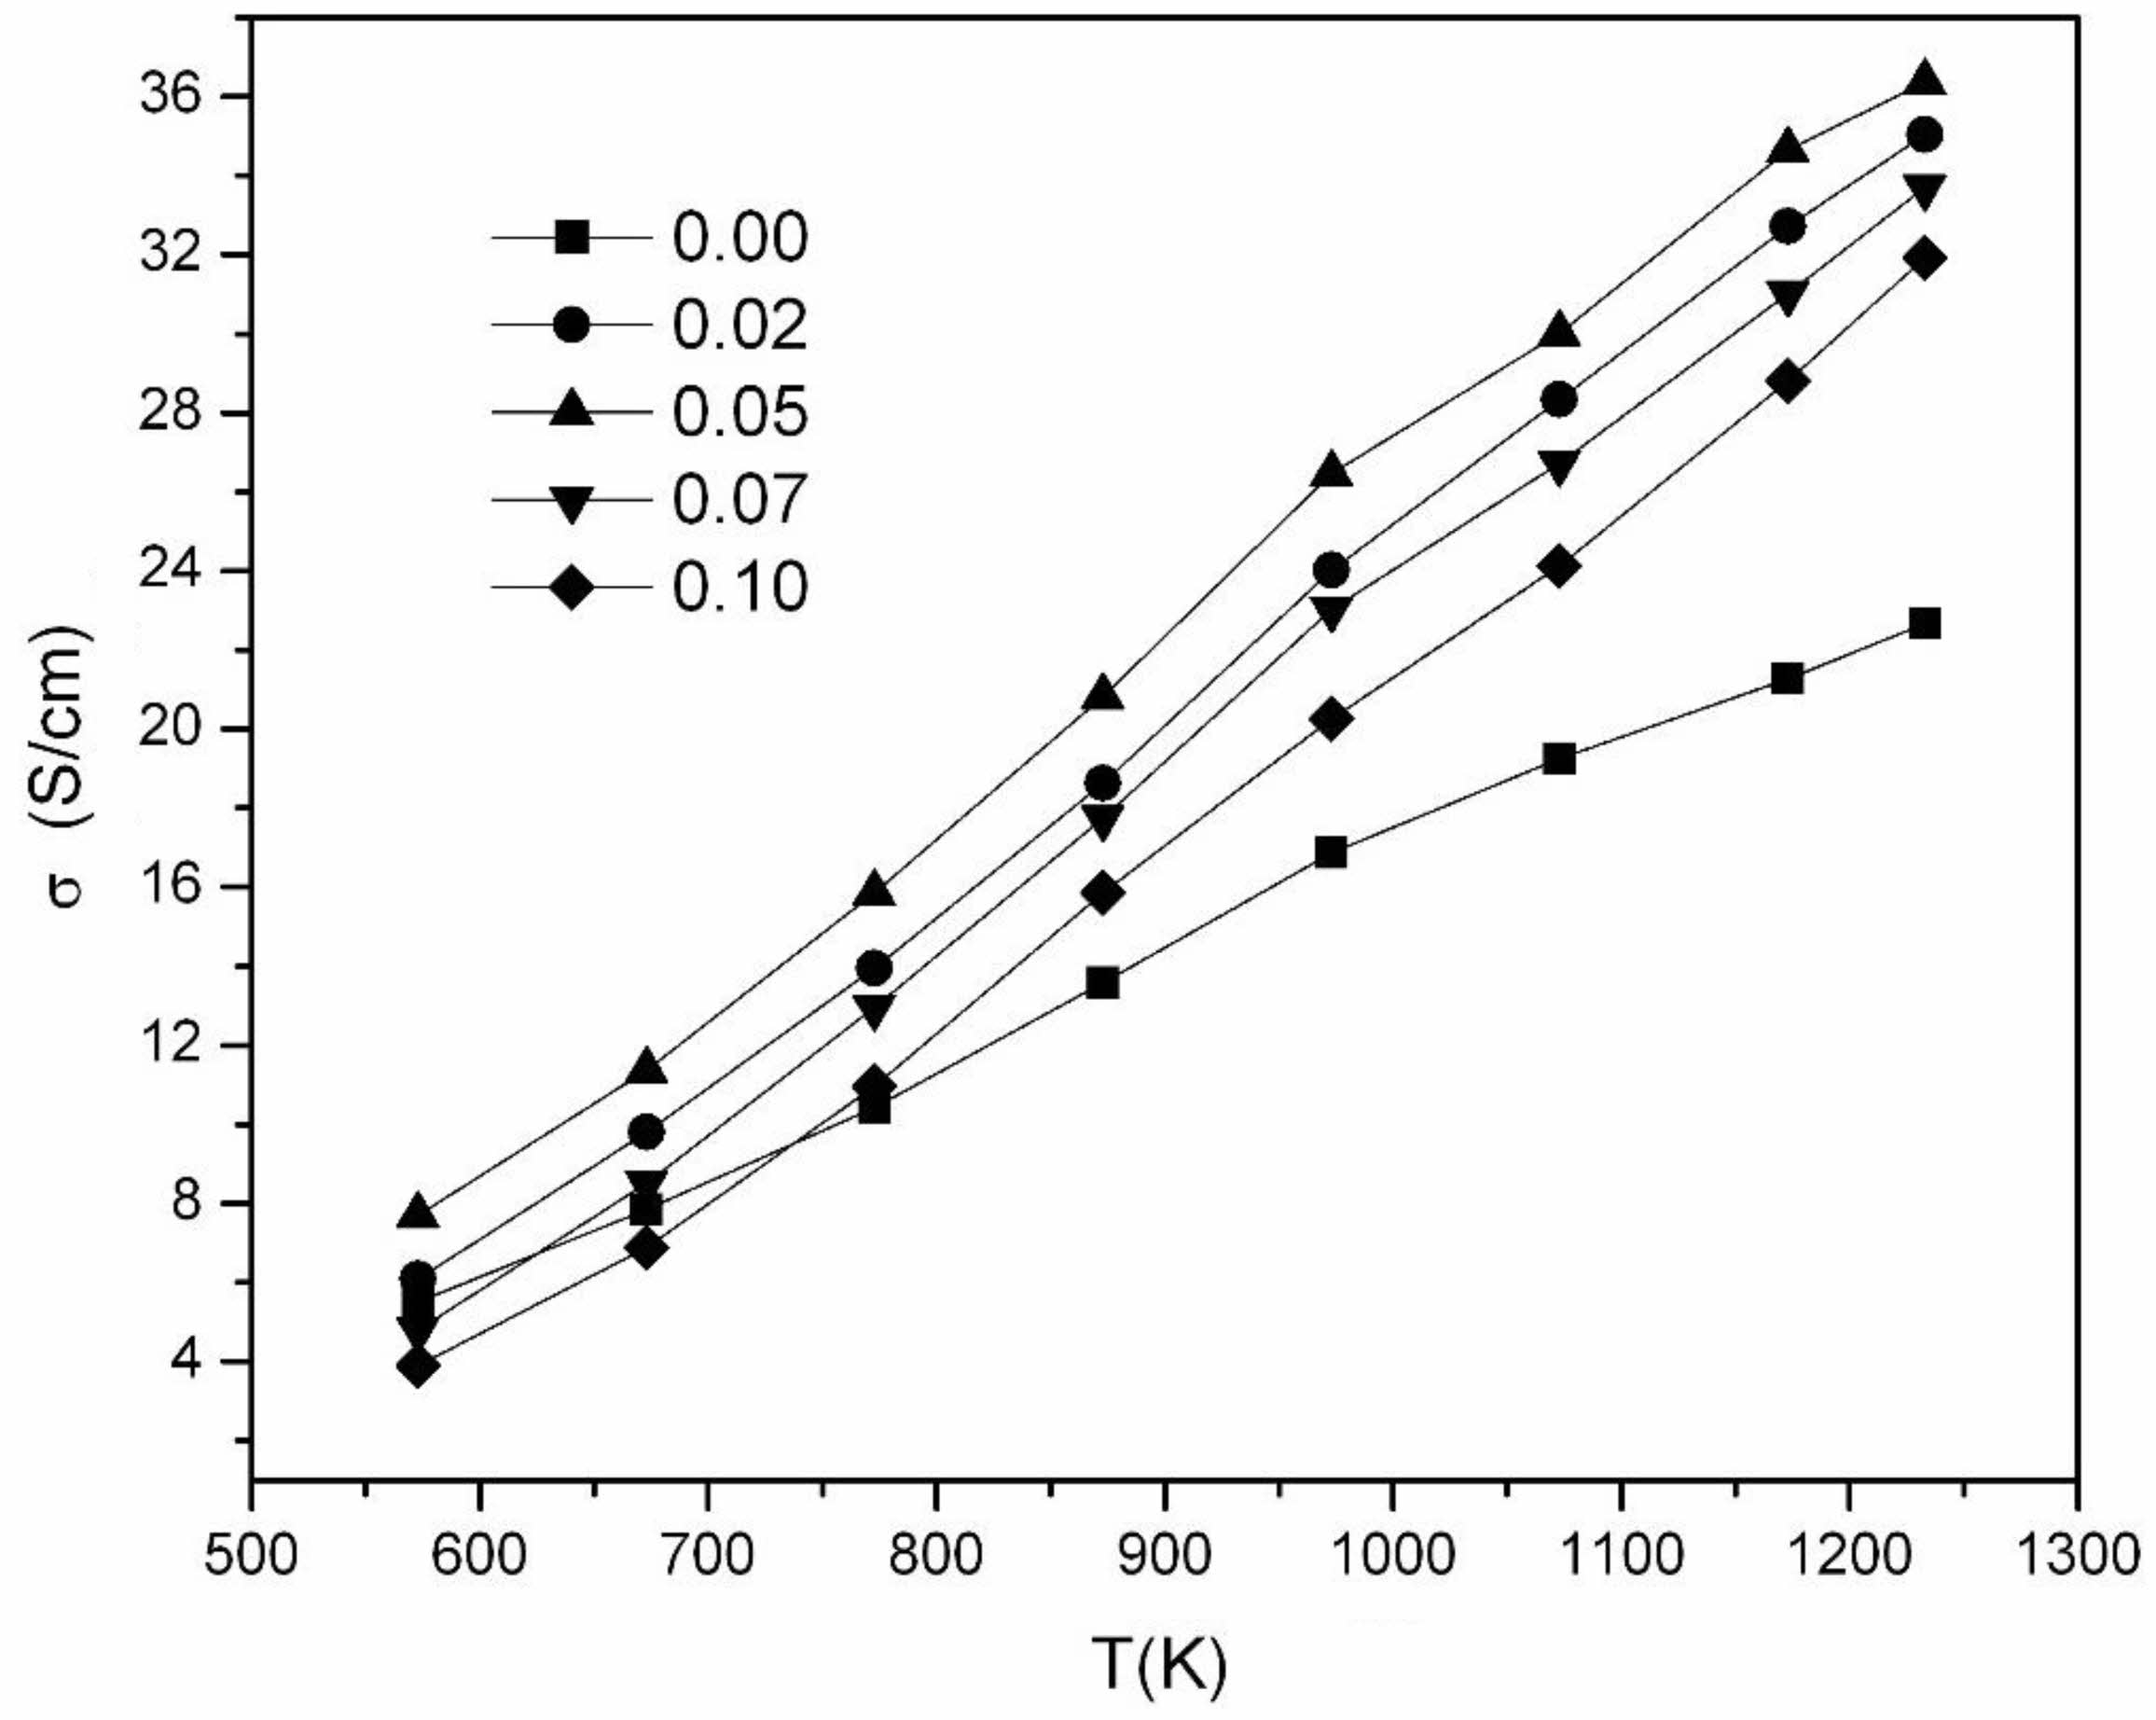
Fig. 5 displays the changes in electrical conductivities at the Ni1-xNbxFe2O4 ceramics sintering temperature of 1300 °C under nitrogen atmosphere. It could be seen that the sample electrical conductivities elevated with rising temperature, showing the conduction law of semiconductor. The DC conductivities of the
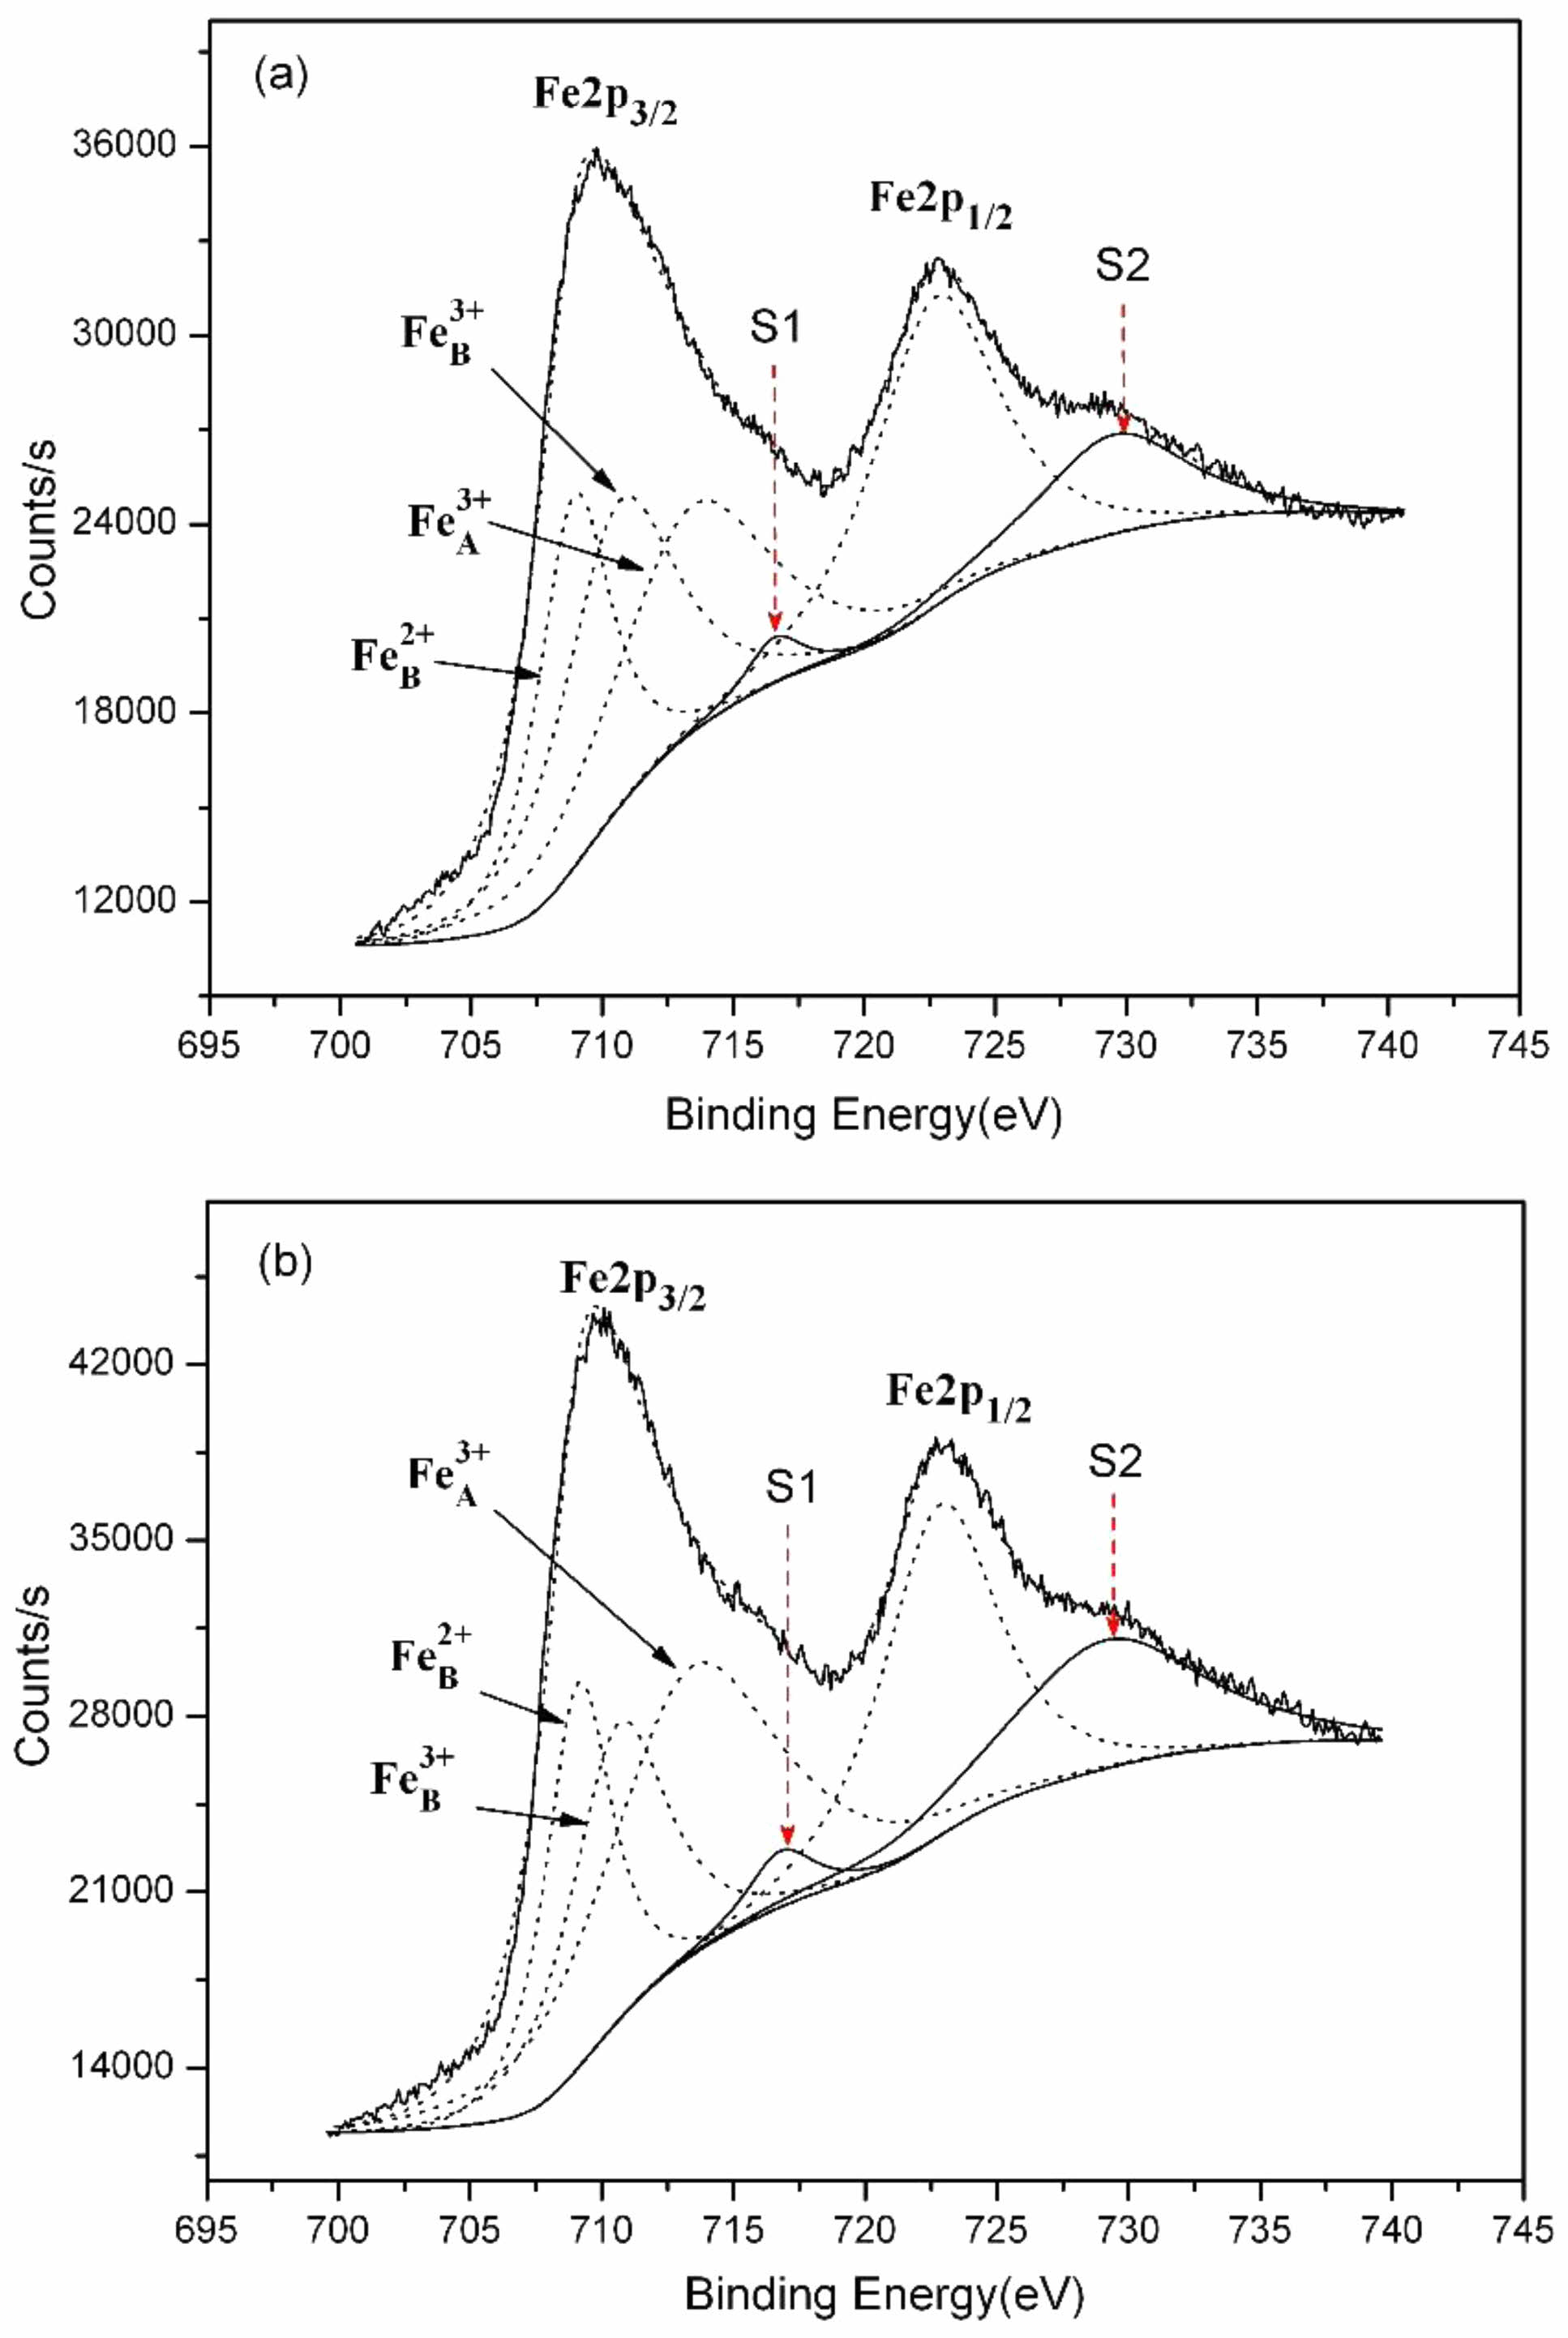
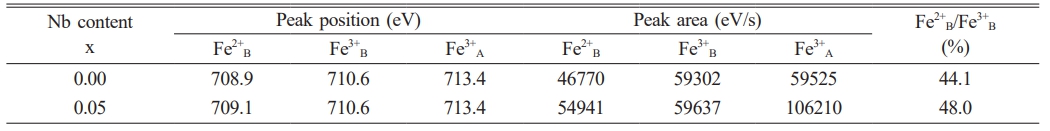
Ni1-xNbxFe2O4 ceramics first elevated and later declined as Nbdoping amount increased. The x = 0.05 composition showed the highest conductivity of the series with a value of 36.37 S/cm at 960 ℃, which increased by 60.5% compared to undoped NiFe2O4ceramics. In order to analyze the concentration of Fe2+ at the octahedral and and the valence of the Nb in NiFe2O4 ceramics doped with Nb2O5, XPS tests were performed on the samples with compositions of NiFe2O4 and Ni0.95Nb0.05Fe2O4. Fig. 6 shows the XPS spectras of the Fe2p peaks of the two samples. Fe3+A represents Fe3+ at the A position of the spinel tetrahedron, Fe3+B and Fe2+B represent Fe3+ and Fe2+ at the B position of the octahedron, and S1 and S2 are satellite peaks, respectively. It could be seen that the element Fe in both samples presented two valence states of +3 and +2. The corresponding peak positions, peak areas, and the ratios of octahedral Fe²⁺/Fe³⁺ for each peak were shown in Table 3. It could be observed that the ratios of Fe²⁺/Fe³⁺ at octahedral positions in the doped samples increased by 3.9% compared with undoped samples. After Nb5+ replaced Ni2+ into the lattice of NiFe2O4 ceramics, some Fe3+ were reduced to Fe2+ for maintaining the valence balance, and the generated Fe2+ preferentially occupied the B-position of the octahedron [25, 26], resulting in the increase of Fe2+B/Fe3+B in the B-position of the octahedron (see Table 3).
The electrical conductivity of NiFe₂O₄ ceramics depended on the concentration of Fe²⁺ at octahedral sites [27, 28]. The higher concentration of Fe2+ led to the superior material electrical conductivity. Thus, the increase of Fe²⁺/Fe³⁺ ratio after doping made NiFe2O4 ceramics exhibit more excellent electrical conductivity. The Nb⁵⁺ ions into the lattice also resulted in octahedral B-site Fe³⁺ vacancies, and the concentration of these vacancies increased as Nb2O5 doping amount increased. The increasing Fe3+ vacancy concentration reduced the probability of electron hopping between octahedral Fe²⁺ and Fe³⁺ ions. Therefore, the NiFe₂O₄ ceramics conductivities showed a decreasing trend when the doping amount exceeded 0.05. In addition, the relative densities of doped NiFe₂O₄ ceramics exhibited the similar trend to that of the electrical conductivity, both increasing initially and then decreasing, peaking at x = 0.05. The increasing relative density could reduce the electron transport resistance [29], so the effect of the relative densities of doped NiFe2O4 ceramics on the electrical conductivity could not be overlooked.
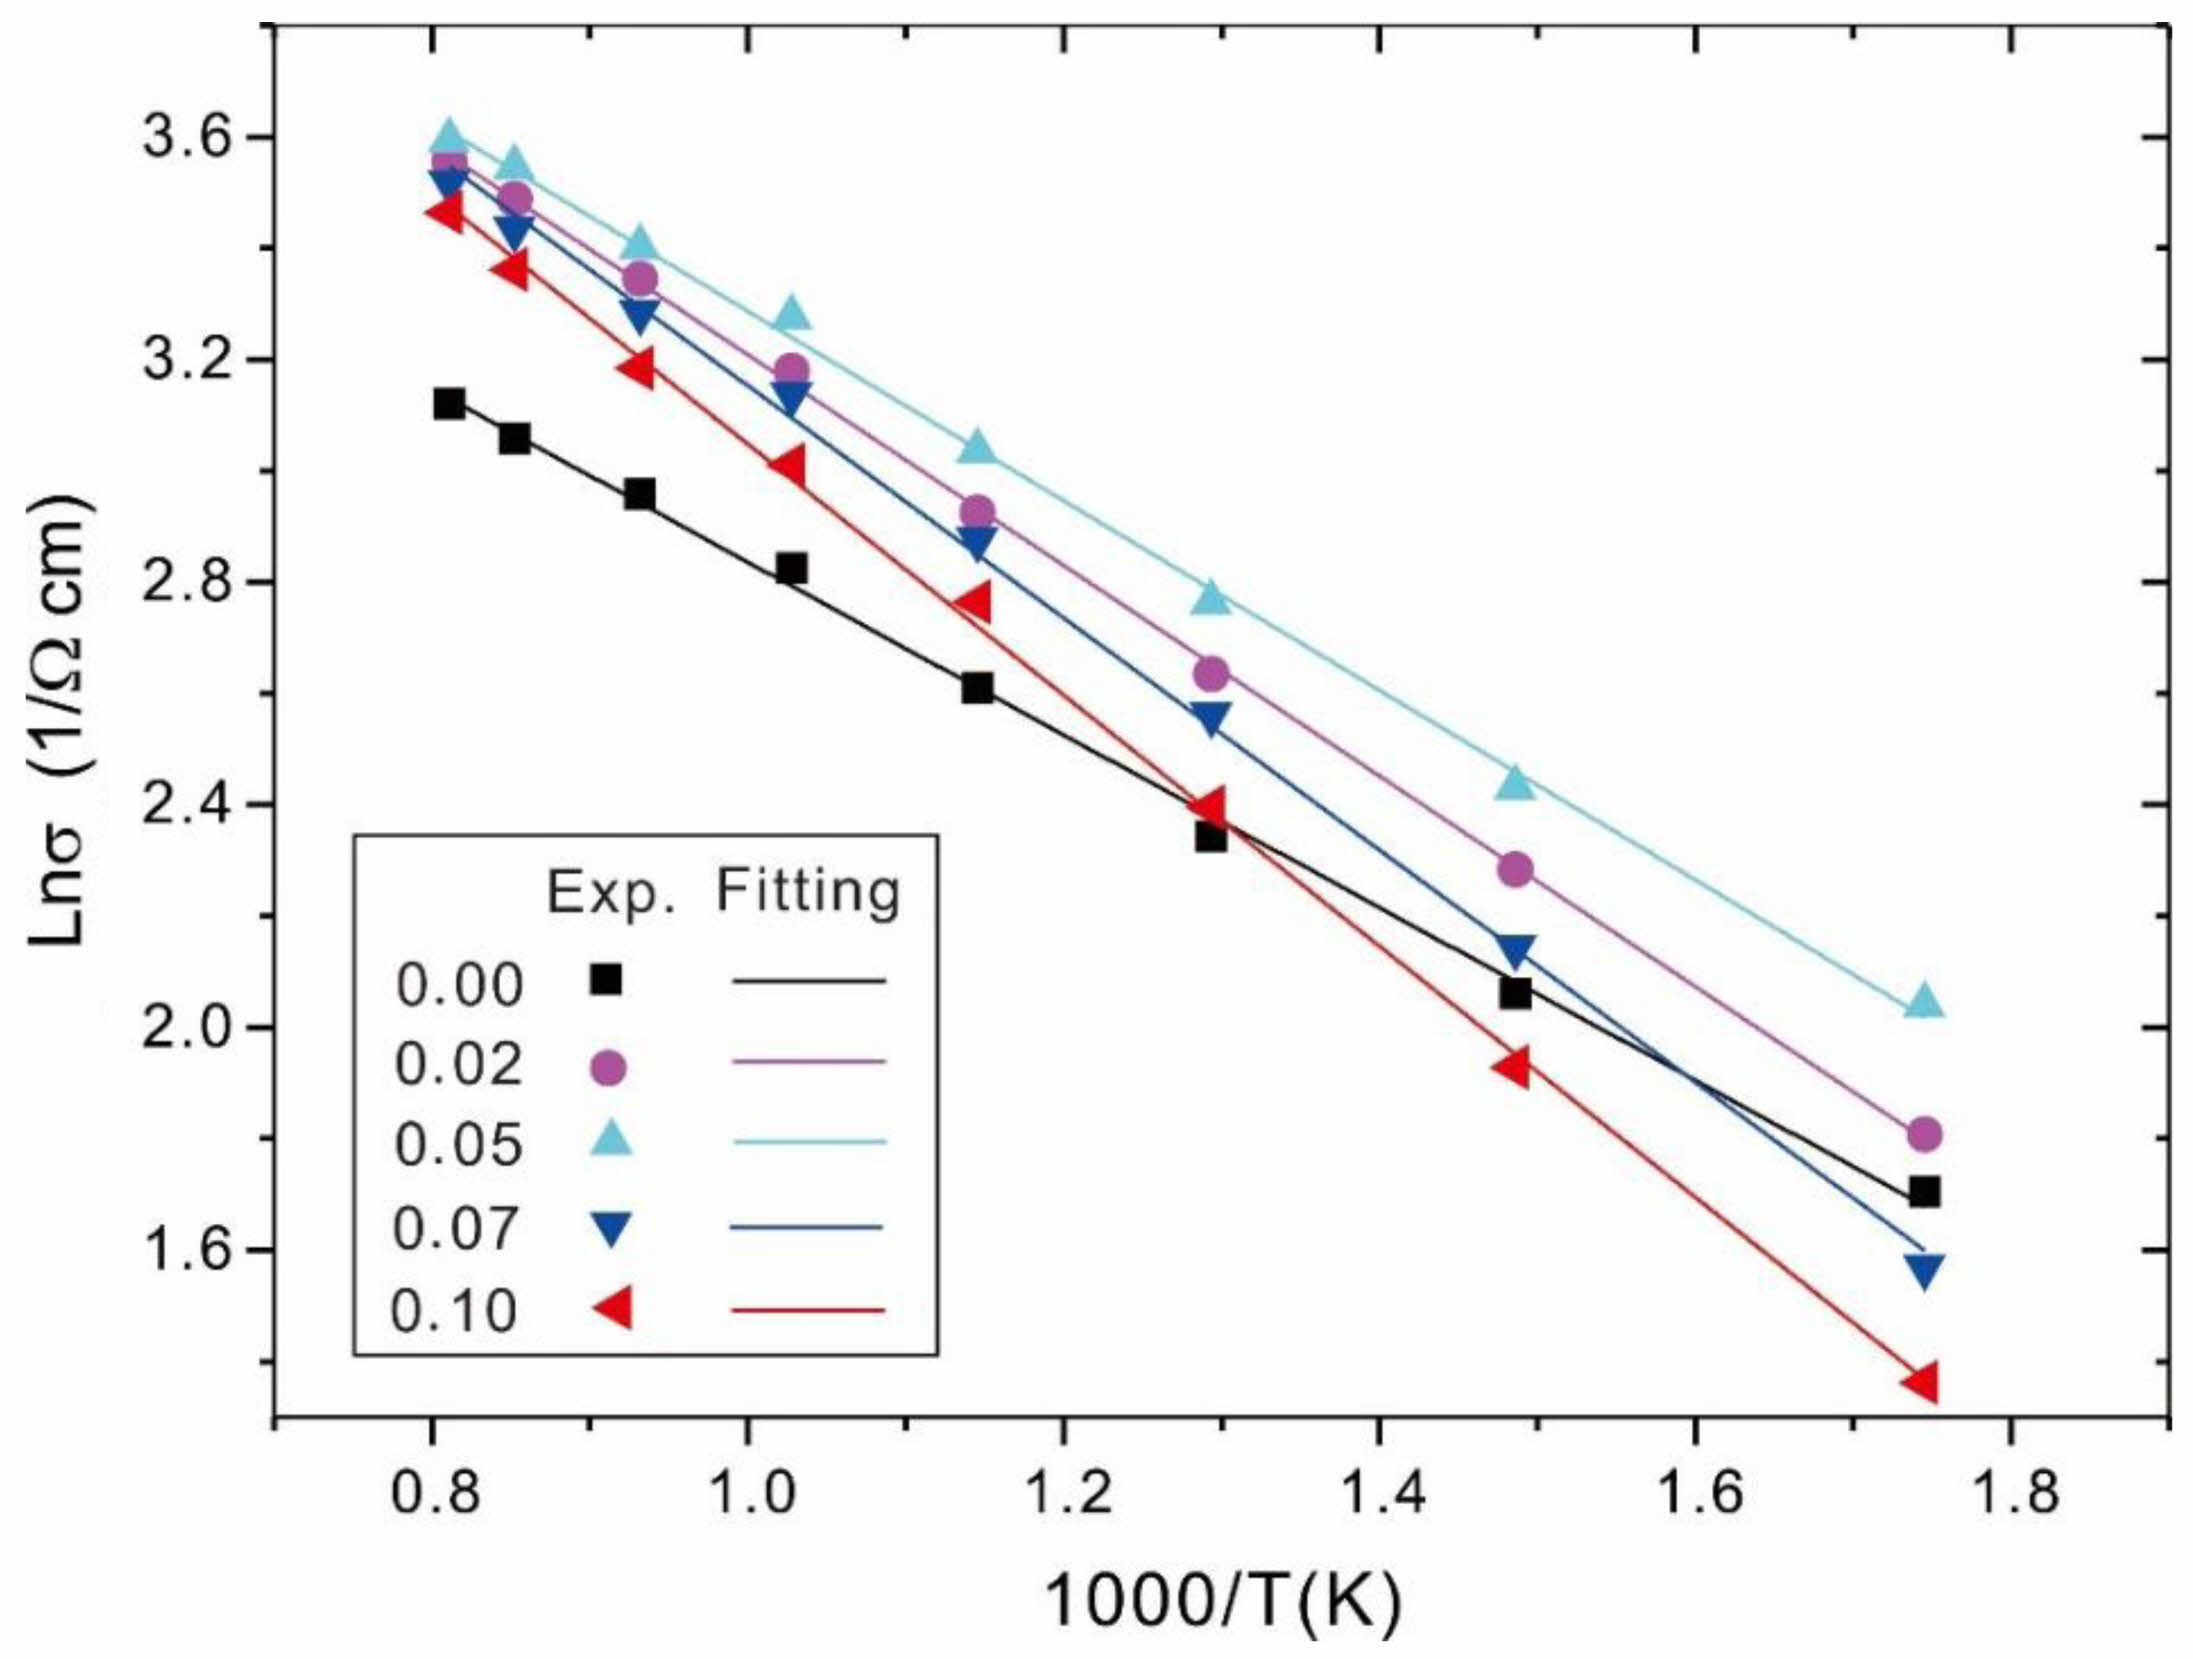
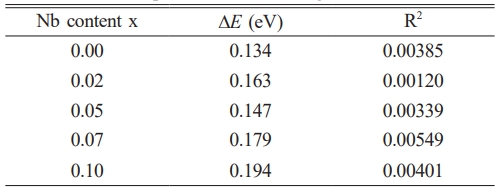
Fig. 7 shows the plots of lnσ vs. 1000/T for Ni1-xNbxFe2O4 ceramics sintered at 1300 ℃. Solid lines were fitted to the data according to the Arrhenius equation. The activation energy DE and the R2 value were obtained in Table 4 from the slopes of the fitted lines. It could be seen that for all the prepared samples, there was basically a linear relationship between lnσ and 1000/T, indicating that the relationship between the electrical conductivity and temperature in the doped samples remained consistent with σ = σ0 exp[-(∆E/kT)]. In addition, as shown in Table 4, the doping concentration (x = 0.05) corresponded to the lowest conductive activation energy in the doped samples. The observed inverse correlation between activation energy and electrical conductivity was in good agreement with the fundamental semiconductor theory, where lower activation energies typically correspond to higher charge carrier mobility and improved conductivity performance.
|
Fig. 1 X-ray diffraction patterns of Ni1-xNbxFe2O4 ceramics sintered at 1300 ℃: (a) x = 0.02; (b) x = 0.20. |
|
Fig. 2 SEM images of polished Ni1-xNbxFe2O4 ceramics sintered at 1300 ℃: (a) x = 0.00; (b) x = 0.02; (c) x = 0.05; (d) x = 0.07; (e) x = 0.10; (f) x = 0.20. Legend: S = spinel, B = bunsenite, N = FeNbO4, and P = pores. |
|
Fig. 3 SEM images of Ni1-xNbxFe2O4 powders calcined at 1200 ℃: (a) x = 0.05; (b) x = 0.10. |
|
Fig. 4 Cross-section SEM images of Ni1-xNbxFe2O4 ceramics sintered at 1300 ℃: (a) x = 0.00; (b) x = 0.02; (c) x = 0.05; (d) x = 0.07; (e) x = 0.10; (f) x = 0.20. |
|
Fig. 5 Plots of σ vs. T for Ni1-xNbxFe2O4 ceramics sintered at 1300 ℃. |
|
Fig. 6 PS spectrums of Fe2p peaks for Ni1-xNbxFe2O4 samples sintered at 1300 ℃: (a) x = 0.00; (b) x = 0.05. |
|
Fig. 7 Plots of lnσ vs. 1000/T for Ni1-xNbxFe2O4 ceramics sintered at 1300 ℃. Solid lines were fitted to the data according to the Arrhenius equation. |
|
Table 2 Relative densities of Ni1-xNbxFe2O4 ceramics sintered in nitrogen at 1300 ℃ |
|
Table 3 Relative datas of Fe2p peaks for Ni1-xNbxFe2O4 samples sintered at 1300 ℃ |
|
Table 4 Conduction activation energy ∆E and R2 value for Ni1-xNbxFe2O4 samples sintered in nitrogen at 1300 ℃. |
In this work, the microstructures, phase compositions, grain sizes, relative densities as well as electrical conductivities of Nb doped nickel ferrite ceramics were studied. According to our obtained experimental analysis, we could draw three conclusions below.
(1) When the Nb doping amount x was less than 0.20, only diffraction peaks of NiFe2O4 and NiO could be detected in Ni1-xNbxFe2O4 ceramics. On the contrary, when the Nb doping amount x was 0.20, the diffraction peak of FeNbO4 appeared while the diffraction peak of NiO phase gradually disappeared.
(2) The grain sizes of the Ni1-xNbxFe2O4 ceramics slowly elevated as Nbdoping amount elevated. At the doping amount x of 0.20, the mean grain size reached around 50 μm, 2.5 times higher than that of undoped NiFe2O4ceramics. This was associated with the increasing speed of grain boundary movement and the increase of the pore mobility.
(3) when the Nb doping amount x was 0.05, the relative densities reached the maximum value of 99.35%, which increased by 2.73% compared to pure NiFe2O4 samples, attributing to the increase of Ni2+ and Fe3+ vacancy concentration.
(4) The DC conductivities of the Ni1-xNbxFe2O4 ceramics first elevated and later declined as the Nbdoping amount elevated. The x = 0.05 composition showed the highest conductivity of the series with a value of 36.37 S/cm at 960 ℃, which increased by 60.5% compared to undoped NiFe2O4ceramics. It was because that Fe2+ ion concentration elevated at the octahedral sites after Nb doping and the porosity decreased.
This study was funded by the Scientific Research Fund of Hunan Provincial Education Department (23A0614), the Hunan Provincial Natural Science Foundation of China (2024JJ7262) and the Double First-Class Discipline Construction Program of Hunan Province.
- 1. H.Y. He, J. Ceram. Process. Res. 16 (2015) 313.
-

- 2. Q. Liu, L. Lv, J. Zhou, X. Chen, X. Bian, and P. Liu, J. Ceram. Process. Res. 13 (2012) 110.
-
- 3. B. Dey, C. Manoharan, M. Venkateshwarlu, C.S. Pawar, and S. Sagadevan, Ceram. Int. 50 (2024) 12121.
-
- 4. V. Kumari, K. Dey, S. Giri, and A. Bhaumik, RSC. Adv. 51 (2016) 45701.
-
- 5. J. He, S. Yang, and A. Riisager, Catal. Sci. Technol. 8 (2018) 790.
-
- 6. H.C. Shin, K.D. Jung, S.H. Han, J.W. Kim, and S.C. Choi, J. Ceram. Process. Res. 4 (2003) 30.
- 7. P.B. Kharat, S.D. More, S.B. Somvanshi, and K.M. Jadhav, J. Mater. Sci: Mater. Electron. 30 (2019) 6564.
-
- 8. J. Niresh, N. Archana, S. Neelakrishnan, V.M. Sivakumar, and D.S. Dharun, J. Ceram. Process. Res. 21 (2020) 343.
-
- 9. B. Liu, L. Zhang, K. Zhou, Z. Li, and H. Wang, Solid. State. Sci. 13 (2011) 1483.
-
- 10. K.S. Joshy, R. Augustine, A. Mayeen, S.M. Alex, A. Hasan, S. Thomas, and H. Chi, New. J. Chem. 44 (2020) 18162.
-
- 11. A.M. Ilosvai, D. Dojcsak, C. Váradi, M. Nagy, F. Kristály, B. Fiser, B. Viskolcz, and L. Vanyorek, Int. J. Mol. Sci. 23 (2022) 5081.
-
- 12. S. Pawar, M. Gandi, I. Arief, B. Krause, P. Pötschke, and S. Bose, Chemistry. Select. 21 (2017) 5984.
-
- 13. S. Hassan, M. Ahmad, A. Rehman, M.W. Iqbal, S.F. Shaukat, and H.S.M. Abd-Rabboh, J. Energy. Storage. 55 (2022) 105320.
-
- 14. E.M. Kamar, M. Khairy, and M.A. Mousa, J. Mater. Res. Technol. 24 (2023) 7381.
-
- 15. K. Anu and J. Hemalatha, Ceram. Int. 48 (2022) 3417.
-
- 16. B. Liu, M. Tang, X. Wei, and H. Li, J. Ceram. Process. Res. 23 (2022) 770.
-
- 17. Y. Zhang, Y. Yang, D. Chen, C. Chen, and Y. Meng, J. Ceram. Process. Res. 24 (2023) 342.
-
- 18. L.S. Chen, S.Y. Chen, and G.L. Lu, J. Mater. Sci. 41 (2006) 6465.
-
- 19. M.B. Shelar, P.A. Jadhav, S.S. Chougule, M.M. Mallapur, and B.K. Chougule, J. Alloy. Compd. 476 (2009) 760.
-
- 20. A.M. Abdeen, O.M. Hemeda, E.E. Assem, and M.M. El-Sehly, J. Magn. Magn. Mater. 238 (2002) 75.
-
- 21. S.S. Hussein and E.K. Al-Shakarchi, J. Ceram. Process. Res. 25 (2024) 323.
-
- 22. G.C. Kuczynski, Sintering Processes, Plenum Press, New York, 1980.
-
- 23. Y. Cheng, Y. Zheng, Y. Wang, F. Bao, and Y. Qin, J. Solid. State. Chem. 178 (2005) 2394.
-
- 24. I.N. Esha, Md. Al-Amin, F.T.Z. Toma, E. Hossain, M.N. I. Khan, and K.H. Maria, J. Ceram. Process. Res. 20 (2019) 530.
-
- 25. E.M.M. Ibrahim, Appl. Phys. A. 89 (2007) 203.
-
- 26. A.M. Abdeen, J. Magn. Magn. Mater. 192 (1999) 121-129.
-
- 27. R.S. Devan, Y.D. Kolekar, and B. Kchougule, J. Phys.: Condens. Matter. 18 (2006) 9809.
-
- 28. T. Mariam, I.N. Esha, M.N.I. Khan, S. Choudhury, and K.H. Maria, J. Ceram. Process. Res. 21 (2020) 442.
-
- 29. X.F. Chang, C. Zhang, X.L. Dong, W. Zhou, W.Q. Jin, Z.P. Shao, and N.P. Xu, J. Membrane. Sci. 316 (2008) 128.
-
 This Article
-
2025; 26(2): 203-208
Published on Apr 30, 2025
- 10.36410/jcpr.2025.26.2.203
- Received on Nov 1, 2024
- Revised on Feb 21, 2025
- Accepted on Mar 11, 2025
Services
- Abstract
introduction
experimental
results and discussion
conclusions
- Acknowledgements
- References
- Full Text PDF
Shared
Correspondence to
- Baogang Liu
-
School of Energy and Electromechanical Engineering, Hunan University of Humanities, Science and Technology, Loudi 417000, China
Tel : (86-738)8326910 Fax: (86-738)8326910 - E-mail: liudd2016@126.com
Clean-Energy Research Institute(CRI), Hanyang University, 222, Wangsimni-ro, Seongdong-gu, Seoul, 04763, Korea
E-mail: jcpr@hanyang.ac.kr