


- Dielectric relaxation behaviour in Y3+ substituted Li0.5Zn0.1Ti0.1Fe2.3O4 spinel ferrites
Athikho Hriishu, Thongam Ningthouba Singh and Mamata Maisnam*
Department of Physics, National Institute of Technology Manipur, Langol, Imphal-795004, India
This article is an open access article distributed under the terms of the Creative Commons Attribution Non-Commercial License (http://creativecommons.org/licenses/by-nc/4.0) which permits unrestricted non-commercial use, distribution, and reproduction in any medium, provided the original work is properly cited.
Trivalent yttrium, Y3+ substituted lithium-zinc-titanium ferrite with compositional formula Li0.5Zn0.1Ti0.1YxFe2.3-xO4 (x = 0.00, 0.02, 0.04, 0.06, 0.08, 0.10) were synthesized by the conventional ceramic method and sintered at 1050°C for 6h. The effect of Y3+ substitution on the structure and microstructure was investigated by using X-ray diffraction (XRD) and Scanning Electron Microscopy (SEM) respectively. The X-ray diffraction analysis confirmed the single-phase spinel structure and parameters like the crystallite size, lattice constant and X-ray density were calculated. The SEM micrograph revealed the grains and grain distribution of the samples. The Curie temperature showed a decrease with progressive substitution of Y3+. The M-H loops were traced using a vibrating sample magnetometer (VSM) giving magnetic parameters like saturation magnetization, coercivity and remanence. Ferrites being good dielectrics the temperature variation of the dielectric constant showed a slow increase initially and then rapidly until it exhibited a maximum and then decreased on a further increase of temperature. The results obtained are analyzed and discussed in the paper.
Keywords: Lithium ferrites, X-ray diffraction, Scanning electron microscopy, Curie temperature, Dielectric relaxation.
Spinel-structured lithium ferrites and substituted lithium ferrites are extensively used in electronic devices due to their excellent magnetic and electrical properties. Lithium ferrites having the general formula Li0.5Fe2.5O4 are known for their attractive properties like high Curie temperature making them thermally very stable, high saturation magnetizations, low loss, rectangular hysteresis loop to name a few. Composition plays an important role in designing the structural and electromagnetic parameters. In addition, the synthesis process contributes to the phase and microstructural developments. Various substitutions may be made on lithium ferrites by metal ions like Zn2+, Ni2+, Co2+, Mn3+, Mn4+, Ti4+ etc. and obtain what is known as substituted lithium ferrites as studied by many researchers to obtain the desired properties [1-3]. Improvements in magnetic and electrical properties focus on the various cation distributions on the tetrahedral and octahedral sublattices of the spinel. C. E. Patton et al observed that a small amount of Zn2+ substitution in lithium ferrites enters the A sites of the spinel to dilute the A-sublattice magnetization and improved the net magnetization [4]. Ti4+ substitution on lithium ferrites were studied extensively and preference for B sites were observed. Many researchers found that Ti4+ substitution improved resistivity as it stabilizes the Fe2+ ions [5, 6]. In view of improving magnetic and electrical properties ferrites for microwave applications such as circulators, isolators, phase-shifters many researchers contributed in the study of simultaneous substitution of Zn2+ and Ti4+ in lithium ferrites. Baijal et al. [7], Kumar et al. [8] observed high promising values of saturation magnetization and Curie temperature at low substitution of Zn2+ and Ti4+. The investigations on the electromagnetic properties of Li-Zn-Ti ferrites by Saxena et al. [9] and Slama et al. [10] highlighted that these materials are good candidates for microwave applications.The electrical behavior especially the dielectric constant plays an important role in determining the applicability of the ferrites at microwave frequencies. Ferrites exhibit the general characteristics shown by the electroceramics therefore the understanding of the electrical properties is necessary. Besides room temperature studies of the properties, there also arises needs for study of the properties with variation of temperature. The study of temperature variation of dielectric constant can investigate the polarization mechanisms with temperature change and safe temperature range for device applications. However, the characteristic features of ferrites depend on the synthesis method, type and amount of substitutions, sintering temperature/conditions etc. besides composition. Lithium ferrites prepared through the conventional method faced difficulties when sintering at a high temperature which led to the volatilization of lithia and oxygen resulting in the emergence of secondary phases, evolution of Fe2+ ions etc. However, with lowering the sintering temperature risks of obtaining unreacted oxides, phases of the intermediate product of the synthesis reactions, stoichiometry deviation, less densification, and poor microstructures are high. These may lead to deteriorating the electromagnetic properties [2, 11, 12]. Various other methods may be adopted for the preparation of ferrites such as hydrothermal, sol-gel, and co-precipitation methods which are less time consuming, produce ultra-fine powders and can be processed at lower temperatures with attaining pure phased particles but the reagents are very costly [13]. The ceramic method however has advantages due to its simple preparation procedure, large productivity, grain size controllability and low cost compared to the other methods. Therefore considering these factors solid state ceramic method using high energy ball milling can also be considered as a good option for the preparation of ferrite ceramics. Appropriate high energy ball milling offers homogeneous refined powders for a better sintering process [14]. Microstructural characteristics play important roles in the properties of ferrites. Therefore various oxides such as Al2O3, CaCO3, SiO2, Bi2O3, V2O5, B2O3, P2O5 etc may be used as sintering agents to lower the sintering temperature, control the microstructural development and minimize the material loss during preparation [15-18]. Bi2O3 is one of the most commonly used sintering aid in the preparation of lithium ferrites [2]. Use of V2O5 as a sintering aids and sintering lithium-based ferrites below 1000 ⁰C were reported elsewhere [16]. Reports show that incorporation of small amount of glass type oxides improved densification and microstructural uniformity. Combination of V2O5 and Na2SiO3 glass in the synthesis of lithium ferrites as sintering aids to lower sintering temperature was reported earlier [19, 20]. Doping of rear-earth elements in ferrites has gained much attention due to significant improvements in physical and chemical properties [21]. Among rear-earth elements, Y3+ has proven to be a good choice when it comes to altering the electromagnetic properties of spinel ferrites especially the electrical resistivity and hence the dielectric loss that can pave ways to prepare spinel compositions for microwave devices [21-23]. Thus, considering the high potential microwave properties shown by Zn2+ and Ti4+ substitution in small concentrations in lithium ferrites, Li0.5Zn0.1Ti0.1Fe2.3O4 has been chosen and considering the promising effects of Y3+ incorporation on electrical properties; the paper reports the structural and electromagnetic properties of Y3+ substituted Li-Zn-Ti ferrites and also on the temperature variation of dielectric constant.
Trivalent Yttrium, Y3+ substituted lithium-zinc-titanium ferrites with composition formula Li0.5Zn0.1Ti0.1YxFe2.3-xO4 where x = 0.00 to 0.1 in the step of 0.02 were synthesized by the conventional ceramic method from the AR grade powders viz Fe2O3 (98% HiMedia-India), ZnO (99.99% HiMedia-India), TiO2 (99.0% HiMedia-India), Li2CO3 (99.5% HiMedia-India), and Y2O3 (99.99% HiMedia-India) and 0.1 wt% of V2O5 as sintering additives. The powders were taken in their stoichiometric proportions and was ball milled for 8h with distilled water. The mixture was dried and then calcined at 850 oC for 2 h. The calcined powder was ball milled again for another 6 h using a high-energy ball milling with distilled water. The milled powder was dried in an oven and ground to smooth powder. The smooth powder was mixed with PVA as a binder and pressed into pellets with a thickness of ~1 mm and a diameter of 8 mm using a hydraulic press (VB CERAMIC, INDIA). The pellets were finally sintered at 1050 oC for 6 h. X-ray diffraction technique was used for structural characterization. Various structural parameters such as lattice constant, crystallite size and X-ray density were calculated using XRD data. FTIR spectroscopy was carried out in the wave number ranging from 400-1200 cm-1 for examining the molecular bonds. Scanning Electron Microscopy studied the microstructural characteristics on the fractured surface of the pellets. The characteristic M-H hysteresis loop measurement was done using a Vibrating Sample Magnetometer (VSM Lakeshore, 7410 series) for magnetic characterization. The Curie temperature of the samples were measured using the Soohoo’s Method [24]. For Electrical characterizations pellets were properly cleaned, made electrodes on the flat surfaces using silver coatings, and the dielectric constant was measured with the change of temperature in the range from room temperature (RT) to 450 oC using an Impedance analyzer (E4990A) interfaced to a temperature controlled system with a furnace (Marine India).
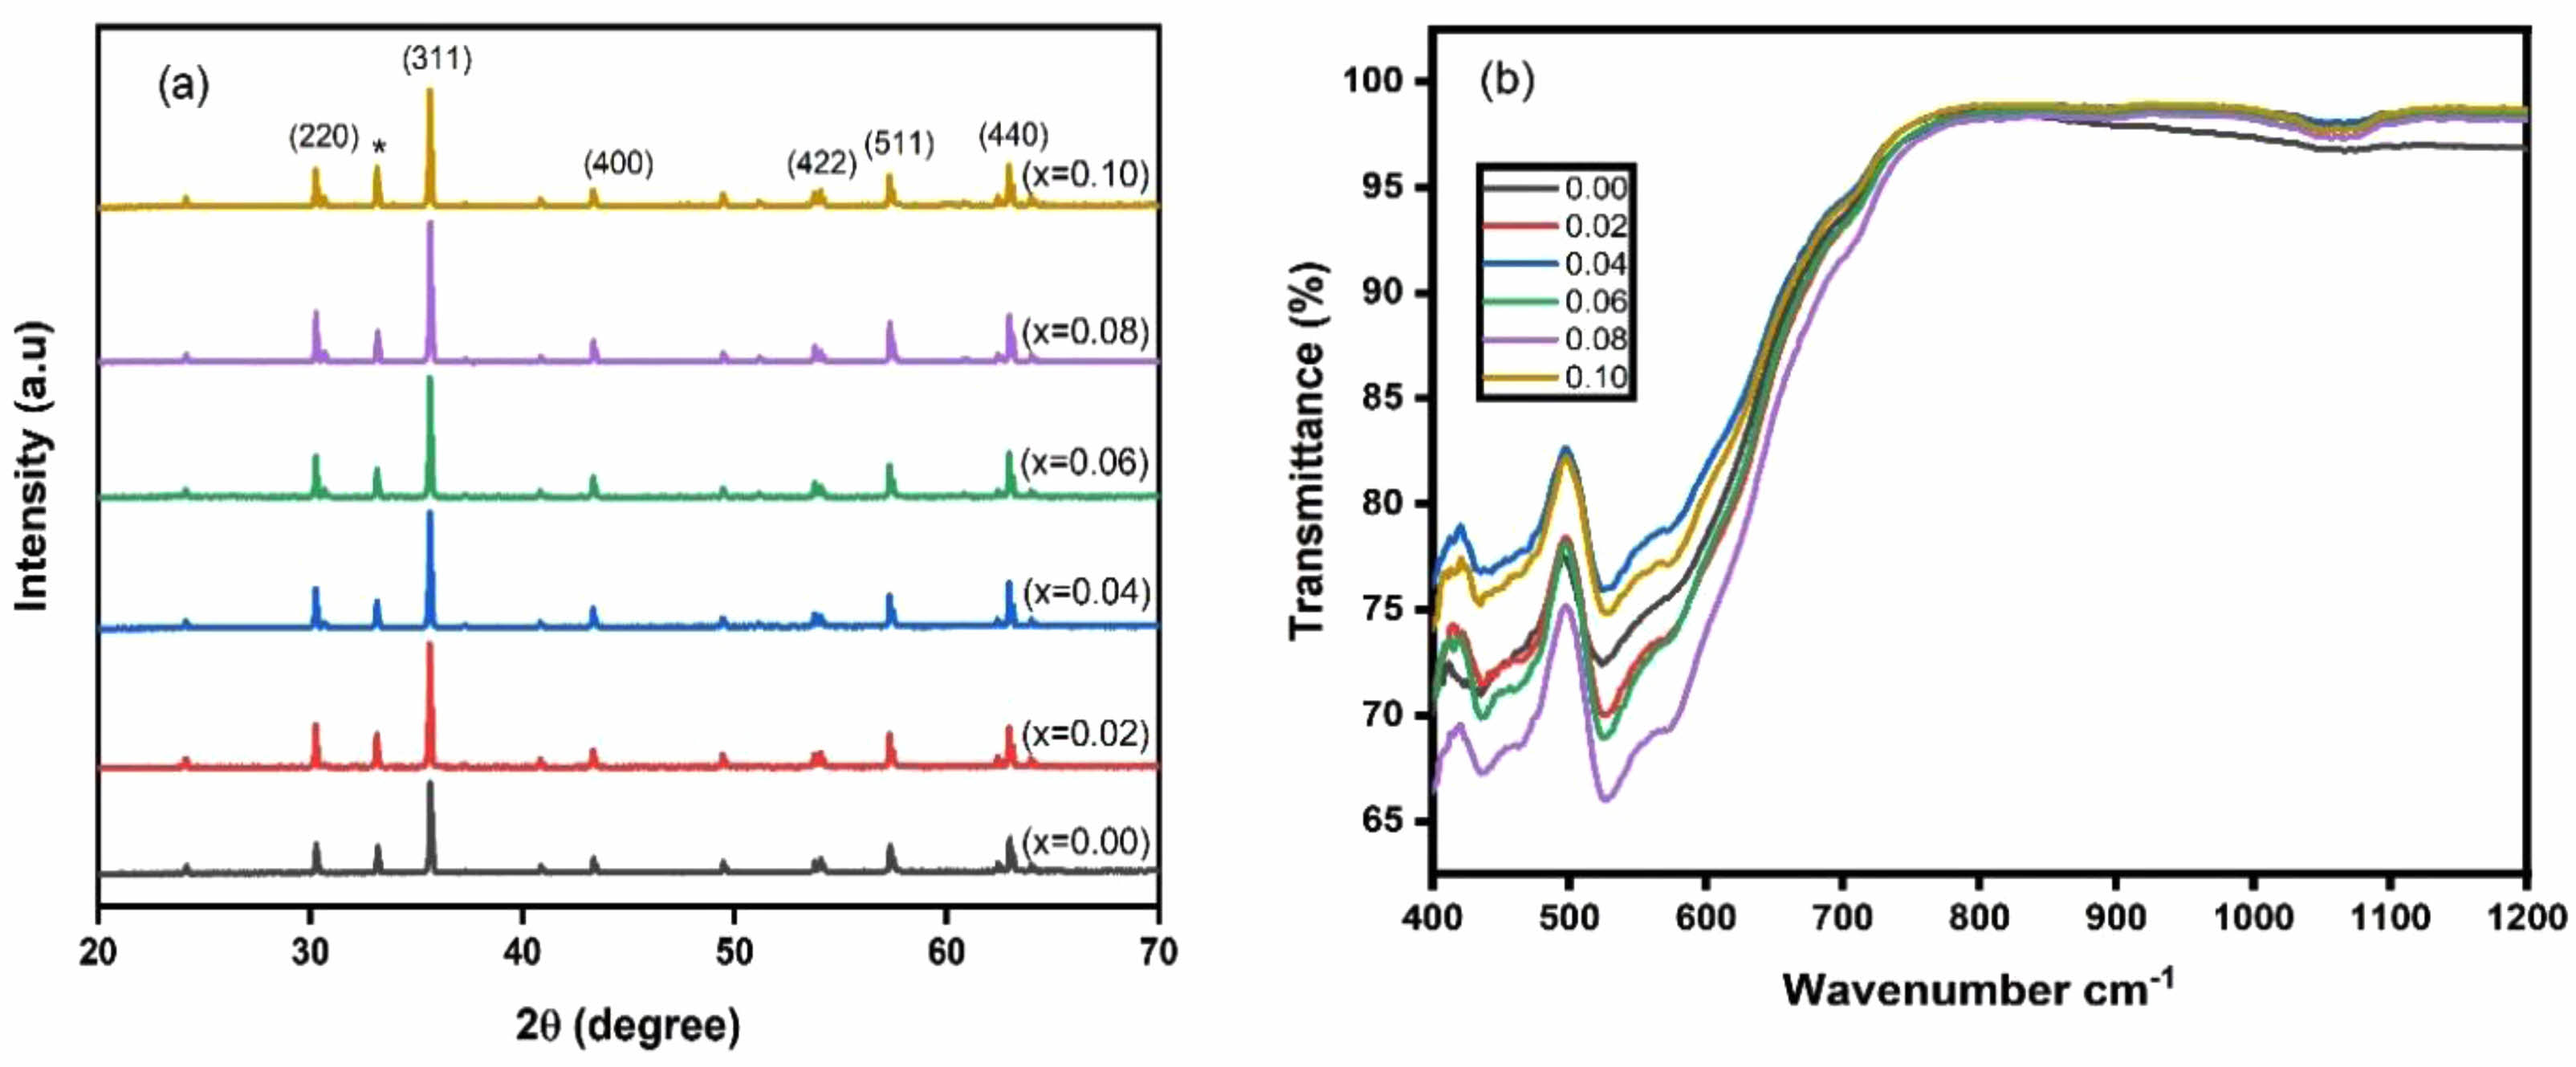
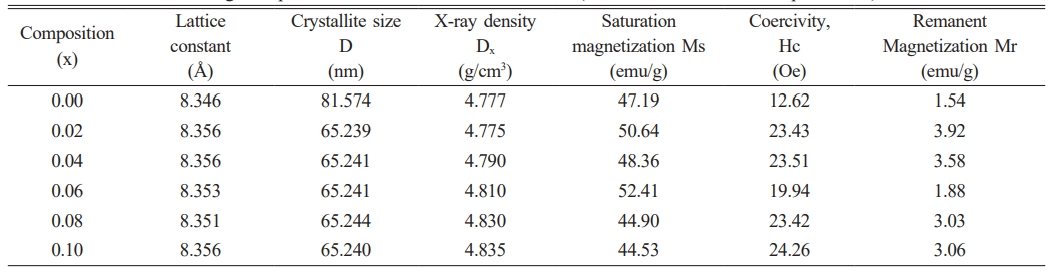
The XRD patterns for Li0.5Zn0.1Ti0.1YxFe2.3-xO4 where x = 0.00 to 0.1 in the step of 0.02 are shown in Fig. 1(a). The peaks with their corresponding miller indices have been indexed in the patterns as shown in the figure that confirmed the cubic spinel structure with the Fd-3m space group. Structural parameters such as lattice constant, crystallite size and X-ray density were obtained using the XRD data. The lattice constant ‘a’ and the X-ray density ‘dx’ were found to increase with Y3+ substitution shown in Table 1. The increase in lattice constant is understood due to the larger sized Y3+ ions (0.95 Å) replacing the smaller size Fe3+ ions (0.67 Å). However, the values lie within the expected range for lithium-based ferrite systems. Crystallite size calculated from Scherrer formula ranged from 81-65 nm that confirms the crystalline characteristics of the material. Decrease in crystallite size in Y3+ incorporated systems may be due to substitution by large sized rare earth ions entering the B sites of ferrite spinel in place of the smaller Fe3+ ions as reported by others. The induced lattice strain and lattice disorder probably hinders crystallization and thus crystallite size is reduced [22]. The increase in X-ray density may be due to the higher atomic weight of Y (88.90amu) substituted in place of lighter Fe (55.845amu). The results were reported in detail elsewhere [25]. Fig. 1(b)also depicts the FTIR spectra from wave number 400-1200 cm-1 for all the samples. The analysis of FTIR spectroscopy gives information about the ion’s position in the crystal through the crystal’s vibration modes. The examination of molecular bonds shows the existence of two major bands; one in the range 541-509 cm-1 (υ1) corresponding to the intrinsic vibrations of tetrahedral metal-oxygen bonds and the other in the range 468-420 cm-1 (υ2) which correspond to the intrinsic vibration of octahedral metal-oxygen bonds. These characteristic peaks additionally confirmed molecular bonds supporting the spinel structured nature of ferrites
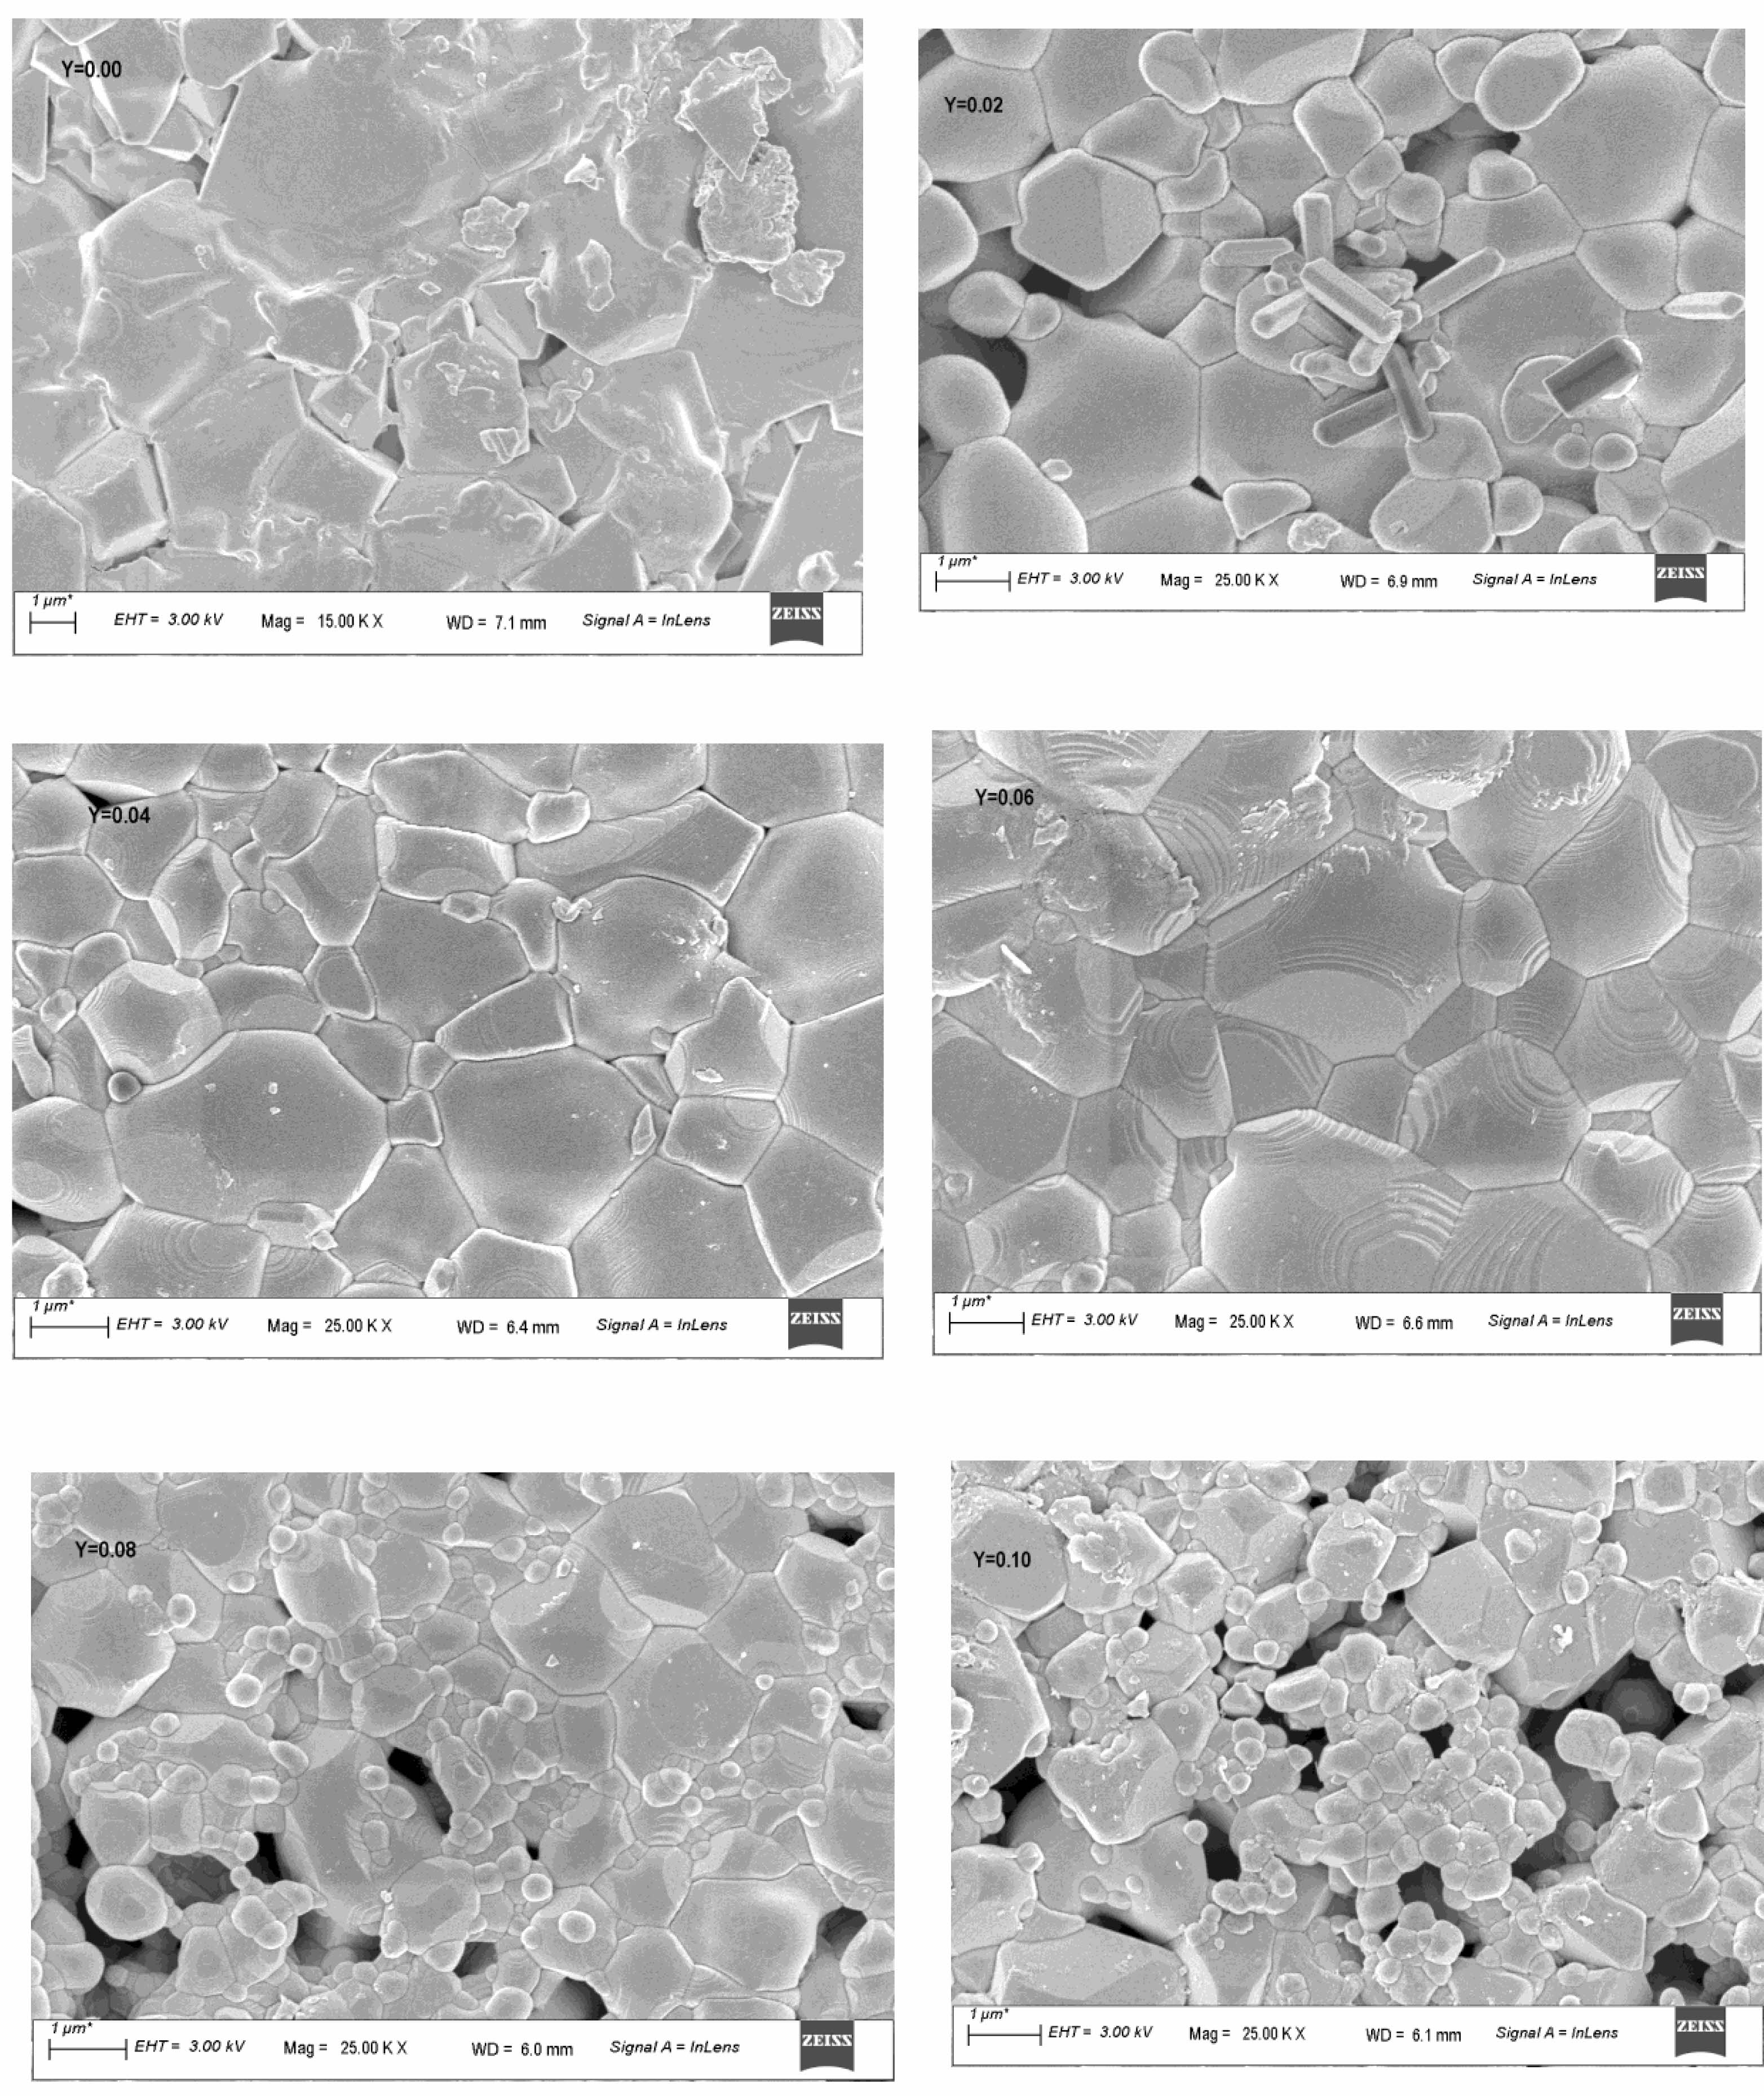
The morphology or microstructure of samples are shown in Fig. 2.The micrographs show clear microstructural features of ceramics consisting of grains, grain boundaries, pores and their distributions. It can be observed that with the increase of Y3+ substitution, the development of grains improved and more well defined; grain size increased and became more and more compact until at x = 0.06 where the average grain size is biggest and seen without any visible pores.
Beyond this, the average grain size and grain uniformity decreased, intergranular pores of varying shapes and sizes reappeared increasing in numbers as x goes from 0.08 to 0.10. From x = 0.08 the smaller grains that appeared agglomerating among the bigger ones increased in numbers. Thus the average grain size calculated using ImageJ software is found to be 1.07 μm, 1.18 μm, 1.26 μm 1.52 μm, 1.02 μm 0.95 μm for x = 0.00, 0.02, 0.04, 0.06, 0.08, and 0.10 respectively, showed an initial increase and then decreased on further substitution for x ≥ 0.08. The latter decreased being due to large number of smaller grains developed possibly due to grain growth hindrances as Y3+ content increases. Reports have shown that at lower content, Y3+ diffuses into the spinel with ease and supports grain growth. At higher content, the bigger ionic sized Y3+ ions substitution causes lattice strain leading to increased structural disorder that hinders the grain crystallization and hence restrain grain growth [26, 27]. At x = 0.08 and 0.10; the pores increased; the larger grain surrounded by a small grained structure called a “duplex” agglomerates is seen and hence the uniformity in microstructural development decreased. Similar reports on distorting the lattices, thus generating internal stress, hindering the grain boundary migration and the transfer of atoms, thus reducing grain size with higher Y3+ concentration is also found. The reports suggest that at higher concentration the solubility of Y3+ into spinel weakens the interatomic bondings, decreased the microstructural uniformity and therefore may weaken the mechanical strength of the ceramics [28].
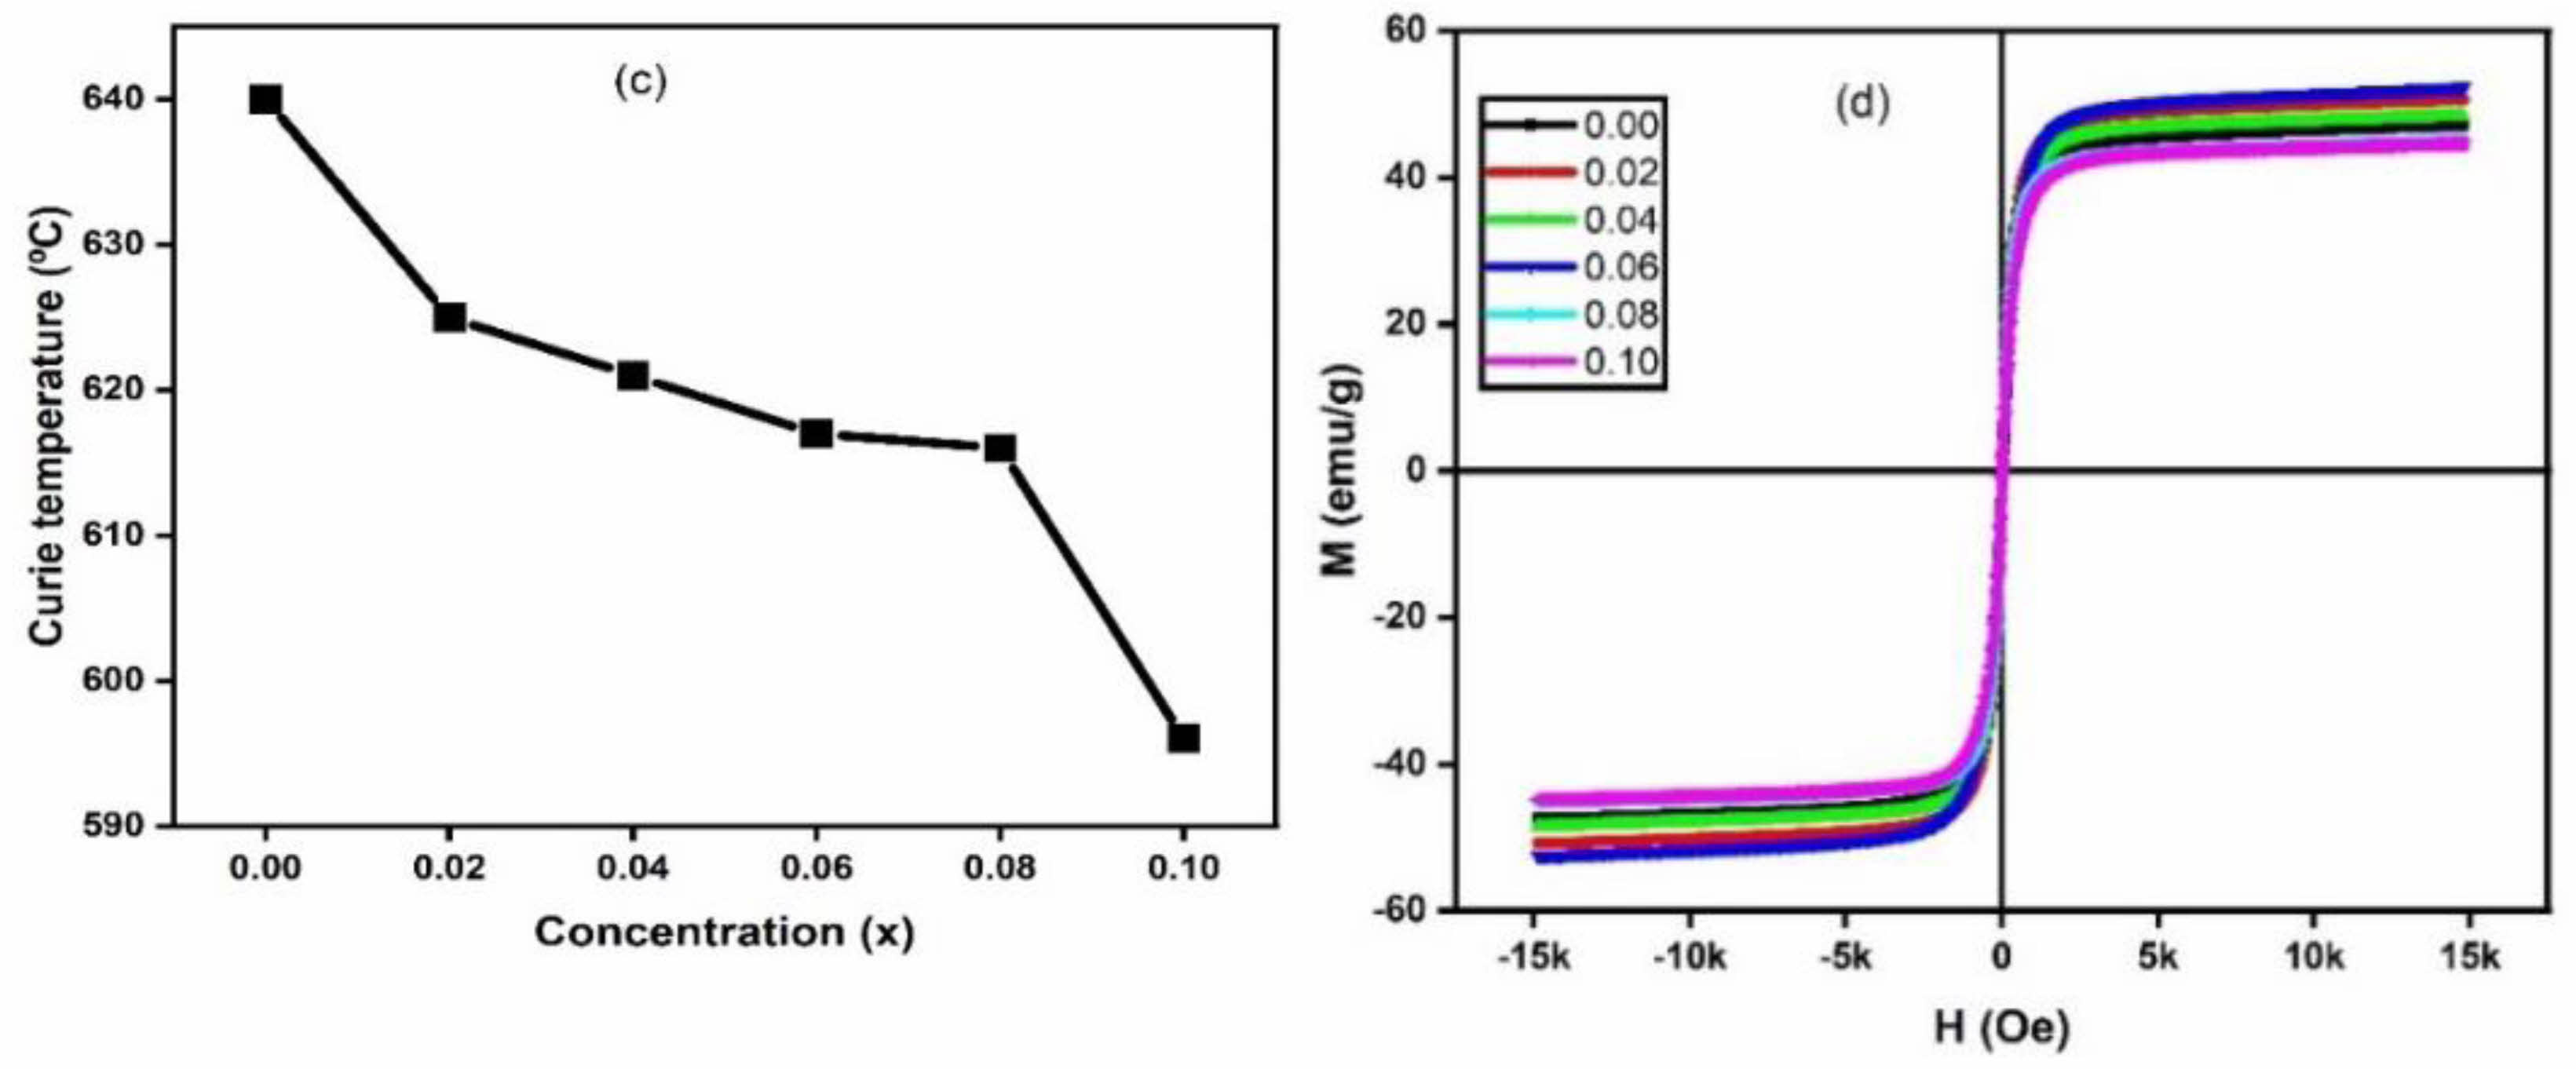
The variation of Curie temperature and the M-H loops for the different Y3+ concentration is depicted in Fig. 3. (c) and (d). It is observed that the Curie temperature decreased with increase of Y3+ content. Curie temperature of ferrites is dependent on the active linkages between Fe3+ ions at the tetrahedral and the octahedral sites via the oxygen ions [29]. The Y3+ ions substituting the Fe3+ ions decreasing the number of active linkages is understandable. Magnetic properties of ferrites depend on several factors such as chemical composition, grain growth, method of synthesis, and A-B sites exchange interaction [30]. Zn2+ in small amount have a strong preference for A site in Li0.5Fe2.5O4 and Ti4+ have a tendency for the B sites. Thus, when Zn2+ and Ti4+ ions are substituted simultaneously in small amounts into lithium ferrites, it is assumed that all Zn2+ ions occupy the tetrahedral (A) sites while Ti4+ ions occupy the octahedral (B) sites. The cation distribution of ferrite system prepared may be qualitatively represented as (Zn0.1Fe0.9)A[Li0.5Ti0.1Fe1.4]BO4 [29]. When Y3+ with B site preferences [31] is substituted in the above lithium-zinc-titanium ferrite spinel, the cation distribution may be assumed qualitatively as [Zn0.1Fe0.9]A[Li0.5Ti0.1YxFe1.4-x]BO4, where all the Y3+ ions enter the octahedral (B) sites and replace some of the Fe3+ ions. The magnetic properties besides the dependence on the chemical composition and microstructural factors [32] may be well understood from the cation distribution of the system. The traced M-H loop is shown in Fig. 3(d). The parameters obtained from the loops such as saturation magnetization (Ms), coercivity (Hc), and retentivity (Mr) are depicted in Table 1.
The table showed that with the increase of Y3+ ions substitution, saturation magnetization is found to improve from x = 0.00 to 0.06 and decreased on further increasing the Y3+ concentration i.e. at x = 0.08 and x = 0.10. The highest saturation magnetization was observed Ms = 52.6 emu/g at x = 0.06. The initial increase in saturation magnetization (Ms) may be due to the increase in grain size. Increased grain size, fewer pores and more compactness of the sample enhance the magnetic properties of the sample. Saturation magnetization suffers a systematic reduction at the higher concentration of Y3+ ions at x = 0.08 and 0.10. This may be possible due to increased pores and decrease in crystallite sizes [30]. Chakrabarty et al. have explained that the decrease depends on two factors [33]. The first reason is due to magnetic exchange between lattice sites which gives the resultant magnetic moment. The second reason is the non-involvement of Y3+ ions in exchange for interaction with the closest ions. However, the microstructural characteristics seemed to contribute significantly to the saturation magnetization in this system at lower concentration. The coercivity (Hc) which is the magnitude of the field that must be applied in the negative direction to bring the magnetization back to zero is increased with Y3+ ion substitution. The pores in the samples seemed to influence the coercivity such that samples with distinct pores seemed to show higher coercivity. Then besides the dependence on the grain size, prominent pores in the microstructure act as pinning centres for reverse domain motion, especially for the higher Y3+ concentration.
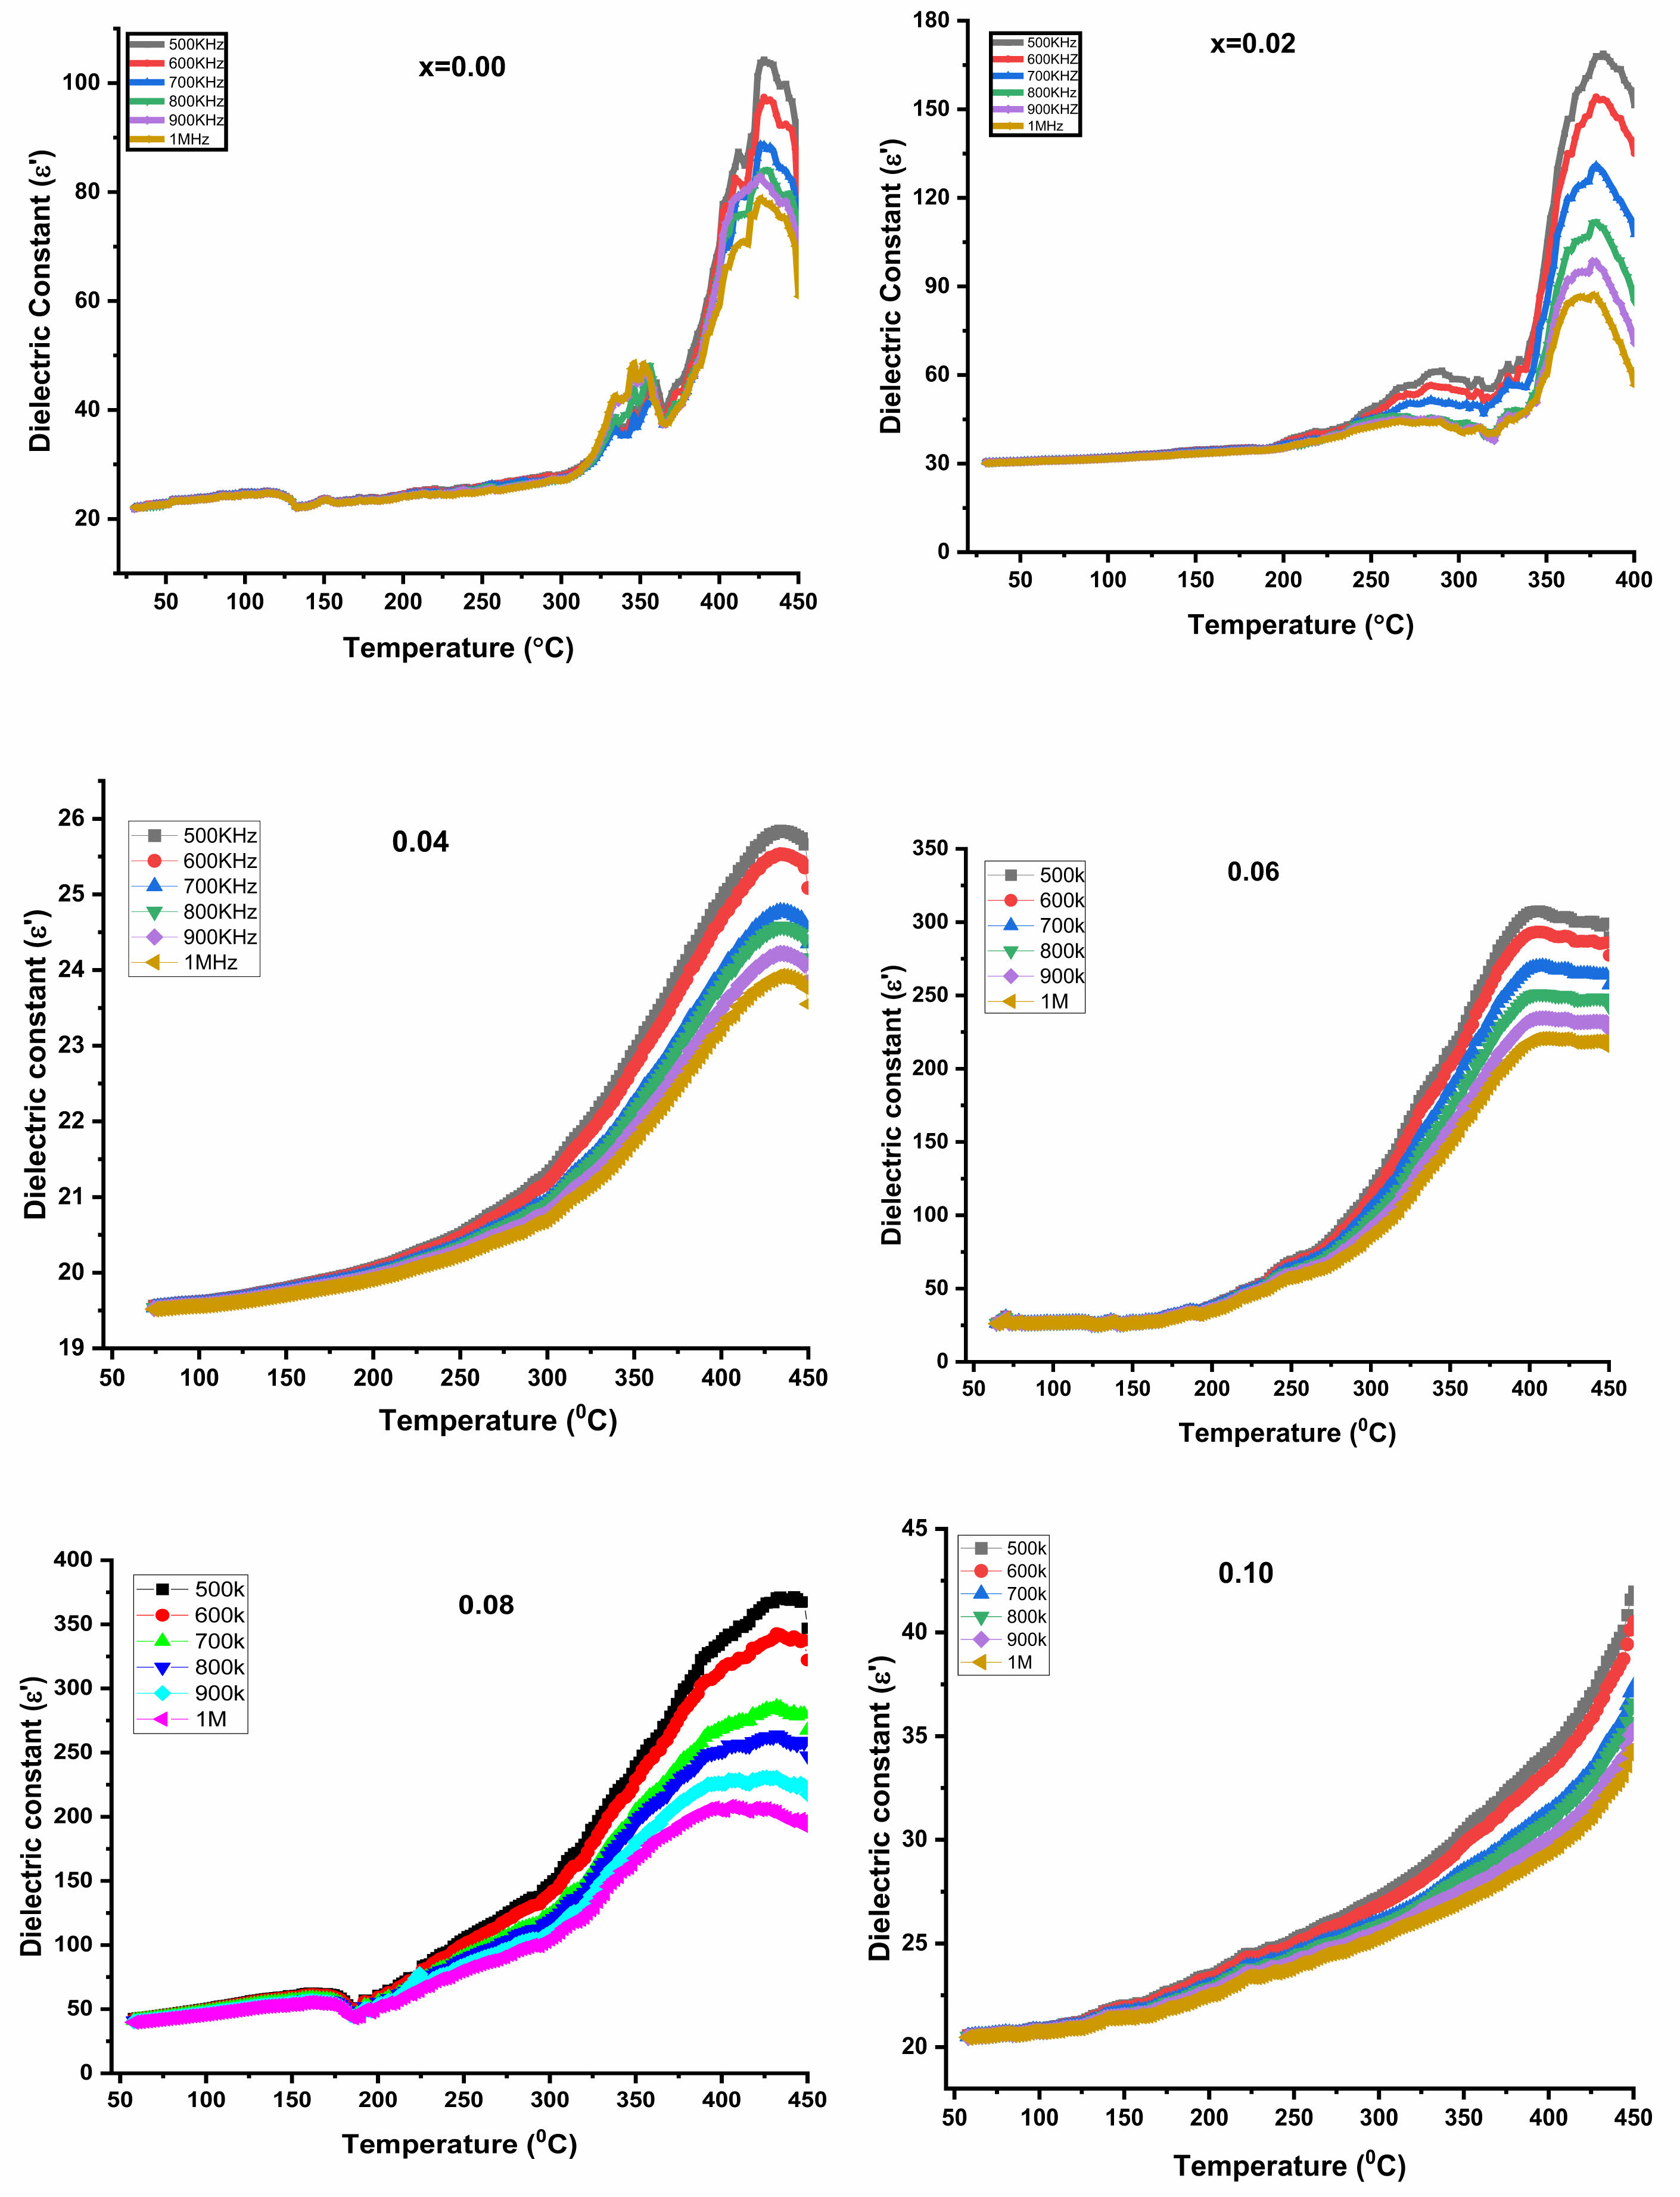
The dielectric constant dependence on temperature from room temperature (RT) to 450 oC has been studied at various frequencies and the variation is shown in Fig. 4. It is observed that the dielectric constant increased with the rise of temperature, the increase is less significant at lower temperatures, but the increase becomes rapid at higher temperatures. Similar studies were reported by others [34, 35]. The behaviour is the same for all the frequencies. An interesting behaviour is that for all the frequencies measured the dielectric constant on rapid increase showed a maximum at a certain temperature and then decreased beyond. The maximum dielectric constant however reduced in value as frequency increased. The observed behaviour is consistent with Debye-type dispersion [36]. At low temperatures, high relaxation time suppresses the dielectric constant. But as the temperature rises, thermal energy decreases the relaxation time and the dielectric constant gradually increases where at a certain temperature the maximum is attained. The temperature at which maximum occurs generally shifts to a higher temperature as frequency is increased and the height of the peak is lowered as frequency is increased.The temperature at which maximum occurs is ~(350-450) oC which is well below the Curie temperature of the system. The behaviour has been attributed to ordering the ferrite phase due to available thermal energy. It is also observed that the maximum peak seems to broaden as the concentration of Y3+ is increased. Further, the dielectric constant in ferrites is dependent on different types of polarization mainly interfacial, dipolar, ionic and electric polarizations. The first two are temperature-dependent and play significant roles at low frequencies. Interfacial polarization increases with the increase in temperature and dipolar shows the opposite dependence. Therefore the present increase of dielectric constant is indicative of prominent contribution from interfacial polarizations [36].
|
Fig. 1 (a) XRD patterns and (b) FTIR spectra of Li0.5Zn0.1Ti0.1YxFe2.3-xO4 (x = 0.00 to 0.10 in the steps of 0.02). |
|
Fig. 2 FESEM images of Li0.5Zn0.1Ti0.1YxFe2.3-xO4 (x = 0.00 to 0.10 in the steps of 0.02). |
|
Fig. 3 (c) Curie temperature and (d) M-H loops of Li0.5Zn0.1Ti0.1YxFe2.3-xO4 (x = 0.00 to 0.10 in the steps of 0.02). |
|
Fig. 4 The dielectric constant dependence on temperature of Li0.5Zn0.1Ti0.1YxFe2.3-xO4 (x = 0.00 to 0.10 in the steps of 0.02). |
|
Table 1 Structural and magnetic parameters of Li0.5Zn0.1Ti0.1YxFe2.3-xO4 (x = 0.00 to 0.10 in the steps of 0.02). |
Trivalent yttrium substituted lithium-zinc-titanium ferrite with compositional formula Li0.5Zn0.1Ti0.1YxFe2.3-xO4 was successfully synthesized by the conventional ceramic method. From the XRD investigation, a pure phase cubic spinel structure was formed. Substitution of Y3+ improved the development of grains until x = 0.06. with a maximum average maximum grain size of 1.52 µm. The sample with x = 0.06 shows the highest saturation magnetization, Ms = 52.6 emu/g at room temperature. The temperature-dependent dielectric constant showed a maximum around temperature 350 oC to 450 oC.
The authors are grateful to CSIR's funding support in the form of CSIR-JRF (Grant Number. 09/1214 (13709)/2022-EMR-I) and IIT Guwahati for VSM and FESEM measurement.
- 1. M.S. Seehra, in Magnetic Spinels: Synthesis, Properties and Applications. (INTECHOPEN, 2017) p. 31-50.
-

- 2. P. Kishan, in Microwave Materials. (Springer, Berlin, Heidelberg 1994), p. 141-163.
-
- 3. W.H. Von Aulock, in “Handbook of Microwave ferrite Materials”. (Academic Press, 1965)
-
- 4. C.E. Patton, C.A. Edmondson, and Y.H. Liu. J. Appl. Phys. 53[3] (1982) 2431-2433.
-
- 5. M.B. Reddy and P.V. Reddy, J. of Phys. D: Appl. Phys. 24[6] (1991) 975-978.
-
- 6. R. Manjula, V.R.K. Murthy, and J. Sobhanadri. J. Appl. Phys. 59[8] (1986) 2929-2932.
-
- 7. J.S. Baijal, P. Sumitra, D. Kothari, C. Prakash, and P. Kishan, Hyperfine Interactions 35 (1987) 879-882.
-
- 8. N.K. Saxena, N. Kumar, and P.K.S. Pourush, Nature and Science (2014) p. 9-14.
- 9. N. Kumar, P. Kishan, and Z.H. Zaidi, J. Magn. and Magn. Mat. 184[3] (1998) 355-357.
-
- 10. J. Slama, A. Gruskova, M. Soka, M. Usakova, and VÍ Jancarik, IEEE Trans. Magn. 46[2] (2010) 455-458.
-
- 11. M. Maisnam and S. Phanjoubam. Mod. Phys. Lett. B 27[18] (2013) 1350132-9.
-
- 12. D.H. Ridgley, H. Lessoff, and J.D. Childress. J. Am. Ceram. Soc. 53[6] (1970) 304-311.
-
- 13. A.T. Pathan and A.M. Shaikh, Int. J. Comp. Appl. 45[21] (2012) 0975-8887.
- 14. M. Maisnam, N. Nilima, M. Victory, and S. Phanjoubam, Bull. Mater. Sci. 39 (2016) 249-254.
-
- 15. S. Tsipas, P. Goodwin, H.B.Mc Shane, and R.D. Rawlings. Powder Metall. 46[1] (2003) 73-77.
-
- 16. M. Maisnam, J. Ceram. Process. Res. 18 (2017) 361-365.
-
- 17. J.H. Jean and C.H. Lee, Japanese J. Appl. Phys. 40 (2001) 2232-2235.
-
- 18. M. Maisnam, in Nanostructure Materials and their Applications. (Singapore: Springer Singapore, 2020) p. 265-283.
-
- 19. J. Touthang and M. Mamata. Integr. Ferroelectr. 194[1] (2018) 1-7.
- 20. J. Touthang and M. Maisnam, Integr. Ferroelectr. 186[1] (2018) 17-24.
-
- 21. P.P. Mahopatra, H.K. Singh, M.S.R.N. Kiran, and P. Dobbidi, Ceram. Intl. 48[19] (2022) 29217-29228.
-
- 22. S.E. Jacobo and P.G. Bercoff. Ceram. Intl. 42[6] (2016) 7664-7668.
-
- 23. I.H. Dun, S.E. Jacobo, and P.G. Bercoff, J. Alloys Compd. 691 (2017) 130-137.
-
- 24. R.F. Soohoo, in “Theory and Applications of Ferrites”. (Prentice Hall, 1960).
- 25. A. Hriishu and M. Maisnam, Materials Today: Proceedings 92 (2023) 1471-1476.
-
- 26. M. Das, M.N.I. Khan, M.A. Matin, and M.M. Uddin, J. Supercond. Nov. Magn. 32 (2019) 3569-3577.
-
- 27. M.A. Yousuf, M.M. Baig, N.F. Al-Khalli, M.A. Khan, M. F.A. Aboud, I. Shakir, and M.F. Warsi, Ceram. Intl. 45[8] (2019) 10936-10942.
-
- 28. M.A. Ali, M.N.I. Khan, F.U.Z. Chowdhury, M.M. Hossain, A.A. Hossain, R. Rashid, and M.M. Uddin, J. Mater. Sci.: Mater. Electron. 30[14] (2019) 13258-13270.
-
- 29. M. Maisnam, S. Phanjoubam, H.N.K. Sarma, C. Prakash, L.R. Devi, and O.P. Thakur, Mater. Lett. 58 (2004) 2412-2414.
-
- 30. S.A. Mazen and N.I. Abu-Elsaad, Appl. NanoSc. 5 (2015) 105-114.
-
- 31. M.A. Yousuf, S. Jabeen, M.N Shahi, M.A. Khan, I. Shakir, and M.F. Warsi, Results in Phys. 16 (2020) 102973-102978.
-
- 32. M.M. Haque, K.H. Maria, S. Choudhury, M.A. Bhuiyan, and M.A. Hakim, J. Ceram. Process. Res. 14 (2013) 82-86.
-
- 33. S. Chakrabarty, A. Dutta, and M. Pal, J. Magn. Magn. Mater. 461 (2018) 69-75.
-
- 34. L. Cui, R. Niu, D. Wang, and W. Wang, J. Ceram. Process. Res. 24[2] (2023) 348-352.
-
- 35. P.P. Mohapatra, S. Pittala, and P. Dobbidi, J. Mater. Res. Technol. 9[3] (2020) 2992-3004.
-
- 36. M. Maisnam, S. Phanjoubam, H.N.K. Sarma, O.P. Thakur, L.R. Devi, and C. Prakash, Indian J. Eng. Mater. Sci. 15[2] (2008) 199-202.
 This Article
-
2025; 26(1): 30-36
Published on Feb 28, 2025
- 10.36410/jcpr.2025.26.1.30
- Received on Aug 12, 2024
- Revised on Oct 15, 2024
- Accepted on Dec 17, 2024
Services
- Abstract
introduction
experimental
results and discussion
conclusions
- Acknowledgements
- References
- Full Text PDF
Shared
Correspondence to
- Mamata Maisnam
-
Department of Physics, National Institute of Technology Manipur, Langol, Imphal-795004, India
Tel : 0385-2445812 Fax: 0385-2413031 - E-mail: mmaisnam.nitm@gmail.com
Clean-Energy Research Institute(CRI), Hanyang University, 222, Wangsimni-ro, Seongdong-gu, Seoul, 04763, Korea
E-mail: jcpr@hanyang.ac.kr