- Study of the effect of the electric current density on the densification kinetics of the ultra-fine pure WC powder during spark plasma sintering
Zhenyao Fana, Yitao Zhangb, Siyao Xiea,* and Yafei Pana,*
aSchool of Materials Science and Engineering, Hefei University of Technology, Hefei, Anhui 230009, PR China
bKunshan Changying Hard Material Technology Co., LTD, Kunshan, JiangSu 215300, PR ChinaThis article is an open access article distributed under the terms of the Creative Commons Attribution Non-Commercial License (http://creativecommons.org/licenses/by-nc/4.0) which permits unrestricted non-commercial use, distribution, and reproduction in any medium, provided the original work is properly cited.
Densification kinetics of the ultra-fine pure WC powder in graphite dies with different internal diameters is studied using the steady-creep model. The stress exponent n in the early and later soaking periods at temperatures ranging from 1400 to 1500 ℃ is determined by linear fitting. The densification mechanism is revealed to be GB diffusion at n=2 and dislocation climb-controlled creep at n=4.5. The current density increases with the decrease of internal diameter, which leads to the stronger electromigration effect and is responsible for the reduction of Q. The lowest densification activation energy Q under GB diffusion and dislocation climb-controlled creep is obtained to be 171.9 and 514.7 kJ/mol in the graphite die with an internal diameter of 10 mm. However, the contribution of external load on densification has an inverse sequence compared to that of the current density with the increase of internal diameter. As a result, the final relative density of samples sintered in the graphite die with an internal diameter of 25 mm is higher than that in the graphite die with an internal diameter of 20 mm at all the studied sintering temperatures regardless of the reduced Q.
Keywords: Spark plasma sintering, Tungsten carbide, Densification kinetics.
Tungsten carbides (WC) is a well-known structural ceramic material that features high hardness, satisfying wear resistance, and good corrosion resistance [1, 2]. Such advantages make successful application of WC in cutting tools, surface coatings, and stamping molds [3]. In general, the addition of a certain amount of Co contents into the WC matrix is required in the preparation of the molds to ensure toughness during stamping metal parts, which is known as the cemented carbide [4]. In recent, WC molds have become a promising alternative in production of the precision optical lenses compared to their conventional counterparts such as mental molds [5]. The precision optical lens requires high manufacturing accuracy which is positively related to the surface smoothness of the molds [6]. However, Co becomes a harmful composition because it reduces the surface smoothness of the WC molds. Besides, the oxidation of Co at elevated temperatures also damages the mechanical strength [7]. Therefore, cobalt-free bonding WC is the most suitable raw material for preparing precision optical lens molds.
However, Co is the most important bonding content during traditional liquid-phase sintering of the WC matrix bulk materials. The removement of Co transforms liquid-phase sintering into solid-phase sintering [8]. In this case, the dominant path for consolidation of the WC particles becomes atomic diffusion and diffusion-induced creep at elevated temperatures [9]. Nevertheless, the self-diffusion coefficient of the WC is low, which disappoints the diffusion-controlled densification. As a result, high density is difficult to realize in the sintering of the pure WC powder in conventional sintering process [10]. The effective method to accelerate the densification of the pure WC powder is to increase the driving forces. Usually, driving forces work for atomic diffusion during sintering including surface tension and external load [11]. Considering that surface tension is inversely proportional to particle size, a decrease in the particle size and an increase in the external load could benefit the densification of the pure WC. Besides, the electromigration effect is also reported to significantly boost densification in conductive materials during spark plasma sintering (SPS), which could be also introduced in the sintering of the pure WC powder [12].
Therefore, SPS of the nano-sized WC powder is one of the most probable ways to achieve the goal of high density or even nearly full density, which makes SPS the most applicable method in preparing precision optical lens molds. Studying the densification kinetics is the key to understanding powder consolidation and evaluating how the extra driving forces affect the atomic diffusion of the WC during SPS, which further gives guidance in optimizing SPS parameters. To quantificationally study the densification kinetics of the pure WC powder, a steady-creep model is utilized in this paper to calculate the stress-exponent value and densification activation energy. Furthermore, different electric current densities are adopted in this study and their contributions to atomic diffusion are discussed.
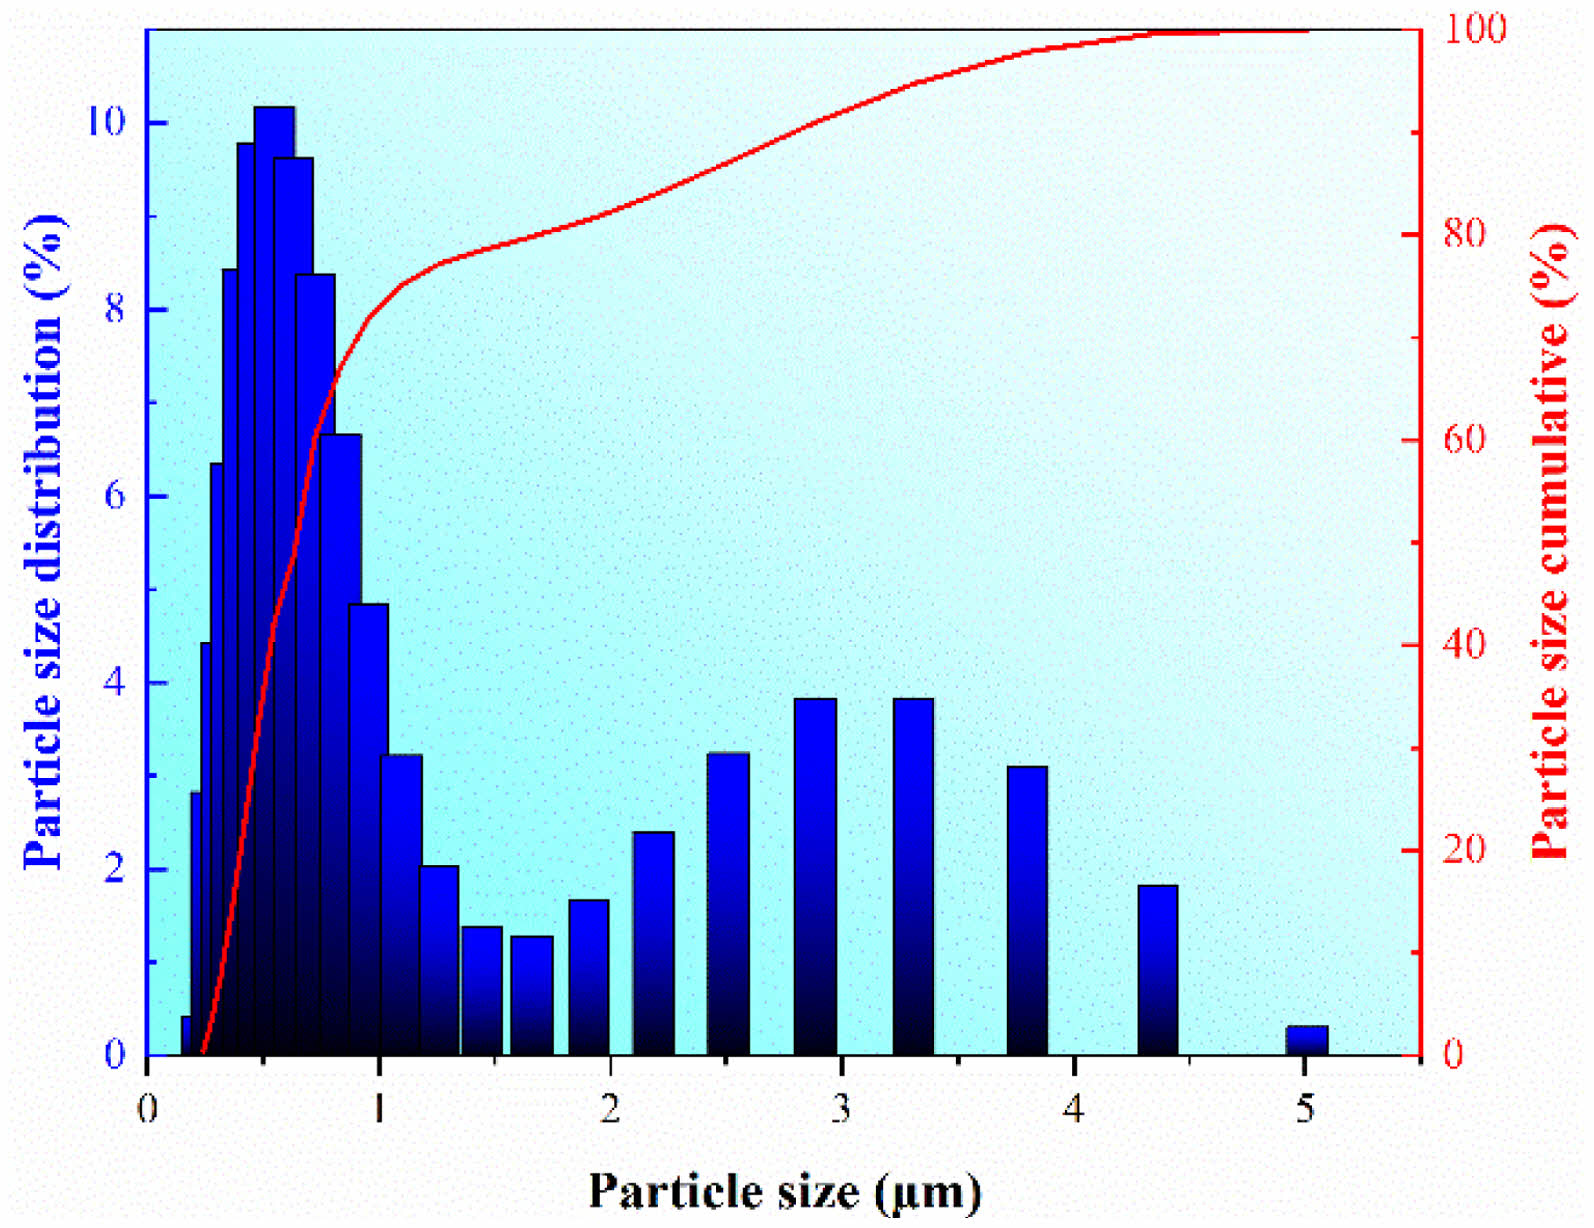
The WC powder used in this study was provided by Kunshan Changying Hard Material Technology Co., LTD. The particle size was measured by laser particle analyzer (Mastersizer 2000, Malvern Panalytical., LTD.) and the corresponding distribution is shown in Fig. 1. The median particle size of the raw powder was counted to be 0.612 μm, which proves the particle size is ultra-fine. The SPS process was carried out in an LABOX-350 (Sinter Land LTD., Japan) furnace. The graphite dies with different internal diameters of 10, 20, 25, and 30 mm were used in this study. To ensure similar initial and final heights of the raw powder and samples before and after SPS, different weight of raw powder was placed in graphite dies with different internal diameters. In detail, the powder weight is 3.5 g for the 10 mm internal diameter die, 14 g for the 20 mm internal diameter die, 21.9 g for the 25 mm internal diameter die, and 31.5 g for the 30 mm internal diameter die. Commercial graphitic sheets were used to isolate the powder from the graphite die. The raw powder was sintered at temperatures of 1400, 1450, and 1500 ℃, an axial load of 30 MPa, a heating rate of 100 ℃/min, an on-off ratio of 1:0 ms, a chamber pressure of 5×10⁻² mbar, and a dwell time of 20 min. High-accuracy data including temperature T, time t, and piston displacement were recorded by a controller in the furnace and subsequently output to its connected computer (every 0.01 mm of piston displacement and every 0.5 s in time). Considering the thermal expansion of the graphite dies at elevated temperatures, a group of sintering experiments with the same parameters without raw powder was conducted to correct the thermal expansion. After sintering, samples are ground and polished according to standard metallographical procedure. The final density ρf of the sintered bulk WC was measured as per ASTM B967 based on the Archimedes principle and each sample was measured three times. The XRD analysis (SmartLab, Rigaku Corporation, Japan) was carried out to determine the phase compositions of the raw powder. The SEM pictures (Zeiss SIGM, Zeiss LTD., Germany) were taken and the ImagePro software was employed to count the grain size distribution of the bulk samples after sintering. To ensure the counting results have statistical representativeness, more than 100 grains were measured and counted for each sample.
|
Fig. 1 Particle size distribution histogram and cumulative curve of the WC powder. |
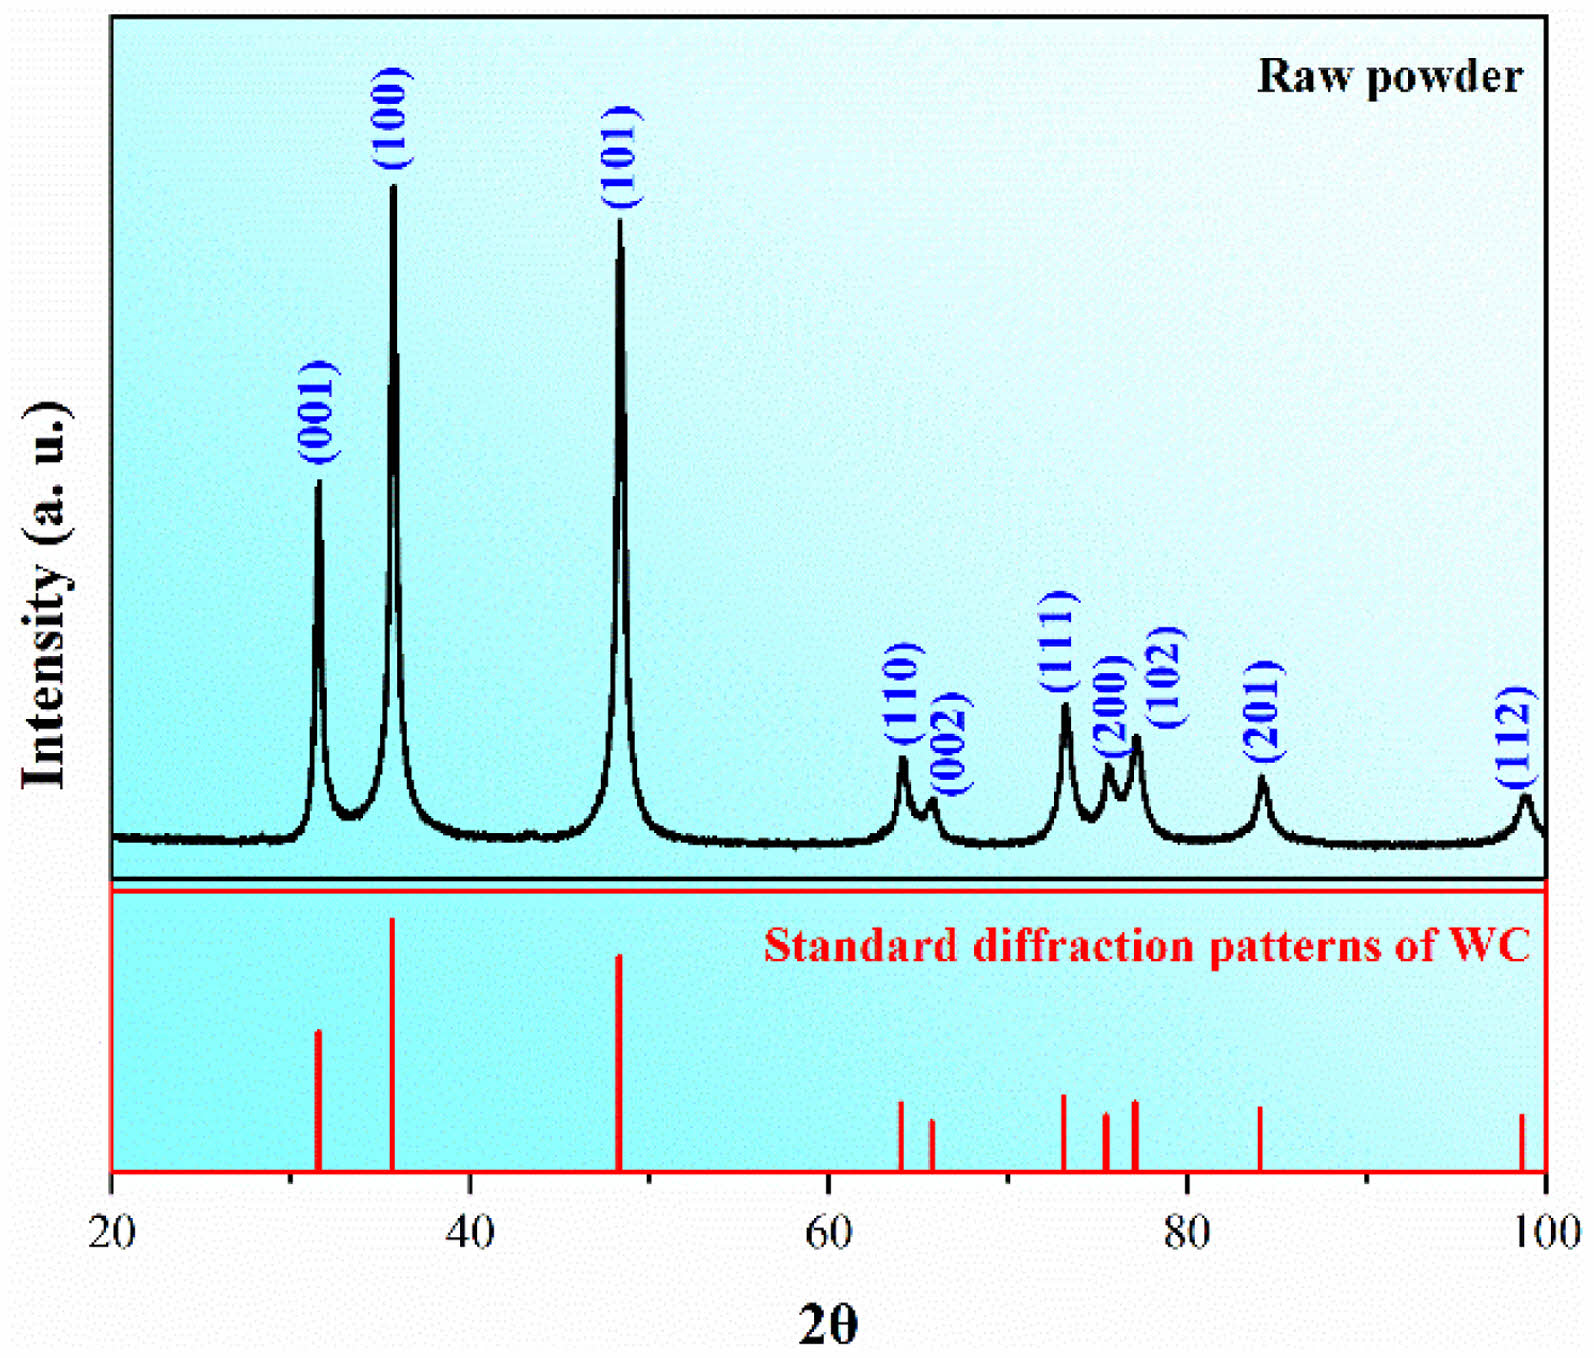
Fig. 2 shows the XRD patterns of the raw powder and the standard diffraction patterns of the pure WC. It can be observed that all the patterns detected belong to the WC, which proves the purity of the raw powder adopted in this study. According to the steady-creep model, the shrinkage rate of the WC raw powder can be given as [13]:

where ε̇ is the powder shrinkage rate, t is the time, ρi is the instantaneous relative density, B is a constant depending on the sintered material, D is the diffusion coefficient, b is the Burgers vector, k is the Boltzmann's constant, T is the absolute temperature, G is the grain size, μeff is the instantaneous effective shear modulus, σeff is the instantaneous effective stress applied on the powder bed, p is the grain size exponent, and n is the stress exponent. The instantaneous relative density ρi is given as [14]:

where Lf is the final height of the sintered sample, Li is the instantaneous height of the powder bed, and ρf is the final relative density. μeff and σeff in Eq. (1) can be calculated as follows [15]:

where Eth is the theoretical Young’s modulus of the dense materials, νeff is the effective Poisson's ratio, σmac is the macroscopic applied load, and ρ0 is the relative density of the powder bed at the beginning of sintering, which is also calculated according to Eq. (2). Besides, D follows the Arrhenius relation and thus, Eq. (1) can be expressed as:

where D0 is the temperature-independent pre-exponential coefficient, Q is the activation energy, and R is the gas constant. Take the logarithm and Eq. (5) can be further transformed to:

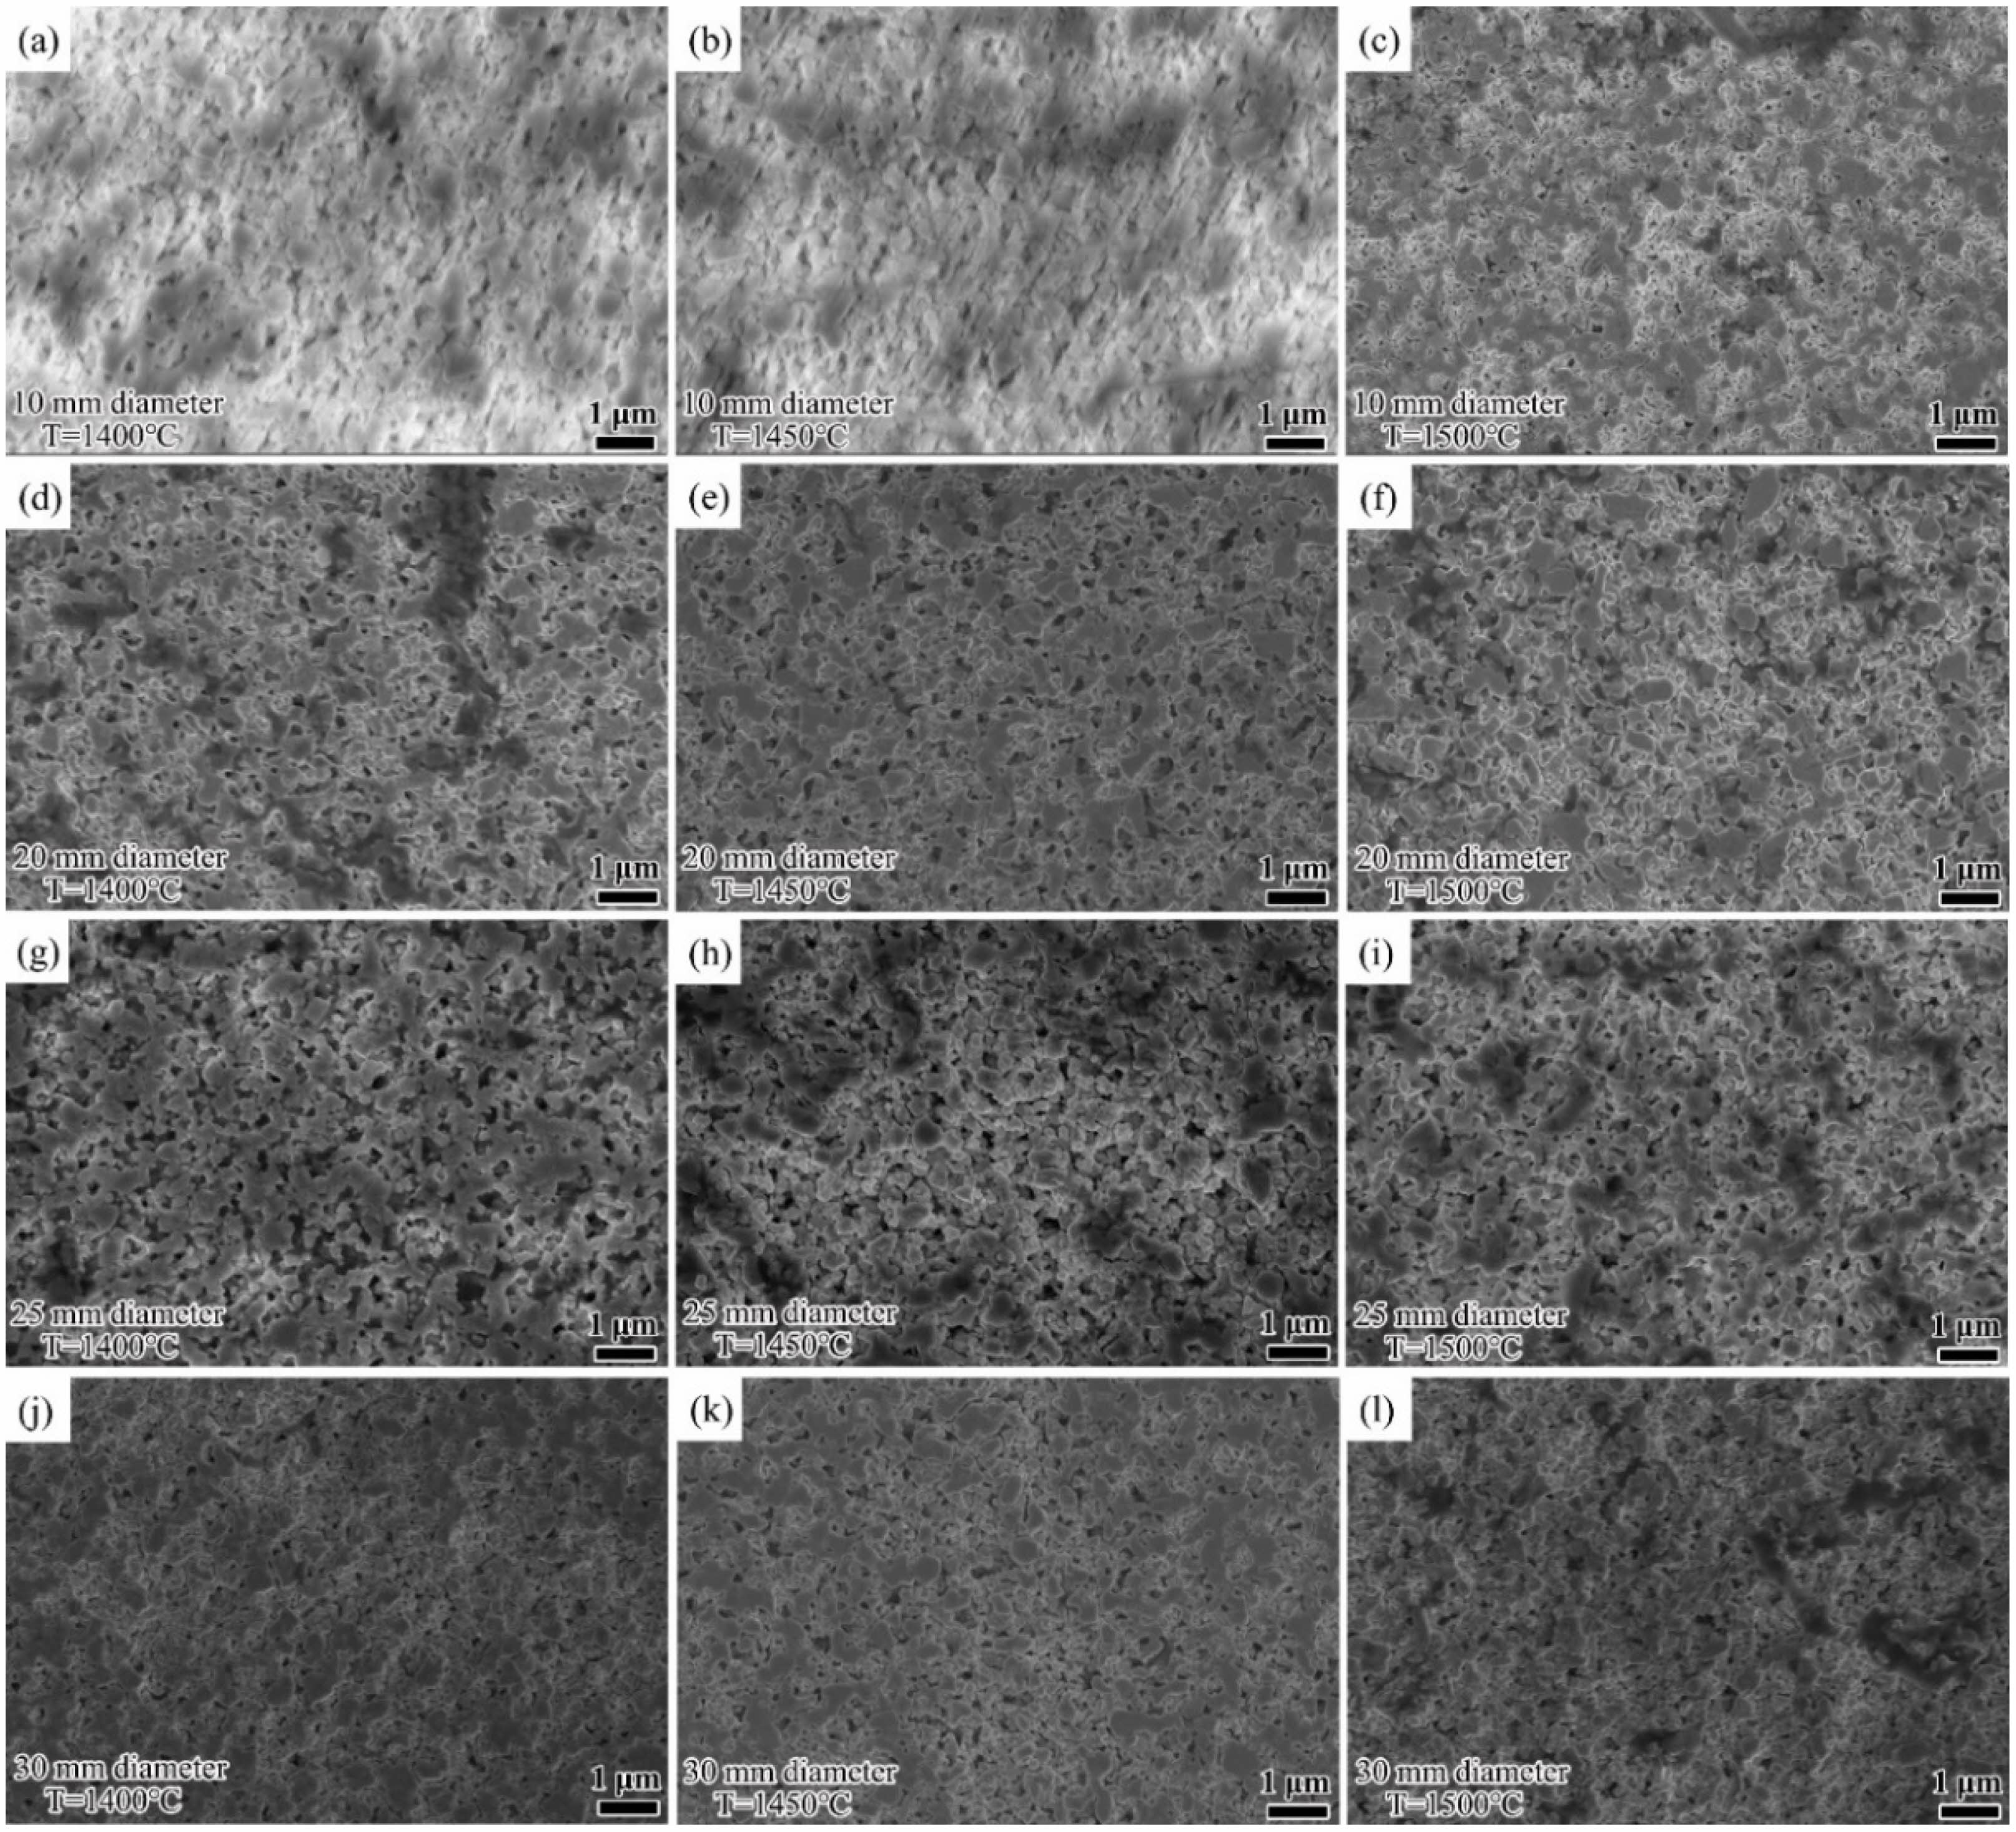
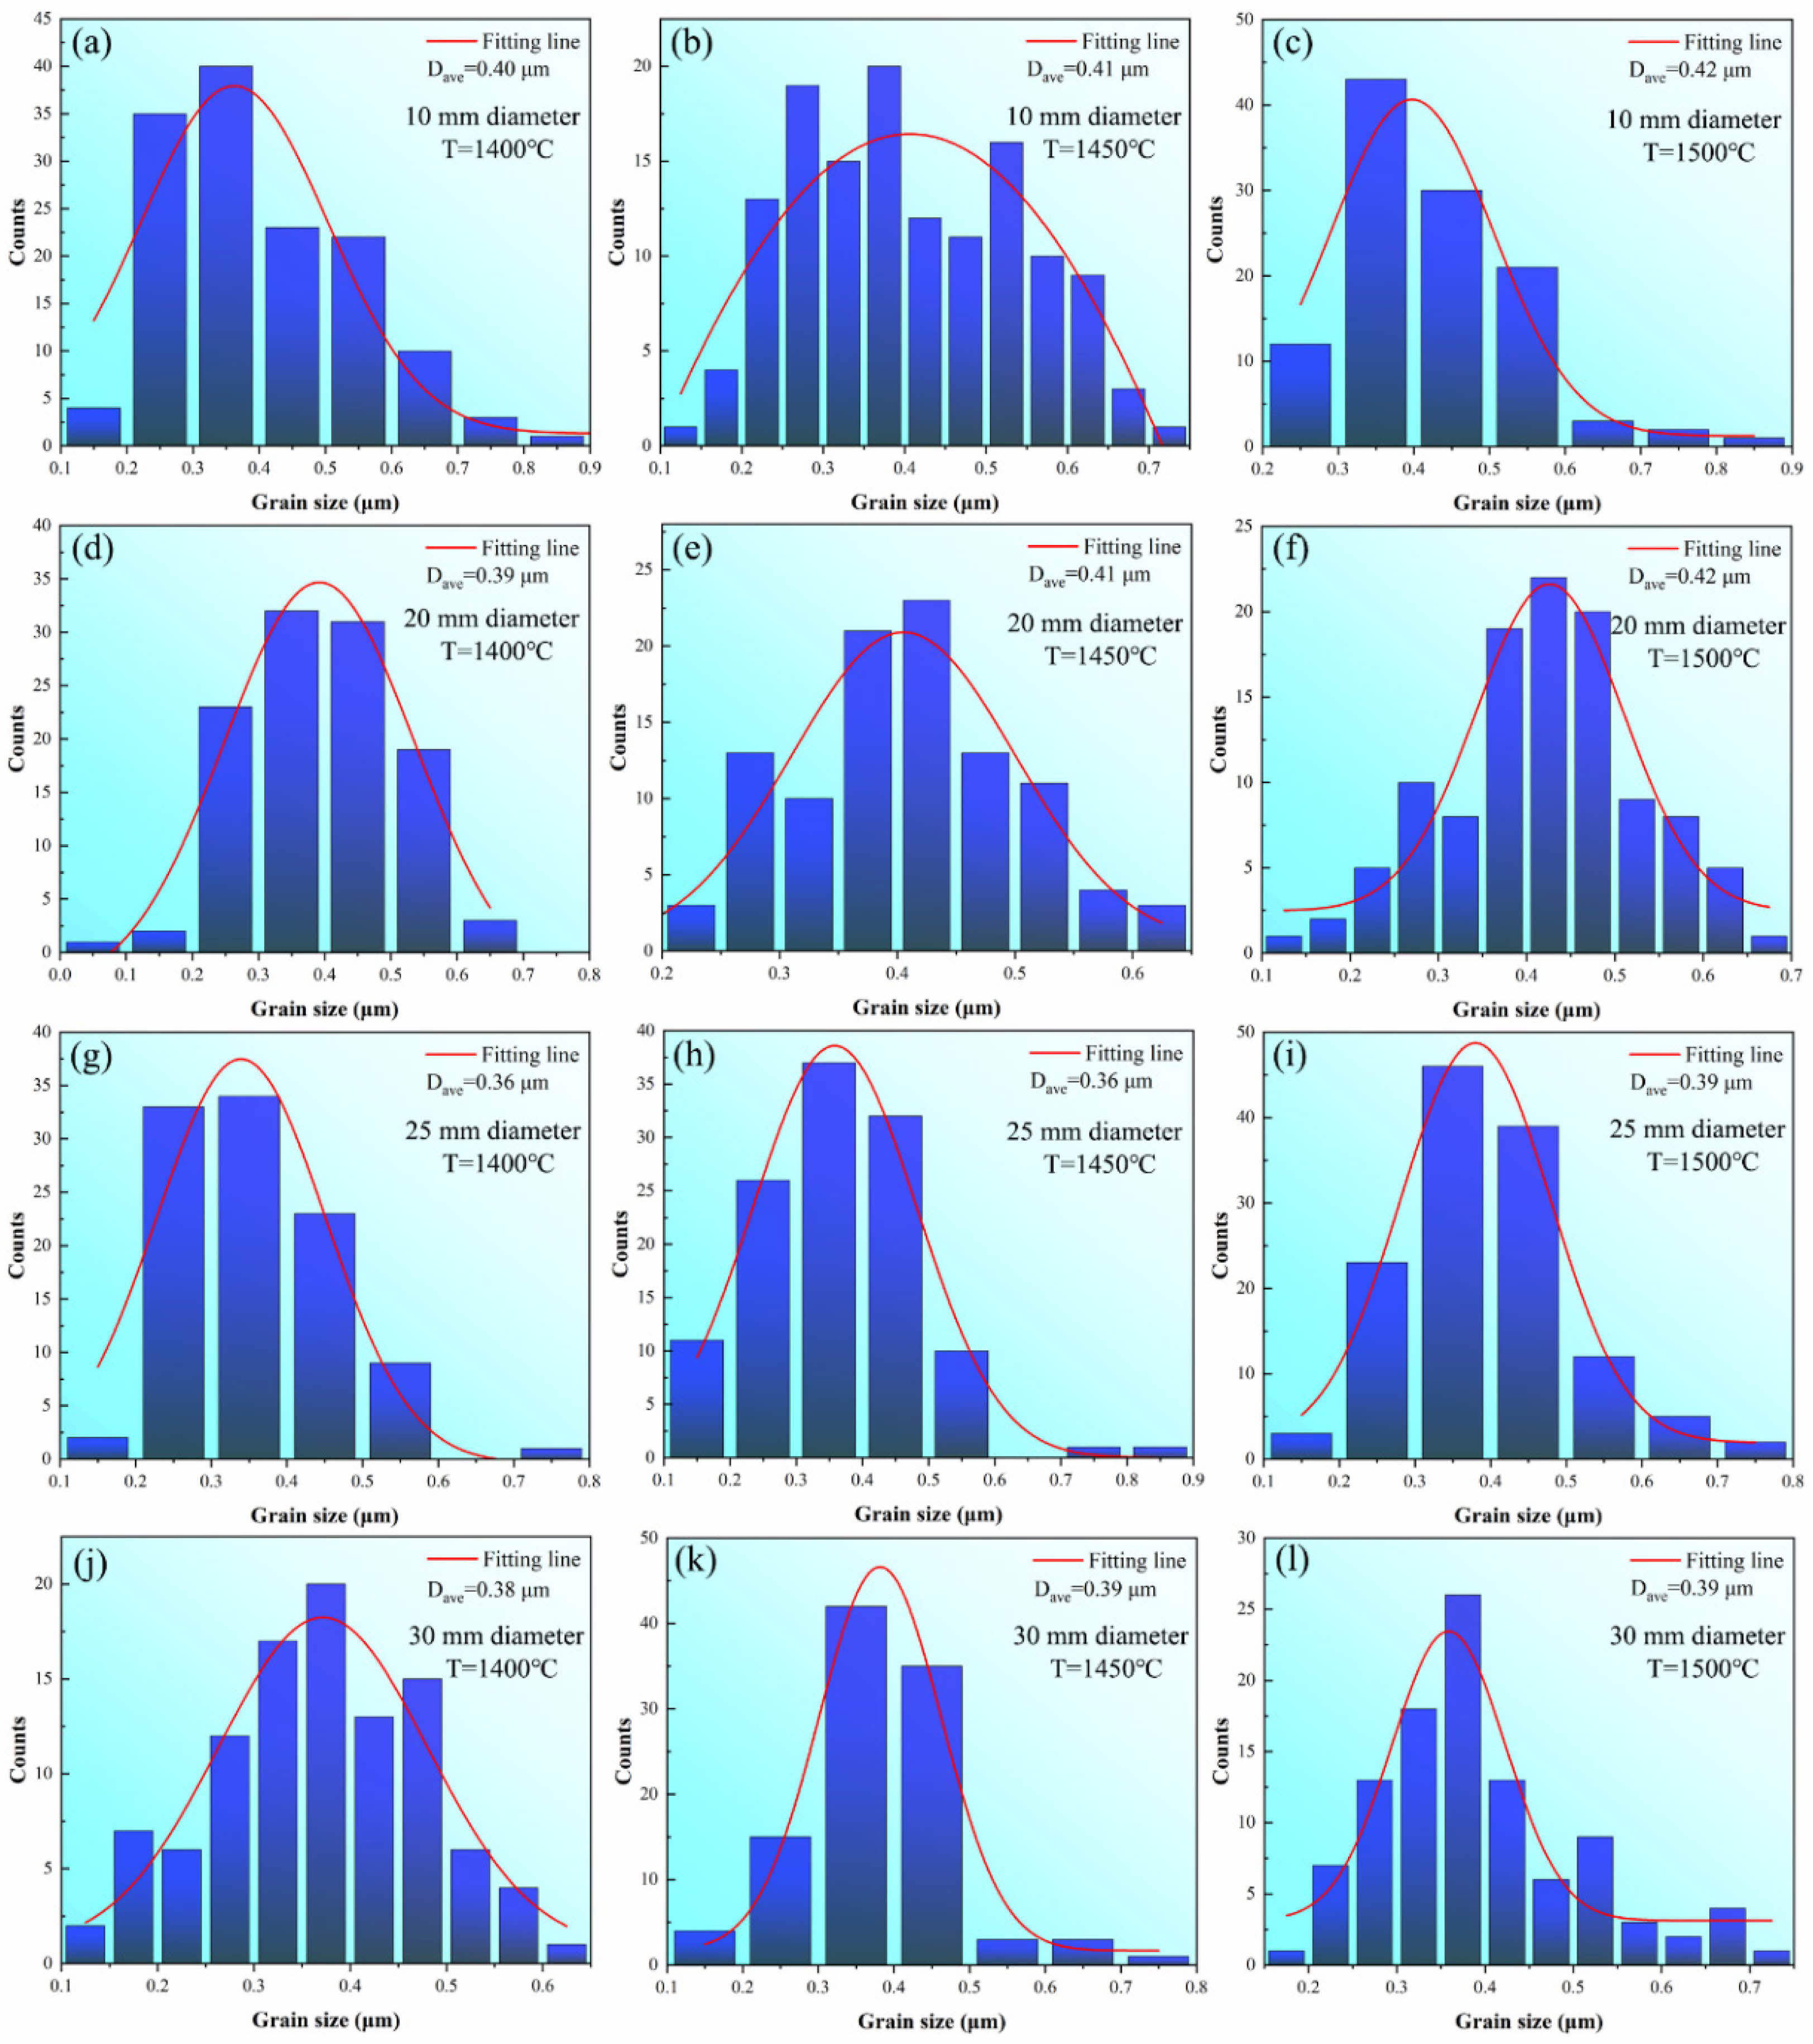
Fig. 3 shows the SEM pictures of the etched samples of bulk WC sintered at graphite dies with different internal diameters at temperatures ranging from 1400 to 1500 ℃. It can be observed that grains feature similar sizes under different sintering conditions. The counting results of grain size distribution are shown in Fig. 4 and it can be observed that the average grain sizes are 0.40 (1400 ℃), 0.41 (1450 ℃), and 0.42 μm (1500 ℃) for samples sintered at the internal diameter of 10 mm, 0.39 (1400 ℃), 0.41 (1450 ℃), and 0.42 μm (1500 ℃) for samples sintered at the internal diameter of 20 mm, 0.36 (1400 ℃), 0.36 (1450 ℃), and 0.39 μm (1500 ℃) for samples sintered at the internal diameter of 25 mm, and 0.38 (1400 ℃), 0.39 (1450 ℃), and 0.39 μm (1500 ℃) for samples sintered at the internal diameter of 30 mm. In conclusion, no obvious coarsening occurs at different sintering temperatures nor at different graphite die internal diameters. In this condition, the grain size can be regarded to be constant during SPS, and pln(b/G) becomes a constant. Furthermore, B, D0, b are also
constants and  becomes a constant in the soaking period. Therefore, Eq. (6) can be transformed into:

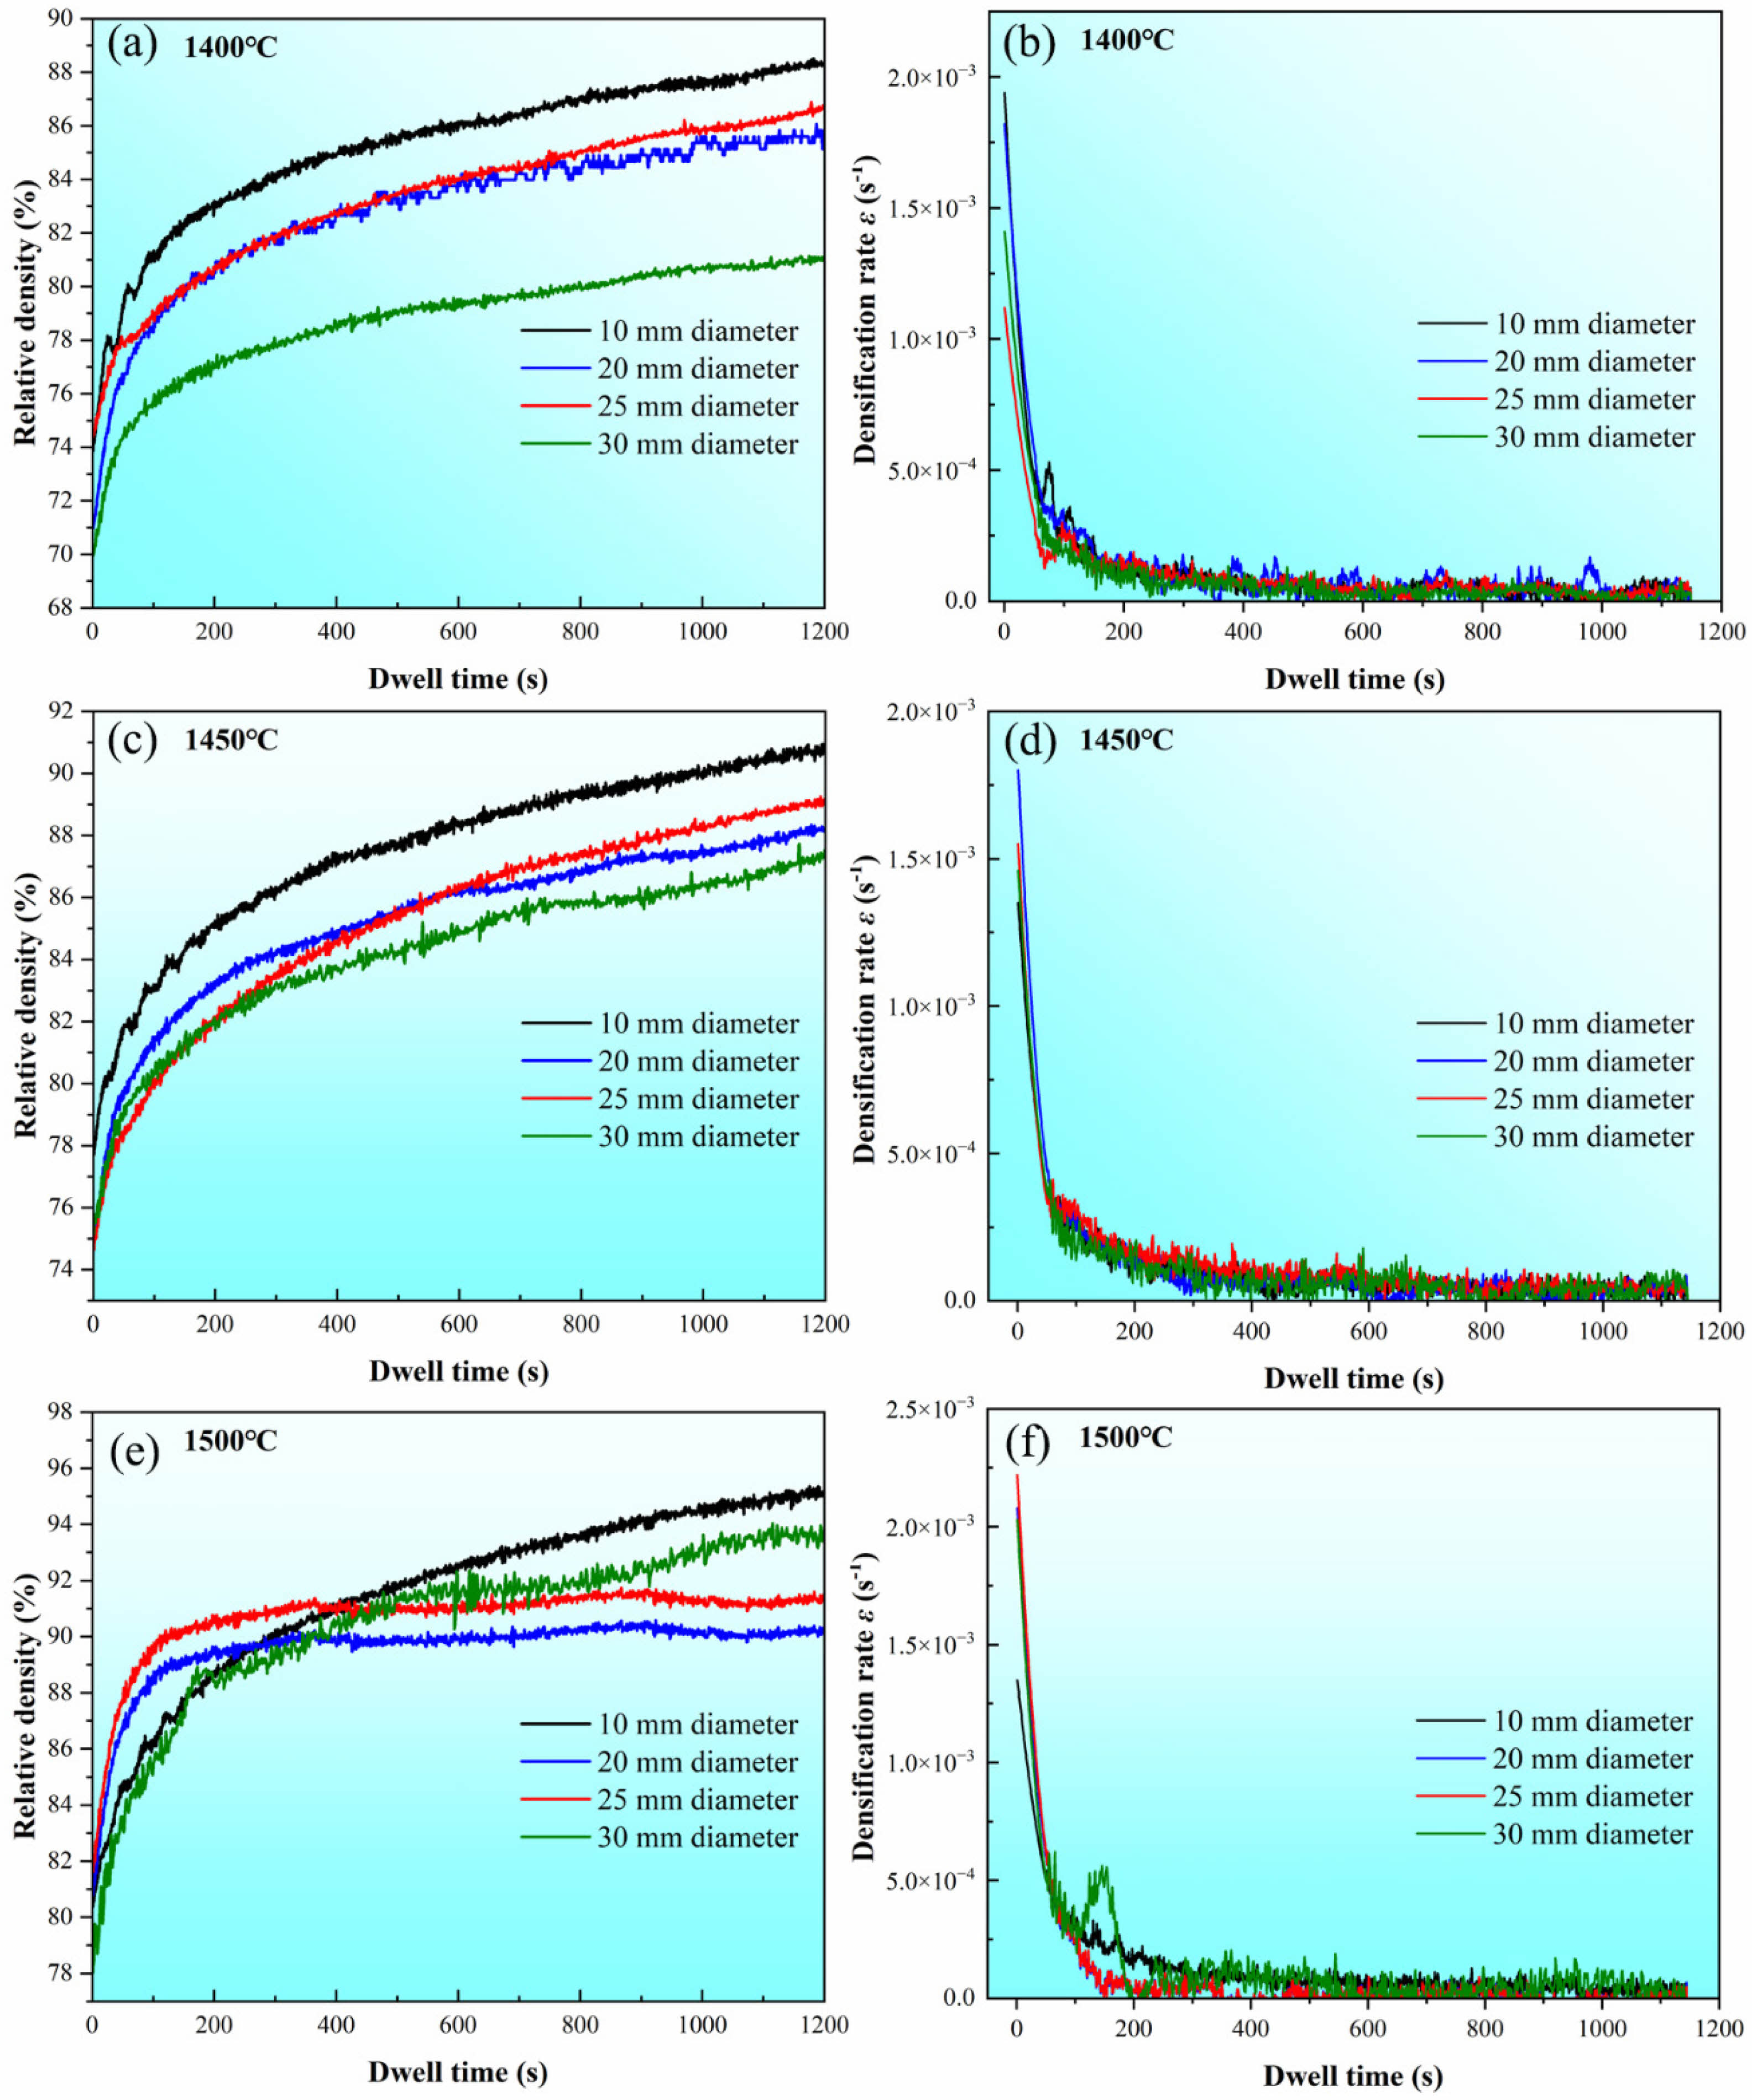
Fig. 5 shows the variation curves of ρi and ε̇ as a function of dwell time t in the soaking period with different internal diameters at temperatures of 1400, 1450, and 1500 ℃. It can be observed that samples sintered in the graphite die with the internal diameter of 10 mm have the highest ρf throughout all three different sintering temperatures. By contrast, samples sintered in the graphite die with the internal diameter of 30 mm have the lowest ρf at temperatures of 1400 and 1450 ℃. However, the sample sintered in the graphite die with the internal diameter of 20 mm has the lowest ρf while the sample sintered in the graphite die with the internal diameter of 30 mm has the second highest ρf at the temperature of 1500 ℃. Such difference in ρf indicates that the internal diameter of graphite die affects the shrinkage of the WC powder during SPS. After ρi and are determined, the slope n in Eq. (7) can be calculated by linear fitting between the independent
variable ln and the dependent variable
  , where
  is the intercept.
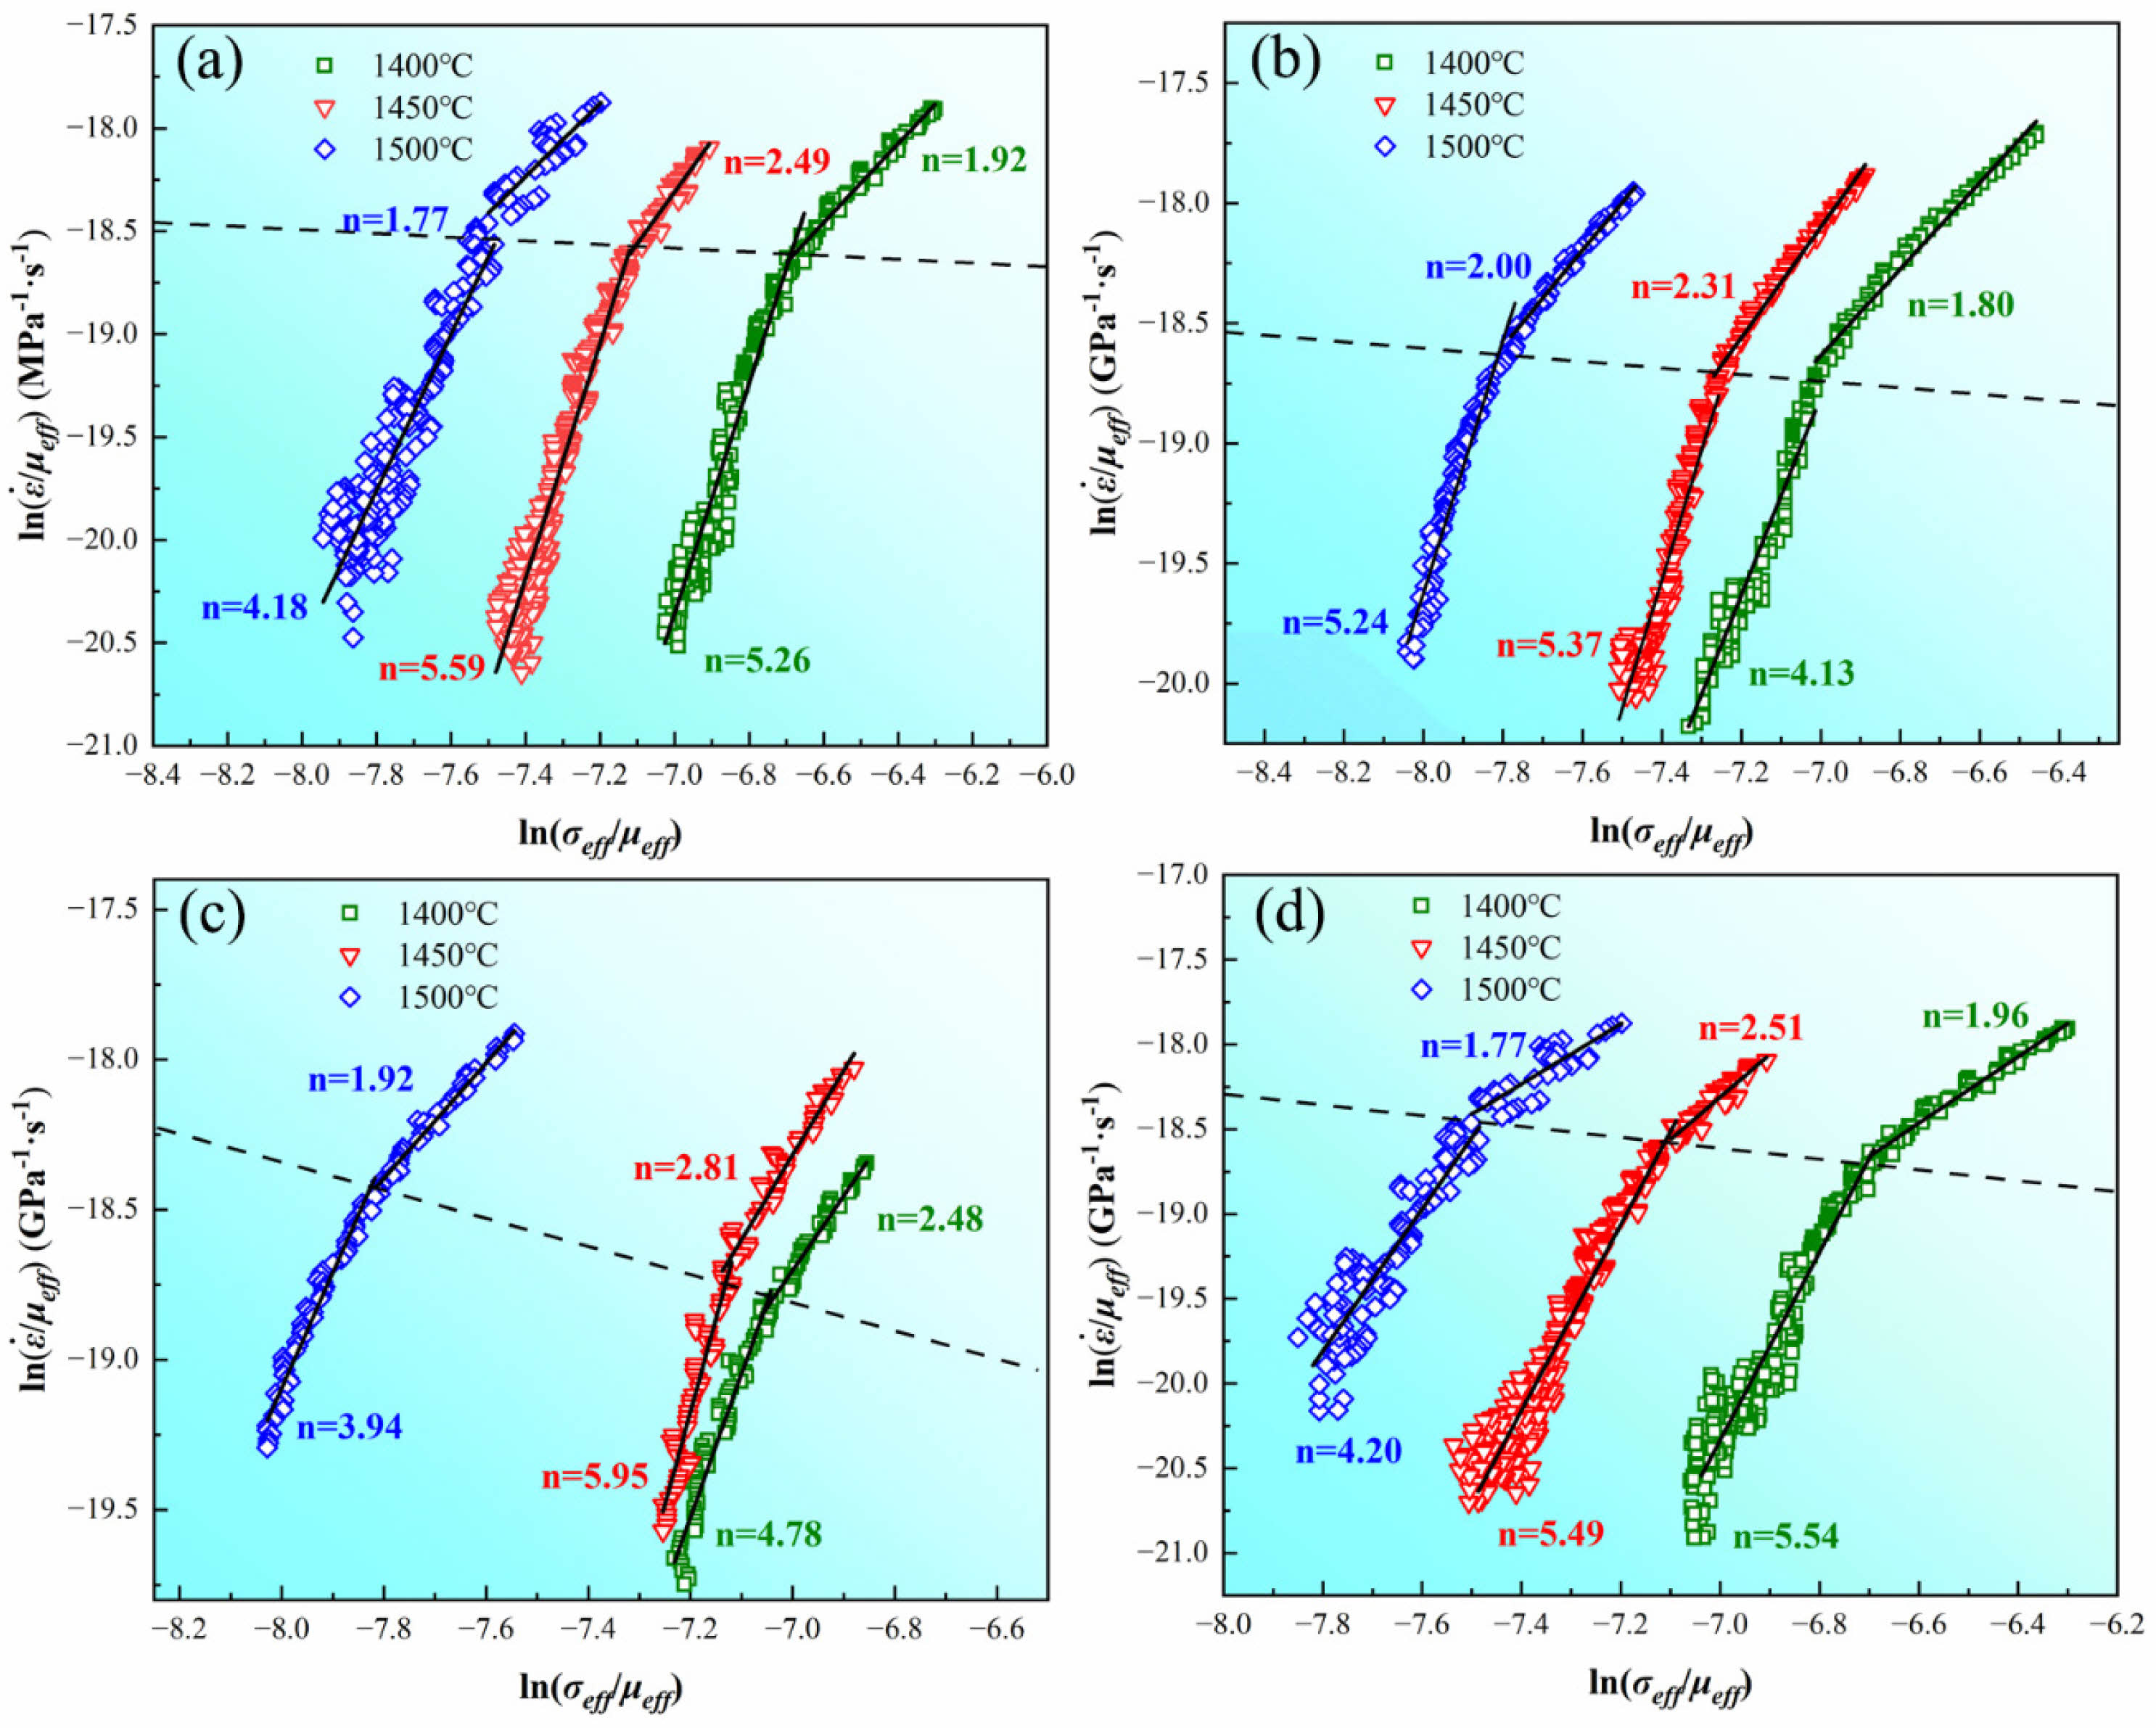
Fig. 6 shows the plotted curves of  as a function of
  and it can be observed that each curve can be divided into two segments by the black dashed lines, which have different values of n after linear fitting. The top side of the curves belongs to the early stage while the bottom side of the curves belongs to the later stage in the soaking period. The values of n are fitted to be 1.77, 2.49, and 1.92 with the internal diameter of 10 mm, 2.00, 2.31, and 1.80 with the internal diameter of 20 mm, 1.92, 2.81, and 2.48 with the internal diameter of 25 mm, and 1.77, 2.51, and 1.96 with the internal diameter of 30 mm on the top side of the curves. In comparison, n are fitted to be 4.18, 5.59, and 5.26 with the internal diameter of 10 mm, 5.24, 5.37, and 4.13 with the internal diameter of 20 mm, 3.94, 5.95, and 4.78 with the internal diameter of 25 mm, and 4.20, 5.49, and 5.54 with the internal diameter of 30 mm on the bottom side of the curves. It can be observed that n is smaller on the top side than on the bottom side of the curves, which implies the transformation of the densification mechanism during SPS.
After the values of n are obtained, the activation energy Q can be further calculated by transforming Eq. 7 into:

where  becomes the slope of the independent variable
  and dependent variable
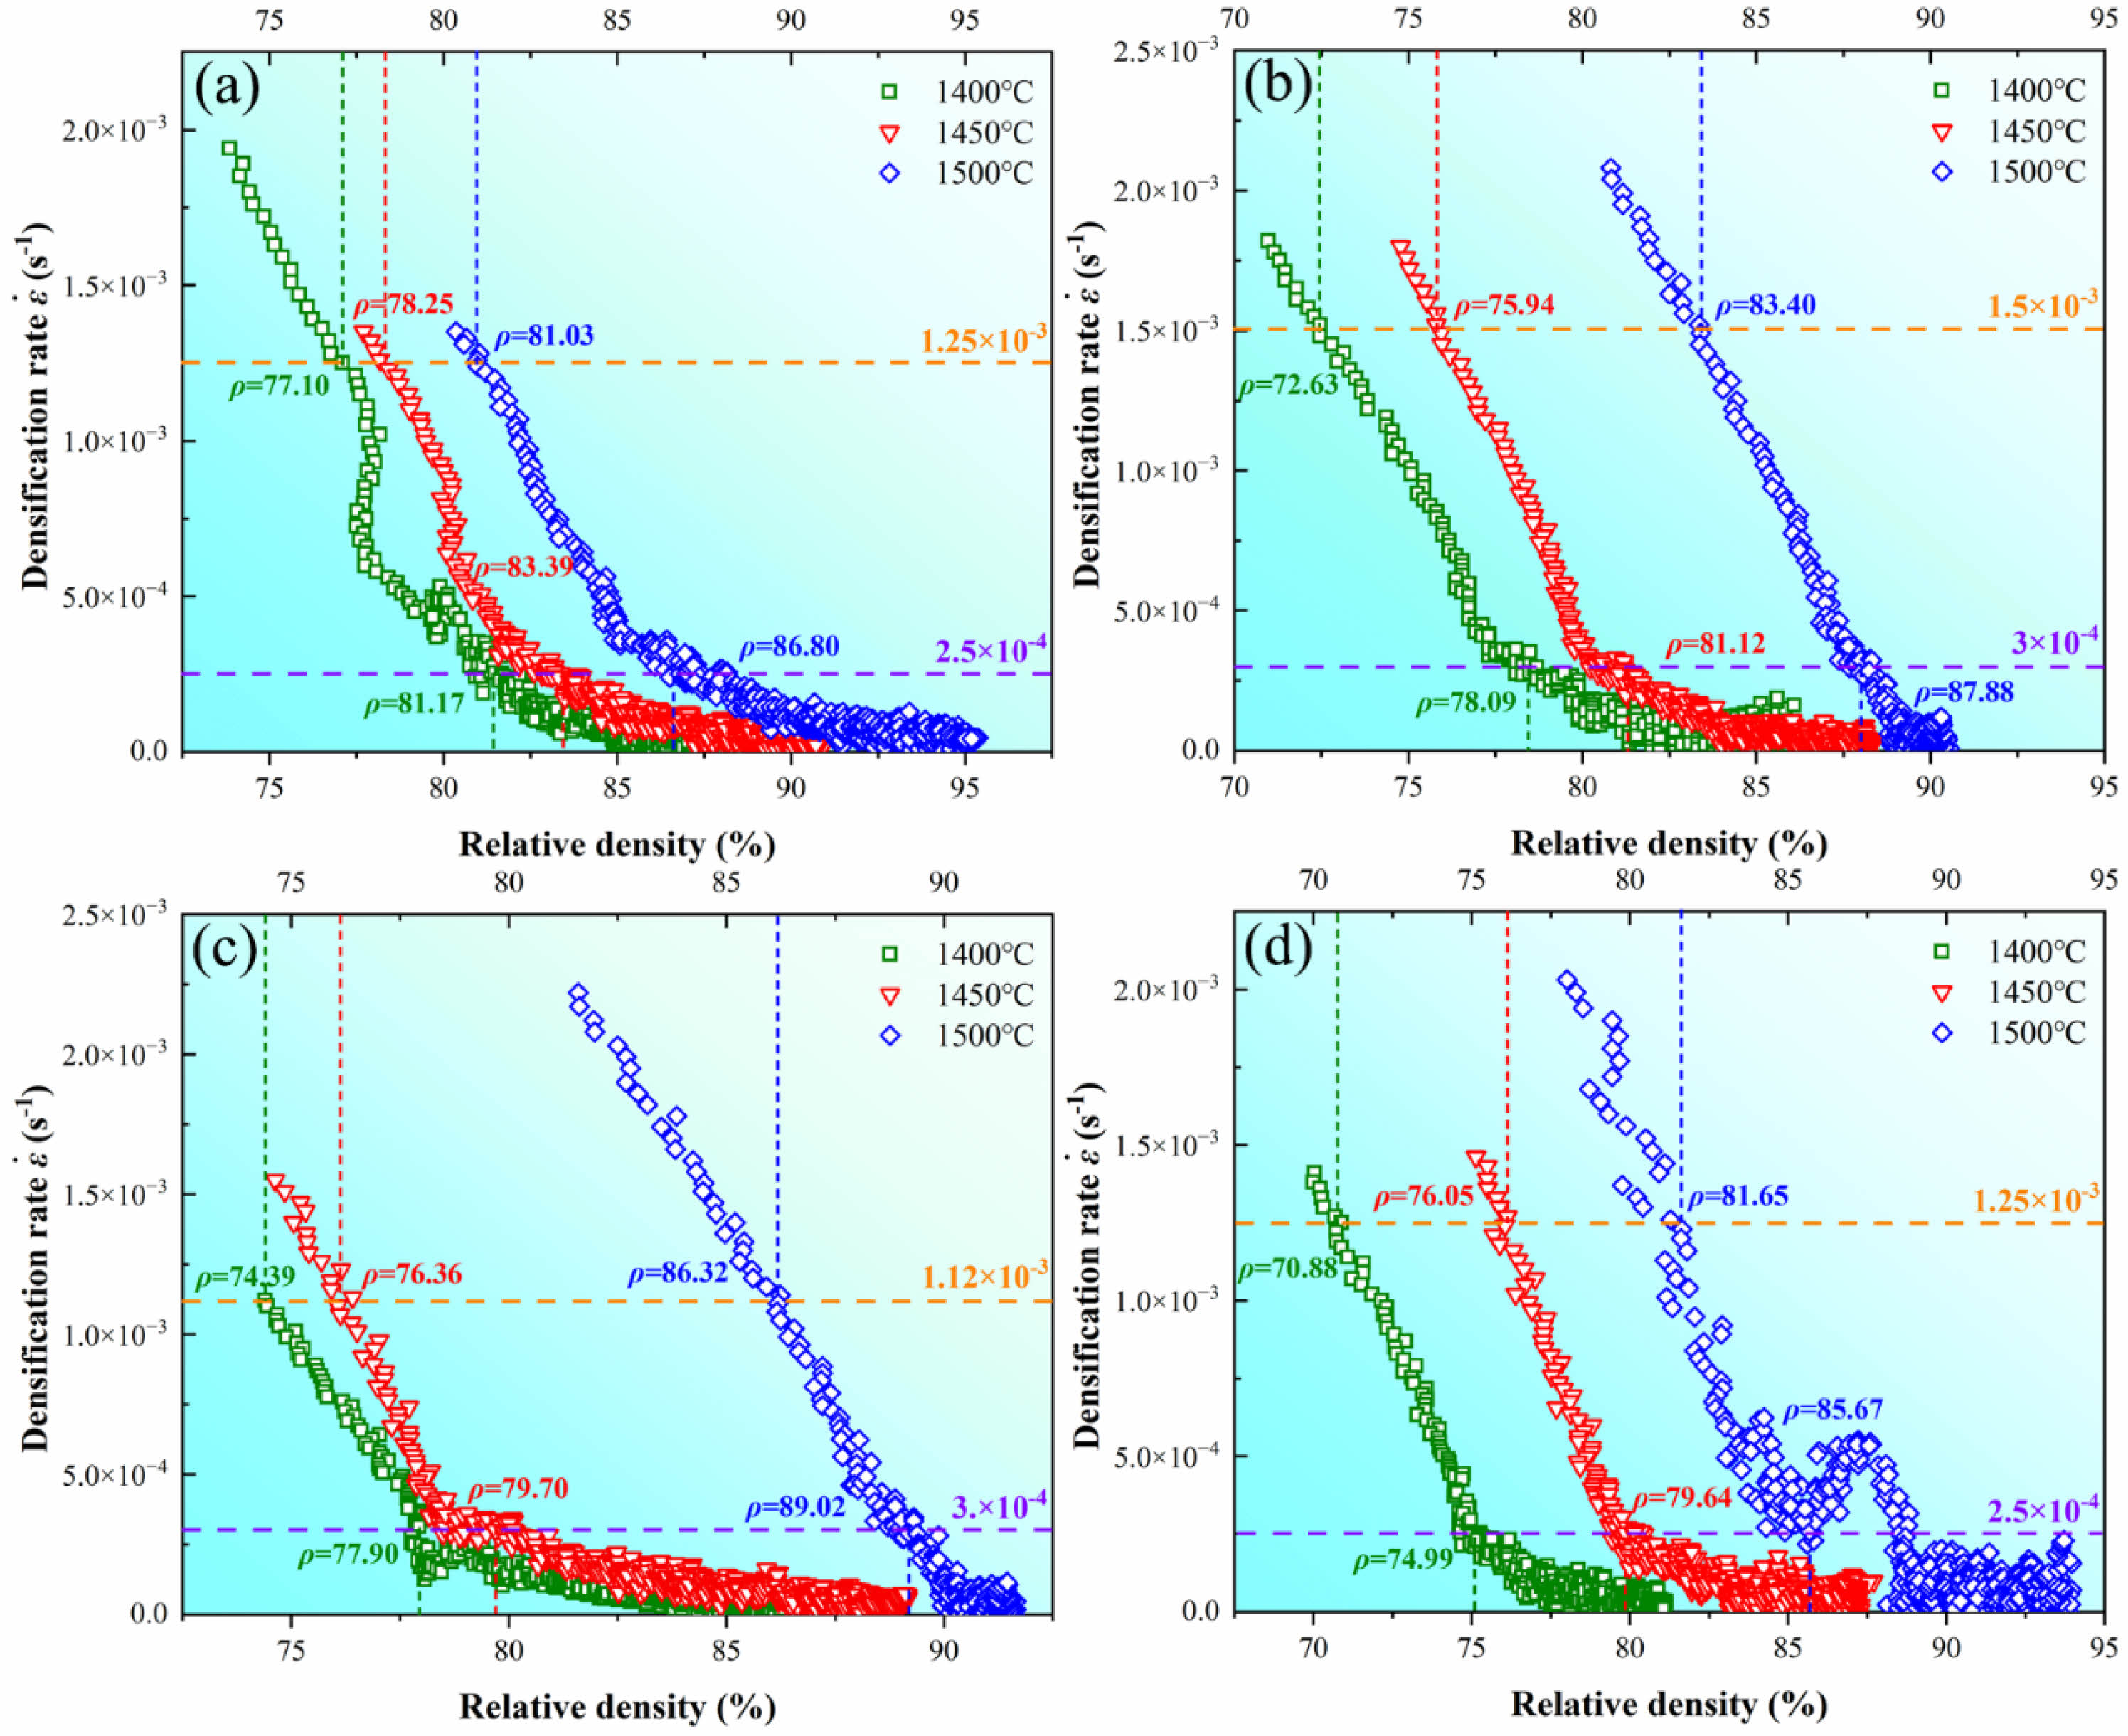
  . Similar to n, Q can be obtained by linear fitting based on the experimental data. To exclude the influence of variable n, the constant n=2 and 4.5 are given in Eq. (8) corresponding to the early and later stages in the soaking period, which is in the ranges of n values as shown in Fig. 6. After n is determined, ε̇, μeff, and σeff are further required for the linear fitting. Fig. 7 shows the adopted and ρi for samples sintered in graphite dies with different internal diameters. The chosen with the higher values belongs to the early stage of the soaking period as shown in Fig. 5, which corresponds to n=2. By contrast, the chosen with the lower values belongs to the later stage of the soaking period, which corresponds to n=4.5. The corresponding ρi of the internal diameters of 10 mm at soaking temperatures ranging from 1400 to 1500 ℃ is 77.10%, 78.25%, and 81.03% with =1.25×10⁻³ s-1 and 81.17%, 83.39%, and 86.80% with =2.5×10⁻⁴ s-1. By contrast, the corresponding ρi of the internal diameters of 20 mm at soaking temperatures ranging from 1400 to 1500℃ is 72.63%, 75.94%, and 83.40% with =1.5×10⁻³ s-1 and 78.09%, 81.12%, and 87.88% with =3×10⁻⁴ s-1. In comparison, the corresponding ρi of the internal diameters of 25 mm at soaking temperatures ranging from 1400 to 1500 ℃ is 74.39%, 76.36%, and 86.32% with =1.12×10⁻³ s-1 and 77.90%, 79.70%, and 89.02% with =3×10⁻⁴ s-1. Finally, the corresponding ρi of the internal diameters of 30 mm at soaking temperatures ranging from 1400 to 1500 ℃ is 70.88%, 76.05%, and 81.65% with =1.25×10⁻³ s-1 and 74.99%, 79.64%, and 85.67% with =2.5×10⁻⁴ s-1. After ρi is determined, μeff and σeff can be further calculated based on Eqs. (3) and (4) where Eth and νeff are given to be 550 GPa and 0.31 respectively according to the guidebook.
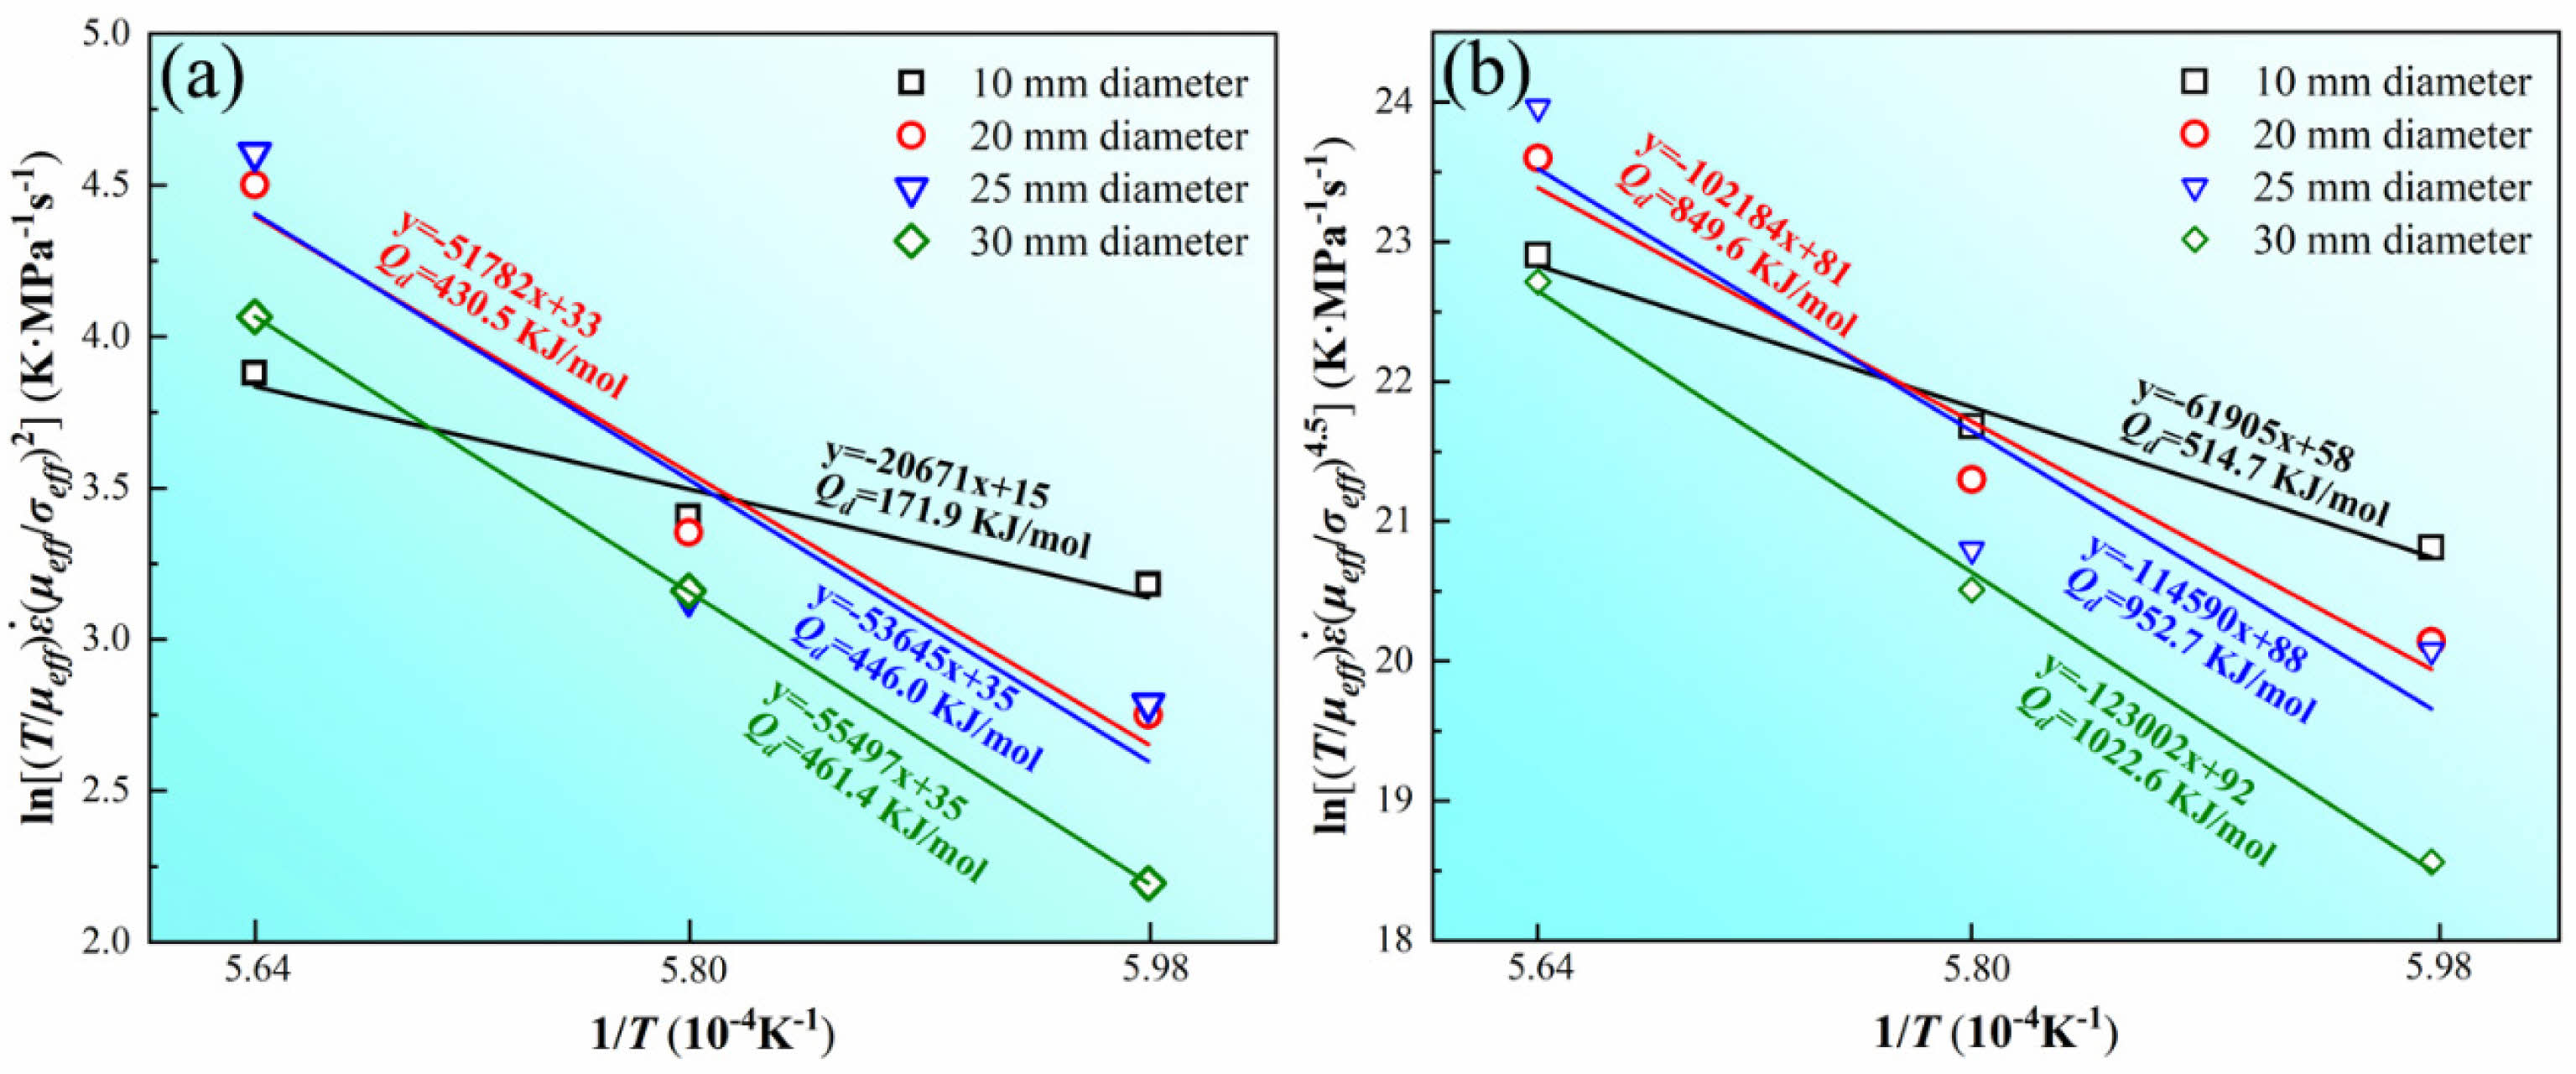
After the parameters required in Eq. (8) are decided, linear fitting is carried out based on the sintering experimental data of graphite dies with different internal diameters under different temperatures. Fig. 8 shows the results of the linear fitting and it can be observed that powder sintered in the graphite die with internal diameter of 10 mm has the lowest activation energy Q of 171.9 kJ/mol at n=2. With the increase of internal diameter, Q rises to 430.5 (20 mm), 446.0 (25 mm), and 461.4 kJ/mol (30 mm) at n=2. According to Nanda et al. [16], Q of pure WC during sintering is 41.35 kJ/mol and 113.4 kJ/mol controlled by grain boundary (GB) and lattice diffusion (LD), respectively. Q dramatically increases to 310.5 kJ/mol as the dominant densification mechanism transformed into GB diffusion of C in WC. In their study, the values of n are linear-fitted to be 2.14, 3.66, 1.46, and 3.12 at temperatures ranging from 800 to 1000 ℃. Nevertheless, the values of n adopted by Nanda at temperatures higher than 1000 ℃ are lower than the fitted results, which are 0.5 for LD and 0.33 for GB diffusion. The values of n affect the final fitted results as Q significantly increases with the increase of n. Therefore, Q calculated in this study at n=2 are several times of that reported by Nanda. Zhang et al. [17] studied the densification kinetics of B4C and reported the dominant mechanism belonged to GB diffusion at n=2 with Q=459.61 kJ/mol, which is similar to the results in this study. In this condition, GB diffusion is more likely to be the mechanism responsible for densification in the early soaking period.
The sequence of Q at n=4.5 is in accordance with that at n=2 as a higher Q is obtained in the graphite die with a larger internal diameter. However, the value of Q at n=4.5 is three times of Q at n=2 in the graphite die with the internal diameter of 10 mm. Besides, the value of Q in the graphite dies with internal diameters of 20, 25, and 30 mm at n=4.5 is also about two times of Q at n=2. The conspicuous increase of Q from n=2 to n=4.5 indicates the transformation of the controlled densification mechanism. Deng et al. [18] studied the densification kinetics of pure tungsten and revealed that dislocation climb-controlled creep is dominant at n≥4.5. Chen et al. [19], and Gao et al. [20] studied the GB diffusion of tungsten and reported Q to be 318 and 277 kJ/mol. By contrast, Andelin et al. [21], and Pawel et al. [22] studied the dislocation climb-controlled creep of tungsten and reported Q to be 641 and 587 kJ/mol, which shows a similar variation tendency compared to Q at n=2 and 4.5 in this study. Thus, dislocation climb-controlled creep should be responsible for the densification of WC powder in the later soaking period.
|
Fig. 2 XRD result of the raw powder and the standard diffraction patterns of the WC. |
|
Fig. 3 SEM pictures of the etched WC samples sintered in graphite dies with different internal diameters at temperatures of 1400, 1450, and 1500 ℃. |
|
Fig. 4 Grain size distribution histogram counted on the SEM pictures of the WC samples sintered in graphite dies with different internal diameters at temperatures of 1400, 1450, and 1500 ℃. |
|
Fig. 5 Relative density and corresponding densification rate variation curves of the WC powder sintered in graphite dies with different internal diameters at temperatures of 1400, 1450, and 1500 ℃. |
|
Fig. 6 Linear-fitting of n by the experimental data in the soaking period of powder sintered in graphite dies with internal diameters of (a) 10 mm, (b) 20 mm, (c) 25 mm, and (d) 30 mm at temperatures of 1400, 1450, and 1500 ℃. |
|
Fig. 7 Determination of relative density ρi at the chosen densification rate ε̇ in the early and later densification stage during the soaking period in graphite dies with internal diameters of (a) 10 mm, (b) 20 mm, (c) 25mm, and (d) 30 mm at temperatures of 1400, 1450, and 1500 ℃. |
|
Fig. 8 Linear-fitting of the activation energy Q in graphite dies with different internal diameters at stress exponent (a) n=2 and (b) n=4.5. |
Effect of the internal diameter on Q
The SPS parameters are set to be constant except for the internal diameter of the graphite die, but Q is noticeably low in the graphite dies with internal diameter of 10 mm in contrast with that in the graphite dies with internal diameter of 20, 25, and 30 mm regardless of n=2 or 4.5. Such difference indicates the driven force for densification varies in different internal diameters. The essential difference between SPS and other pressure-assisted sintering is the applied electric current. The applied current features high density which introduces the famous electromigration effect on raw powder during SPS. In our previous study, it is proposed that D in Eq. (1) should be the effective densification coefficient during SPS, which is given as [23-25]:

where A is a constant, Z* is the effective valence, e is the charge of an electron (Z*e called “the effective charge”), ρ′ is the resistivity, and je is the current density. Therefore, substitute Eq. (9) into Eq. (1) and Eq. (8) further transforms into:
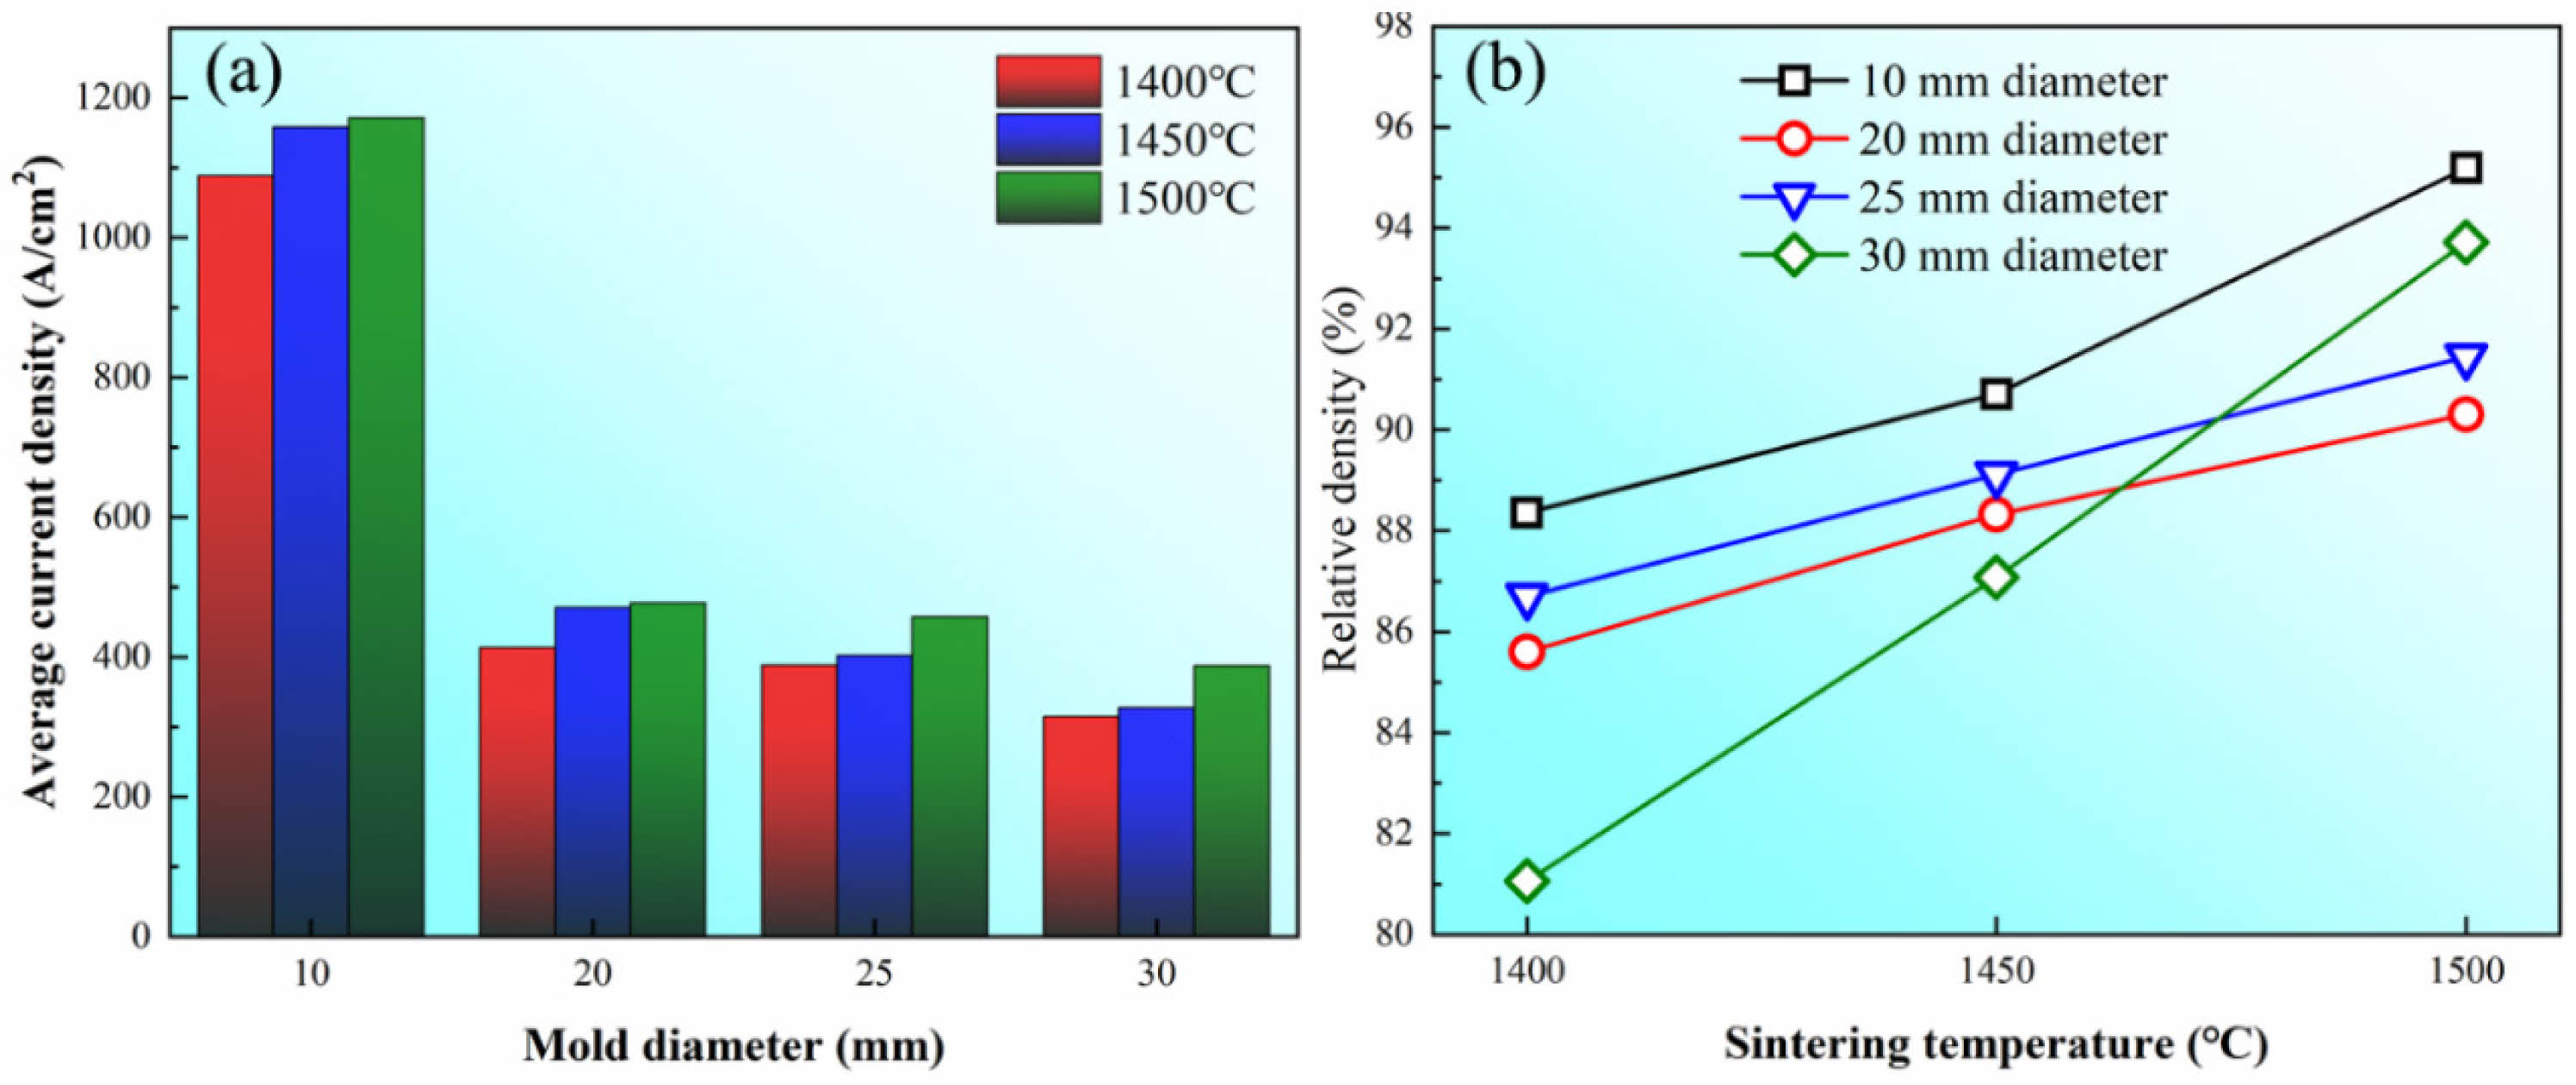
It can be observed from Eq. 10 that the actual results fitted in Fig. 8 should be -Q+A|Z*|er' je, which refers to the effective activation energy Qeff under the electromigration effect. Therefore, a higher je could further reduce Qeff [26]. Fig. 9(a) shows the average current density in graphite dies with different internal diameters in the soaking period. It can be observed that there is the highest current density of more than 1000 A/cm2 in the graphite die with the internal diameter of 10 mm. In comparison, the current density of graphite dies with internal diameters of 20, 25, and 30 mm is about 400 A/cm2, which is less than half of that in the graphite die with internal diameter of 10 mm. In this condition, there is a lowest Qeff in the graphite die with the internal diameter of 10 mm at n=2 according to Eq. (10) considering GB diffusion is responsible for densification in this stage.
Although the dominant mechanism transforms from GB diffusion to dislocation climb-controlled creep with the value of n increasing to 4.5, Qeff shows a similar sequence to that of n=2. Such a phenomenon indicates the applied current also reduces the activation energy in the later densification stage. According to Weertman, the creep rate is given as [27]:

where b' is the Burgers vector of the edge dislocation involved in dislocation climb, β is a constant, d is the distance between the neighboring two dislocation, M is the density of the dislocation source, and Vm is the dislocation climbing rate. When kT >>σb' 3, Vm has the relationship as follows [28]:

where Dv is the lattice diffusion coefficient for vacancy and σ is the applied external load. It can be observed from Eq. (12) that the creep rate is directly proportional to Dv. Similar to Deff in GB diffusion, the applied current accelerates the creep rate by lowering the activation energy of Dv. As a result, the fitted Qeff also decreases at n=4.5 with the increase of je which is negatively related to the graphite die internal diameters.
Effect of the internal diameter on ρf
The reduction of Qeff with the increase of je is theoretically expected to boost the densification and result in an increase of ρf. However, the experimental data do not follow the expectation. Fig. 9(b) shows ρf of samples sintered in graphite dies with different internal diameters at temperatures ranging from 1400 to 1500 ℃. It can be observed that ρf of the sample in the graphite die with the internal diameter of 25 mm is higher than that of the sample in the graphite die with the internal diameter of 20 mm at all three temperatures. Furthermore, ρf of the sample in the graphite die with the internal diameter of 30 mm is even higher than that of the samples in the graphite dies with the internal diameters of 20 and 25 mm at the temperature of 1500 ℃. According to Olevsky et al. [29], the driving forces that work for GB diffusion include surface tension, electromigration, and applied external load. Considering the same raw powder is used in different graphite dies, the driving force of surface tension should be identical. The driving force of electromigration should offer higher ρf in graphite dies with smaller internal diameters as aforementioned. Therefore, the applied external load smax is responsible for the experimental sequence of ρf in different graphite dies. The shrinkage rate in the GB diffusion-controlled stage induced by σeff is given as [30]:

where δgb is the thickness of grain boundary, Ω is the atomic volume, k is the Boltzmann constant, and rp is the pore radius. σeff is negative for the compressive external load. Considering the friction resistance between raw powder and graphite sheet, distribution of σeff differs in the powder compact under the constant σmax. SPS furnace used in this study provides uniaxial external load on the bottom surface of the powder compact. In this case, the actual σ'max on the cross section with the distance of L to the bottom surface of the powder compact could be empirically given as [31]:

where e is the Napierian base, d is the internal diameter of the graphite die, ε is the proportional coefficient of axial and lateral pressures on the specific cross-section, and μ is the friction coefficient between powder and graphite sheet. ε is calculated based on νeff as lateral pressure comes from the resistance of the graphite die to the radial deformation during shrinkage. It can be observed from Eqs. (3) and (14) that σ'max is positively related to d under the similar L and ρi. According to Eq. (4), σeff increases with the increment of σ'max and therefore, is higher in graphite dies with larger internal diameters. The difference in current density is much smaller in the graphite dies with d of 20, 25, and 30 mm compared to that in the graphite die with d of 10 mm. As a result, the total densification could be faster in graphite die with a larger d when the contribution of is higher than that of electromigration in the GB diffusion-controlled stage with n=2.
However, ρf is jointly decided by GB diffusion and dislocation climb-controlled creep at n=4.5. For the creep densification stage, the densification rate can be also given as [32]:
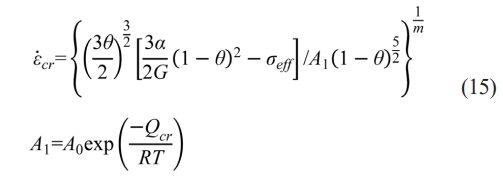
where α is the surface tension, A0 is the pre-exponential factor of the power-law creep frequency, Qcr is the power-law creep activation energy, and m is the power-law creep exponent. It can be observed that similar to GB diffusion, dislocation climb-controlled creep also shows a positive relation to σeff which has negative values as aforementioned. Therefore, is higher in graphite dies with larger internal diameters at n=4.5, which shows the inverse sequence in contrast with that induced by electromigration at n=2. As a result, ρf does not follow the similar tendency in Q with the increase of internal diameter d, which is shown in Figs. 8 and 9(b).
|
Fig. 9 (a) Histogram of the average current density and (b) plotted curves of the final relative density ρi in graphite dies with different internal diameters at temperatures of 1400, 1450, and 1500 ℃. |
The steady-creep model is applied in the study of densification kinetics of the ultra-fine pure WC powder. The activation energy is obtained by linear-fitting and the effect of different internal diameters of the graphite dies on the activation energy and final relative density is analyzed. The main conclusions are drawn as follows:
There is the lowest Q of 171.9 and 514.7 kJ/mol corresponding to the densification mechanism of GB diffusion at n=2 and dislocation climb-controlled creep at n=4.5 in the graphite die with d of 10 mm.
The current density increases along with the decrease of d of the graphite dies and a stronger electromigration effect is responsible for the reduction of Q in both the GB diffusion and dislocation climb-controlled creep densification stages.
σ'max decreases along with the increase of d of the graphite dies, which makes an inverse effect of σeff on the GB diffusion and dislocation climb-controlled creep compared to that of the electromigration in the small to large sequence of d. As a result, ρf is higher in d=25 mm than that in d=20 mm.
The authors are grateful for the financial support from the National Natural Science Foundation of China (52301045) in this work.
The raw/processed data required to reproduce these findings cannot be shared at this time as the data also forms part of an ongoing study.
- 1. L. Lin, B. Liu, T. Zhang, B. Long, L. Lin, C. Fan, X. Wen, and C. Liu, Int. J. Refract. Met. Hard Mater. 118 (2024) 106447.
-

- 2. A.O. Gorlenko, S.V. Davydov, M.Y. Shevtsov, and D.A. Boldyrev, Steel Transl. 49 (2019) 212-216.
-

- 3. K. Zeng, X. Wu, F. Jiang, J. Shen, L. Zhu, and L. Li, J. Manuf. Process. 108[4-5] (2023) 335-358.
-

- 4. Y. Wu, Z. Lu, Y. Qin, Z. Bao, and L. Luo, J. Mater. Res. Technol. 27 (2023) 5822-5839.
-

- 5. M. Kawakami, Int. J. Refract. Met. Hard Mater. 118 (2024) 106477.
-

- 6. S. Sun, K. Li, W. Chu, and F. Gong, Int. J. Refract. Met. Hard Mater. 105 (2022) 105841.
-

- 7. M. Aristizabal, J.M. Sanchez, N. Rodriguez, F. Ibarreta, and R. Martinez, Corros. Sci. 53[9] (2011) 2754-2760.
-

- 8. E. De Bona, L. Karacasulu, C. Vakifahmetoglu, V.M. Sglavo, and M. Biesuz, J. Alloys Compd. 986 (2024) 174102.
-

- 9. G. Maizza, S. Grasso, Y. Sakka, T. Noda, and O. and Ohashi, Sci. Technol. Adv. Mater. 8[7-8] (2007) 644-654.
-

- 10. C. Hu, C. Chen, J. Sun, S. Wei, Y. Du, K. Pan, C. Wang, H. Yu, and T. Jiang, J. Mater. Res. Technol. 26 (2023) 7213-7223.
-

- 11. E. Olevsky, H.J. Dudek, and W.A. Kaysser, Acta Mater. 44[2] (1996) 707-713.
-

- 12. S. Xie, J. Zhang, R. Li, T. Yuan, M. Zhang, M. Wang, Z. Zhang, S. Deng, and Q. Li, Mater. Charact. 181 (2021) 111434.
-

- 13. J.G. Santanach, A. Weibel, C. Estourns, Q. Yang, C. Laurent, and A. Peigney, Acta Mater. 59[4] (2011) 1400-1408.
-

- 14. G. Liu, R. Li, T. Yuan, M. Zhang, and F. Zeng, Int. J. Refract. Met. Hard Mater. 66 (2017) 68-75.
-

- 15. G. Bernard-Granger, A. Addad, G. Fantozzi, G. Bonnefont, C. Guizard, and D. Vernat, Acta Mater. 58[9] (2010) 3390-3399.
-

- 16. A.K. Nanda and K. Kurokaw, Tungsten Carbide - Process. Appl. (2012).
-

- 17. M. Zhang, T. Yuan, and R. Li, J. Micromechanics Mol. Phys. 3 (2018) 1-13.
-

- 18. S. Deng, H. Zhao, R. Li, T. Yuan, L. Li, and P. Cao, Powder Technol. 356 (2019) 769-777.
-

- 19. L.C. Chen, Int. J. Refract. Met. Hard Mater. 12[1] (1993) 41-51.
-

- 20. Z. Gao, G. Viola, B. Milsom, I. Whitaker, H. Yan, and M.J. Reece, Metall. Mater. Trans. B. 43 (2012) 1608-1614.
-

- 21. R.L. Andelin, J.D. Knight, and D. Kahn, Trans. Met. Soc. AIME. 233 (1965) 19-24.
-

- 22. R.E. Pawel and T.S. Lundy, Acta Metall. 17[8] (1969) 979-988.
-

- 23. S. Xie, R. Li, T. Yuan, L. Zhou, M. Zhang, M. Wang, P. Niu, P. Cao, and C. Chen, Mater. Charact. 154 (2019) 169-180.
-

- 24. S. Xie, Y. Pan, Y. Fan, T. Yuan, and R. Li, J. Alloys Compd. 965 (2023) 171358.
-

- 25. S. Deng, R. Li, T. Yuan, S. Xie, M. Zhang, K. Zhou, and P. Cao, Scr. Mater. 143 (2018) 25-29.
-

- 26. S. Deng, R. Li, T. Yuan, P. Cao, and S. Xie, Metall. Mater. Trans. A. 50 (2019) 2886-2897.
-

- 27. J. Weertman, J. Appl. Phys. 26 (1955) 1213-1217.
-

- 28. M.F. Ashby, Acta Metall. 20 (1972) 887-897.
-

- 29. E.A. Olevsky, S. Kandukuri, and L. Froyen, J. Appl. Phys. 102 (2007) 114913.
-

- 30. J. Milligan, P. Hendrickx, M.M. Tünçay, E.A. Olevsky, and M. Brochu, Scr. Mater. 76 (2014) 53-56.
-

- 31. P. Huang, Metall. Indus. Press (1982).
- 32. E. Olevsky and L. Froyen, Scr. Mater. 55[12] (2006) 1175-1178.
-

 This Article
-
2024; 25(6): 964-974
Published on Dec 31, 2024
- 10.36410/jcpr.2024.25.6.964
- Received on Jun 27, 2024
- Revised on Jul 24, 2024
- Accepted on Sep 5, 2024
 Services
- Abstract
introduction
experimental procedure
results
discussion
conclusion
- Acknowledgements
- Data availability statement
- References
- Full Text PDF
Shared
 Correspondence to
- Siyao Xie and Yafei Pan
-
School of Materials Science and Engineering, Hefei University of Technology, Hefei, Anhui 230009, PR China
Tel : +86 0551- 62901362 Fax: +86 0551- 62901362 - E-mail: xiesiyao@hfut.edu.cn, pan2018@hfut.edu.cn


 Copyright 2019 International Orgranization for Ceramic Processing. All rights reserved.