- Experimental study of the mode II fracture toughness of frozen silty clay
Weihang Huaa, Huimei Zhangb, Yongtao Wangc,*, Zengle Lia and Shiguan Chena
aCollege of Architecture and Civil Engineering, Xi'an University of Science and Technology, Xi'an 710054, China
bDepartment of Mechanics, Xi'an University of Science and Technology, Xi'an 710054, China
cTransportation Institute of Inner Mongolia University, Hohhot 010070, ChinaThis article is an open access article distributed under the terms of the Creative Commons Attribution Non-Commercial License (http://creativecommons.org/licenses/by-nc/4.0) which permits unrestricted non-commercial use, distribution, and reproduction in any medium, provided the original work is properly cited.
The mode II fracture toughness of a frozen silty clay was investigated as a function of the temperature and water content by performing a series of asymmetric four-point bending tests on pre-notched beam specimens with different temperatures and water contents. The specimens were prepared using a specially designed procedure, and the displacement of each specimen surface was observed using digital image correlation. The fracture mechanics of the frozen soil were numerically simulated using the extended finite element method (XFEM) in the Abaqus environment. The mode II fracture toughness of the frozen silty clay increased with decreasing temperature and increasing water content. The mode II fracture toughness increased by 22.5% on average as the temperature decreased from −5 °C to −10 °C and by 8.2% on average as the temperature decreased from −10 °C to −15 °C. The fracture toughness increased by 22% on average as the water content increased from 20% to 23% and by 5.3% on average as the water content increased from 23% to 25%. For specimens with a relatively high temperature and low water content, the variation in the transverse displacement at the crack tip was larger than the variation in shear displacement. Consequently, discontinuous transverse cracks first developed at the prefabricated crack tip. The loading rod load-displacement curves obtained from numerical simulation were consistent with those obtained from physical testing, confirming the applicability of XFEM for simulating the mode II fracture toughness and crack propagation in frozen soils. Our results provide new ideas for the design and construction of engineering structures in cold regions. The results also provide a theoretical reference for the numerical simulation of the mode II fracture process of frozen soils.
Keywords: Frozen silty clay, Mode II fracture toughness, Digital image correlation, Extended finite element method.
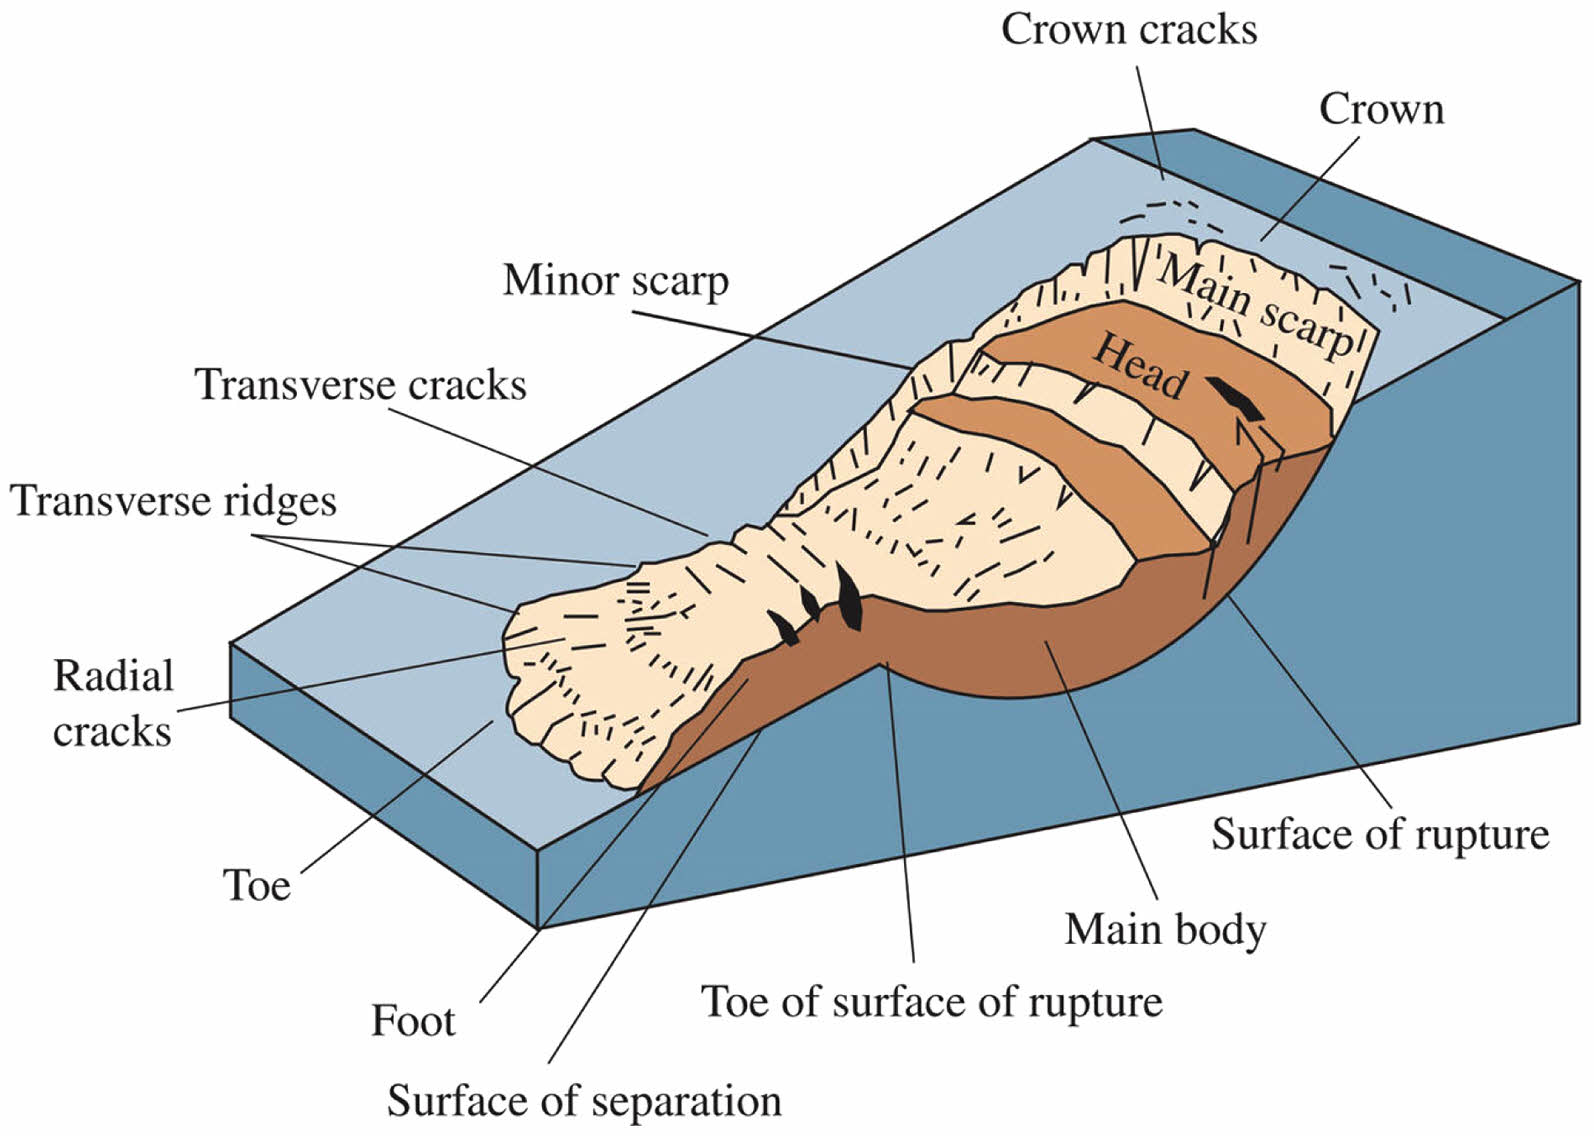
The engineering of earthworks in cold regions usually involves the construction of artificial slopes, especially in rugged terrain. As the environmental conditions change, artificial and natural slopes may become unstable and slip or collapse [1-3]. In cold regions, serious slope instability will lead to severe geohazards and jeopardize the safety of public properties. The stability of soil slopes is influenced by numerous intricate factors, and some scholars argue that the presence of cracks constitutes one such factor [4-6]. Before the onset of instability and failure, the slope surface or crest has usually developed many cracks [7], which reduce the slope stability and, when interconnected, ultimately lead to slope failure (Fig. 1 [8]). Owing to the complex stress and temperature environment, frozen soils in cold regions are jeopardized by massive microcracks. These initial microcracks propagate under the effects of external load and freeze-thaw cycles, reducing the bearing capacity of the soil and leading to fracture failure. Crack propagation also facilitates water seepage, leading to saturation and a rapid increase in pore-water pressure within previously unsaturated soil [9]. This process contributes to progressive erosion of the soil and exacerbates the impacts of freeze-thaw cycles. Skempton et al. [10] applied the theory of fracture mechanics to the study of the instability mechanism of hard cohesive soil slope with cracks for the first time, and believed that the method of fracture mechanics could well explain the instability of cohesive soil slope. In the cold slope engineering, the landslide slides along the cracking crack after its formation, which can be regarded as the type II cracking form. Therefore, it is of great significance for the study of slope stability in cold region to carry out the permafrost II fracture toughness test in this paper.
Cracks in soils have been extensively studied since the 1990s. Vallejo [11] studied the problem of cracks in stiff clay from London and posited that preexisting cracks affect the stability of clay slopes. Through a direct shear test, he also found that preexisting cracks began to propagate when the tensile stress at the crack tip reached or exceeded the ultimate tensile stress of the soil. Based on a study of clay slope failure, Skempton [12] proposed that the rate of softening in stiff, fissured clays was a function of time.
In a study of soil fracture toughness based on compact tension specimens, Lee et al. [13] tested the release rate of critical strain energy in a compacted clay under mode I crack propagation and observed the cracks in the specimens under a magnifier. However, only external cracks were observable under the magnifier (internal cracks were not observable), and the observable external cracks were limited by the scope of the magnifier. Eung-Seon Kim et al. [14] mixed mode I and mode II fracture toughness values of five grades of nuclear graphites were measured at room temperature using a centrally notched disk specimen, and concluded that the coke type and particle size had no effect on the ratio of KIIc to KIc. Li and Liu [15] experimentally investigated the behavior of pure frozen soil and the frozen soil–concrete interface, including the effects of temperature and water content on mode II fracture toughness, through asymmetric four-point bending tests. They found that the fracture toughness of the pure soil and interface exhibited similar responses to variations in temperature and water content but were not significantly affected by the loading rate. Therefore, it is considered that the type II fracture toughness of frozen soil is mainly controlled by temperature and water content. Konrad and Cummings [16] investigated the fracture behaviors of a frozen crushed-stone base and frozen sand subbase in a pavement structure using compact tension specimens. The fracture toughness of the frozen crushed stone and sand both increased with increasing ice content and decreased logarithmically with decreasing average soil grain size. Halett et al. [17] improved three-point bending test was used to study the ductile sample of wet clay. The fracture characteristics of the sample were analyzed from the aspects of crack opening Angle, crack tip opening Angle and release rate of plastic properties. The strain required for crack growth increased with the increase of clay group in the sample. Yamamoto et al. [18] investigated the relationship between the fracture toughness and ice content of frozen soils from Sweden with different ice contents at temperatures below 0°C using an acoustic emission technique and bending tests. The frozen soils were more prone to crack initiation and propagation as the volumetric ice content decreased. Wang et al. [19] conducted shear tests to determine the KIIc values of clay mixed with different contents of sand. The maximum KIIc value was observed at a sand content of approximately 30% and was 192% higher than that of pure clay. Therefore, the main factors affecting the strength of soil at room temperature are moisture content and dry density and whether other substances are mixed. Zhang et al. [20] investigated the mode I and II fracture behaviors of compacted tailing soil through asymmetric semi-circular bending (ASCB) tests. As the span increased, the mode I component of fracture toughness increased, whereas the opposite trend was observed for the mode II component. In summary, most reported studies have focused on the mode I fracture toughness of soils, with relatively few studies conducted on mode II fracture toughness. In addition, most studies on the fracture toughness of soil focus on normal temperature soil, and there are few studies on the special soil of multi-phase composite frozen soil, and image technology is not applied to visually observe the microscopic changes of frozen soil during the fracture process. Therefore, in this study, we investigated the mode II fracture toughness of a frozen soil through a combination of digital image correlation (DIC) analysis and numerical simulation of the soil fracture process.
|
Fig. 1 Cracks in a sloped surface [8]. |
Material
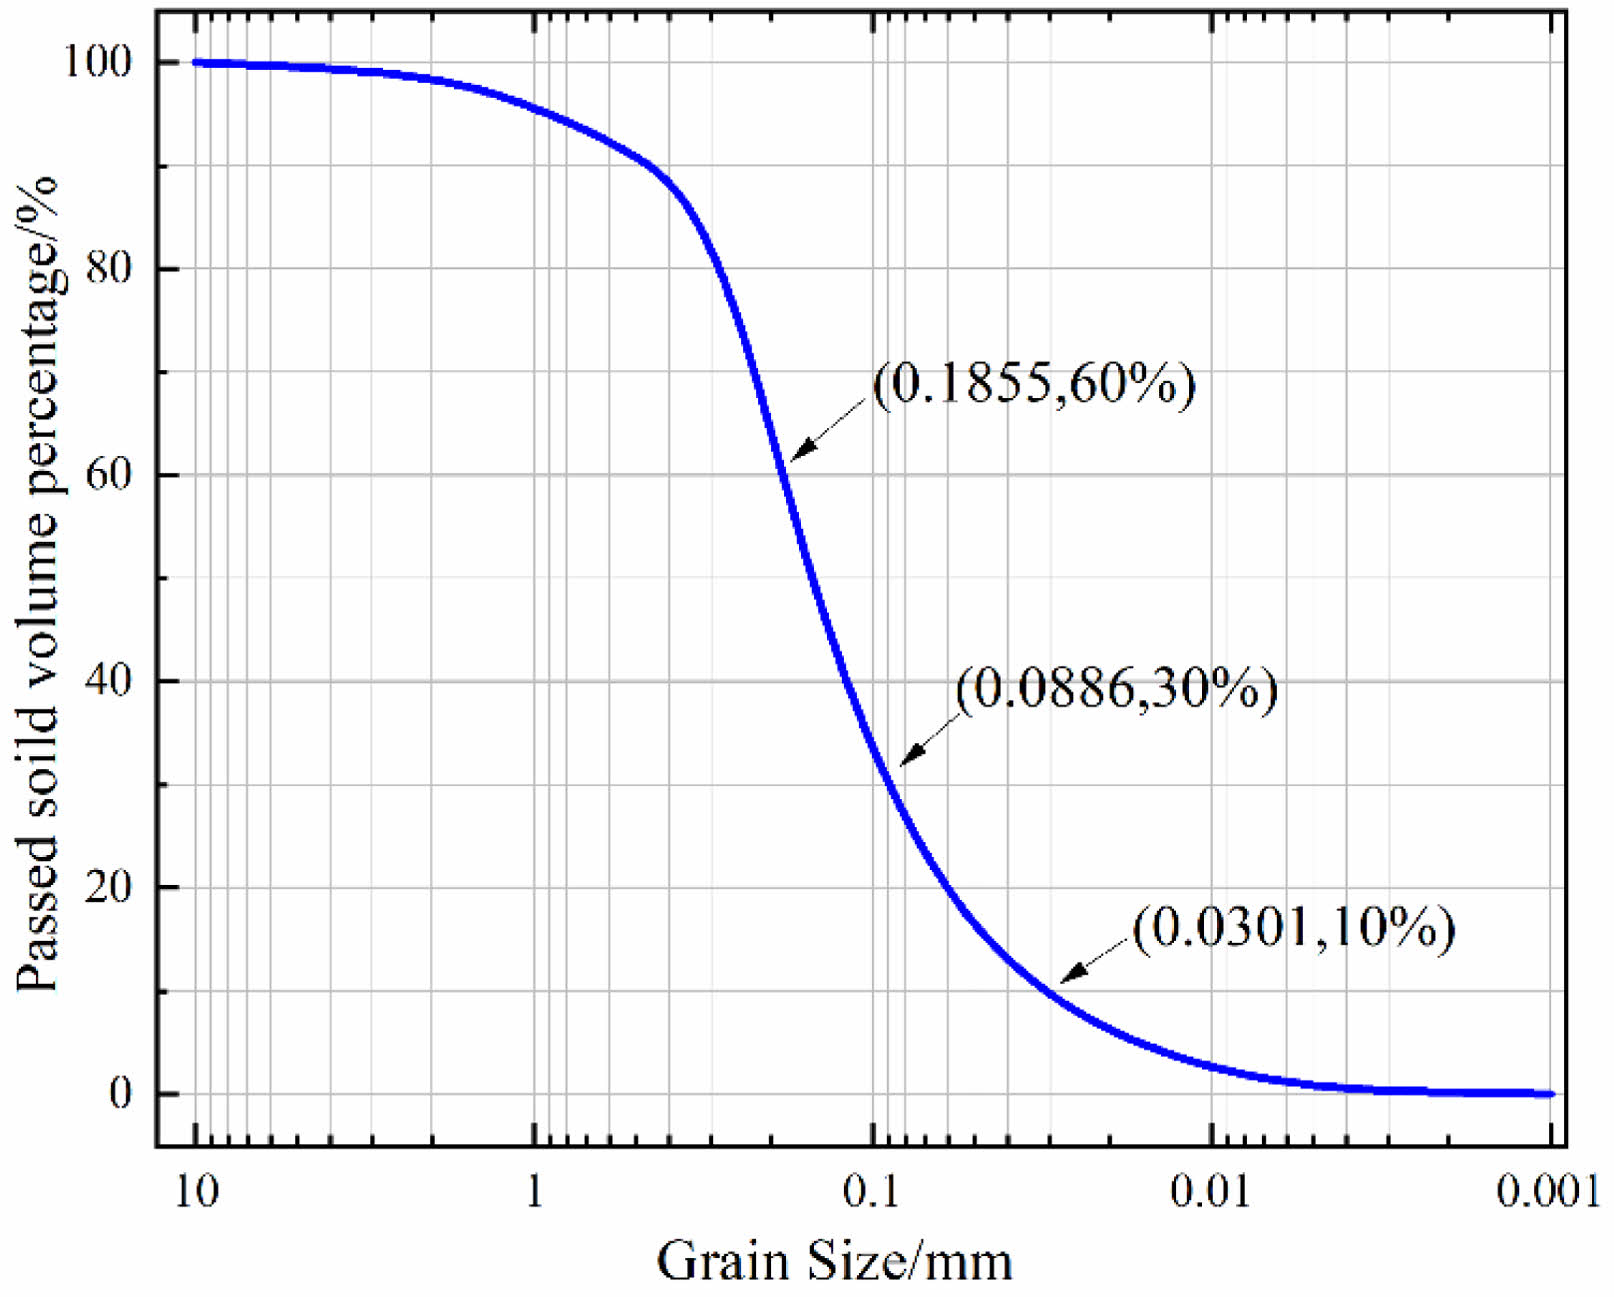
A frost-susceptible silty clay from Genhe City, Inner Mongolia Autonomous Region, China, was selected for study. As shown in Fig. 2, the grain size distribution characteristics were as follows: effective grain size d10 = 0.0301 mm, average grain size d30 = 0.0886 mm, and control grain size d60 = 0.1855 mm. The basic physical properties of the soil are presented in Table 1 [21]. The coefficient of curvature of the soil was calculated to be (d30×d30/(d60×d10)) = 1.41. Using a combined liquid and plastic limit testing device, the liquid and plastic limits of the soil were determined to be 31.45% and 19.45%, respectively. According to the Chinese standard for geotechnical test methods, this soil was designated as a silty clay.
Sample preparation equipment
The fracture test usually takes concrete, rock, asphalt and other composite materials as the main test object, and the cracks are often formed by secondary processing after the specimen is poured. For the special multiphase composite material of frozen soil, its strength is much lower than that of concrete and rock due to the existence of space between soil particles. Therefore, secondary processing of the sample after it is completed will cause serious damage to the sample itself and reduce the accuracy of the test results. In order to further improve the accuracy and reliability of the test, after full investigation and testing, we invented a sample preparation device for bending test of frozen soil under low temperature test conditions, and the specimen can directly form a straight and smooth initial crack after freezing and stripping.
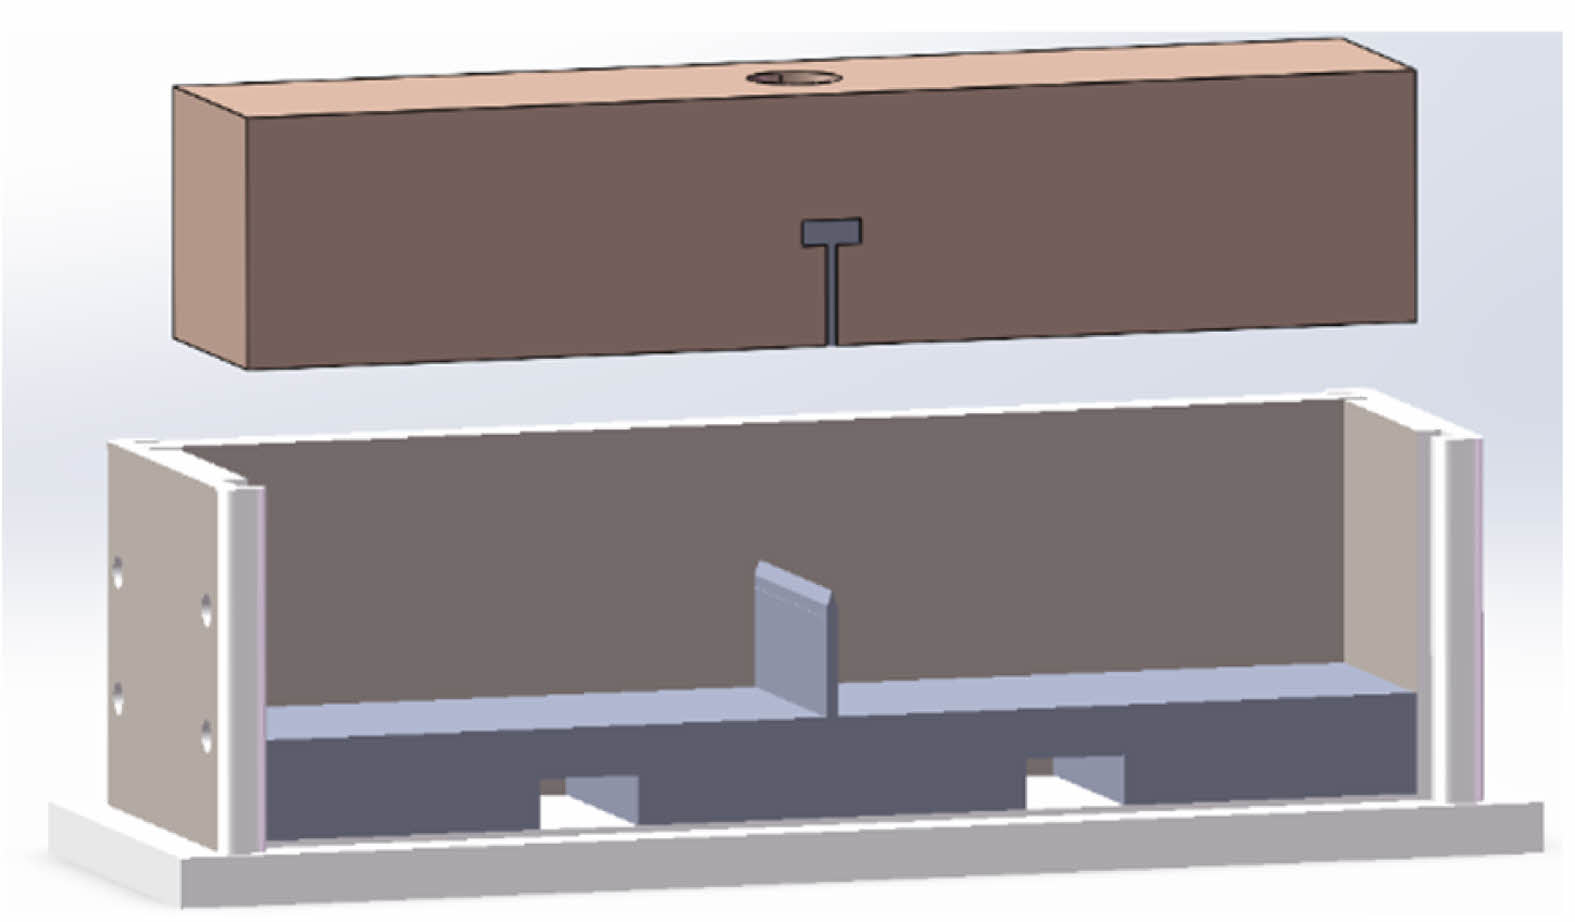
The whole device is composed of two parts, as shown in Figure 3: pressure plate and soil loading mold. The mold is composed of a bottom plate, four side plates, and a knife plate for preforming cracks. The bottom plate adopts hollow-shaped design, and the contact position with the side plate and the knife plate is reserved downward 5mm for side plate and blade insertion. The side plates are connected with M6 hex bolts to prevent both sides of the left and right plates of the mold from falling off due to soil heave during the freezing process when soil samples are placed.
Sample preparation process
Several methods have been proposed for testing the shear fracture failure of brittle materials such as hard rock, ceramics, and concrete, including anti-symmetric four-point bending [22]; symmetric diagonal-crack semi-circular bending [23]; asymmetric semi-circular bending [24-26]; and short-beam shear fracture [27]. The semi-circular bending method involves complex loading and difficult specimen preparation. Therefore, the asymmetric four-point bending method was adopted in this study. The test specimens were prepared as follows.
(1) A sample of clay was ground with a grinder and screened with a 2-mm sieve. The screened clay was placed in an oven at 105° for 24 h and left to cool naturally to ambient temperature.
(2) Specimens with different water contents (Table 2) were prepared by mixing a mass of the soil with a mass of water calculated according to the dry density and mass of the clay. After being thoroughly mixed, the soil–water mixture was sealed in a plastic bag and left to rest at ambient temperature for 24 h. This process ensured an even moisture distribution and avoided excessive pore water pressure, which could compromise the accuracy of the test results [28, 29].
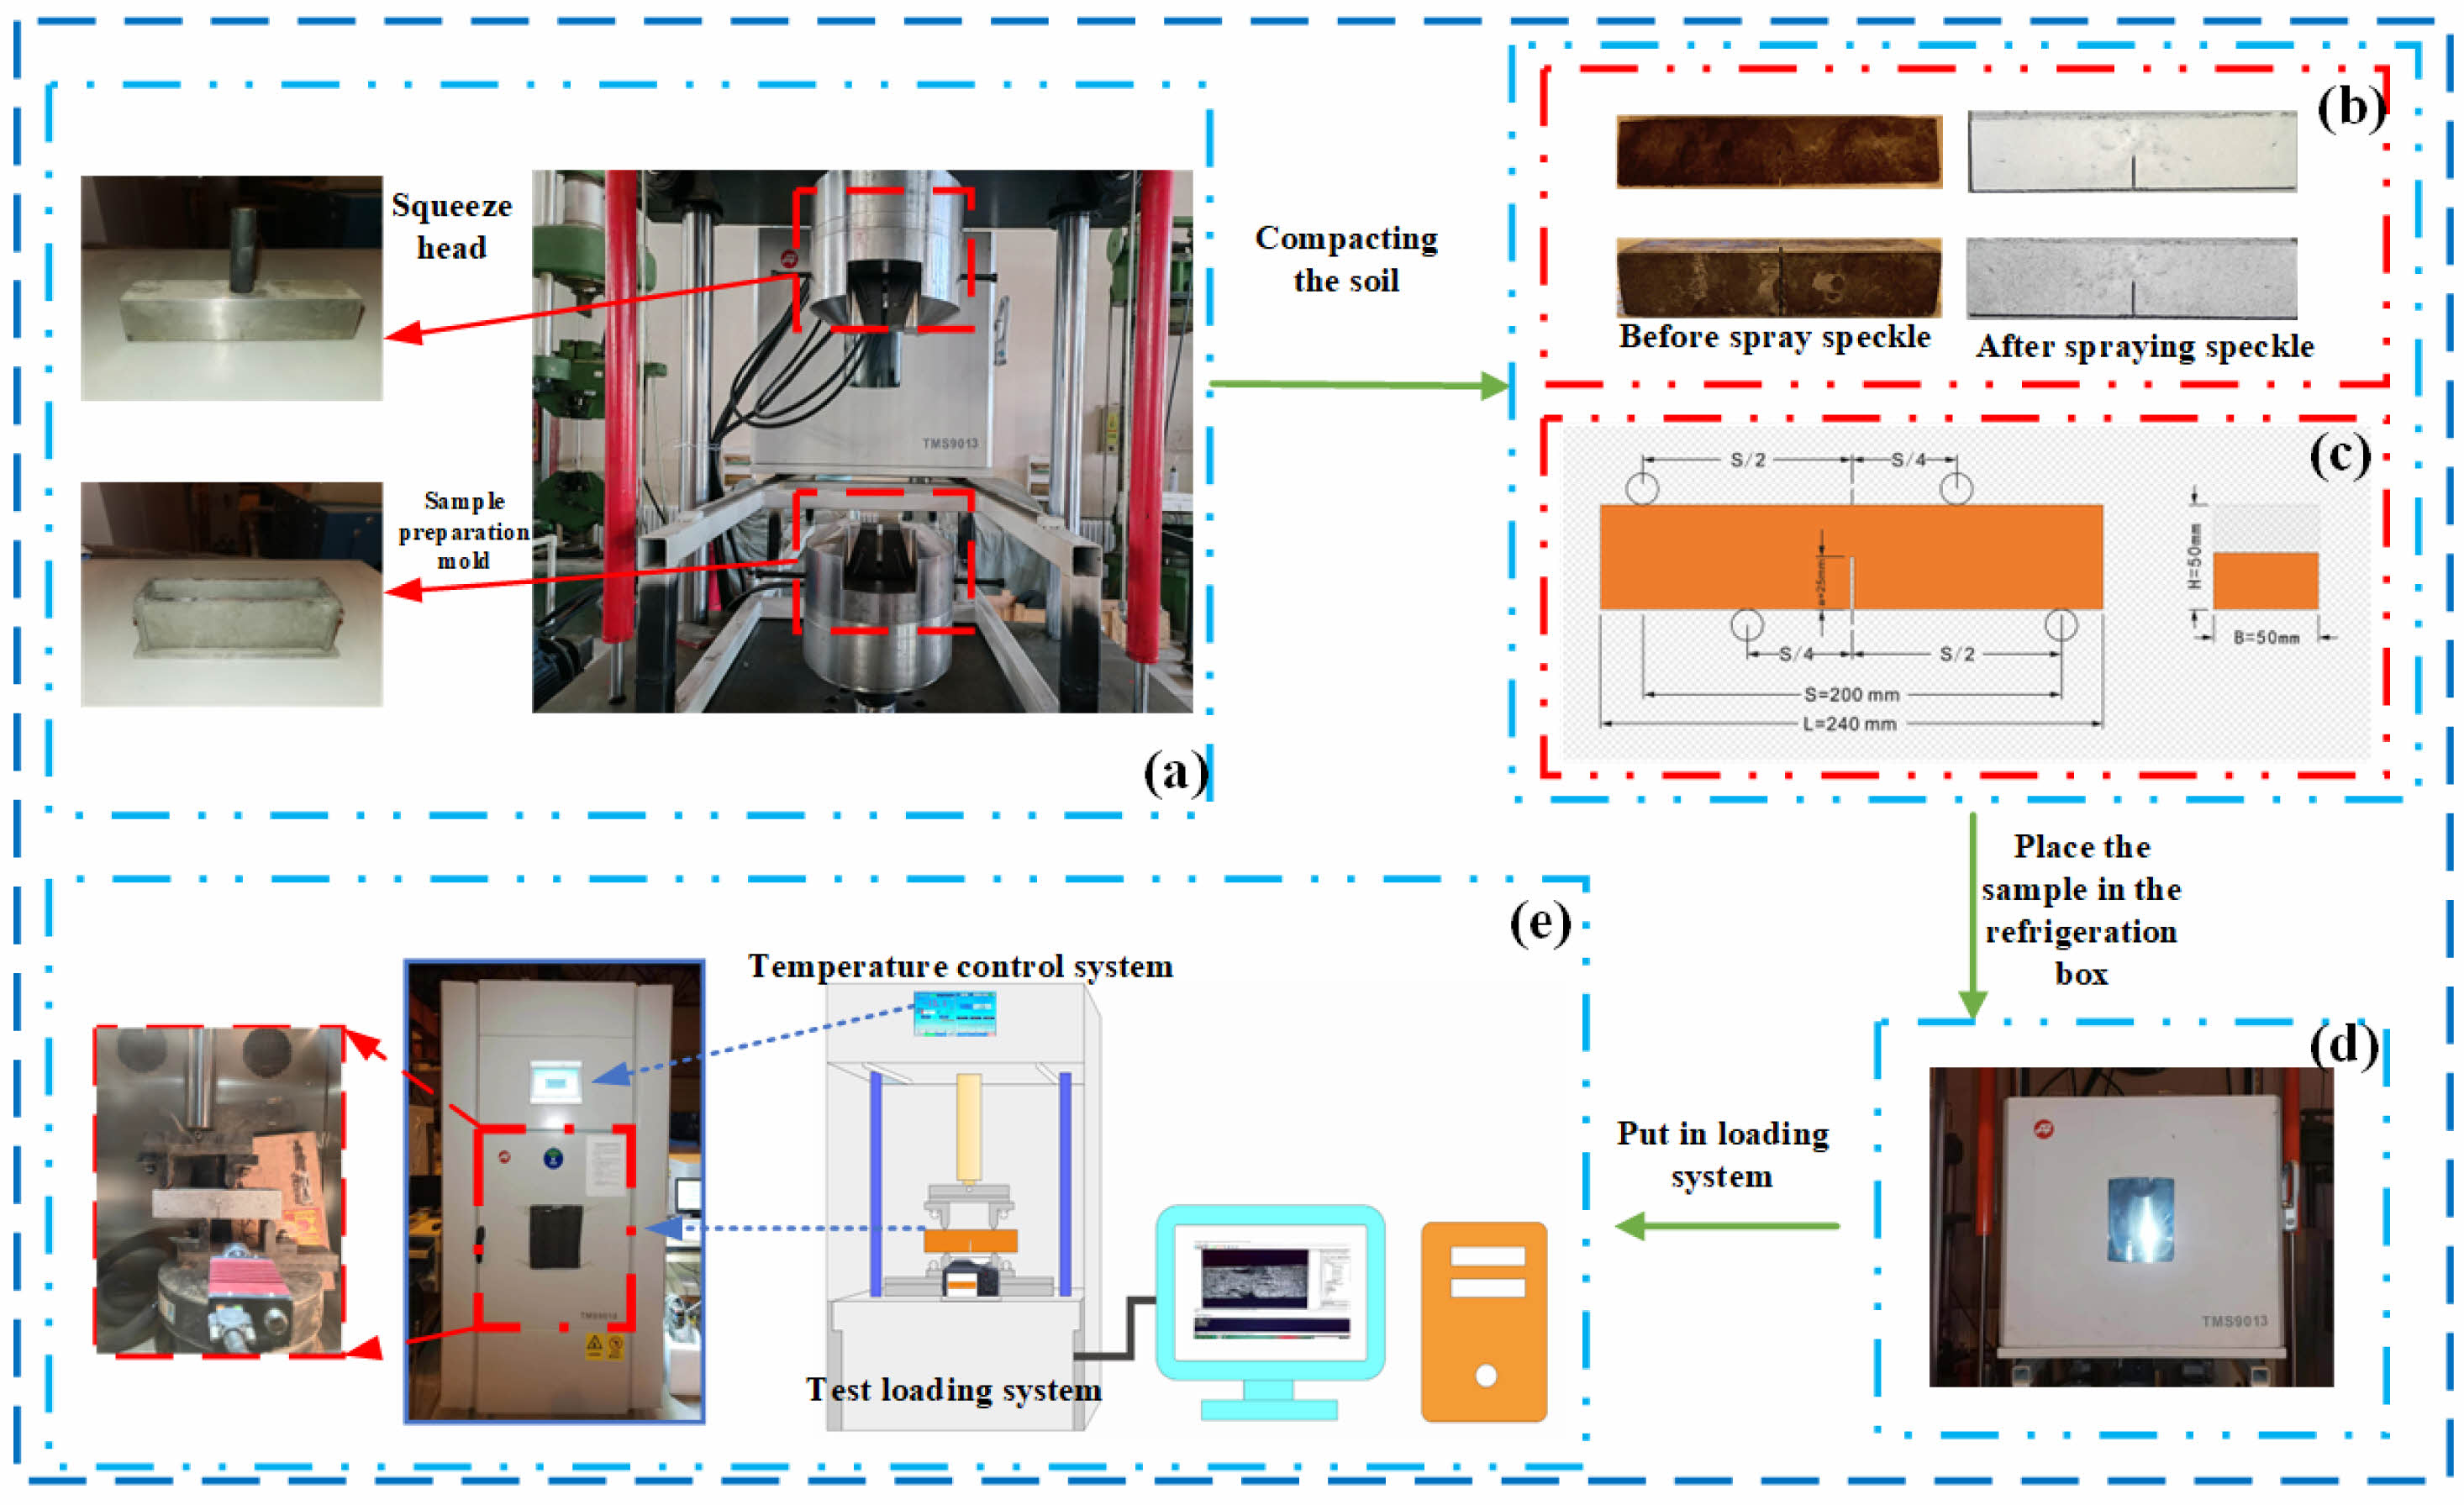
(3) The specimen was cast and compacted layer by layer, with the mass and compacted height of each layer controlled to be the same. The final specimen had dimensions of 240 × 50 × 50 mm and contained a prefabricated crack with height a = 25 mm, as shown in Fig. 4(c). The specimen prepared following the above procedure had a smooth surface and a flat, straight crack.
(4) The surface of the as-cast specimen had a coffee color and was sprayed with white paint to facilitate the imaging of the specimen surface using a CCD camera. The white paint was applied through two runs of spraying to improve the flatness of the surface and ensure adequate bonding between the paint and the surface, as shown in Fig. 4(b).
(5) Thirty minutes after the application of the white paint, the specimen was speckled by spaying with black paint. The distance between the sprayer and specimen surface was maintained at greater than 30 cm so that the applied paint appeared as random grey speckles. Subsequently, the specimen was left to rest to allow the surface paint to cure completely. Finally, the specimen was refrigerated to the preset temperature in a cryostat.
Experimental Procedure
A high-speed CCD camera and a light source were mounted in a freeze-thaw box in advance. After setting the sampling frequency of the camera to 0.5 Hz and optimizing the camera position and angle, the box was closed. The box was then set to the preset temperature and held at that temperature for 2 h. The specimen was mounted on two supports with spacing S = 200 mm in the loading system. A displacement-controlled loading scheme was adopted. The test results were recorded using a computer.
There are several points worth noting. As shown in Fig. 4(e), the loading device, labeled as a “secondary beam,” should have an adequate stiffness so that its deformation during loading very small. The four-point bending configuration used in the test did not mean that the slope is a four-point bending form during the sliding process. Rather, the configuration was intended to simulate the state of the soil subjected to shear conditions and calculate its fracture toughness KIIc under this state.
When 0.25 ≤ a/H ≤ 0.75, the following equation can be derived from the boundary collocation method [30]
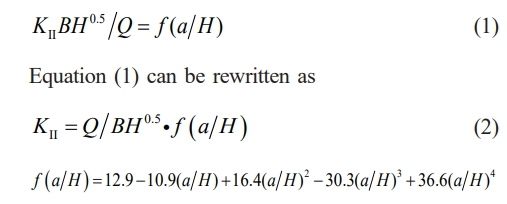
Where a is the length of the prefabricated crack (m), H is the specimen height (m), B is the specimen width (m), and Q is the shear force on the crack plane (kN).
Q is equal to P/3, where P is the failure load and can be experimentally determined. Thus, if the dimensions of the specimen are known, the KIIc value can be experimentally determined using the following representation:

|
Fig. 2 Grain size distribution of the experimental soil. |
|
Fig. 3 Three-dimensional diagram of sample preparation device. |
|
Fig. 4 Sample preparation and test process diagram, (a) sample compaction system, (b) spray speckle, (c) rectangular sample, (d) cold bath system, (e) DIC camera and mechanical test system. |
|
Table 2 Testing program parameters. |

Note. three parallel specimens under each group. |
Displacement-load Curve Analysis
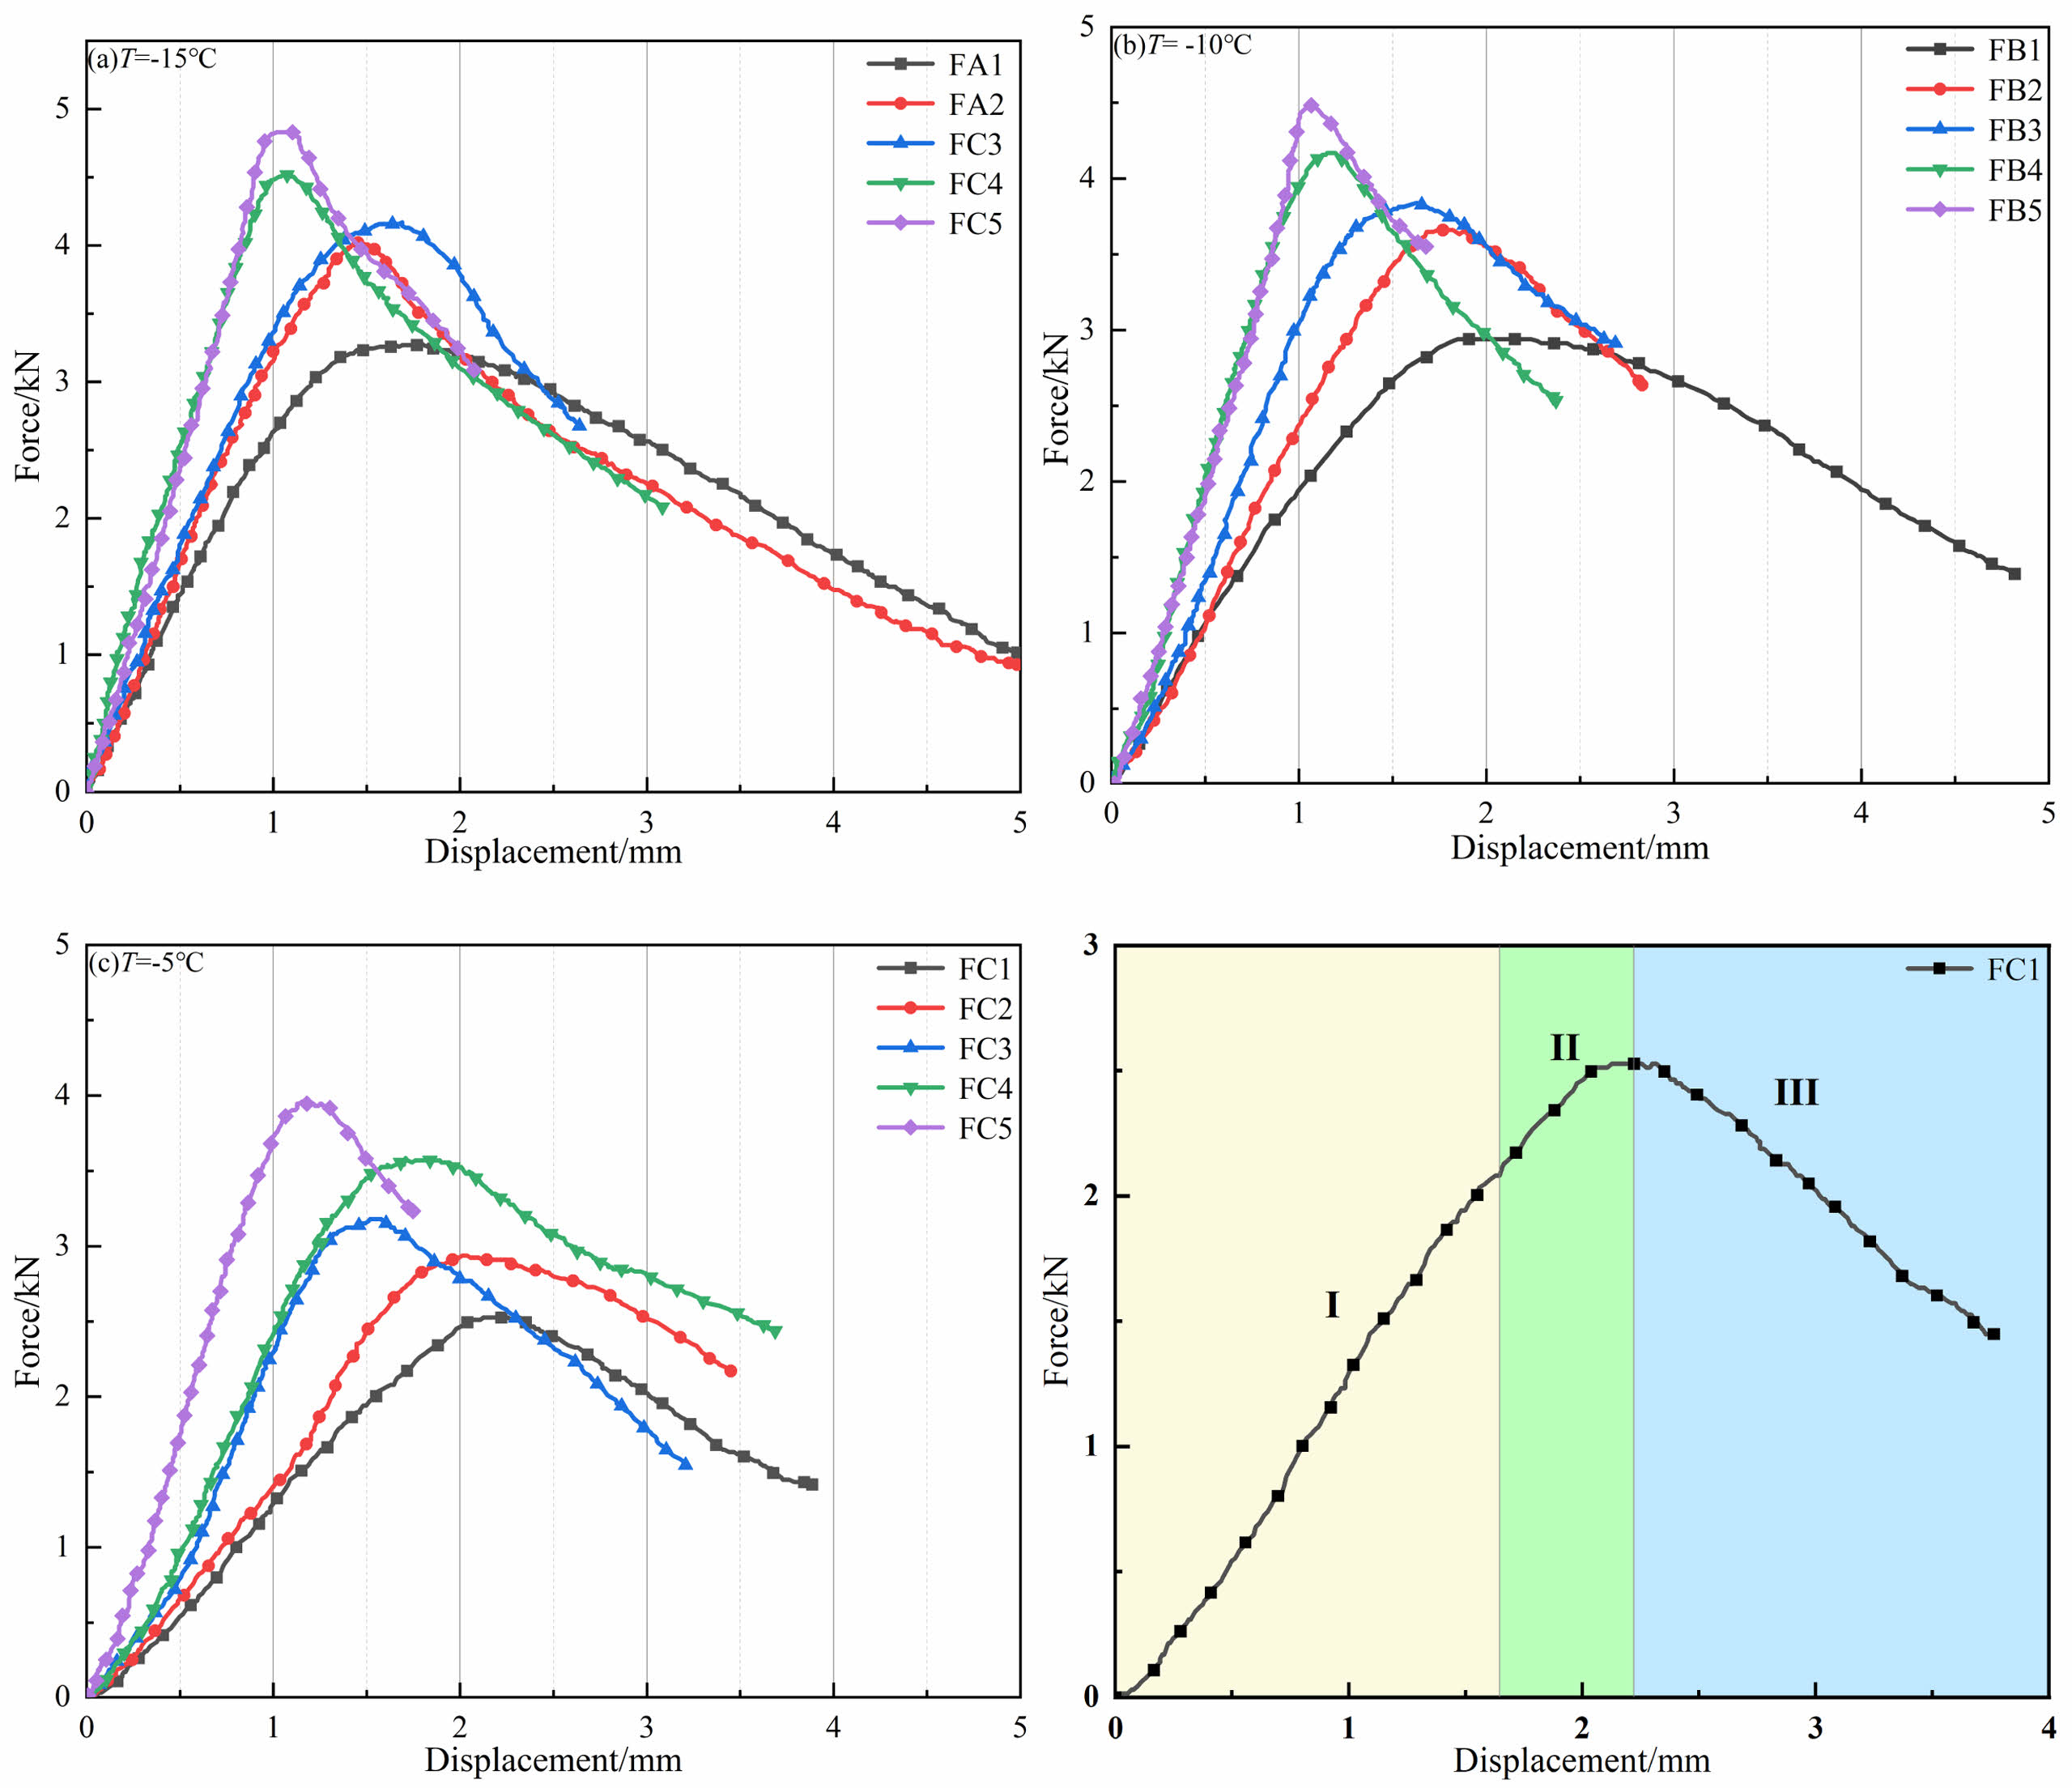
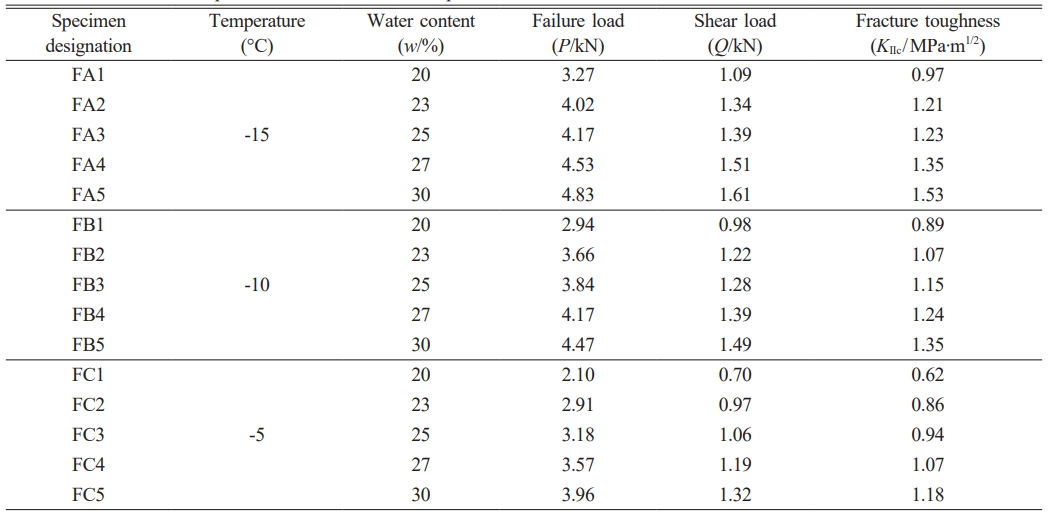
Figure 5 shows the displacement-load–load curves of the specimens subjected to four-point bending based on the data recorded by a TMS9018 static-loading freeze-thaw test system. For all the mode II fracture test specimens, the critical displacement of the loading rod did not exceed 2.2 mm. As the temperature increased, the critical load decreased, while the critical displacement increased. When the critical load was reached, the load decreased as the displacement of the loading rod increased until the specimen completely failed. In the experimental group with different water content under the same temperature condition, it can be found that the load change rate presents a rapid rise before reaching the critical load. For the specimens with water contents between 25% and 30%, the load decreased linearly shortly after reaching the critical load. For water contents < 25%, the load briefly stabilized after reaching the critical load and then decreased until the specimen completely failed. In summary, the temperature was the major factor controlling the fracture toughness of the specimens, while the water content controlled the fracture mode. Based on the displacement–load curves, the fracture process can be divided into the following three stages, take the FC3 experimental group as an example, as shown in Fig. 5(d). The test results are shown in Table 3.
(I) Elastic deformation stage: The displacement-load curve increased rapidly, and the curve in this stage was approximately straight. The load increased linearly with time. A stress concentration zone was gradually formed.
(II) Fracture surface formation stage: The maximum load was reached, and the specimen exhibited marked displacement. Microcracks developed around the prefabricated crack and propagated at certain angles.
(III) Fracture instability stage: The specimen lost stability and failed when the principal crack propagated to a certain length. The specimens with water contents > 25% failed directly, whereas those with water contents < 25% failed after stabilizing for a short period.
Effects of Water Content on Fracture Toughness
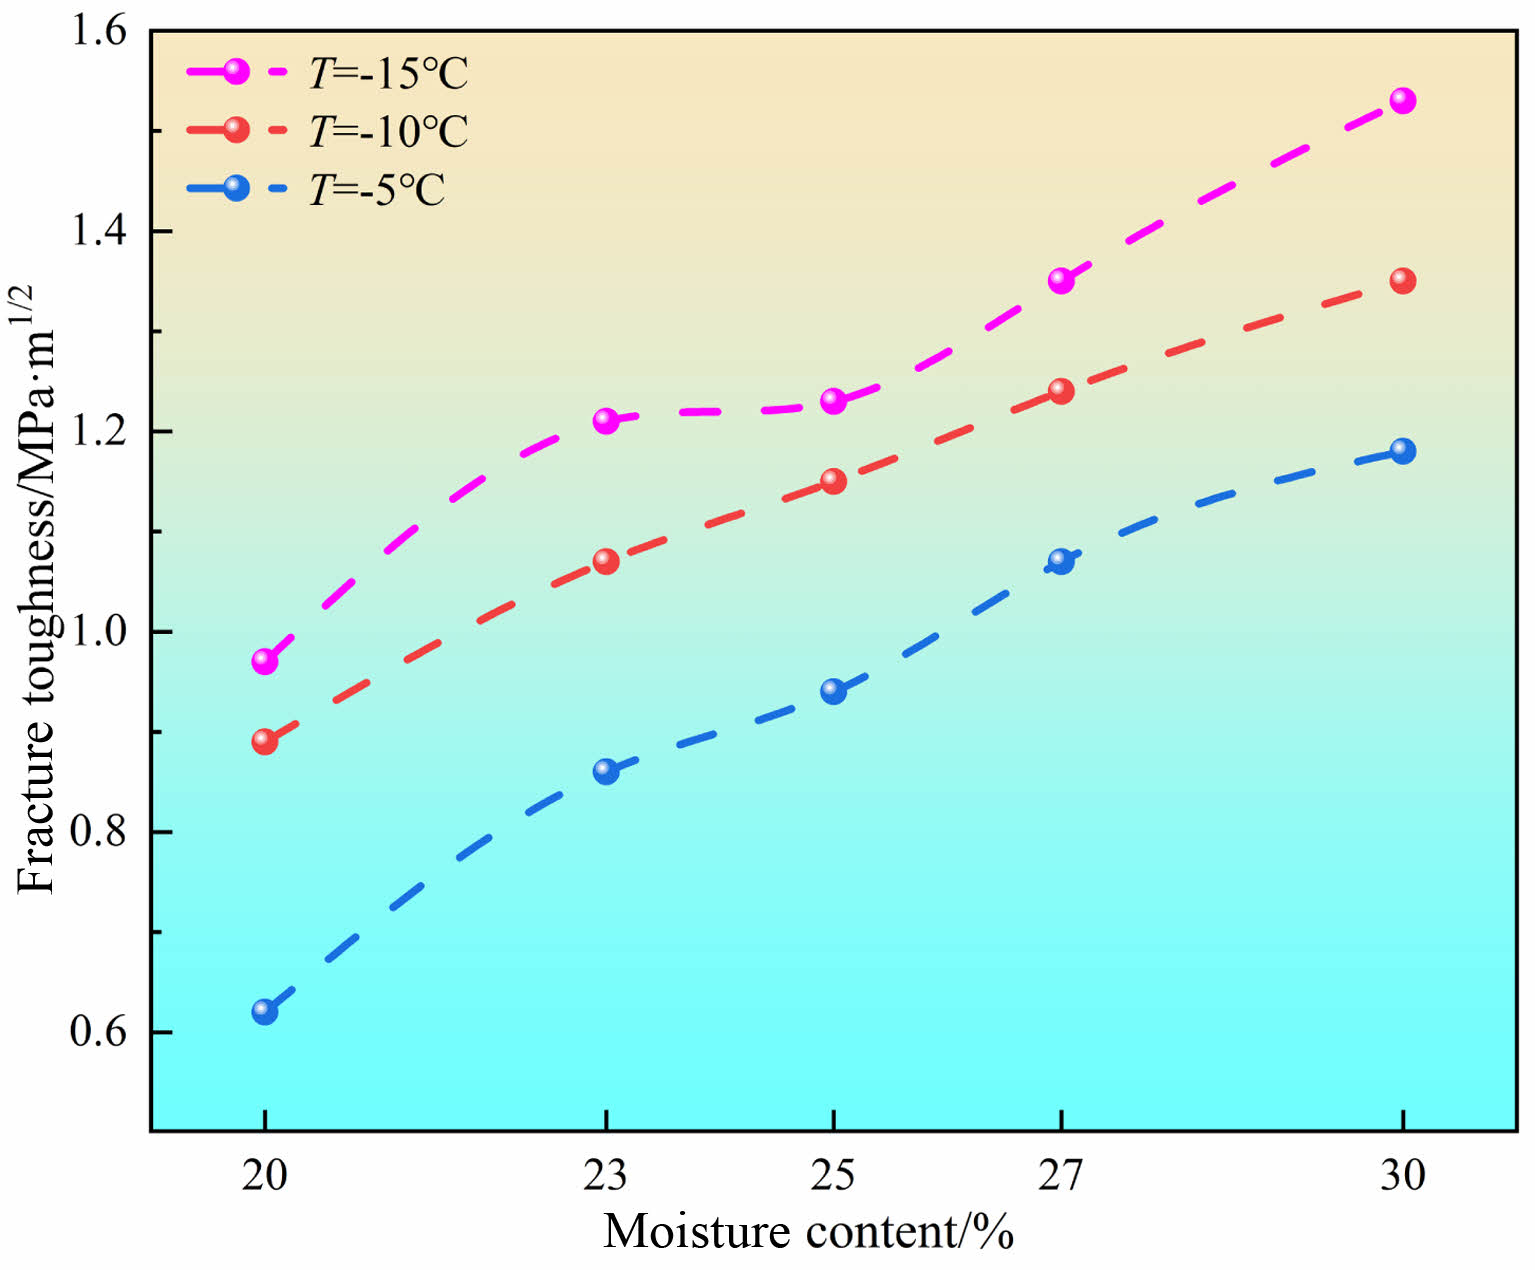
Figure 6 shows the curves of KIIc vs. water content at different temperatures. For a given temperature, KIIc increased as the water content increased; KIIc increased slowly as the water content increased from 23% to 25% and increased rapidly as the water content increased beyond 25%. For a given water content, the average fracture toughness increased by 22.5% as the temperature decreased from −5 °C to −10 °C and by 8.2% as the temperature decreased from −10 °C to −15 °C. In other words, the fracture toughness increased rapidly at the temperature decreased from −5 °C to −10°C and increased at a lower rate as the temperature decreased further to −15 °C. The following inference can be drawn from this finding. There exists an “optimal” water content outside the tested range of water contents at which the mode II fracture toughness is maximized.
For a given temperature, as the water content increased, the mode II fracture toughness first increased, then stabilized to a certain extent (the fracture toughness increased at a slower rate), and then continued to increase. This can be explained by the following mechanism. At freezing temperatures, as the water content increases, the cohesion and angle of friction of the soil increase. Specifically, as the inter-particle water content increases, the content of pore ice increases, and the pore ice exerts a cementing effect. Consequently, the matrix suction between soil particles increases, thereby enhancing cohesion. Second, as the water phase changes to ice, the friction and interlocking forces between soil particles increase, thereby increasing the angle of internal friction and the fracture toughness.
Effects of Temperature on Fracture Toughness
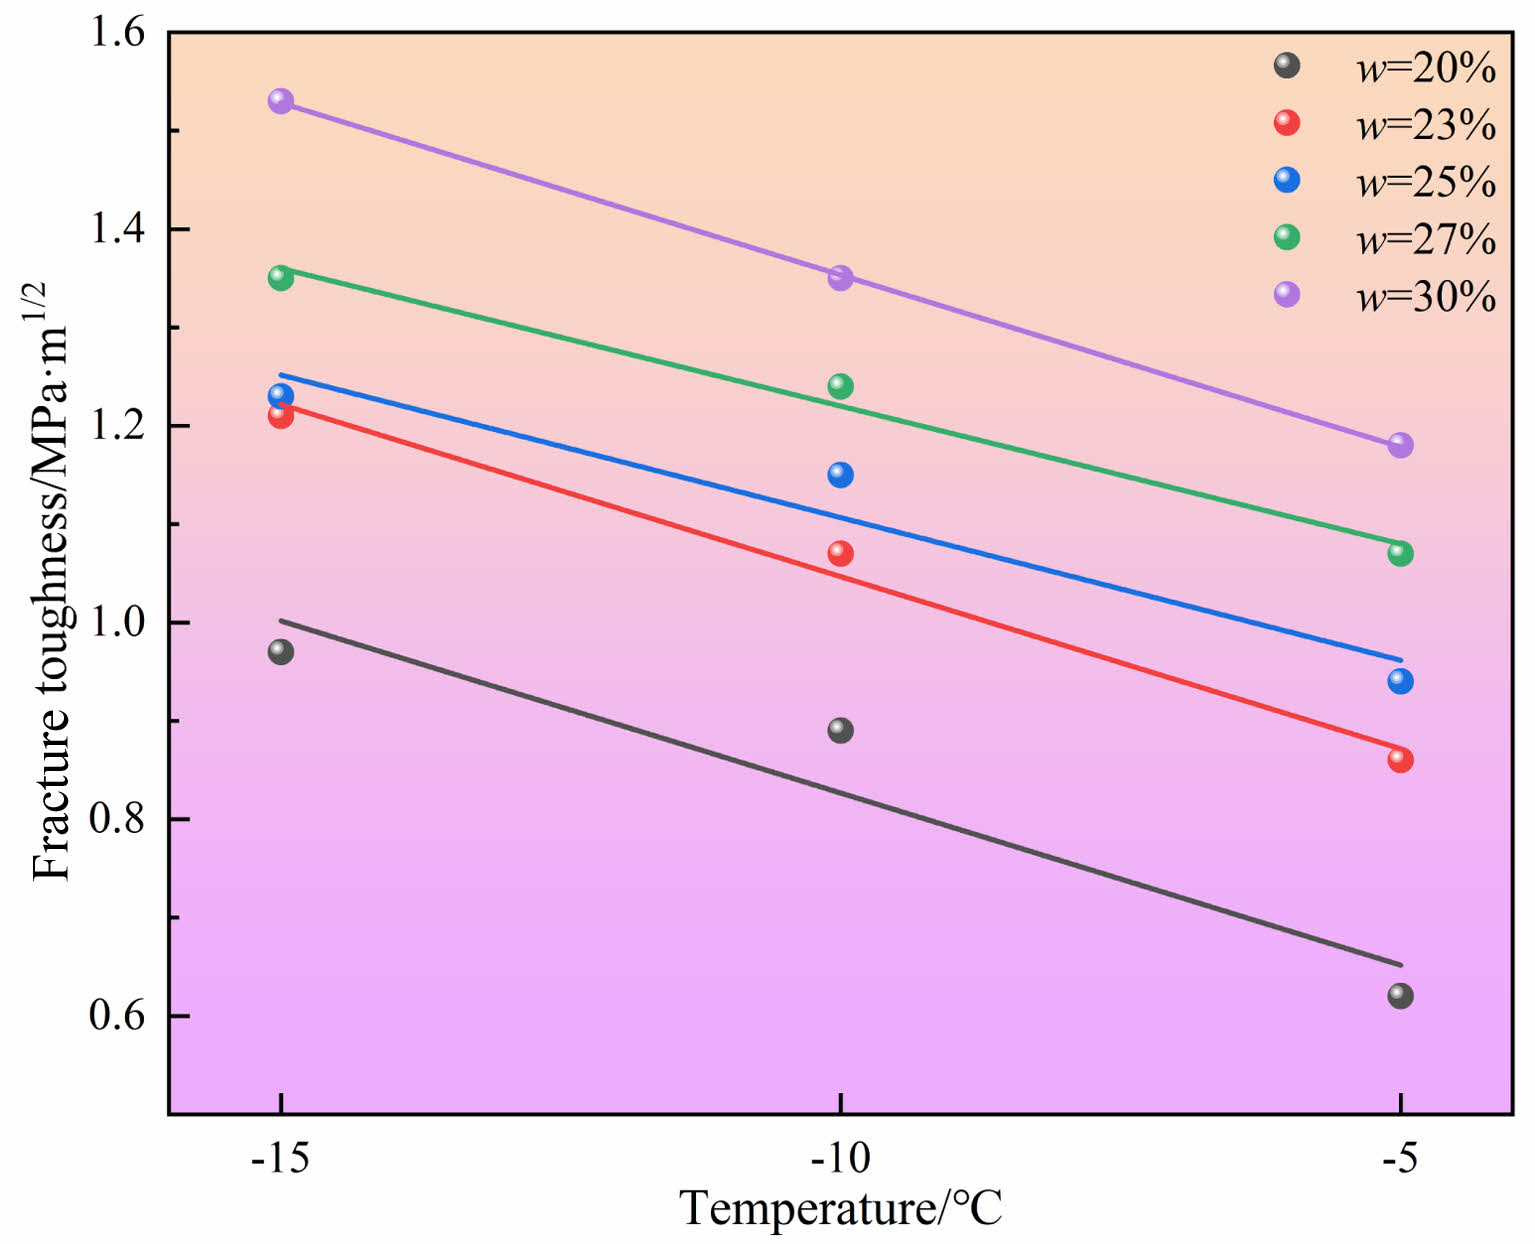
Figure 7 shows the temperature–fracture toughness curves at different water contents. The curves show a linear relationship between the temperature and fracture toughness. As the temperature increased, the fracture toughness decreased. At temperatures of −15 °C, −10 °C, and −5 °C, the fracture toughness decreased by 19.1%, 19.3%, and 27.6%, respectively, as the water content decreased from 23% to 20%; the fracture toughness decreased by 3.2%, 8.4%, and 4.4%, respectively, as the water content decreased from 25% to 23%. Thus, the fracture toughness varied insignificantly as the water content varied between 25% and 30%. In other words, the fracture toughness increased rapidly (by 22% on average) when the water content increased from 20% to 23%, increased slowly (by 5.3% on average) when the water content increased from 23% to 25% and generally stabilized when the water content increased above 25%.
For a given water content, the mode II fracture toughness of the frozen soil decreased with increasing temperature. This can be explained by the following mechanism. First, as the temperature increases, the ice phase in the soil partially changes to water, thereby decreasing the fracture toughness. Second, mode II fracture is a shear mode of failure that is controlled by variations in the cohesion and angle of internal friction. For a given matrix suction, as the temperature increases, the content of unfrozen water increases; this means that for a given volumetric water content, the volumetric ice content decreases, thereby weakening the cementing effect of ice in the soil particles. Consequently, the cohesion of the frozen soil, the shear strength of the soil, and the fracture toughness are all decreased.
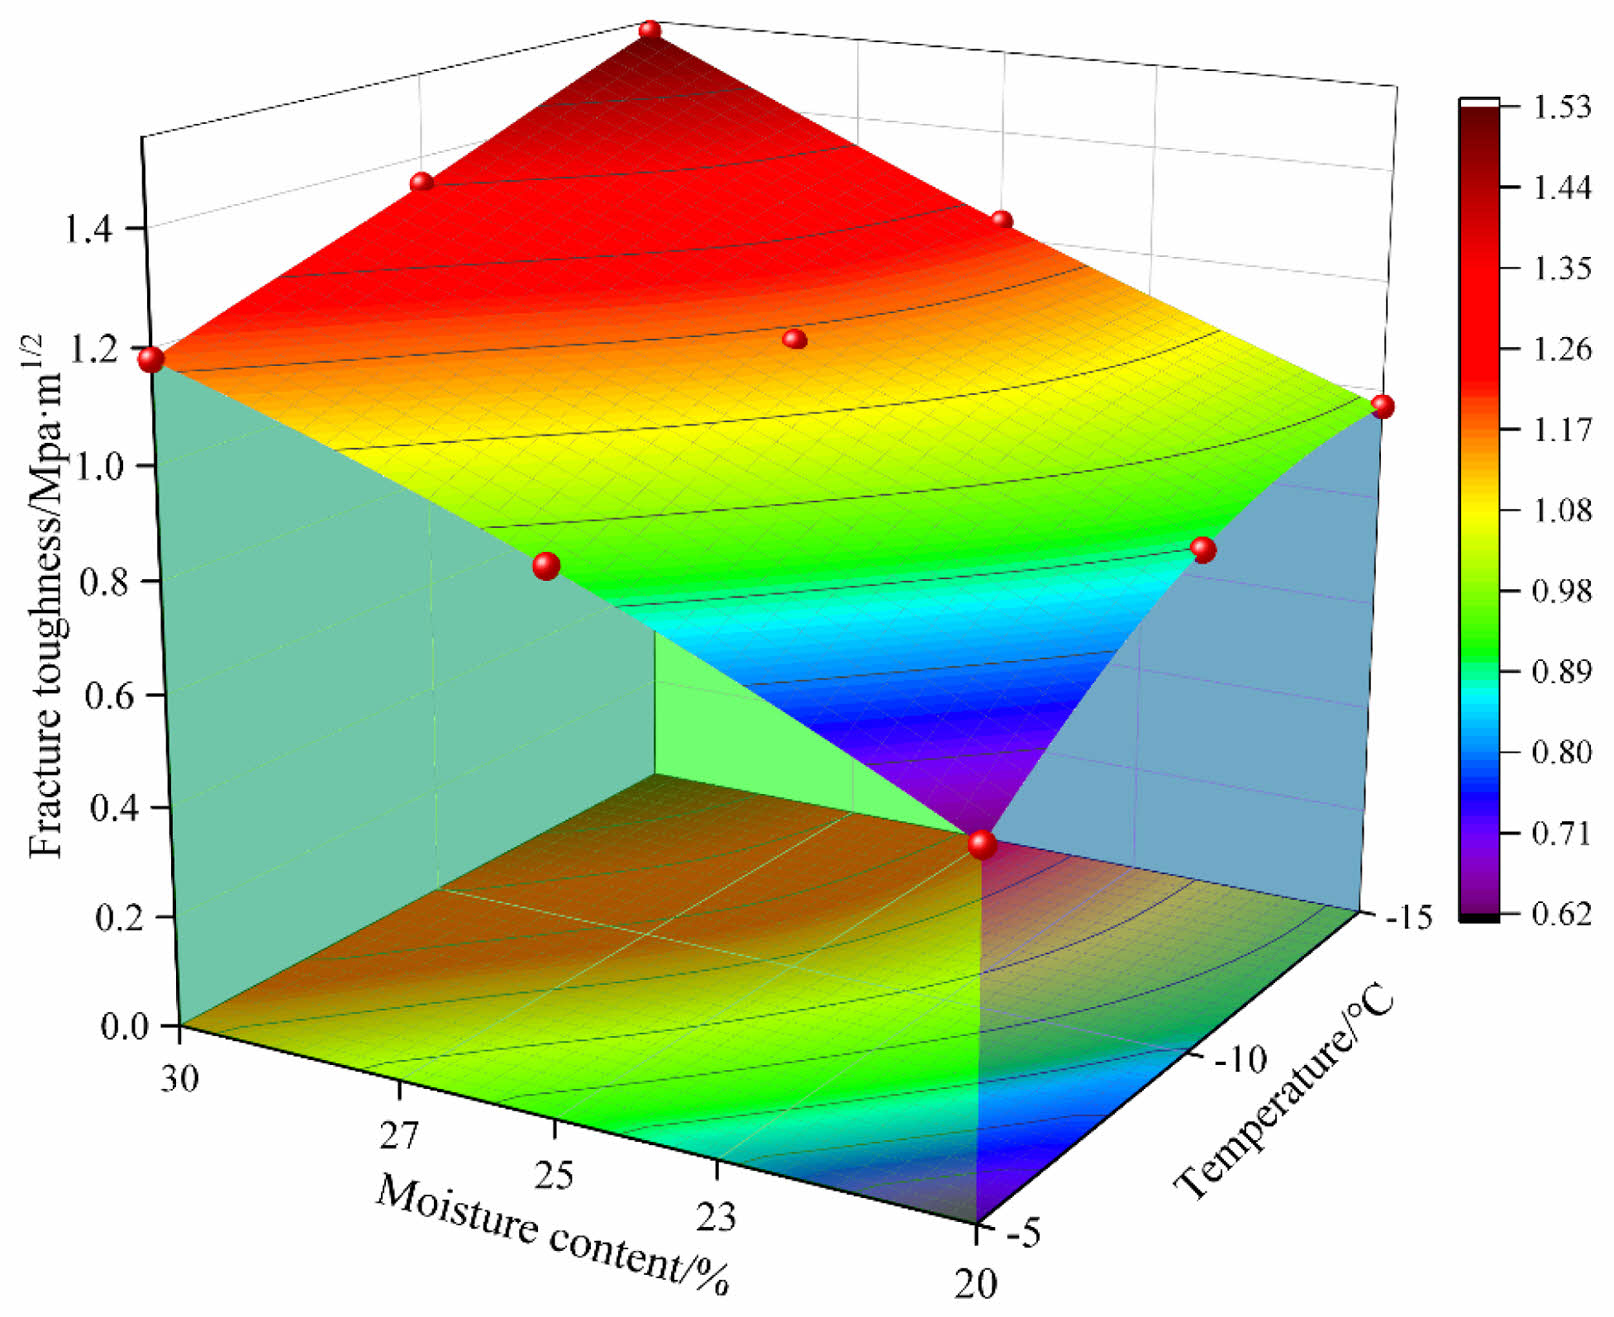
Based on the above analysis and the results shown in Figs. 6 and 7, the fracture toughness had a strong linear relationship with temperature and a logarithm relationship with water content. Therefore, we assumed that the relationship between fracture toughness and temperature and water content could be represented as:

where A, B, C, and D are fitting parameters. By fitting test data using Eq. (4), the relationship between the temperature, water content, and mode II fracture toughness can be represented as:

Figure 8 shows the fitting plane of Eq. (5), in which the fracture toughness increases with increasing water content or decreasing temperature. The fracture toughness increases slowly as the water content increases from 23% to 25%. The rate of increase in fracture toughness with increasing water content is maximized at the temperature of −15 °C.
Specimen Fracture Process under Mode II Loading
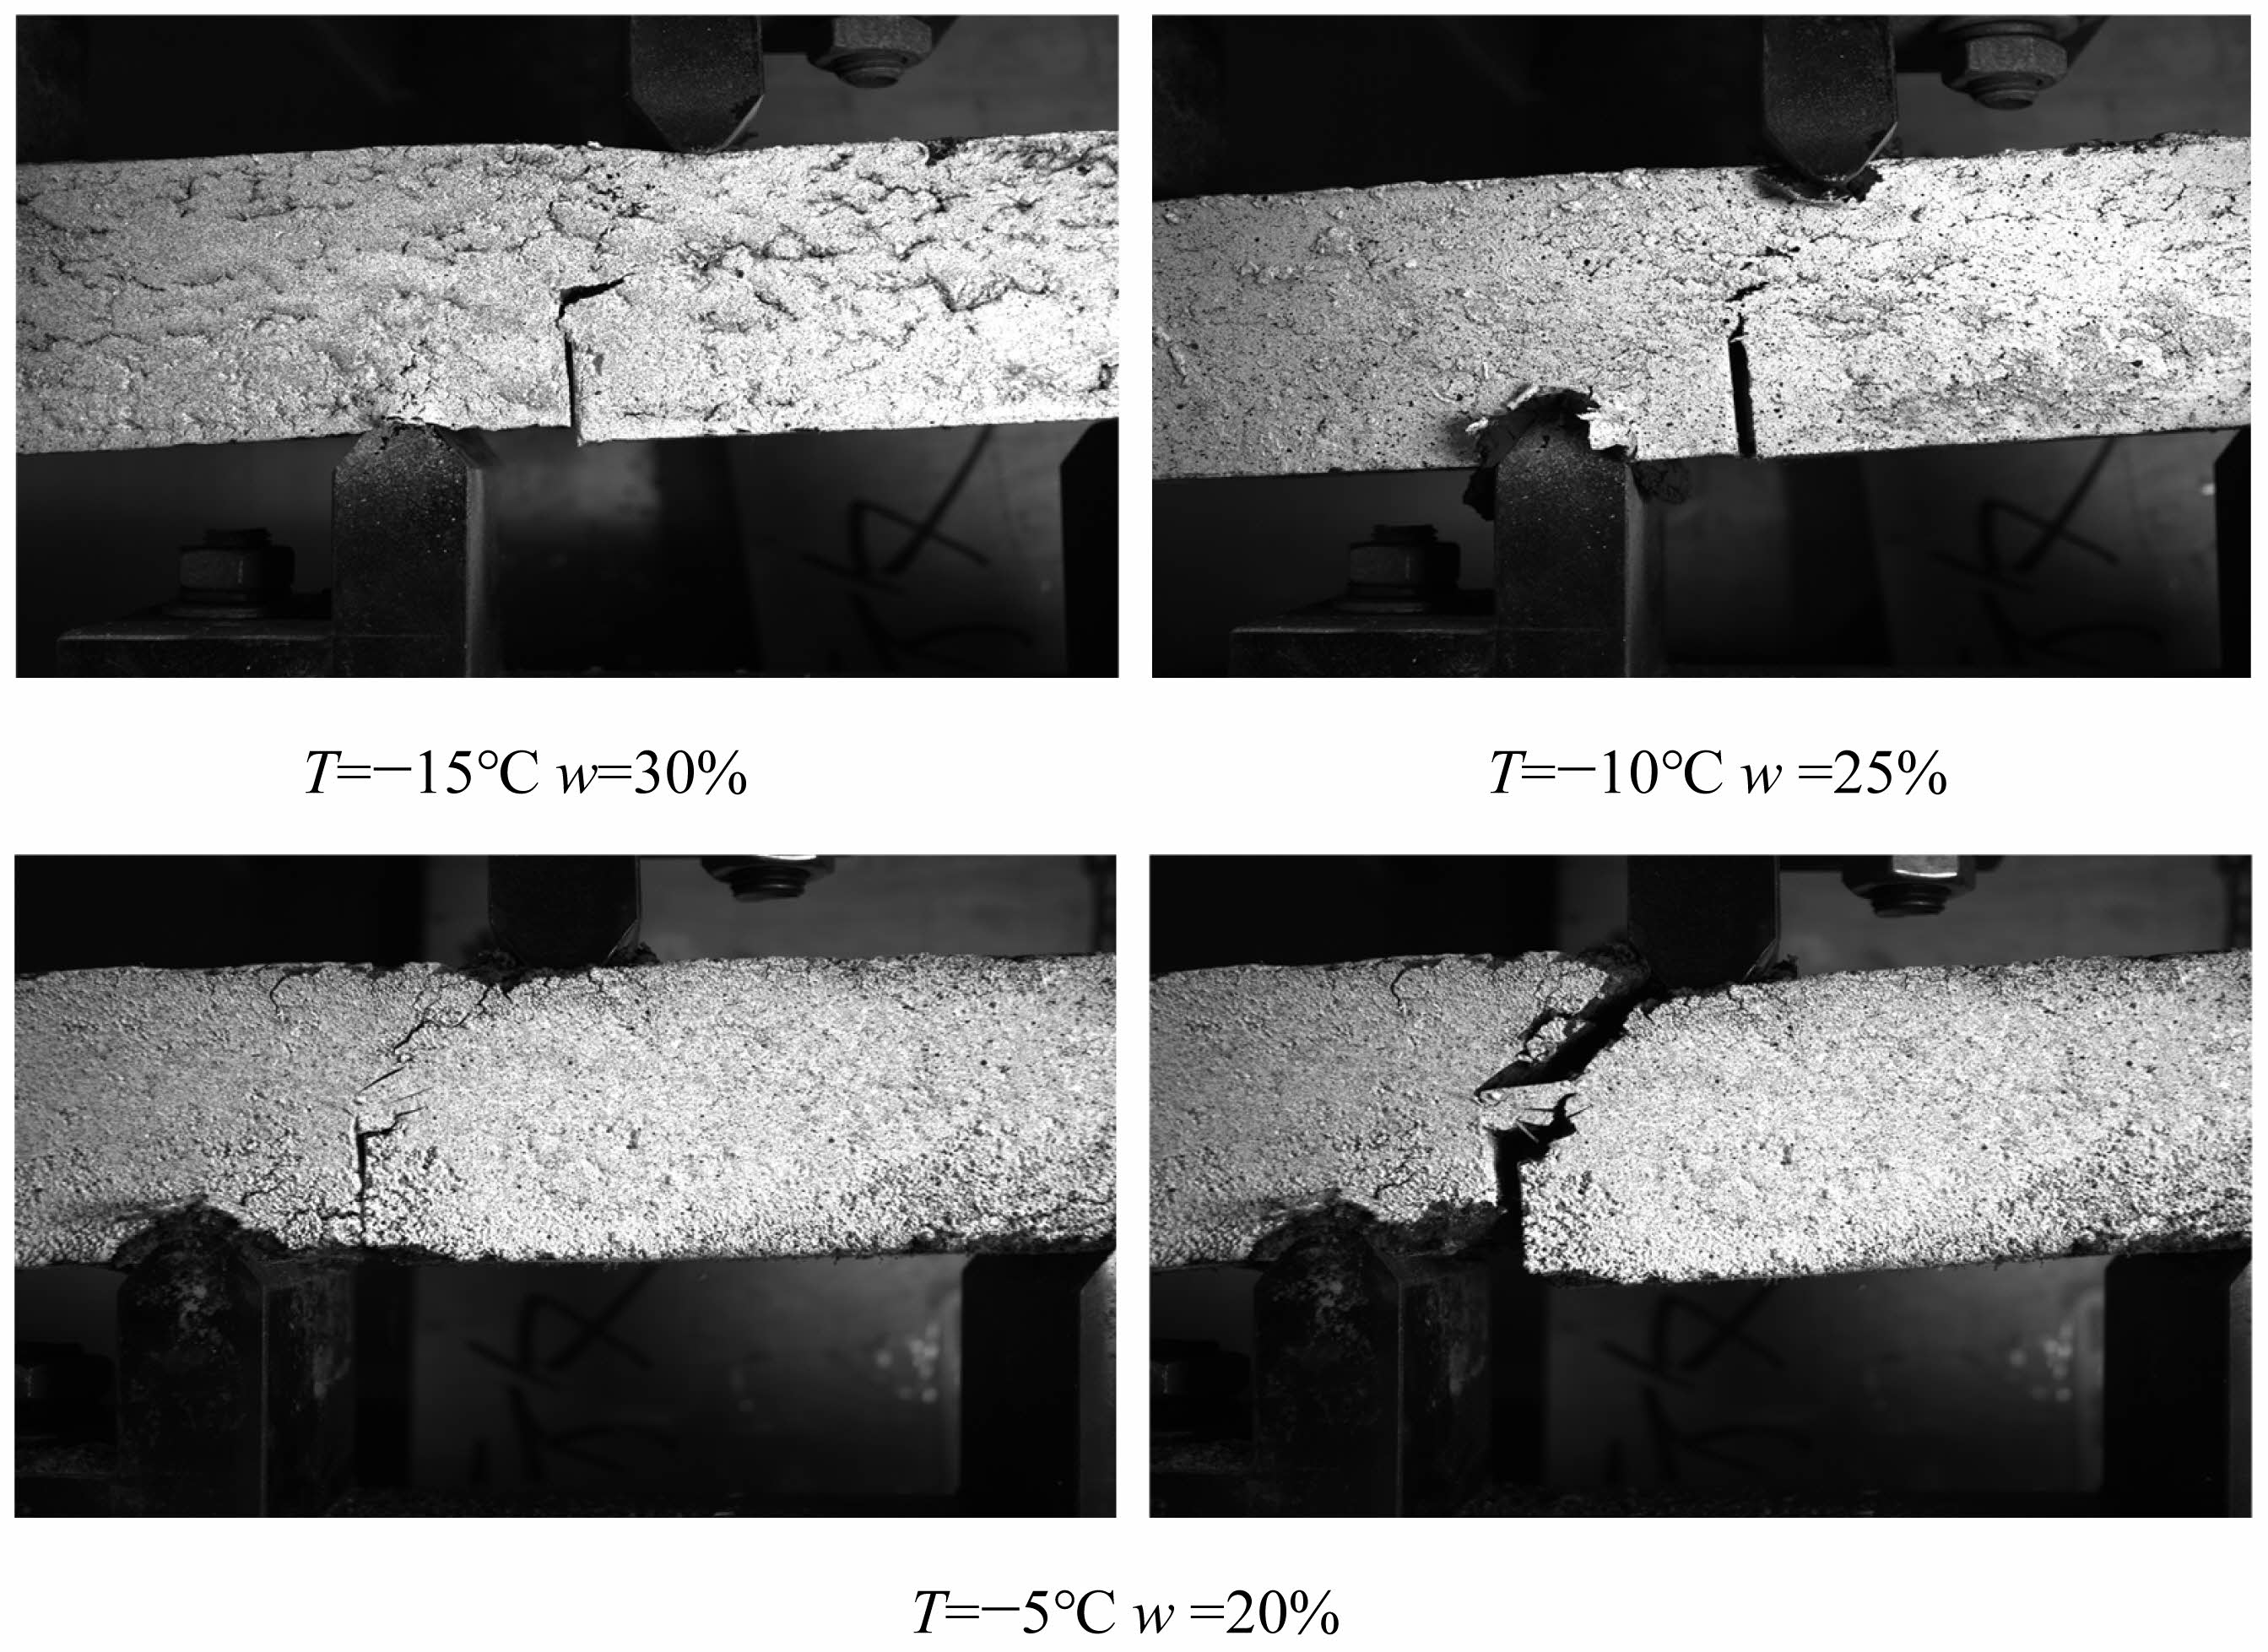
Figure 9 shows the morphologies at failure of the specimens with different temperatures and water contents subjected to mode II loading. During testing, each specimen was directly fractured into two halves, and the complete failure was accompanied by a short, slight sound. As shown in Fig. 8, the specimen fracture process differed at different temperatures and water contents. At relatively low temperatures (T = −15 °C and −10 °C) and a high water content (w = 25% and 30%), the specimens showed displacement under shear loading, and the crack caused noticeable external transverse cracks before failure occurred. At a high temperature (T = −5 °C) and low water content (w = 20%), discontinuous transverse cracks developed at the prefabricated crack tip, and the contact areas between the specimen bottom and the supports were slightly damaged due to the insufficient stiffnesses in that area. Subsequently, the specimen failed when the maximum load was reached. The development of numerous discontinuous transverse cracks in the specimens at high temperature (T = −5 °C) and low water content (w = 20%) might be because part of the specimen was not completely frozen at this temperature. Consequently, when a load was applied, the unfrozen soil particles were displaced before the specimen underwent overall displacement, and the bulk of soil at the prefabricated crack tip fractured to produce new transverse macrocracks. The specimens with low temperatures (T = −15 °C and −10 °C) and high water content (w = 25% and 30%) were subjected to shear loading, and the soil particles were completely frozen. Thus, no or few soil particles were displaced before the specimen underwent displacement; consequently, the principal crack initiated and penetrated through the specimen, and only one principal crack was usually formed (only a few secondary cracks). Overall, for the specimens subjected to mode II loading, secondary cracks propagated continuously at a certain angle to the prefabricated crack tip. When the specimen fractured, the soil peeled off from near the prefabricated crack. Consequently, the prefabricated crack was widened, and the fracture surface of the specimen was irregular.
Tensional and Shear Displacements at the Prefabricated Crack Tip
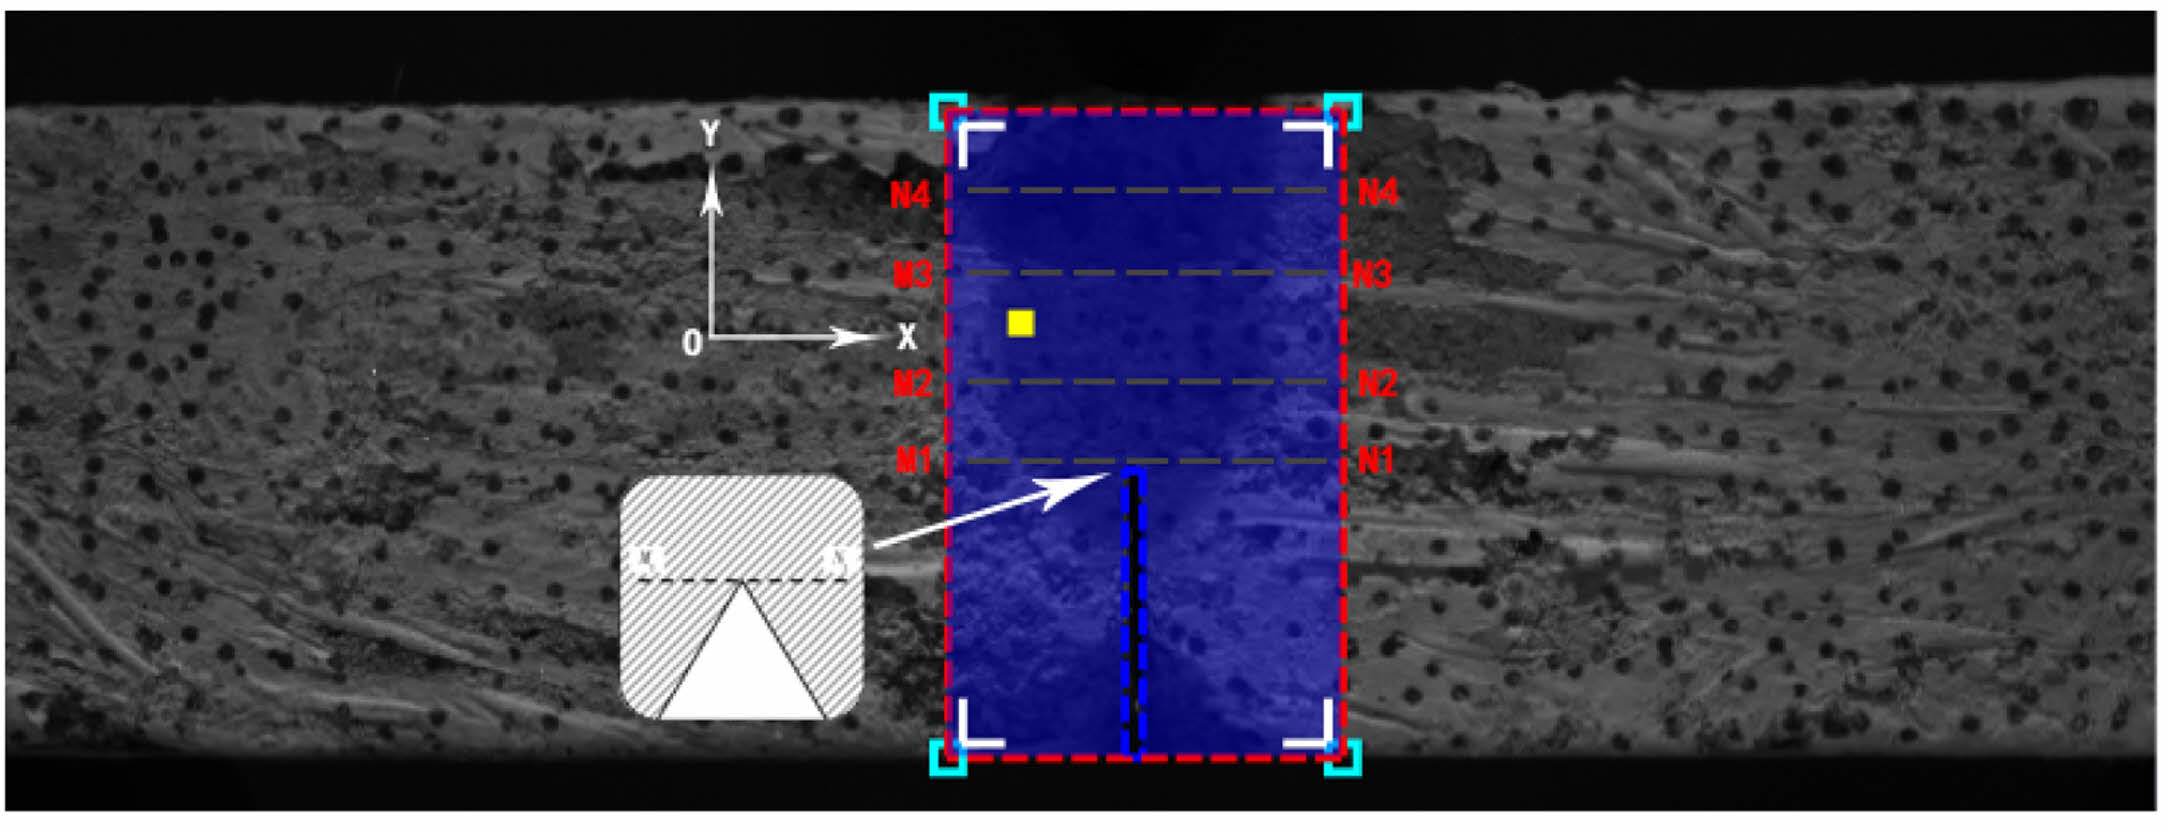
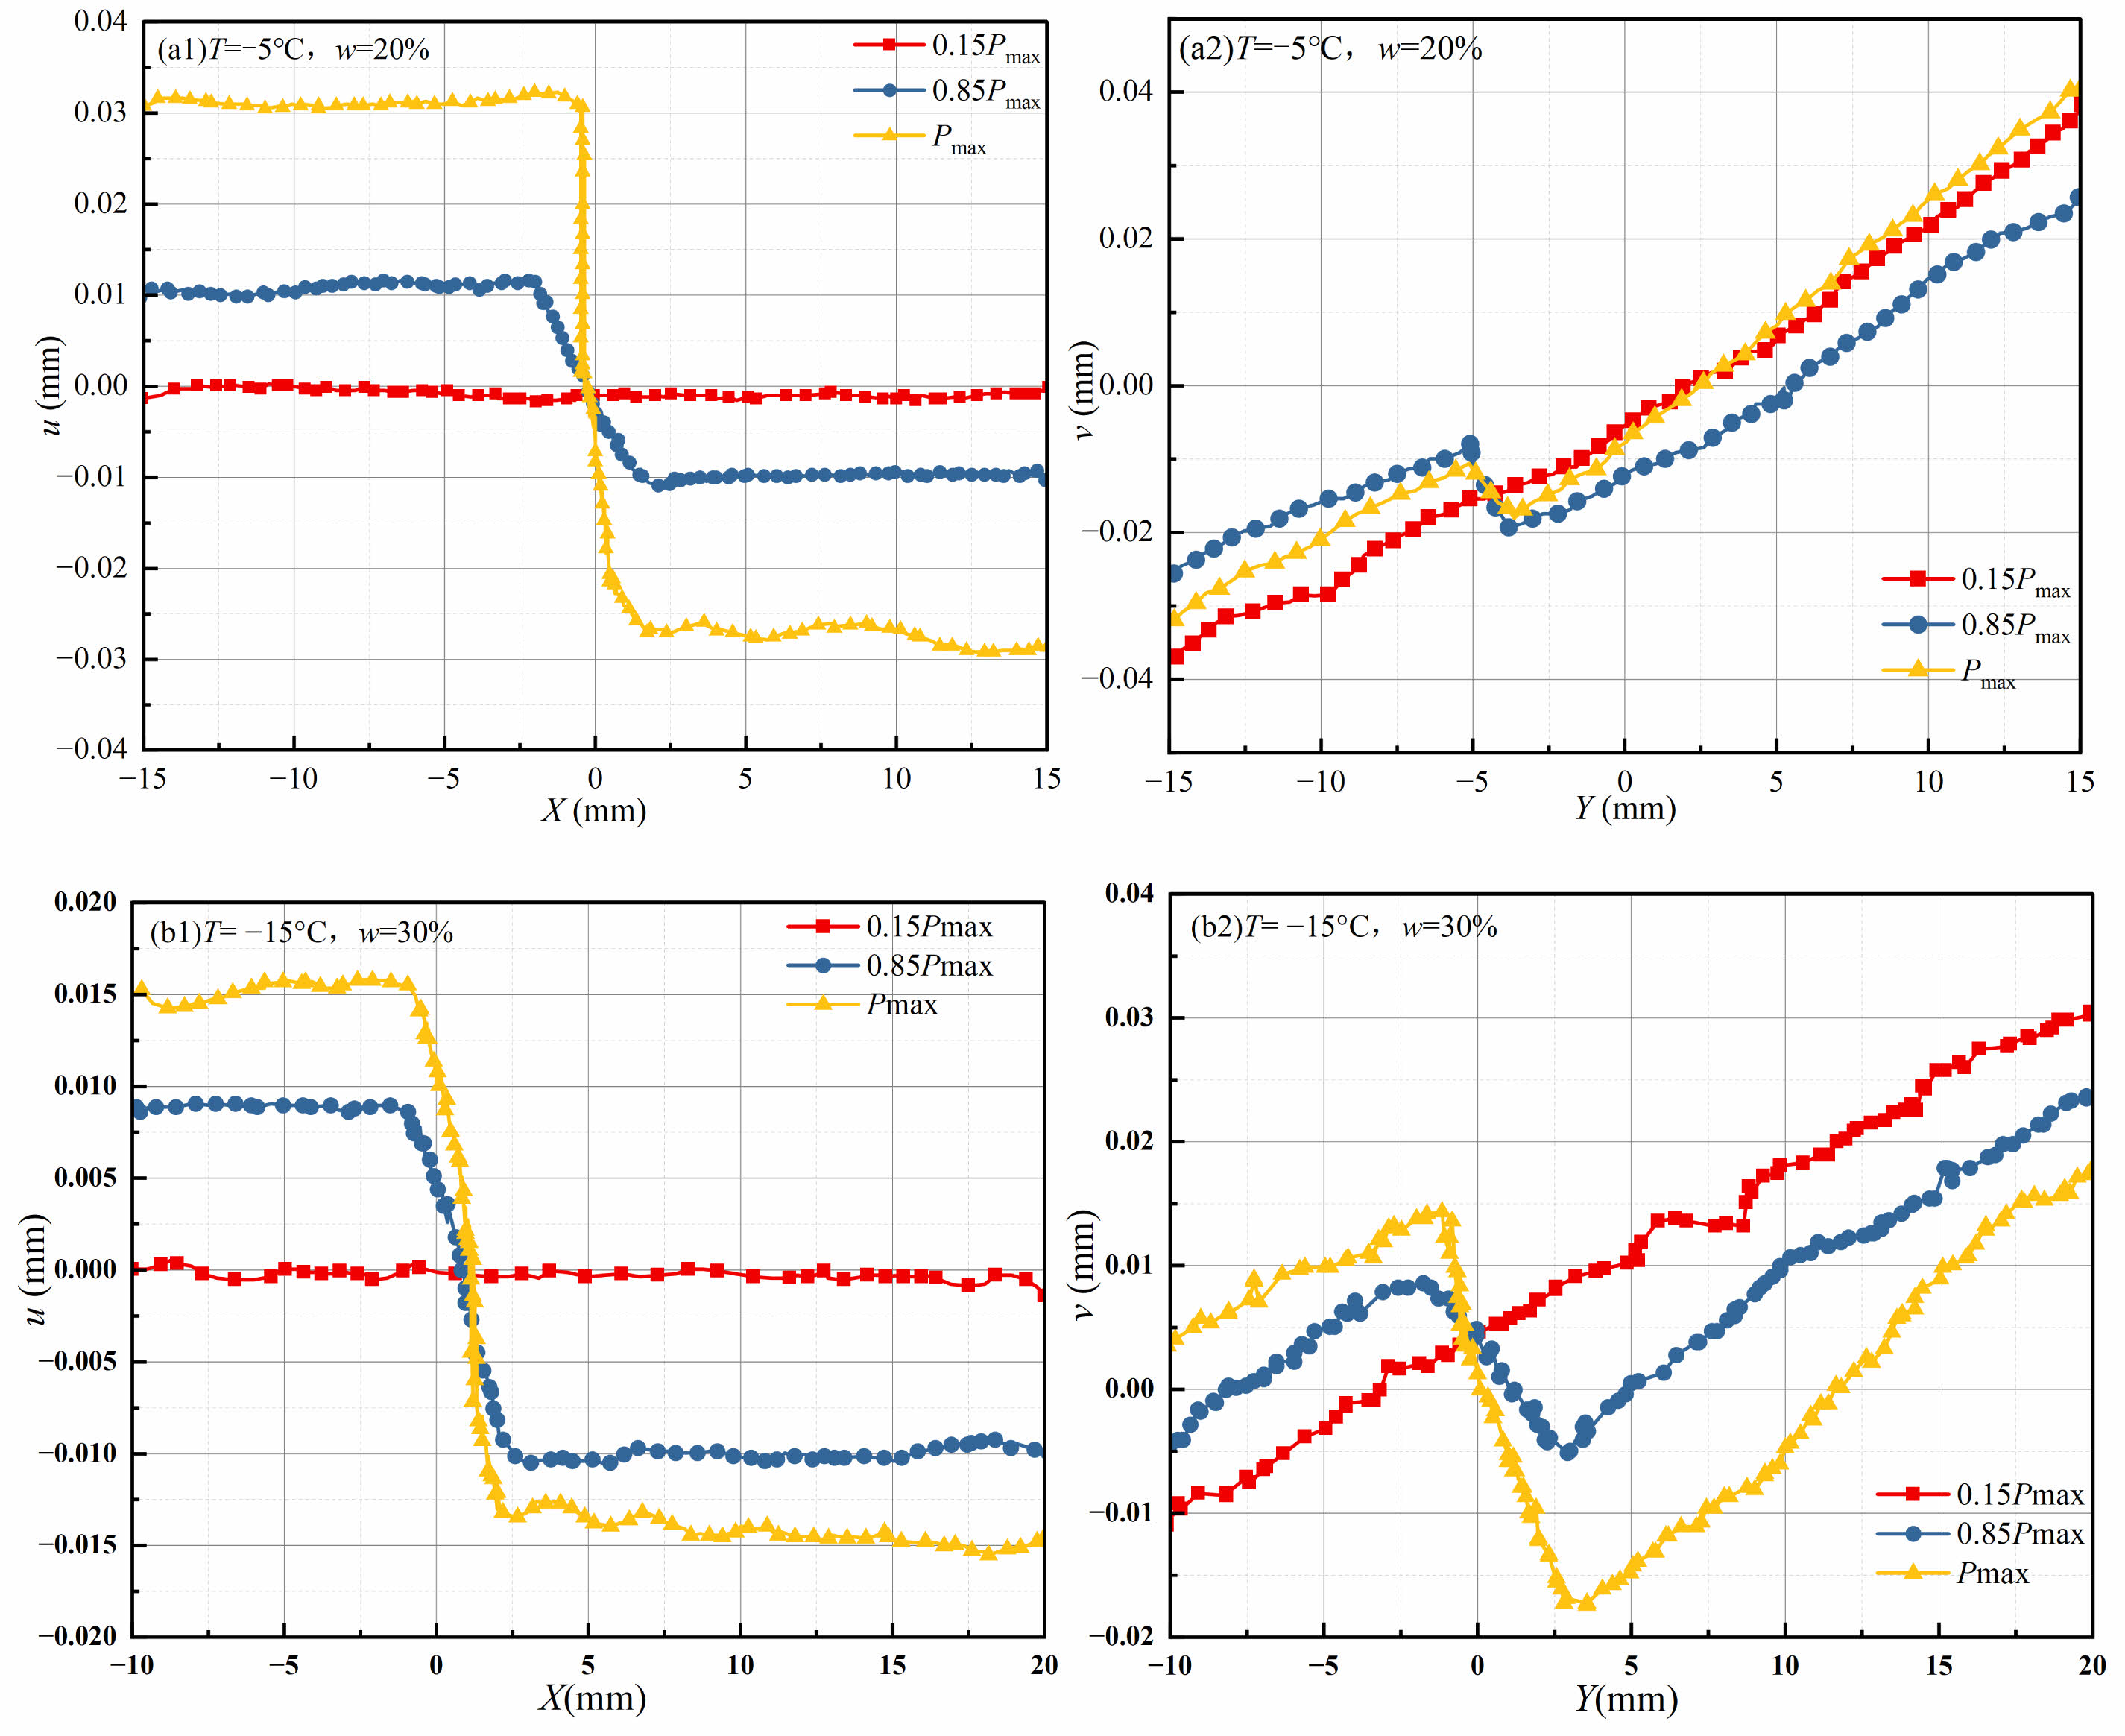
The tensional displacement u and shear displacement v of the tangent line MN of the prefabricated crack tip (as illustrated in Fig. 10) under four-point bending at three different loads (0.15 Pmax, 0.85 Pmax, and Pmax) were analyzed in the load-increasing stage using DIC.
Figure 11 shows the displacements of the pixels on line MN in the u- and v-directions at the three different moments measured by DIC. The displacements of the pixels on line MN in the two directions varied considerably with the applied load. At a load of 0.15 Pmax, the displacements of the pixels on line MN in the u-direction were approximately the same, while those in the v-direction were distributed in an oblique straight line. This indicates that in the initial stage of loading, the displacements of the pixels were continuous, and no fracture occurred. When the load was increased to 0.85 Pmax, the displacements of the pixels on line MN in the u- and v-directions increased markedly, suggesting the formation of a fracture zone. Notably, for the specimen with a temperature of T = −5 °C and a water content of w = 20%, the shear displacement at the prefabricated crack tip under a load of 0.85 Pmax was greater than that under a load of Pmax. This indicates that the specimen gradually lost its capacity for fracture resistance before the maximum load was reached; thus, as the load increased to the maximum load, the extent of crack propagation decreased. At a high temperature (T = −5 °C) and low water content (w = 20%), the variation in transverse displacement at the prefabricated crack tip was much greater than the variation in shear displacement. This further explains why discontinuous transverse cracks first occurred at the prefabricated crack tip during loading. At a low temperature (T = −15 °C) and high water content (w = 30%), the variations in the transverse and shear displacements at the respective catastrophe points were greater than those at a high temperature (T = −5 °C) and low water content (w = 20%). This result agrees with the observed morphologies of the macrocracks in the specimens after loading to failure.
|
Fig. 5 Displacement vs. load curves and fracture process division diagram. |
|
Fig. 6 Relationship between water content and fracture toughness. |
|
Fig. 7 Relationship between temperature and fracture toughness. |
|
Fig. 8 Fitted surfaces of Mode I fracture toughness under different temperatures and moisture contents. |
|
Fig. 9 Morphologies at failure of specimens with different temperatures and water contents subjected to mode II loading. |
|
Fig. 10 Regions for DIC analysis. |
|
Fig. 11 Transverse and shear displacement distributions at the prefabricated crack tip. |
|
Table 3 Test results for specimens under different temperatures and moisture contents. |
Modeling
To better observe the fracture process of the Genhe frozen silty clay subjected to asymmetric four-point bending, the fracture behavior of the soil was simulated using the extended finite element method (XFEM). A finite element model of the frozen soil beams used in the physical tests was established, as shown in Fig. 12. The model was allowed to fracture under the traction of the maximum principal stress using the same displacement-controlled loading scheme used in the physical tests. The displacement-controlled load was applied to loading plates, which were coupled with the reference points. To ensure the accurate solution of displacement and minimize the effects of mesh distortion, the C3D8R element was used [31]. The beam was pre-notched at the midspan. The crack was simulated using a shell element, which was not meshed. The loading plate was simulated using a discrete rigid body model.
In the Abaqus environment, damage models may be slow to converge. Thus, the XFEM model includes a viscosity coefficient to enhance the stability of the damage model. This coefficient is the viscosity coefficient of a cohesive interface or element-based damage model and ensures a positive definite tangent stiffness matrix within a sufficiently small time step. To obtain good convergence in this work, the damage stability coefficient for the simulation model, which was based on the damage model of Pippan [32], was set to 0.00005 about previous studies [33, 34].
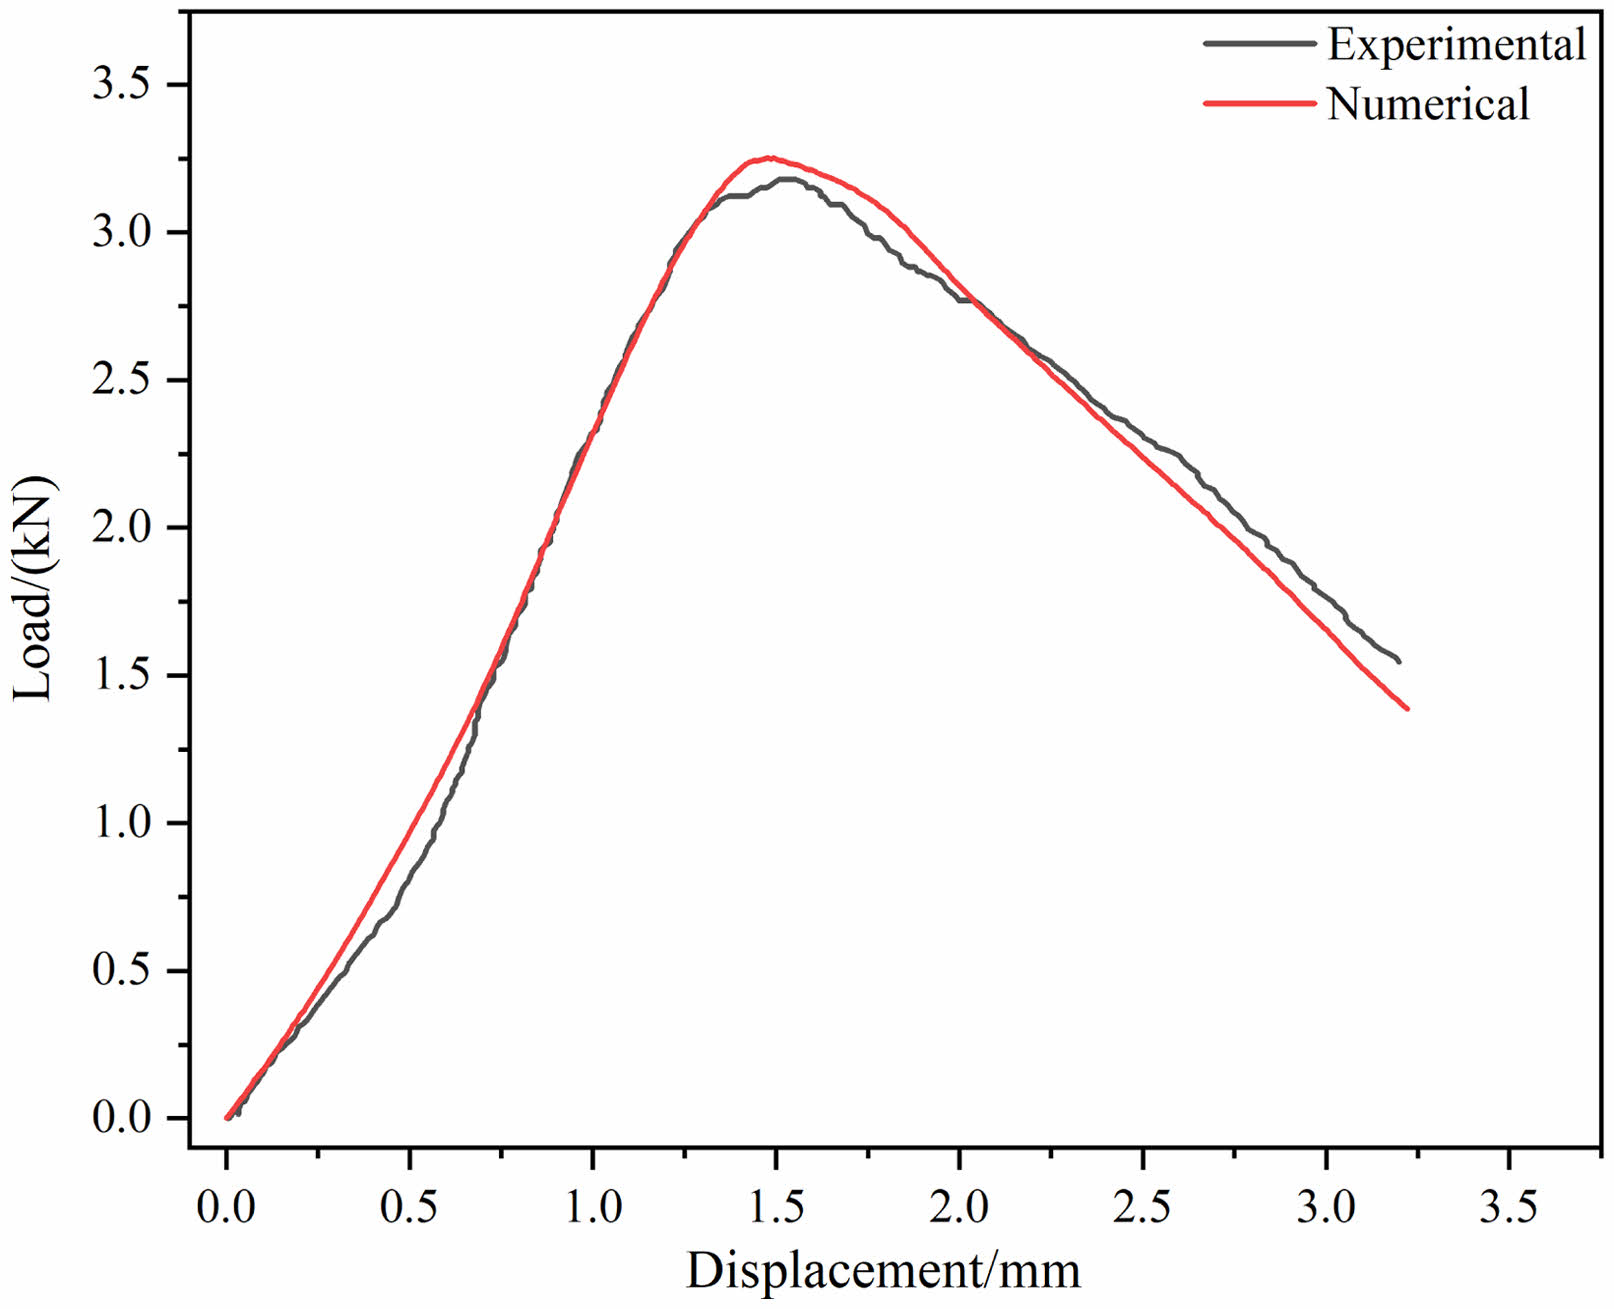
Figure 13 shows the loading rod load-displacement curves of specimen FC3 obtained from numerical simulation and laboratory testing. The stress-strain paths of the simulated and experimental curves are largely consistent. As the displacement increased, the simulated and experimental loads first increased and then decreased. The fracture toughness of specimen FC3 obtained from finite element analysis was 0.96 Mpa·m1/2, corresponding to a relative error of 1.06% compared with the experimental result. This confirms the accuracy of the numerical model and the applicability of linear elastic fracture mechanics to describe the mode II fracture behavior of frozen soils.
Analysis of the Stress Field
The direction perpendicular to the initial crack was defined as the X-direction, and the direction perpendicular to the X-direction was defined as the Y-direction. In the stress field contour map, the stress fields in the X- and Y-directions correspond to the horizontal and vertical stress fields, respectively. The first is related to crack propagation, while the latter is related to the pressure on the beam. The stress values for the stress fields in both directions are in units of MPa, with a positive value indicating tensile stress and a negative value indicating compressive stress.
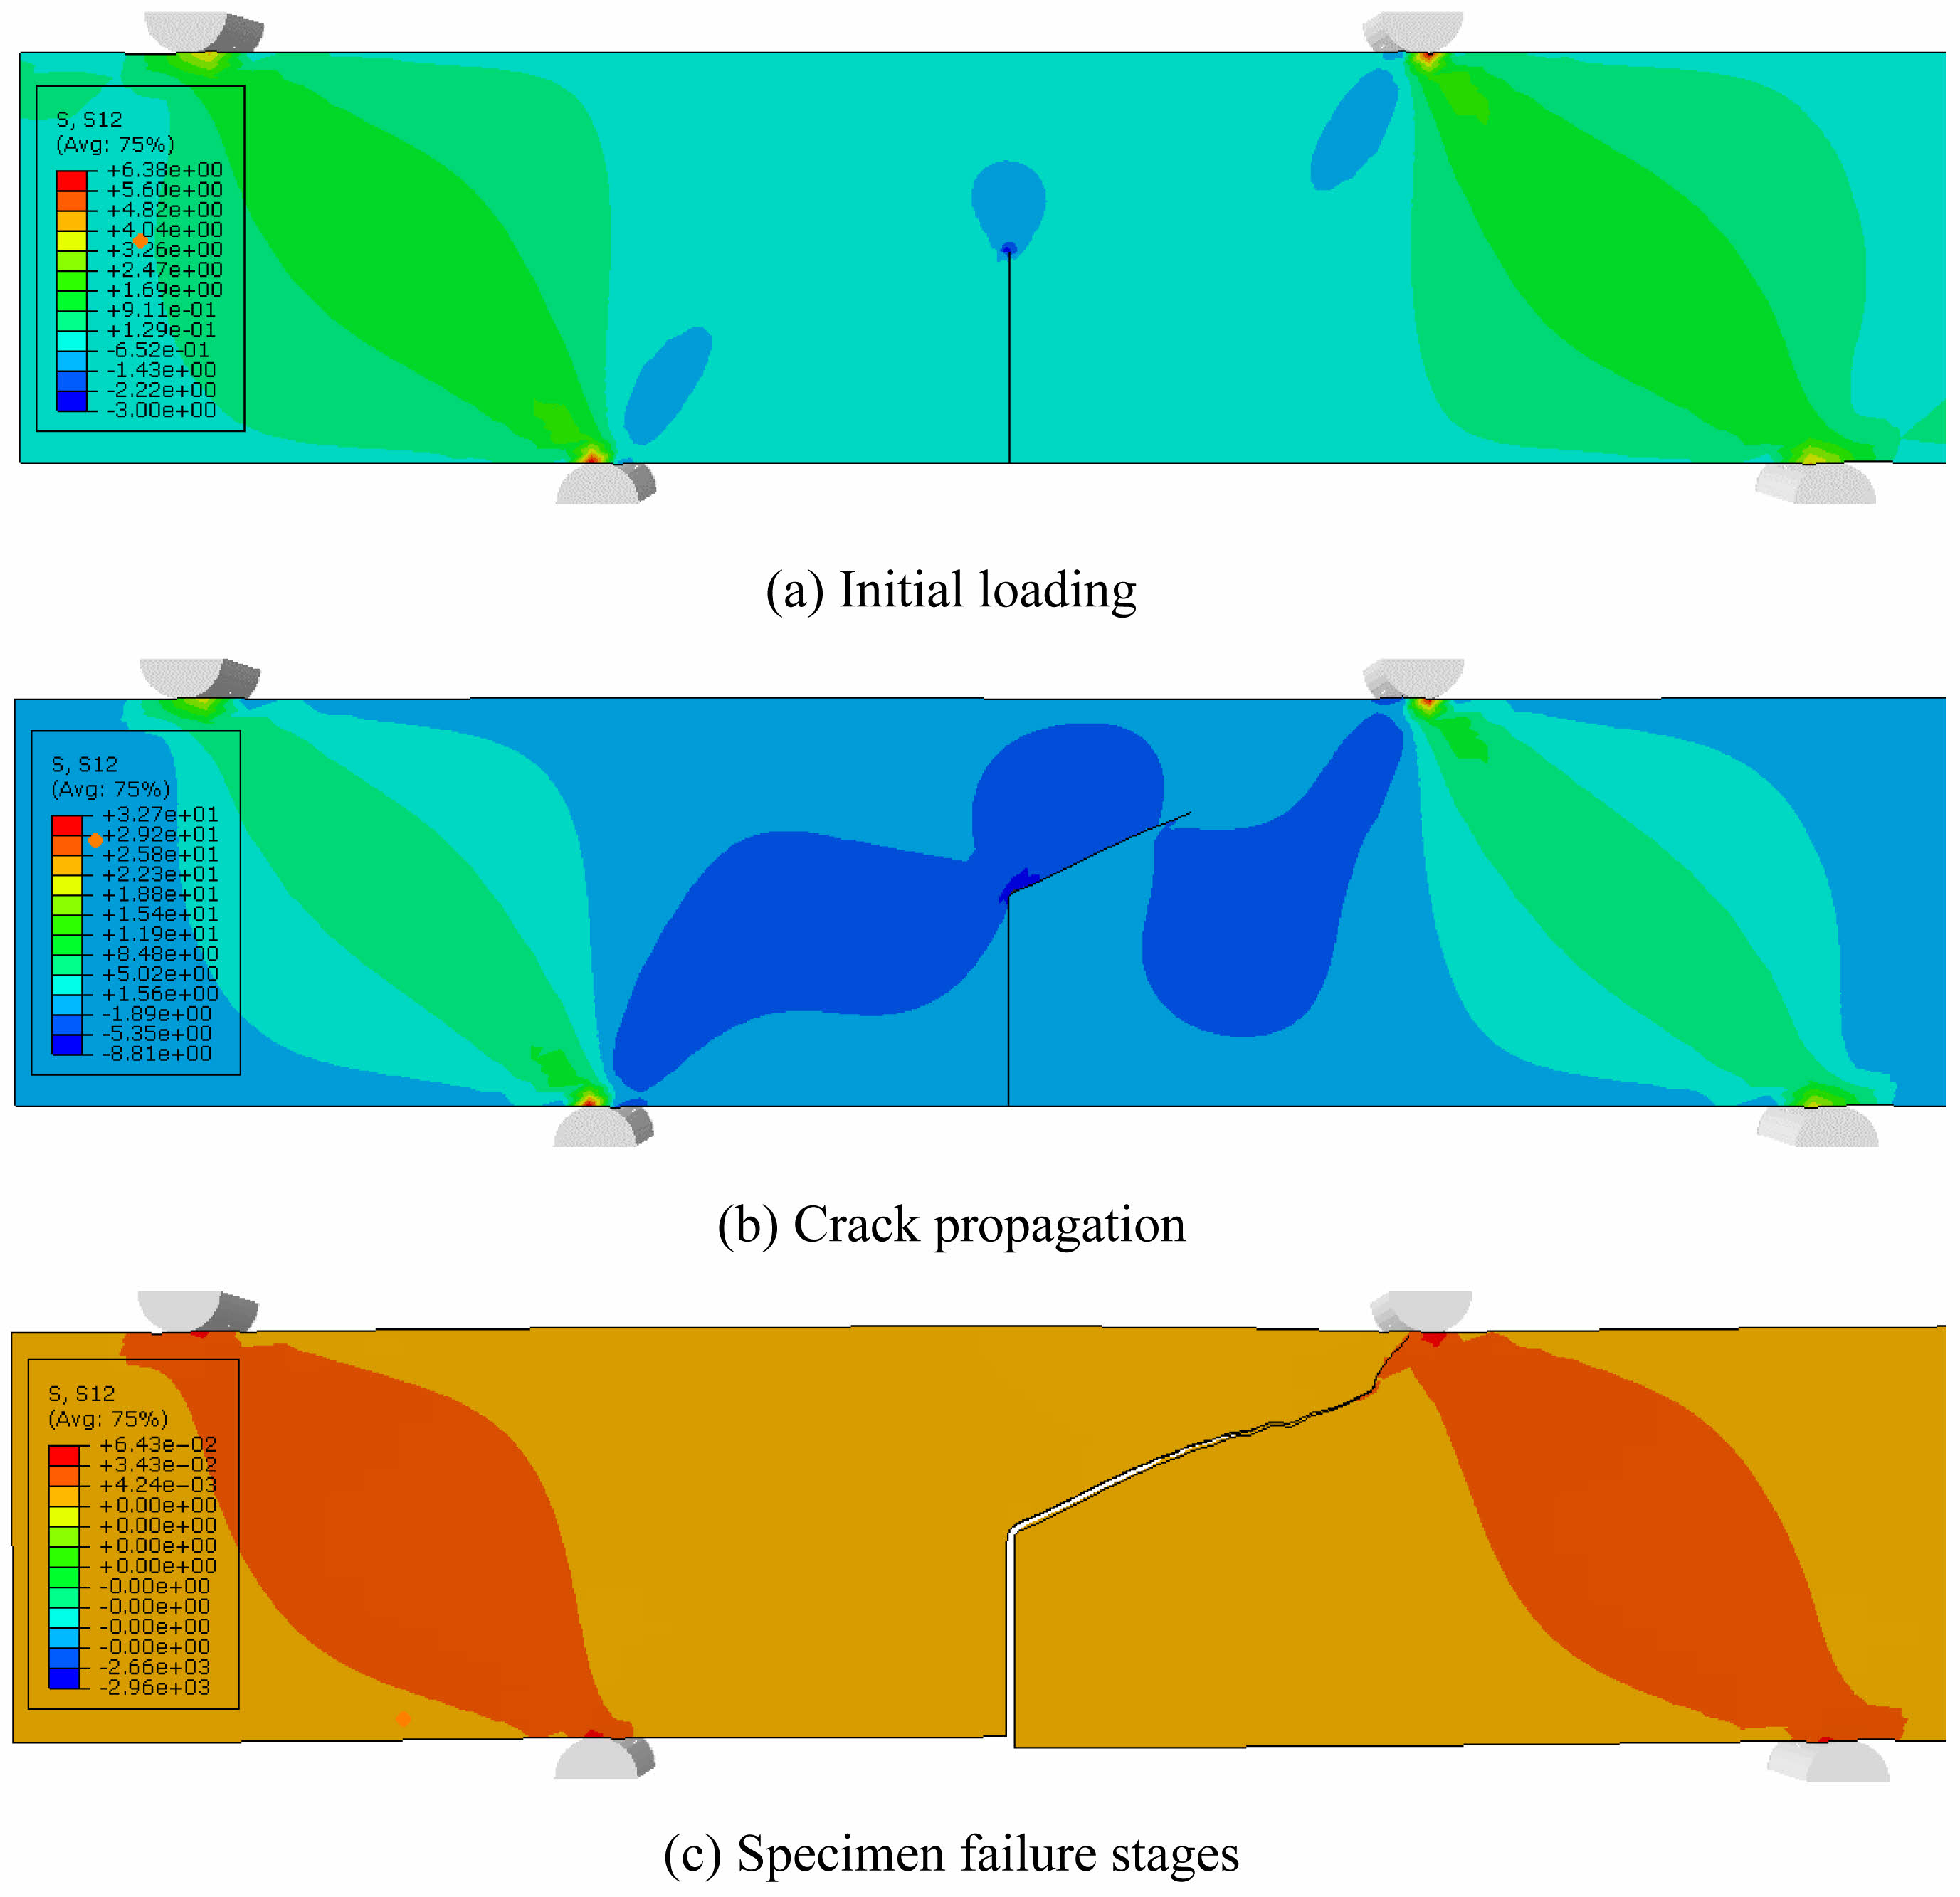
Because mode II fracture is the result of pure shear load, only the shear stresses in the Y-direction are analyzed here. Fig. 14 shows the contour maps for the Y-direction stress fields in different loading stages. In the initial stage of loading, a stress concentration centered on the prefabricated crack tip formed, and the stress fields on the two sides of the prefabricated crack exhibited elliptical contours that were symmetrical around the respective lines connecting the loading and supporting points. As the displacements at the loading points decreased, the crack extended markedly, and the shear-stress zone extended from the loading and supporting points to the crack propagation front. As the crack continued to extend, the specimen completely failed.
Analysis of the Displacement Field
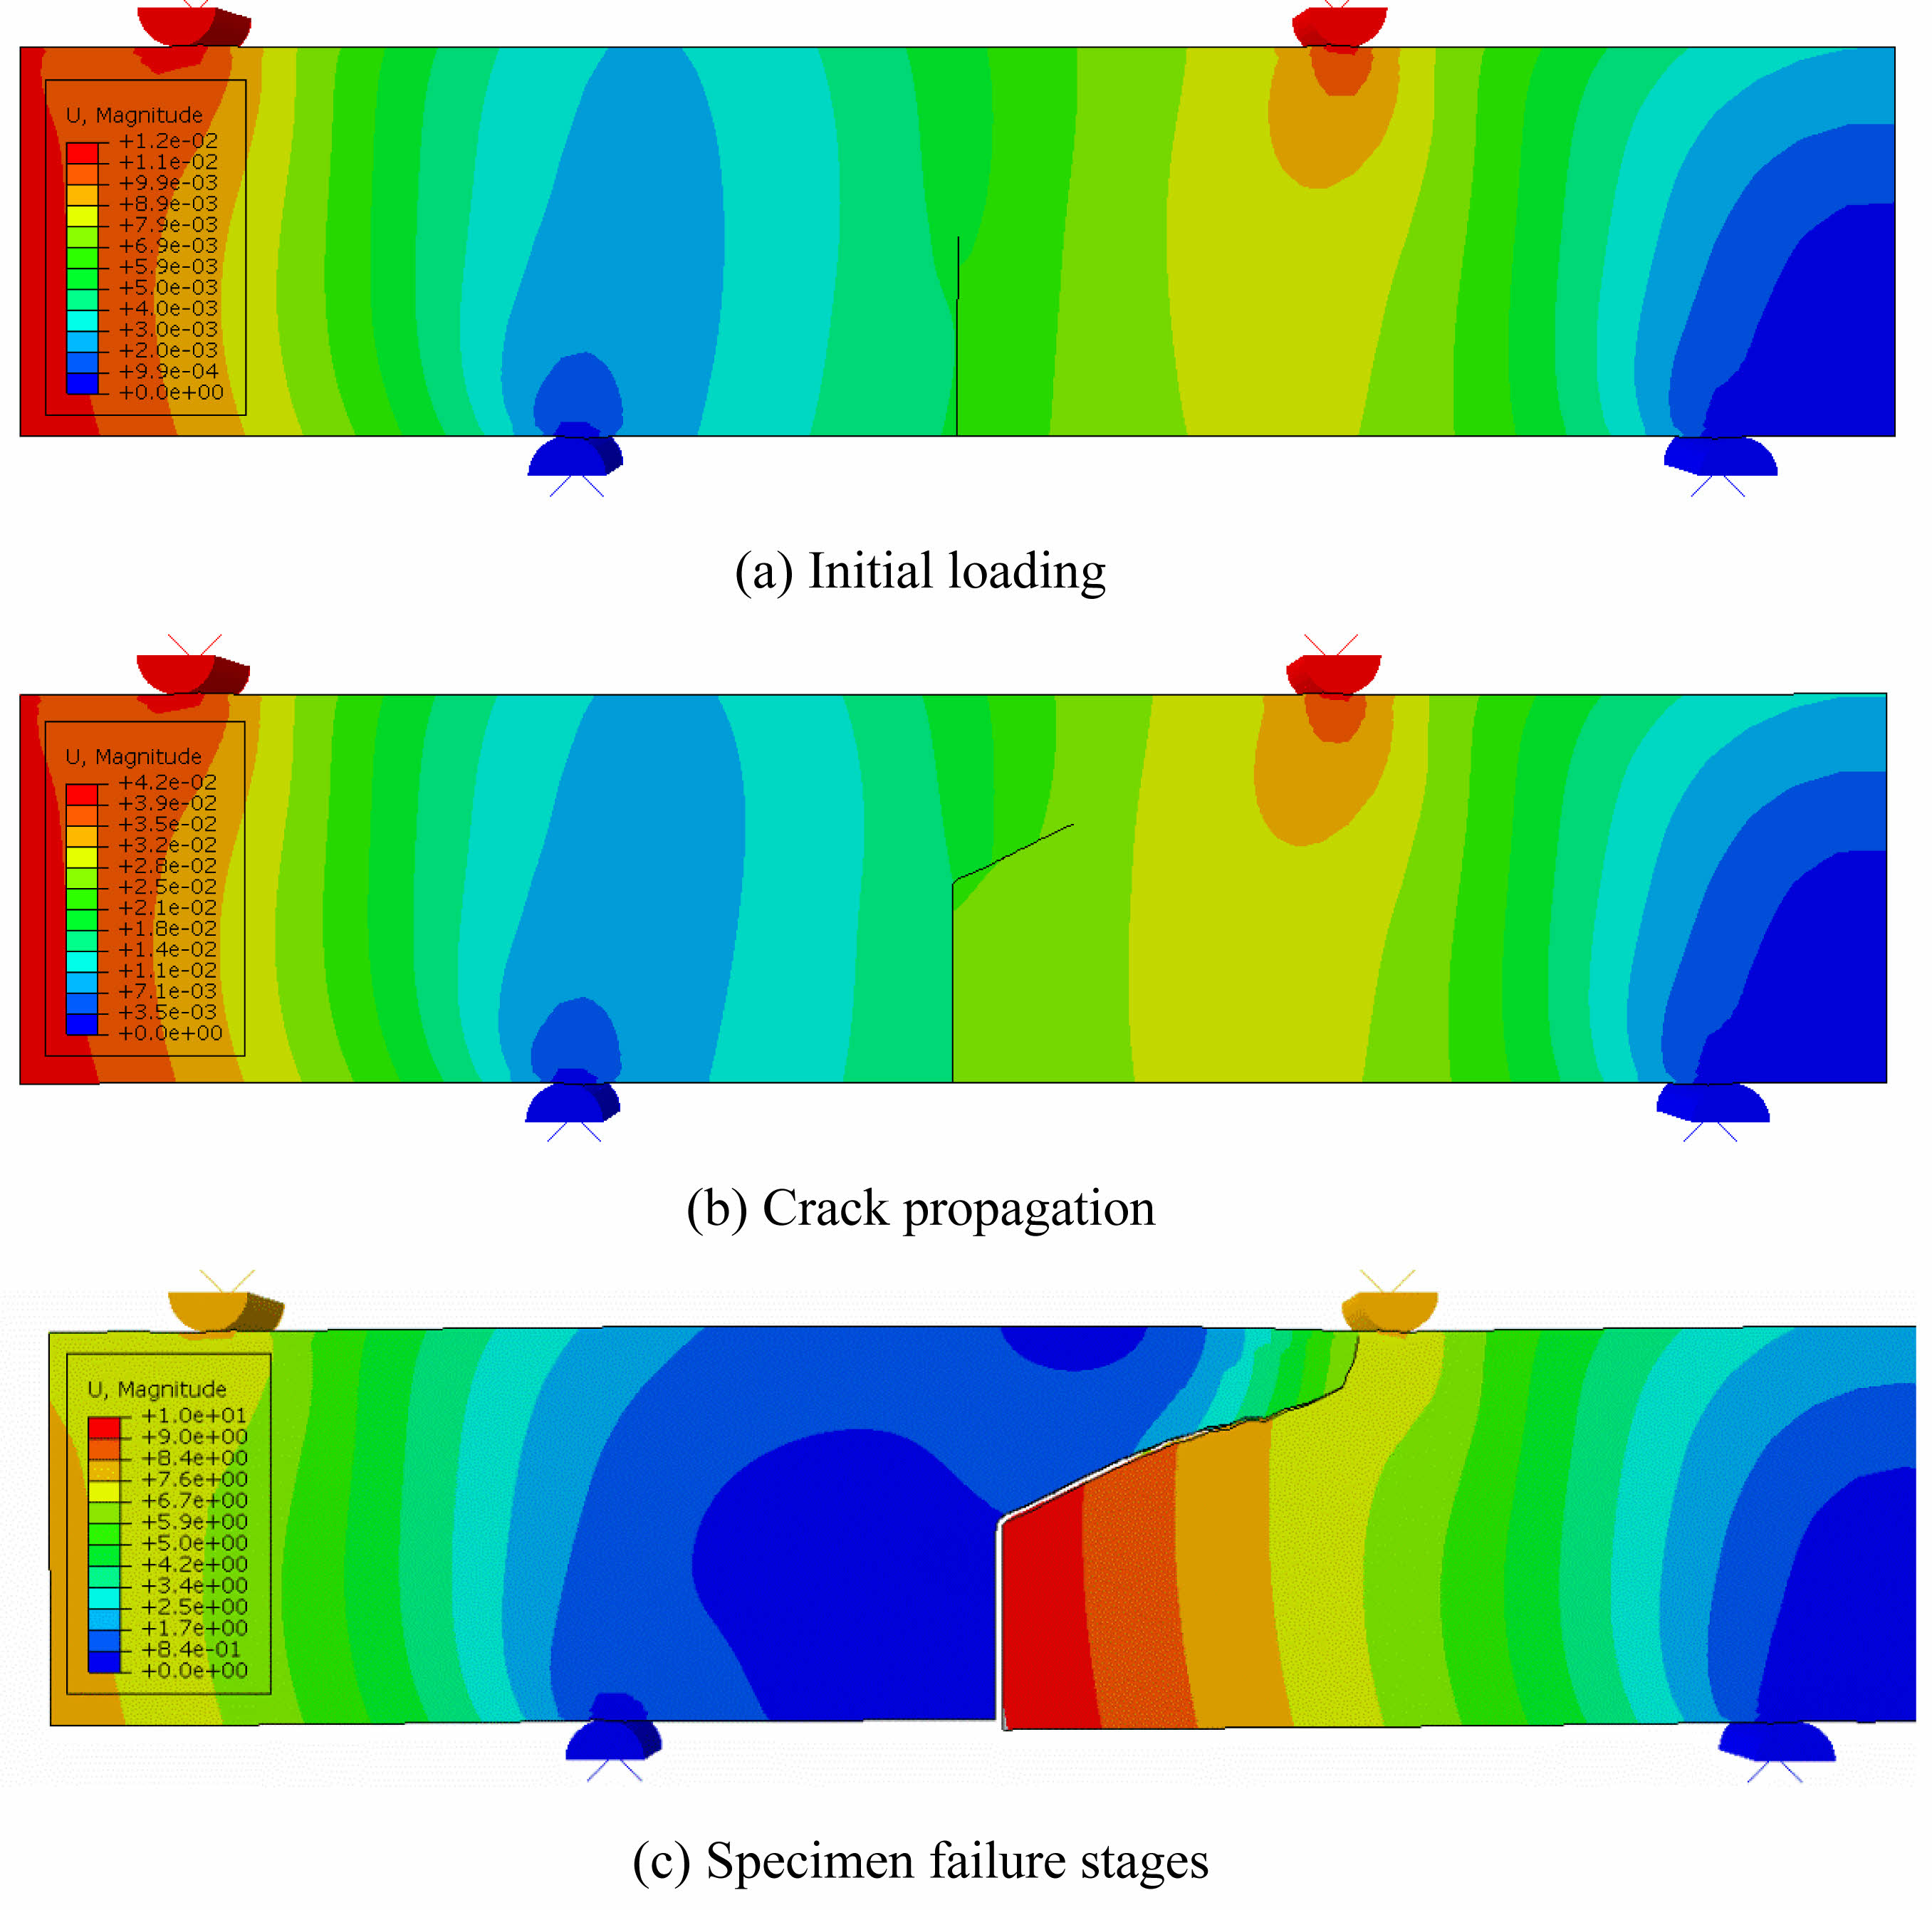
Figure 15 shows the contour maps of the entire displacement field of the specimen at different stages of mode II loading. In the initial stage of loading, the displacement field appeared as curved stripes that were symmetrical around the initial crack. As the crack began to extend, the displacement field at the crack tip shrank moving upwards and expanding in the direction of crack extension. Subsequently, the crack grew rapidly. Finally, the specimen completely failed when the displacement inside the crack exceeded that outside the crack. Table 4

|
Fig. 12 Finite element model of the notched frozen soil beam specimen. |
|
Fig. 13 Comparison of displacement–load curves obtained from finite element simulation and physical testing (FC3). |
|
Fig. 14 Y-direction stress fields during the initial loading, crack propagation, and specimen failure stages. |
|
Fig. 15 Entire displacement field during the initial loading, crack propagation, and specimen failure stages. |
The effects of water content and temperature on the model II fracture toughness of Genhe frozen silty clay were investigated through a series of asymmetric four-point bending tests on pre-notched specimens while observing the surface deformations with DIC. The key findings are summarized as follows.
1) For a given temperature, the mode II fracture toughness increased with increasing water content. This suggests the existence of an optimal water content, outside the tested range of water contents, at which the mode II fracture toughness of Genhe silty clay is maximized.
2) The water content had a significant effect on the displacement–load behavior during mode II loading. A high water content led to apparent plastic fracture, whereas a low water content led to ductile fracture. According to the load-displacement curves, the fracture process of the frozen soil was divided into three stages: elastic deformation, fracture surface formation, and fracture instability.
3) In the initial stage of mode II loading, the prefabricated crack extended toward the loading point at a certain angle. As the load continued to increase, the specimen gradually failed. For the specimen with a low temperature (T = −15 °C) and high water content (w = 30%), the crack propagation occurs with the increase of load, resulting in obvious external transverse cracks. For the specimen with a high temperature (T = −5 °C) and low water content (w = 20%), discontinuous transverse cracks developed at the prefabricated crack tip. The transverse and shear displacements at the prefabricated crack tip of the specimen with a low temperature (T = −15 °C) and high water content (w = 30%) were larger than those of the specimen with a high temperature (T = −5 °C) and low water content (w = 20%). Additionally, the specimen with a high temperature (T = −5 °C) and low water content (w = 20%) gradually lost its fracture resistance before the critical load was reached.
4) During mode II loading, the prefabricated crack grew continuously in the plane. In the initial stage of loading, a zone of stress concentration centered at the prefabricated crack tip appeared. The stress fields on the two sides of the prefabricated crack exhibited elliptical contours that were symmetrical around the respective lines connecting the loading and supporting points. It continues to move downward with the displacement at the loading point, the prefabricated crack grew markedly, and the displacement field exhibited curved stripes that were symmetrical around the initial crack.
This research was supported by the National Natural Science Foundation of China (No. 42171131, No. 12172280).
WH: Formal analysis, Methodology, Writing-origin draft, Software. HZ: Methodology, Project administration, Supervision. YW: Resources, Writing-review & editing, Funding acquisition, Supervision. ZL: Data curation, Investigation. SC: Data curation, Investigation.
The authors declare that they have no known competing financial interests or personal relationships that could have appeared to influence the work reported in this paper.
Data will be made available on request.
- 1. J. Carey, B. Cosgrove, K. Norton, C. Massey, D. Petley, and B. Lyndsell, Landslides 18 (2021) 2061-2072.
-

- 2. J. López-Vinielles, P. Ezquerro, J.A. Fernández-Merodo, M. Béjar-Pizarro, O. Monserrat, A. Barra, P. Blanco, J. García-Robles, A. Filatov, and J.C. García-Davalillo, Landslides 17 (2020) 2173-2188.
-

- 3. F. Otieno and S.K. Shukla, Int. J. Min. Reclam. Env. 37[2] (2023) 127-147.
-

- 4. Q. Tan, M. Huang, H. Tang, Z. Zou, C. Li, L. Huang, and X. Zhou, Eng. Geol. 310 (2022) 106898.
-

- 5. H. Li, M. Yang, and T. Dang, Front. Mater. 10 (2023) 1193527.
-

- 6. Y. He, Y. Liu, Y. Zhang, and R. Yuan, Eng. Geol. 252 (2019) 136-144.
-

- 7. W. Gao, S. Dai, T. Xiao, and T. He, Eng. Geol. 231 (2017) 190-199.
-

- 8. K. Pawluszek, Nat. Hazard. 96[1] (2019) 311-330.
-

- 9. O.R. Barani, M. Mosallanejad, and S.A. Sadrnejad, Int. J. Geomech. 16[4] (2016) 04015088.
-

- 10. A. Skempton, R. Schuster, and D. Petley, Geotechnique 19[2] (1969) 205-217.
-

- 11. L. Vallejo, Geotechnique 37[1] (1987) 69-82.
-

- 12. A.W. Skempton, Geotechnique 3[4] (1953) 30-53.
- 13. F.-H. Lee, K.-W. Lo, and S.-L. Lee, Chin. J. Geotech. Eng. 114[8] (1988) 915-929.
-

- 14. E.-S. Kim, S.-D. Hong, and Y.-W. Kim, J. Ceram. Process. Res. 14[2] (2013) 251-254.
-

- 15. H. Li, H. Yang, and Z. Liu, Can. Geotech. J. 37[1] (2000) 253-258.
-

- 16. J.-M. Konrad and J. Cummings, Can. Geotech. J. 38[5] (2001) 967-981.
-

- 17. P. Hallett and T. Newson, Soil Sci. Soc. Am. J. 65[4] (2001) 1083-1088.
-

- 18. Y. Yamamoto and S.M. Springman, Cold Reg. Sci. Technol. 134 (2017) 20-32.
-

- 19. J.J. Wang, S.Y. Huang, and J.F. Hu, Eng. Fract. Mech. 165 (2016) 19-23.
-

- 20. N. Zhang, A. Hedayat, H.G.B. Sosa, N. Tupa, and I.Y. Morales, Theor. Appl. Fract. Mech. 124 (2023) 103670.
-

- 21. X. Xu, W. Zhang, C. Fan, and G. Li, Results Phys. 16 (2020) 102830.
-

- 22. M. Aliha, M. Ayatollahi, and B. Kharazi, Int. J. Fract. 159 (2009) 241-246.
-

- 23. J. Xu, J. Ceram. Process. Res. 13[6] (2012) 683-687.
-

- 24. M. Ayatollahi and M. Aliha, Int. J. Solids Struct. 43[17] (2006) 5217-5227.
-

- 25. A.S. Demirkiran, J. Ceram. Process. Res. 14[1] (2013) 51-55.
-

- 26. H. Saghafi, M. Ayatollahi, and M. Sistaninia, Mater. Sci. Eng. A 527[21-22] (2010) 5624-5630.
-

- 27. H. Darban, M. Haghpanahi, and A. Assadi, Comput. Mater. Sci. 50[5] (2011) 1667-1674.
-

- 28. M. Ayatollahi, M. Aliha, and H. Saghafi, Eng. Fract. Mech. 78[1] (2011) 110-123.
-

- 29. A. Krishnan and L.R. Xu, Int. J. Fract. 169 (2011) 15-25.
-

- 30. X. Yan, Z. Duan, and Q. Sun, Environ. Earth Sci. 80[2] (2021) 52.
-

- 31. J. Wang, S. Huang, W. Guo, Z. Qiu, and K. Kang, Eng. Fract. Mech. 224 (2020) 106814.
-

- 32. S. Yu, H. Guan, Q. Kang, A. Dai, Y. Ke, G. Tian, and H. Deng, Constr. Build. Mater. 451 (2024) 138747.
-

- 33. K. Gurram and N. Pannirselvam, J. Ceram. Process. Res. 24[3] (2023) 560-568.
-

- 34. R. Pippan, S. Wurster, and D. Kiener, Mater. Des. 159 (2018) 252-267.
-

- 35. J.-Y. Wu and Y. Huang, Theor. Appl. Fract. Mech. 106 (2020) 102440.
-

- 36. Q. Liu, W. Chen, J.K. Guo, R.F. Li, D. Ke, Y. Wu, W. Tian, and X.Z. Li, Adv. Mater. Sci. Eng. 2021 (2021) 3936968.
-

 This Article
-
2024; 25(6): 941-953
Published on Dec 31, 2024
- 10.36410/jcpr.2024.25.6.941
- Received on May 10, 2024
- Revised on Jun 19, 2024
- Accepted on Aug 23, 2024
 Services
- Abstract
introduction
material and methods
results and discussion
numerical simulation
conclusions
- Acknowledgements
- Author Contributions
- Declaration of Interest
- Data availability statement
- References
- Full Text PDF
Shared
 Correspondence to
- Yongtao Wang
-
Transportation Institute of Inner Mongolia University, Hohhot 010070, China
Tel : +86 18047128270 Fax: +86 04714996252 - E-mail: wyt_827@imu.edu.cn


 Copyright 2019 International Orgranization for Ceramic Processing. All rights reserved.