- Real-time detection of lithium precipitation during battery charging
Jing Ninga,b, Bing Xiaoa,* and Zhong Wenhuia
aCollege of Automation Science and Engineering, South China University of Technology, Guangzhou, China
bNational Demonstration Center for Experimental Economics and Management Education, Guangdong University of Finance and Economics, Guangzhou, ChinaThis article is an open access article distributed under the terms of the Creative Commons Attribution Non-Commercial License (http://creativecommons.org/licenses/by-nc/4.0) which permits unrestricted non-commercial use, distribution, and reproduction in any medium, provided the original work is properly cited.
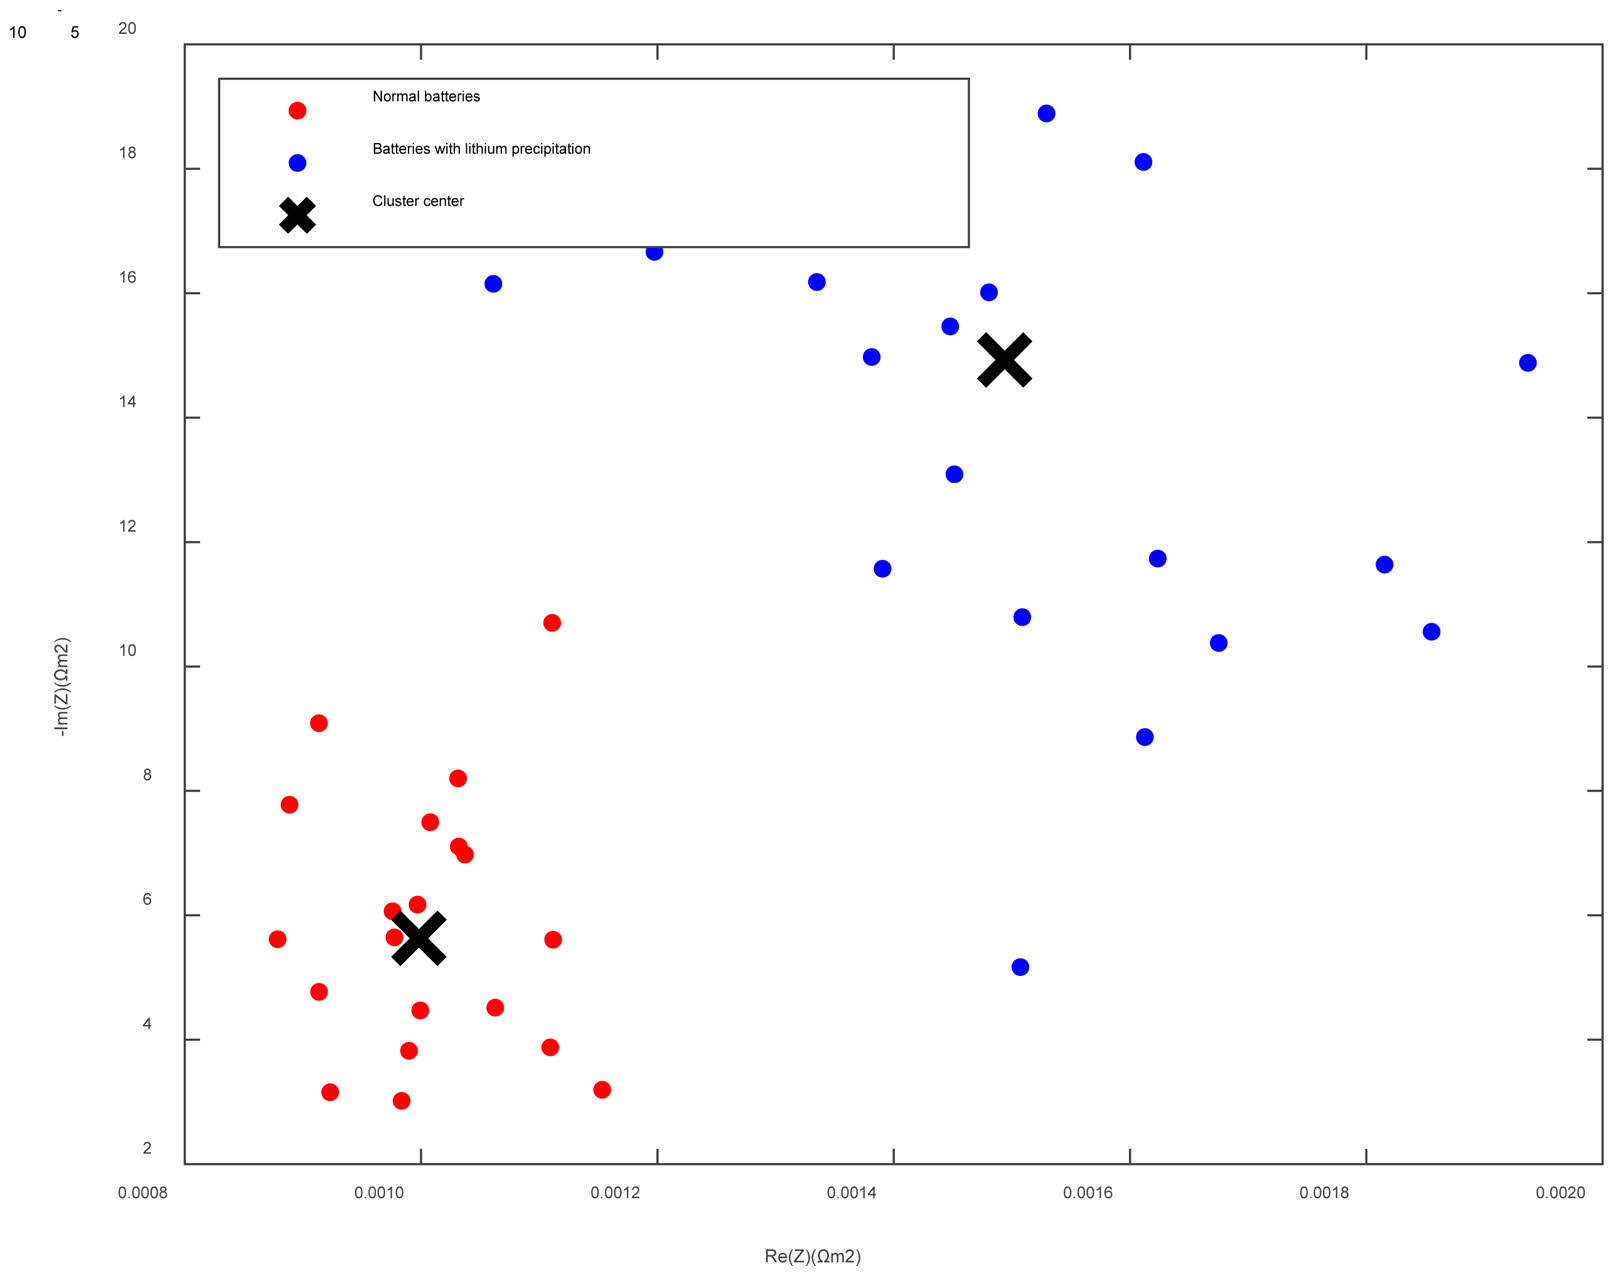
The real-time detection of lithium precipitation is significant to avoid internal short circuit and even thermal runaway. Distinguished from the sophisticated, long-duration testing in the lab, the paper introduces an innovative method for detecting lithium precipitation in the application scenarios of the battery charging process. First, the Warburg impedance is extended to conical symmetry and the lithium-ions diffusion model for lithium precipitation is presented. Second, to measure the parameters inside the battery at the microscopic scales by the external variable, porous electrode model for lithium precipitation is created. Third, lithium precipitation detection technique easily integrated in the charging device is presented. The result indicates that the ripple current is high when the SOH of the normal battery is up to 93.2%, but the ripple current goes down when the SOH is 27.4% due to lithium precipitation. Compared with the impedance of normal batteries around the cluster centre in the low-frequency range of 0.5~3 Hz, the battery impedance with lithium precipitation is Scattered and uncertain
Keywords: Lithium precipitation, Warburg, Lithium-ions diffusion model, Porous electrode model, Charging.
Lithium precipitation inside the battery refers to the phenomenon of lithium metal deposited on the surface of the negative electrode during the charging process of the lithium battery. Lithium precipitation leads to the growth of lithium dendrites, and lithium dendrites penetrate the diaphragm that separates the positive and negative electrodes, which results in an internal short circuit and causes fires and even explosions [1]. Therefore, lithium precipitation detection is of great significance for monitoring and avoiding the growth of lithium dendrites during the charging process, and is a prerequisite for realizing optimal charging control.
Currently, the charging modes for electric vehicles are divided into three types: constant current constant voltage charging (CCCV), multi-stage constant current charging (MSCC), and pulse charging (PC). MSCC is used mostly in the fast-charging strategy. MSCC [2] mode uses a stepped current map and the principle is as follows: The safe charging range of the battery is fixed. With the increase of the state of charging (SOC), the charging capacity will be reduced. In the low SOC range, due to its strong charging capacity and wide window, the charging ratio is appropriately increased and the charging speed can be improved. In the high SOC range, the charging capacity becomes weak, and the charging rate is appropriately reduced to ensure that lithium precipitation inside the battery doesn’t occur during the charging process. However, the charging device doesn’t have the function of real-time detection of lithium precipitation, so it can’t ensure the safety of the battery during the charging process. Real-time detection of lithium precipitation is one of the important prerequisites for optimizing battery charging strategy to improve battery life and prevent thermal runaway.
In the electrochemical lab, lithium precipitation is observed by in-situ observation techniques. The techniques include in situ optical microscopes, scanning electron microscopy (SEM), transmission electron microscopy (TEM), X-ray tomography (XCT), atomic force microscopy (AFM) and so on [3-7].
Many scholars employed electrochemical impedance spectroscopy (EIS) to study the lithium dendrite. Zhao [8] proposed an online detection method of lithium precipitation based on the analysis of battery impedance changes. Schindler [9] proposed using impedance as characteristic information for the determination and analysis of lithium precipitation at the negative pole. Based on the static voltage method, impedance is used to explore lithium precipitation. Schweikert [10] studied the dynamic characterization of lithium dendrite by measuring EIS.
Data-driven approaches based on artificial intelligence algorithms or adaptive algorithms are very popular recently. Chen [11] established a classifier based on machine learning algorithms to predict the trend of lithium precipitation. Akolkar [12] used a machine learning force field model to simulate the morphology evolution of dendrites. Aryanfar [13] established the mathematical model for dendrite growth under constant current charging. Boris [14] collected the distribution data of dendrite length at different temperatures and the Monte Carlo algorithm was employed to simulate the growth of dendrite. However, the accuracy and generalization of data-driven models depend on a large amount of data.
In summary, the paper focuses on the application scenarios of the battery charging process, which is designed for real-time, fast and low cost. This is different from battery electrochemistry and materials research LABS, which require sophisticated, long-duration testing of sophisticated instruments, and of course more expensive. Methods of Coulomb efficiency and EIS need several hours for a charge and discharge cycle. Data-driven approaches rely on the collection and analysis of vast amounts of data. The paper presents the detection method for lithium precipitation integrated with the charging device. First, given the morphology and structure of lithium precipitation, the Warburg impedance is extended to conical symmetry, and the lithium-ions diffusion model for lithium precipitation is proposed. Second, to measure the internal parameters inside the battery at the microscopic scales by the external variable at the macroscopic scales, a porous electrode model for lithium precipitation is created. Third, lithium precipitation detection is integrated with the MCU of the charging device by measuring the electrode impedance in the low-frequency range, so lithium precipitation is detected in real time during the charging process.
Lithium ions diffusion model based on Warburg impedance
Newman and Doyle [15-17] solved the concentration distribution of lithium ions in the electrolytic liquid phase through the diffusion equation. Based on the research of Newman and Doyle, Arora [18] established the lithium precipitation model by the Butler-Volmer equation, which is the electrochemical reaction kinetics equation. Brissot and Chazalviel [19, 20] believe that the inhomogeneous distribution of lithium ions forms a concentration gradient of lithium ions on the surface of the negative electrode.
Zhang [21] believed that the electrochemical impedance of the battery changes when lithium precipitation occurs in the battery. The EIS response signal in the low-frequency range represents the Warburg impedance, which is related to the diffusion of lithium ions and is affected by the concentration gradient of lithium ions on the electrode surface. However, the lithium ions on the surface of the negative electrode are consumed when lithium ions are precipitated, and the concentration gradient of lithium ions increases, which causes the change of Warburg impedance.
The classic Warburg impedance model [22] assumes that the redox reaction occurs at the electrode-to-electrolyte interface (EEI). Ion transport is driven only by the concentration gradient, and the governing equation is Fick's second law:

Di represents the diffusion coefficient of the oxidation reaction (i = Ox) and reduction reaction (i = Re), respectively. Ox represents the oxidant, Re represents the reducing agent.
When x = ∞, it means that the concentration away from the EEI does not change; thus,

At the EEI (x = 0), the reactants/products are consumed/formed in the charge transfer reaction, which is approximated by the current density i. Therefore, the diffusion process is expressed as the EEI:

where + is oxidation, - is reduction, F is Faraday's constant, and n is the number of electrons transferred.
Taking the Fourier transform of eq. (3) in the frequency domain yields

where C̃i is the concentration disturbance of i by Fourier transform. In this paper, the variable marked by wavy lines represents the perturbation momentum.
The diffusion impedance corresponding to the oxidant or reducing agent can be written as:

where Zd,i represents the diffusion impedance of substance i, Dd,i represents the diffusion coefficient of substance i, and i can be either an oxidant or a reducing agent. In lithium-ion batteries, n = 1.
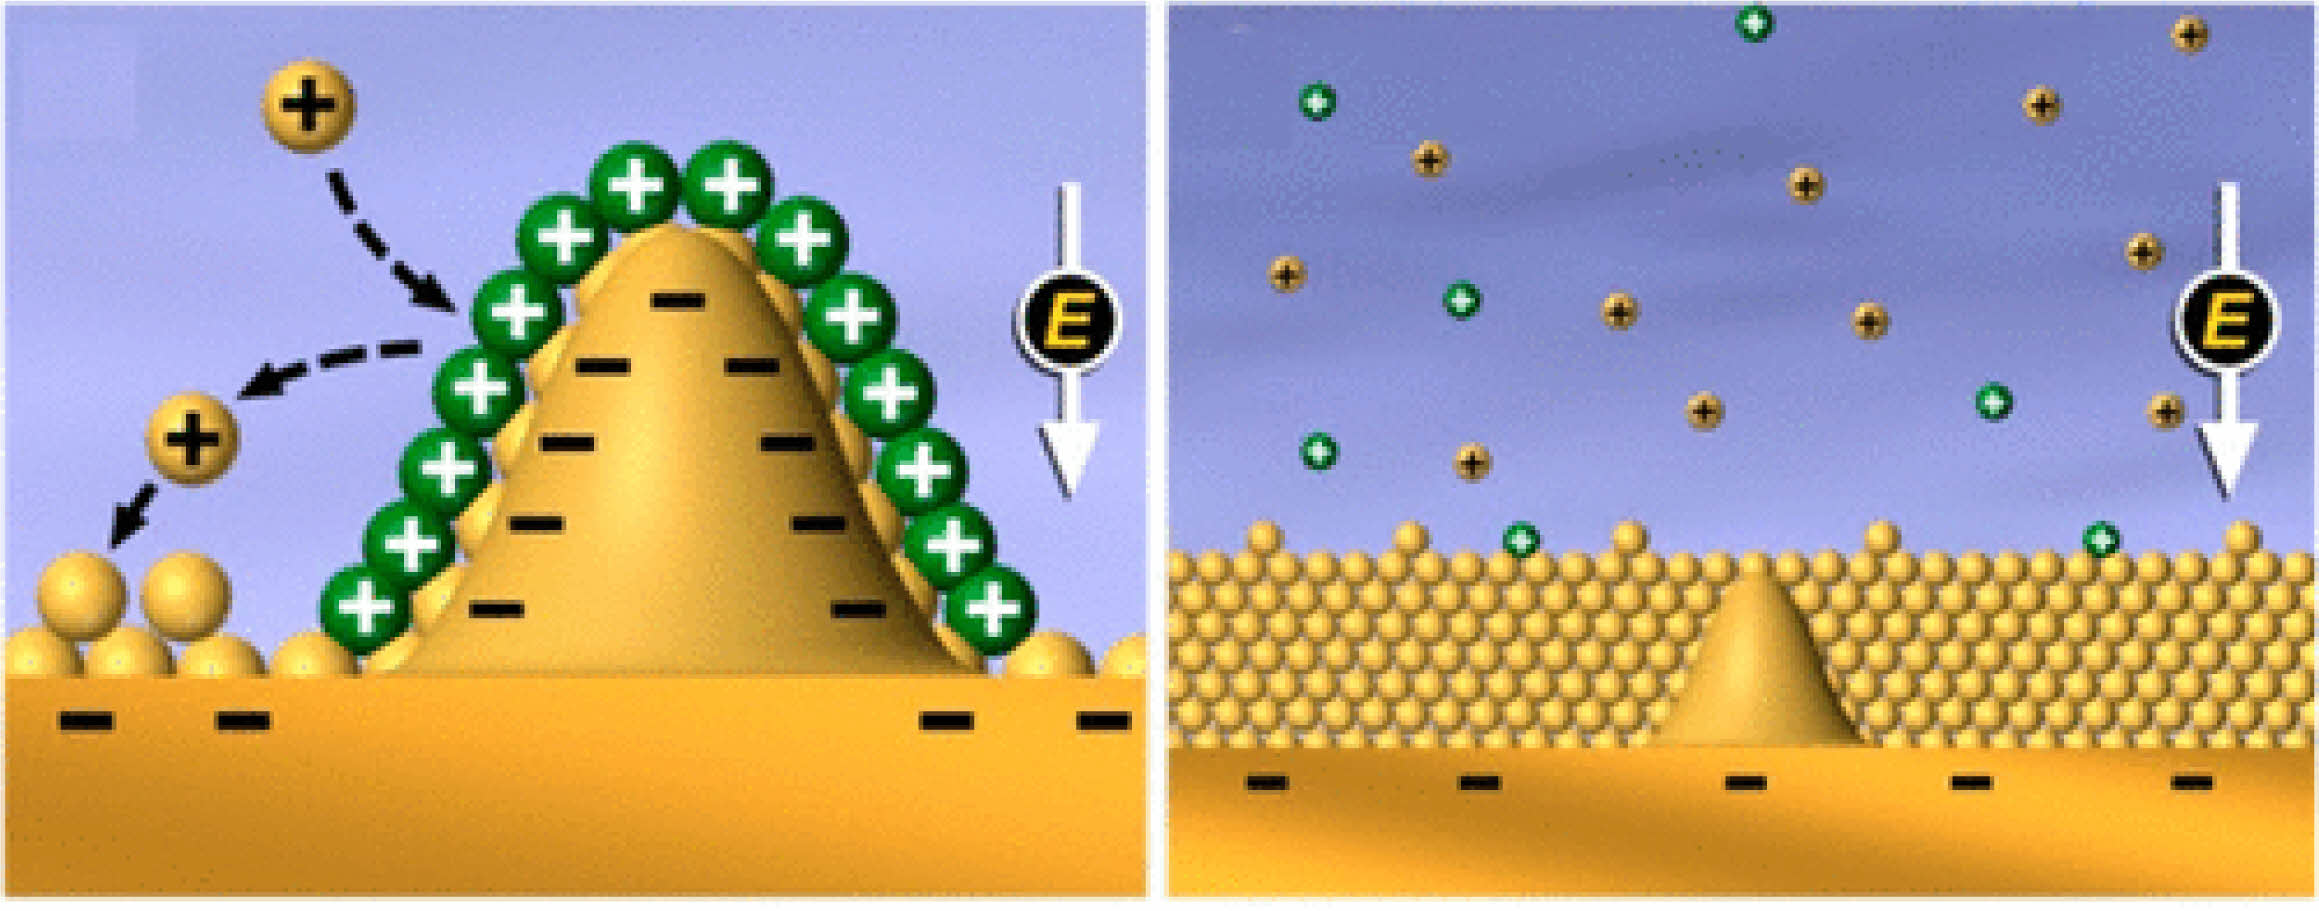
According to the classical Warburg model, the geometry of the electrode active particle is usually assumed to be cylindrical or spherical geometry symmetry [23]. However, lithium precipitation is proved to be conical geometry symmetry [24], as shown in Fig. 1.
Based on the Warburg impedance, the lithium ions diffusion model is extended to conical symmetry. In conic coordinates, the Laplace diffusion equation (3) is expressed as

ci is the concentration of lithium ions, Di is the diffusion coefficient, r is the radial distance in conic coordinates, and t is the time. Suppose ci(r, t) corresponds to (w, r) in the frequency domain, the Fourier transform of (6)

Reduce the equation to standard form:

This is Bessel equation and the general solution is

where  represents the zero-order Bessel function, which is an even function. J0(r) has a maximum of 1 when r = 0, and presents oscillation damping when r = ∞.
 is the second kind of Bessel function, which is also an even function. It diverges at r = 0 and grows exponentially at r = ∞.
The values of A and B are determined through the boundary conditions. C̃i(ω, r) is limited at r = 0, so B = 0. For the diffusion equation in conic coordinates, since the solution at r = 0 is a singular point, the value of Y0(r) approaches infinity. To ensure that C̃i(ω, r) is limited, B must be zero. This is because when B ≠ 0, the solution will be singular, that is, the solution at r = 0 will be infinitely larger, thus not satisfying the physical meaning. So, we have to use the boundary conditions to determine that B = 0.
C̃i(ω, r) is given at r = R, so A is determined by C̃i(ω, r)

Therefore, the concentration of lithium ions is

Substituting (11) into (5), the lithium ions diffusion model in conical symmetry is:

The concentration of lithium ions changes due to lithium precipitation, so the diffusion impedance does. In the application scenario of battery charging, it is almost impossible to estimate Zd,i by measuring C̃i(ω, r). It is necessary to build the relation between the external macro-scale parameters and the internal micro-scale parameters.
Porous electrode model for lithium precipitation
According to the migration equation, the migration of lithium ions in the electrolyte when lithium precipitation occurs can be described as

where ke represents the ionic conductivity of the electrolyte phase, represents the potential of the electrolyte phase, a represents the electrochemical surface area of the porous electrode, and jprecipitation represents the current density of lithium precipitation generated by reaction and transport at the microscale.

According to the assumption of Φ͠s=0, Z precipitation represents the impedance of the lithium precipitation at the microscale.
When x = 0,  = 0. When x = lp,
  . lp represents the diffusion length of lithium ions and japp represents the applied current density. Solving (14), Φ͠e electrolyte phase of the electric potential distribution

The impedance of the porous electrode can be defined as

thus,

where represents the porous electrode structure and ke represents the transport characteristics. Eq. (17) reflects that the lithium precipitation impedance Z precipitation at the microscale is computed by measuring the electrode properties Zpole at the macroscale.
In the high-frequency range, when the value of Z precipitation is very small, eq. (17) transforms to

In the low-frequency range, when the value of Z precipitation is large, eq. (17) transforms to

Eq. (19) shows that the relationship between Z precipitation and Zpole in the low-frequency range is linear, so Z precipitation at the micro-scale can be estimated only by measuring Zpole at the macro scale, which means that the unobservable parameters can be estimated by the observable parameters.
|
Fig. 1 Schematic diagram of lithium deposition at the SEI of a battery [24]. |
According to the phase field equation [25], the phase field variable ξ(r,t)∈[0,1] is introduced in the electrode-electrolyte interface (EEI). The free energy function g(ξ) describes the equilibrium states of electrode ξ = 1 and electrolyte ξ = 0 at zero overpotential:

W represents the ion jumping energy barrier and describes the nonlinear model of the time and space evolution of phase field variables:

where t is the time, R is the universal gas constant, T is the Kelvin temperature and kn is Lh the reaction rate constant. Ls is the interface mobility,is the reaction rate constant, and  represents the electrode reaction that occurs in the EEI.
For diffusion in the electrochemical reaction of lithium-ion batteries, lithium atoms can be considered stationary without diffusion, while the electrochemical reaction takes lithium ions as the source term, reflecting the evolution process of lithium dendrites. Ignoring the effect of anion transport, the following equation can be used

where Deff=Deh(ξ)+Ds(1-h(ξ)), De and Ds indicate the diffusion coefficients of lithium ions in the electrode and electrolyte, respectively. cs is the density of metallic lithium, c0 is the standard volume concentration of electrolytes, c+ is the molar concentration of lithium ions, which is given by the lithium ions diffusion model in eq. (11), and C̃+=C+/C0 represents the dimensionless concentration of lithium ions.
For the electrostatic potential distribution, assuming that the current density complies with the conservation of the Poisson equation, the expression is

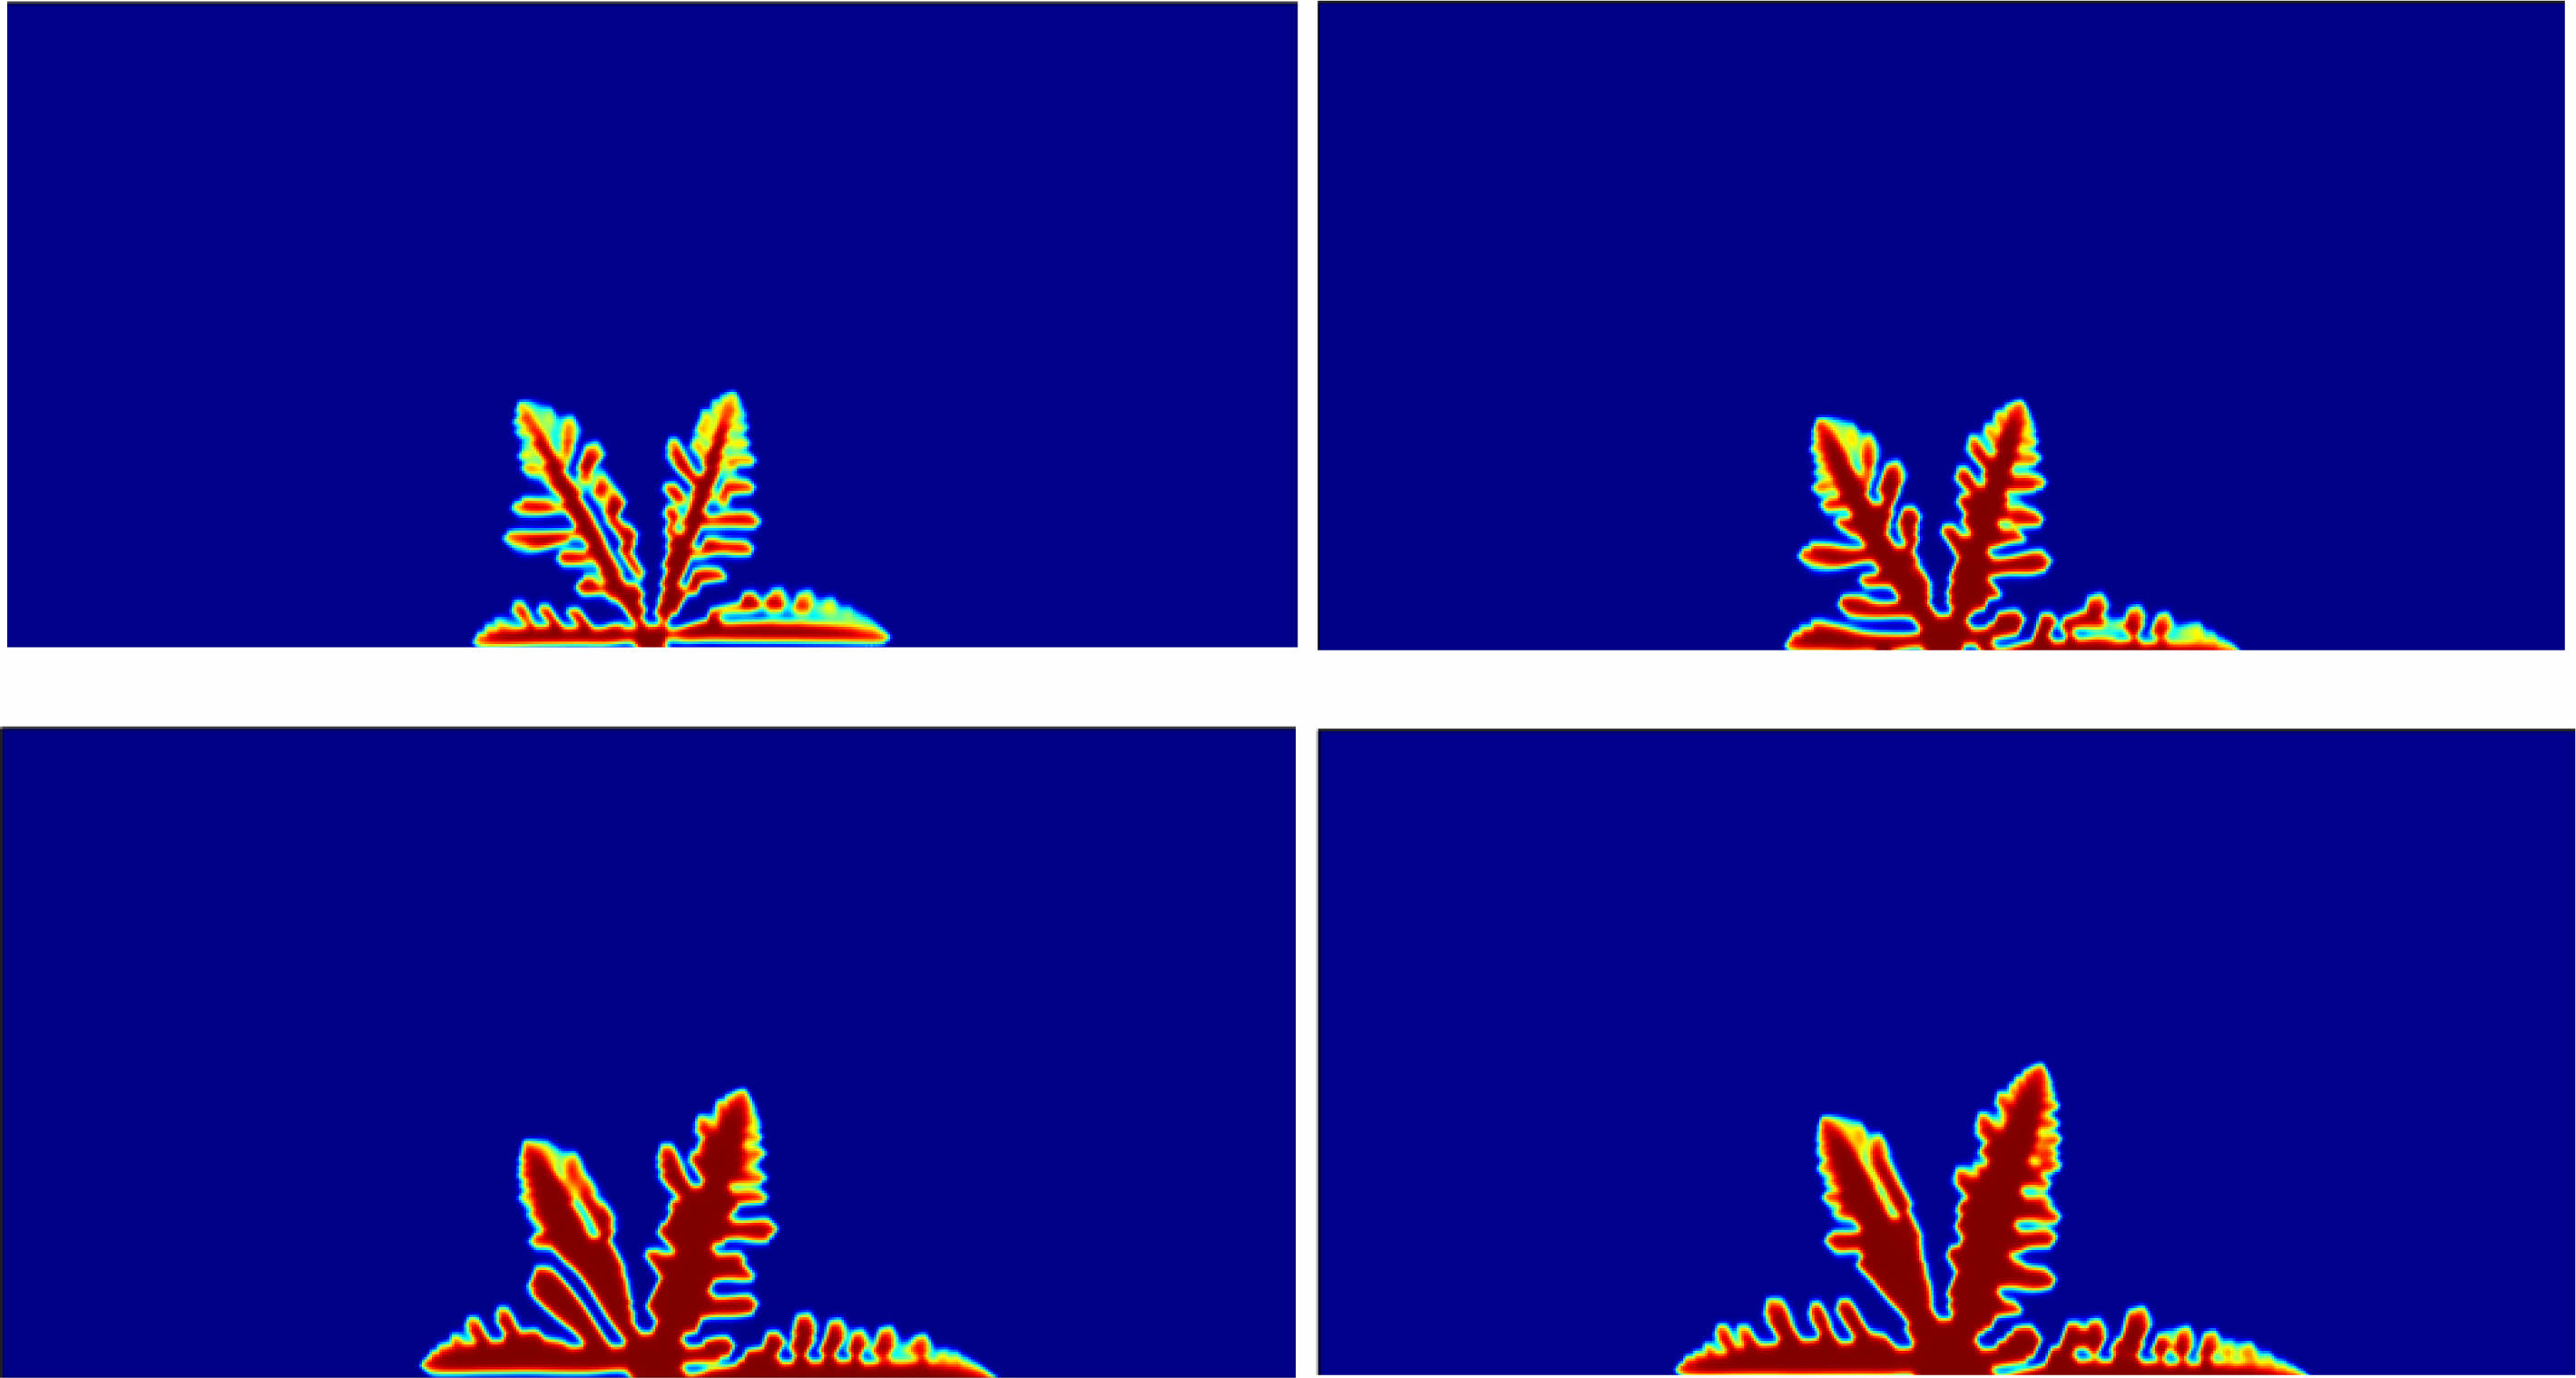
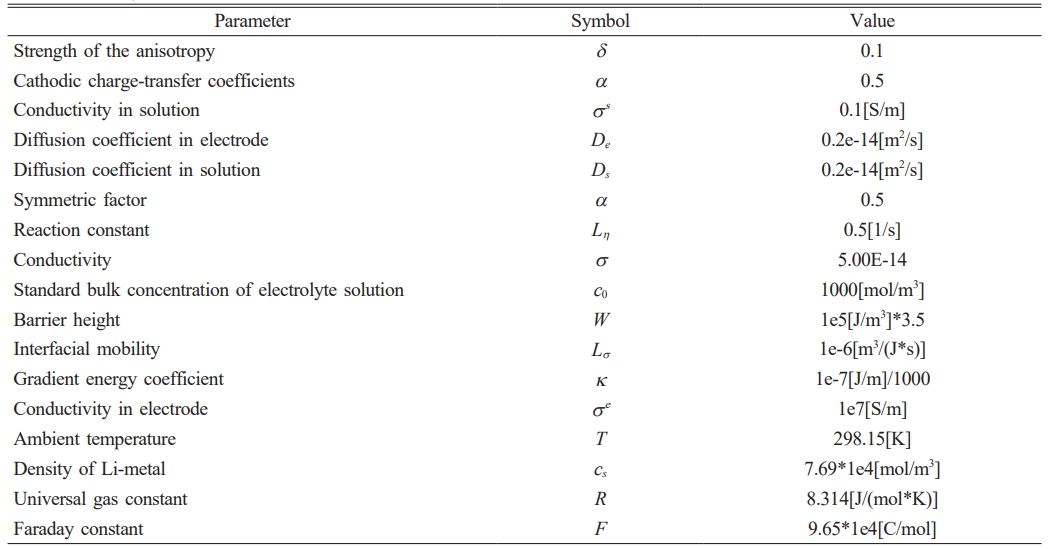
where= σeff=σeh(ξ)+σs(1-h(ξ)), σe and σs and σe and σs are the conductivities of the electrode and electrolyte solution, respectively. The growth of lithium dendrite is shown in Fig. 2 and the values of each parameter are shown in Table 1.
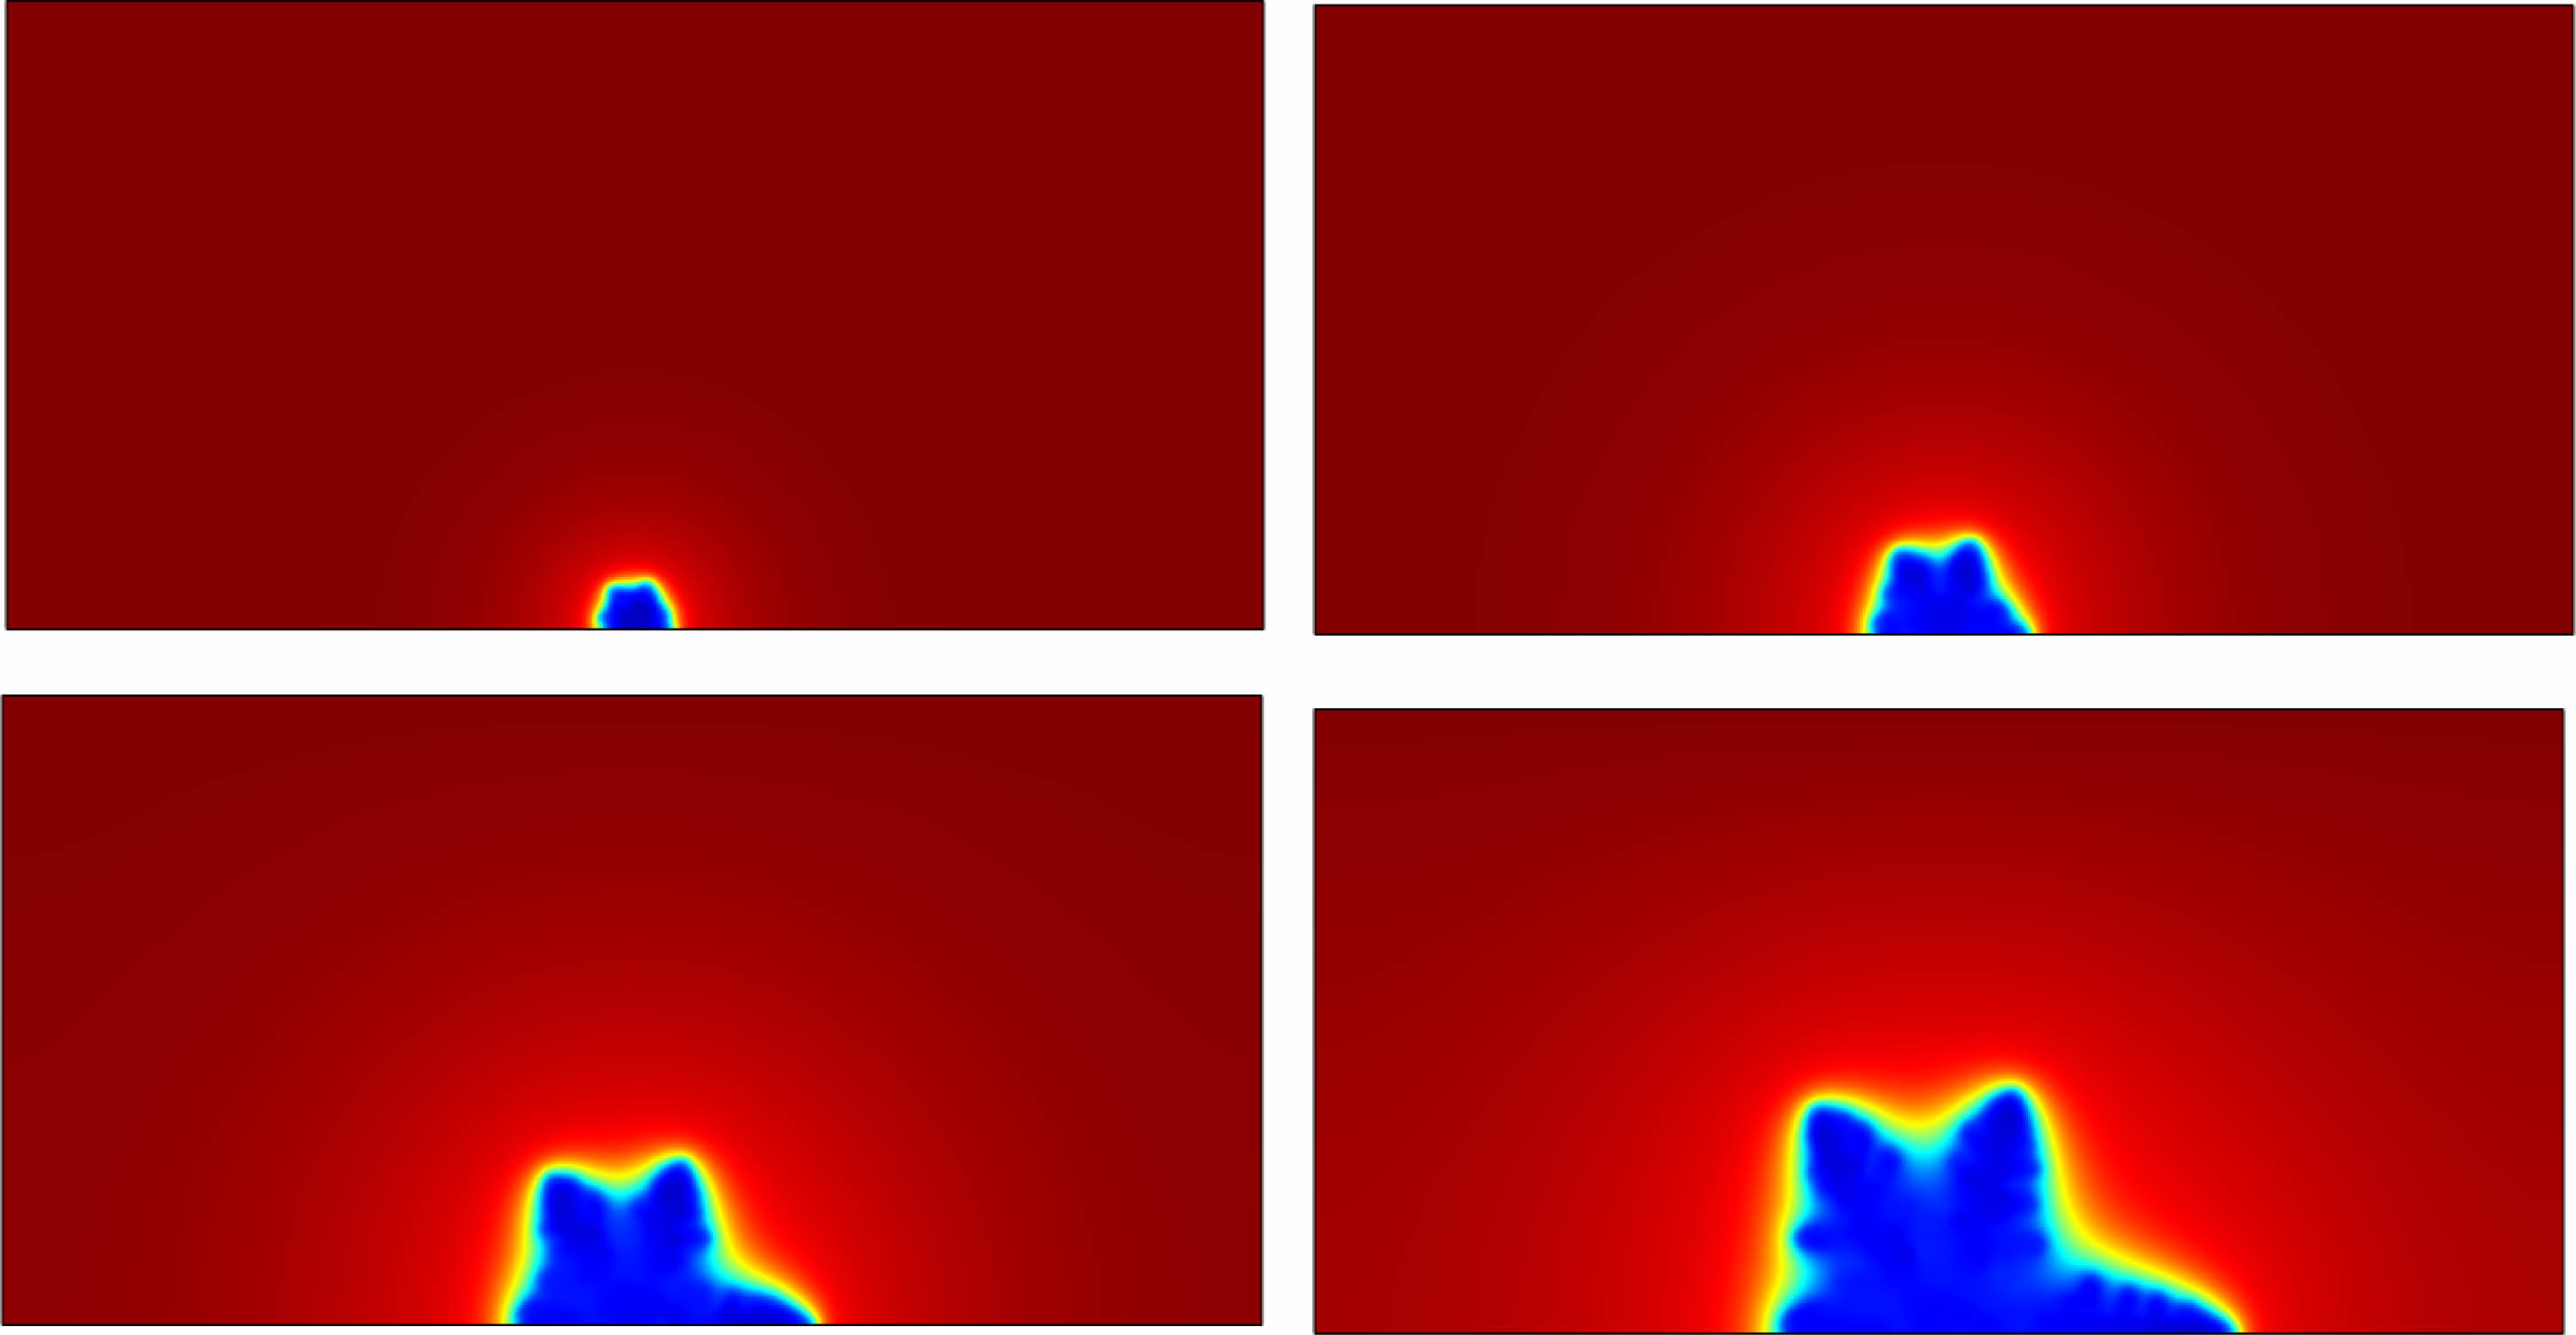
The concentration distribution of lithium ions is shown in Fig. 3. The blue colour represents the relative concentration of lithium ions is 0, and the red colour represents the relative concentration of lithium ions is 1. The relative concentration of lithium ions is 0 inside the lithium dendrites because lithium ions are reduced to lithium metal. The external electrolyte is 1, as it remains in the form of liquid lithium ions. It shows the concentration gradient of lithium ions at the interface between liquid electrolyte and solid lithium dendrites. When lithium precipitation occurs inside the battery, lithium ions tend to accumulate at the protrusion of the electrode surface, so the distribution of lithium ions on the electrode surface is non-uniform, and cause the growth and spread of lithium dendrites.
|
Fig. 2 Process of lithium precipitation. |
|
Fig. 3 Concentration distribution around the lithium precipitates. |
Charging device platform
The main circuit of the charging device is shown in Fig. 4. This is a simple non-isolated Buck/Boost circuit, with an additional set of energy storage capacitors C1, C2, ..., Cn. When charging the battery, MOS2 = OFF, so the boost circuit does not work. MOS1 = HRPWM means that MOS1 is controlled by the high-resolution pulse-width modulation (HRPWM) [26] channel of the MCU. The size of the charging current and the specific frequency AC ripple superimposed on the DC output are controlled by the HRPWM channel of the MCU. When discharging the battery, MOS1 = OFF, so the buck circuit doesn’t work. The MCU controls the operation of the Flyback Transformer so that it does not work. MOS2 works and controls the size of the discharge current.
The charging current is controlled by feedforward and feedback. As shown in Fig. 5.
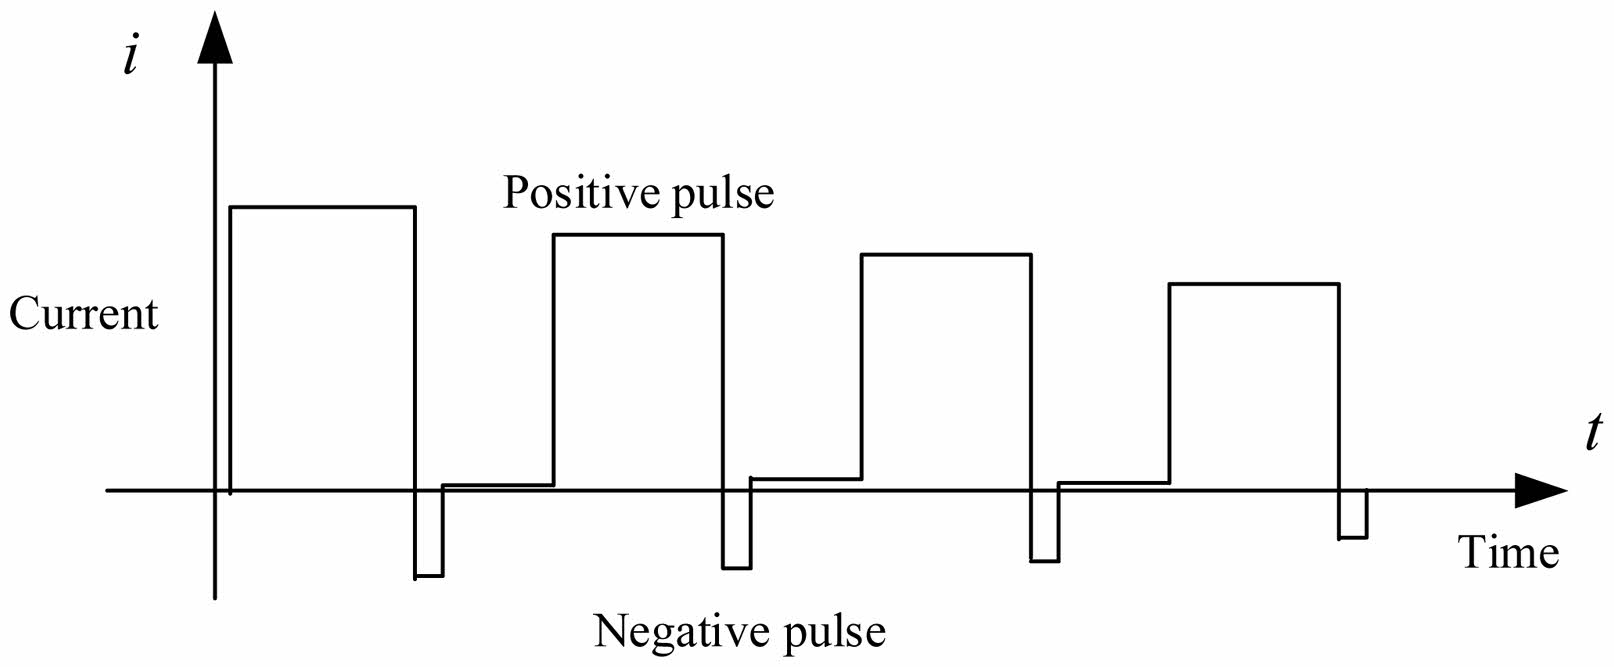
The charge current is controlled by an ideal rectangular pulse waveform as shown in Fig. 6. The scheme of feedforward and nonlinear PI regulator can not only facilitate MCU operation but also reduce the under-modulation or overmodulation of the current waveform.
The optimal charging strategy for the battery employs positive and negative pulse charging, which is known as the Burp charging method [27], as shown in Fig. 4. The Burp charging method both realizes charging and discharging and has three advantages. First, it eliminates the concentration polarization inside the battery and prolongs the battery life. Second, it slows down the formation of lithium dendrites inside the battery. Third, it realizes fast charging.
With the internal temperature increasing inside the battery, the smart charger can optimize charging pulse amplitude and duration in real time. To realize the burp charging, the pulse discharge is designed in the charger. The easiest way is that the discharge of the battery is consumed on the power resistance. The smart charger employs the Boost circuit to realize the discharge energy recovery. When discharging, the MCU stops the flyback transformer, boosts the battery voltage, and stores the electrical energy to the high-voltage electrolytic capacitor set (220 μF/450 V specification). The operating current is controlled by the Boost circuit in the MCU, which is equivalent to the control discharge current.
The discharge current is controlled by hysteresis comparison (Bang-Bang control), as shown in Fig. 7.
There is an analog comparator CMP1 in the MCU. When the feedback discharge current is less than the given value, the FET MOS2 is turned on; when the feedback current is greater than the given value, MOS2 is turned off. The advantage of this simple hysteresis comparison control is that the robustness is strong, and the discharge current waveform can be quickly and accurately controlled and is not affected by changes in the battery.
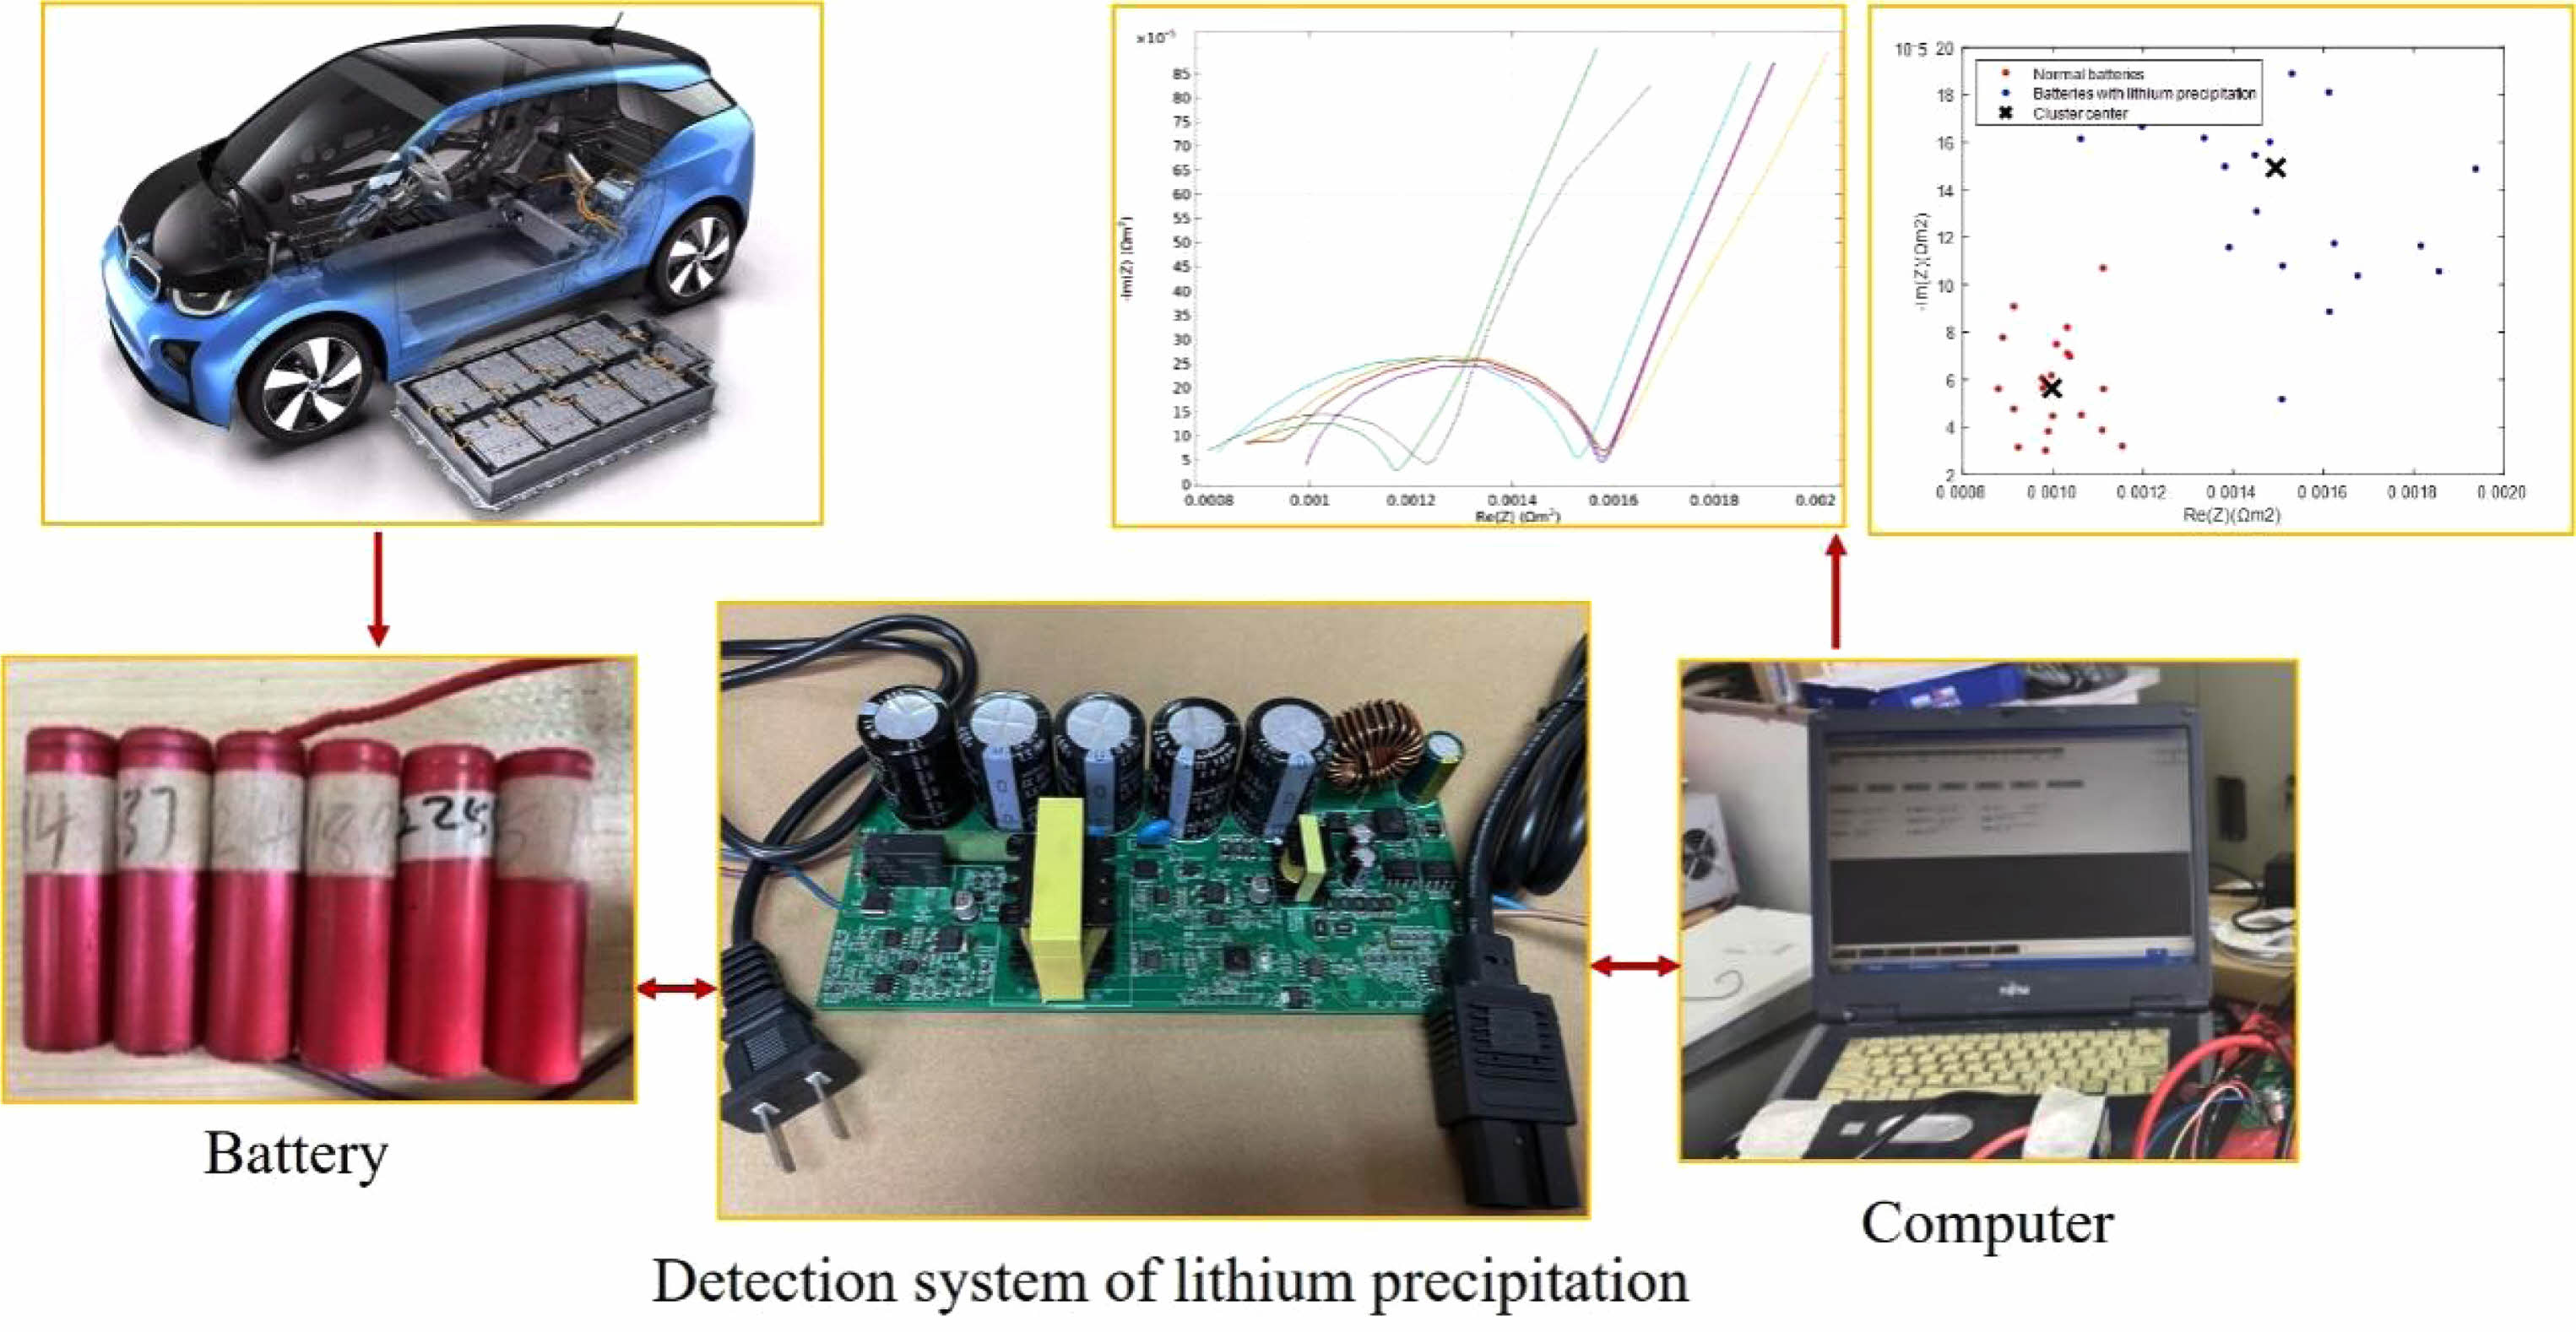
Real-time detection platform of lithium precipitation during the charging process is shown in Fig. 8. The test employs 18650 lithium-ion batteries and the initial rated capacity of the new are all 2600 mA·h. There are six batteries, including normal batteries and batteries with lithium precipitation. It is known that the maximum usable capacity of the six batteries is 703 mA·h, 940 mA·h, 1205 mA·h, 1678 mA·h, 2105 mA·h and 2422 mA·h.
Results and Discussion
According to SOH = Qc/Qnew, where Qc and Qnew represent the maximum usable capacity of the battery and the initial rated capacity of the new battery. Hence SOH of the six batteries are 27.4%, 36.2%, 46.3%, 64.5%, 81.0%, and 93.2% respectively. SOH of the battery is 93.2%, so the battery is taken as the normal one. There exist different degrees of lithium precipitation in some batteries, so SOH of the batteries is 27.4%, 36.2% and 46.3%.
The six batteries are charged with the same high DC current of 1C (3.6 A) superimposed with an identical amplitude sinusoidal voltage wave of 1 Hz. According to the charging current control system in Fig. 5, the output of voltage is set to a fixed value, hence the charging ripple current through the shunt resistance reflects the impedance Zpole of the battery.
Fig. 9(a)-(f) describe the ripple current of the normal batteries and the batteries with lithium precipitation at 1 Hz, corresponding to the capacity of 703 mA·h, 940 mA·h, 1205 mA·h, 1678 mA·h, 2105 mA·h and 2422 mA·h, respectively. When the capacity of the battery with lithium precipitation decreases to 703 mA·h, the ripple current significantly declines, showed in Fig. 9(a).
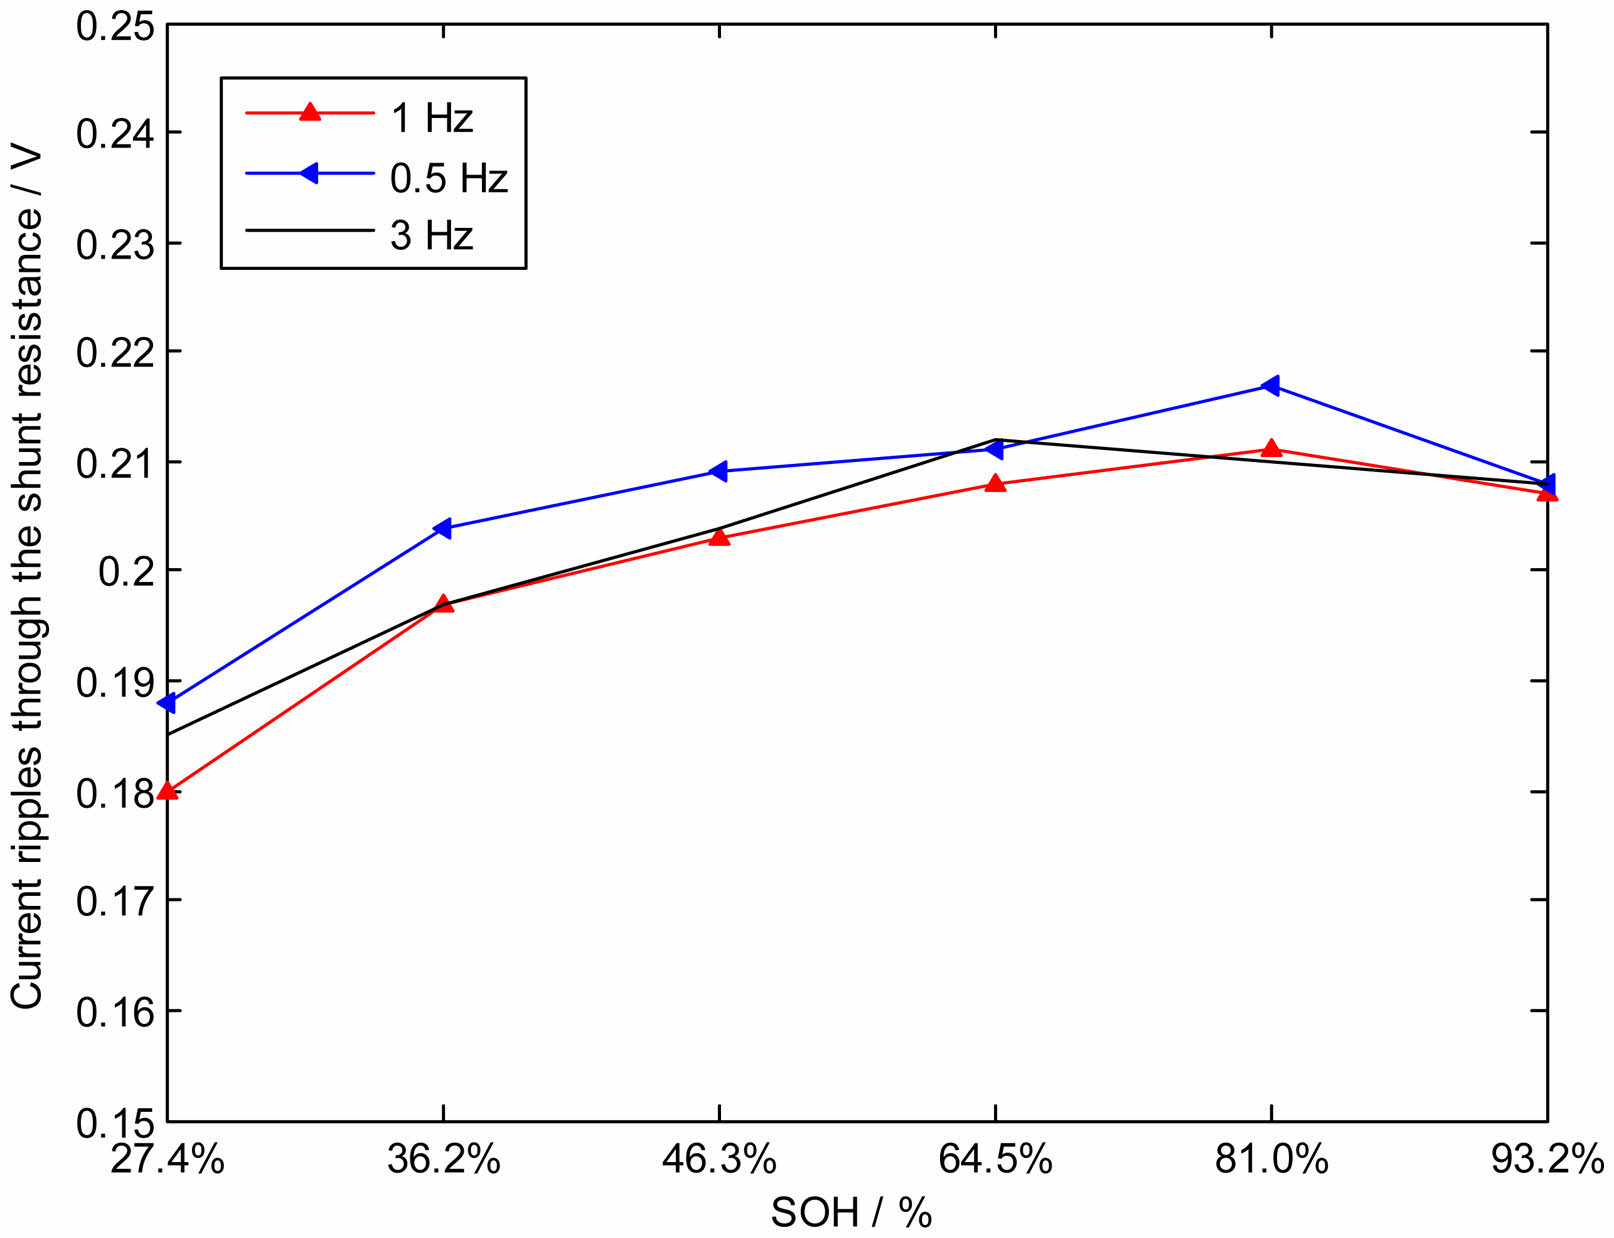
In the low-frequency range, the six batteries are charged with the same high DC current of 1C (3.6 A) superimposed with an identical amplitude sinusoidal voltage wave of 0.5~3 Hz. Fig. 10 displays the mean of the ripple current at the low frequencies of 0.5 Hz, 1 Hz, and 3 Hz. SOH of the normal battery is 93.2%, the mean of the ripple current is high, but the mean of the ripple current decreases significantly when SOH of the battery drops to 27.4% due to lithium precipitation. That is the ripple current decreases when the battery occurs lithium precipitation and SOH declines. The charging ripple current through the shunt resistance reflects the impedance Zpole of different batteries. When the ripple current decreases when SOH of the battery declines due to lithium precipitation, the result indicates that the impedance Zpole of the battery increases due to lithium precipitation. So Z precipitation at the micro-scale is estimated by measuring Zpole at the macro scale.
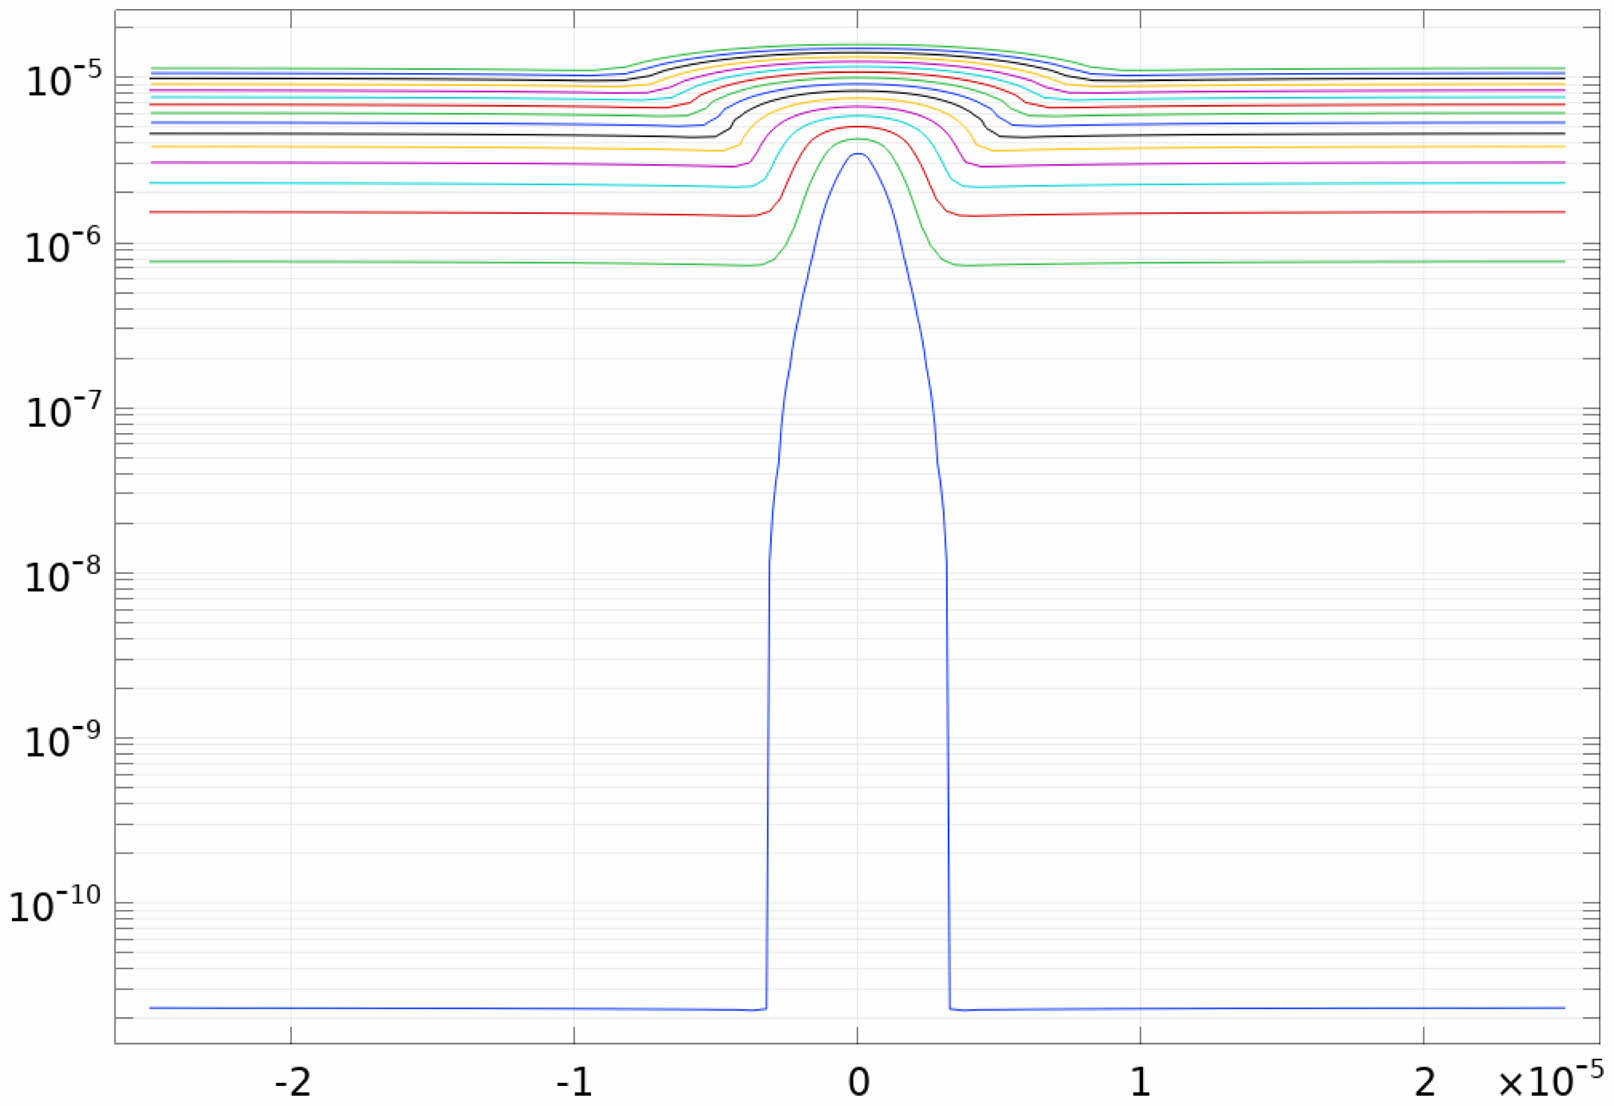
When the lithium ions are reduced to lithium dendrites, the distribution of charge inside the battery changes, so the electric potential around the lithium dendrites changes. In Fig. 11, the potential near the lithium dendrites shows a protruding shape. The distribution of potential away from lithium dendrites is uniform and flat because there is no lithium precipitation and the surface shape of the electrode is relatively flat.
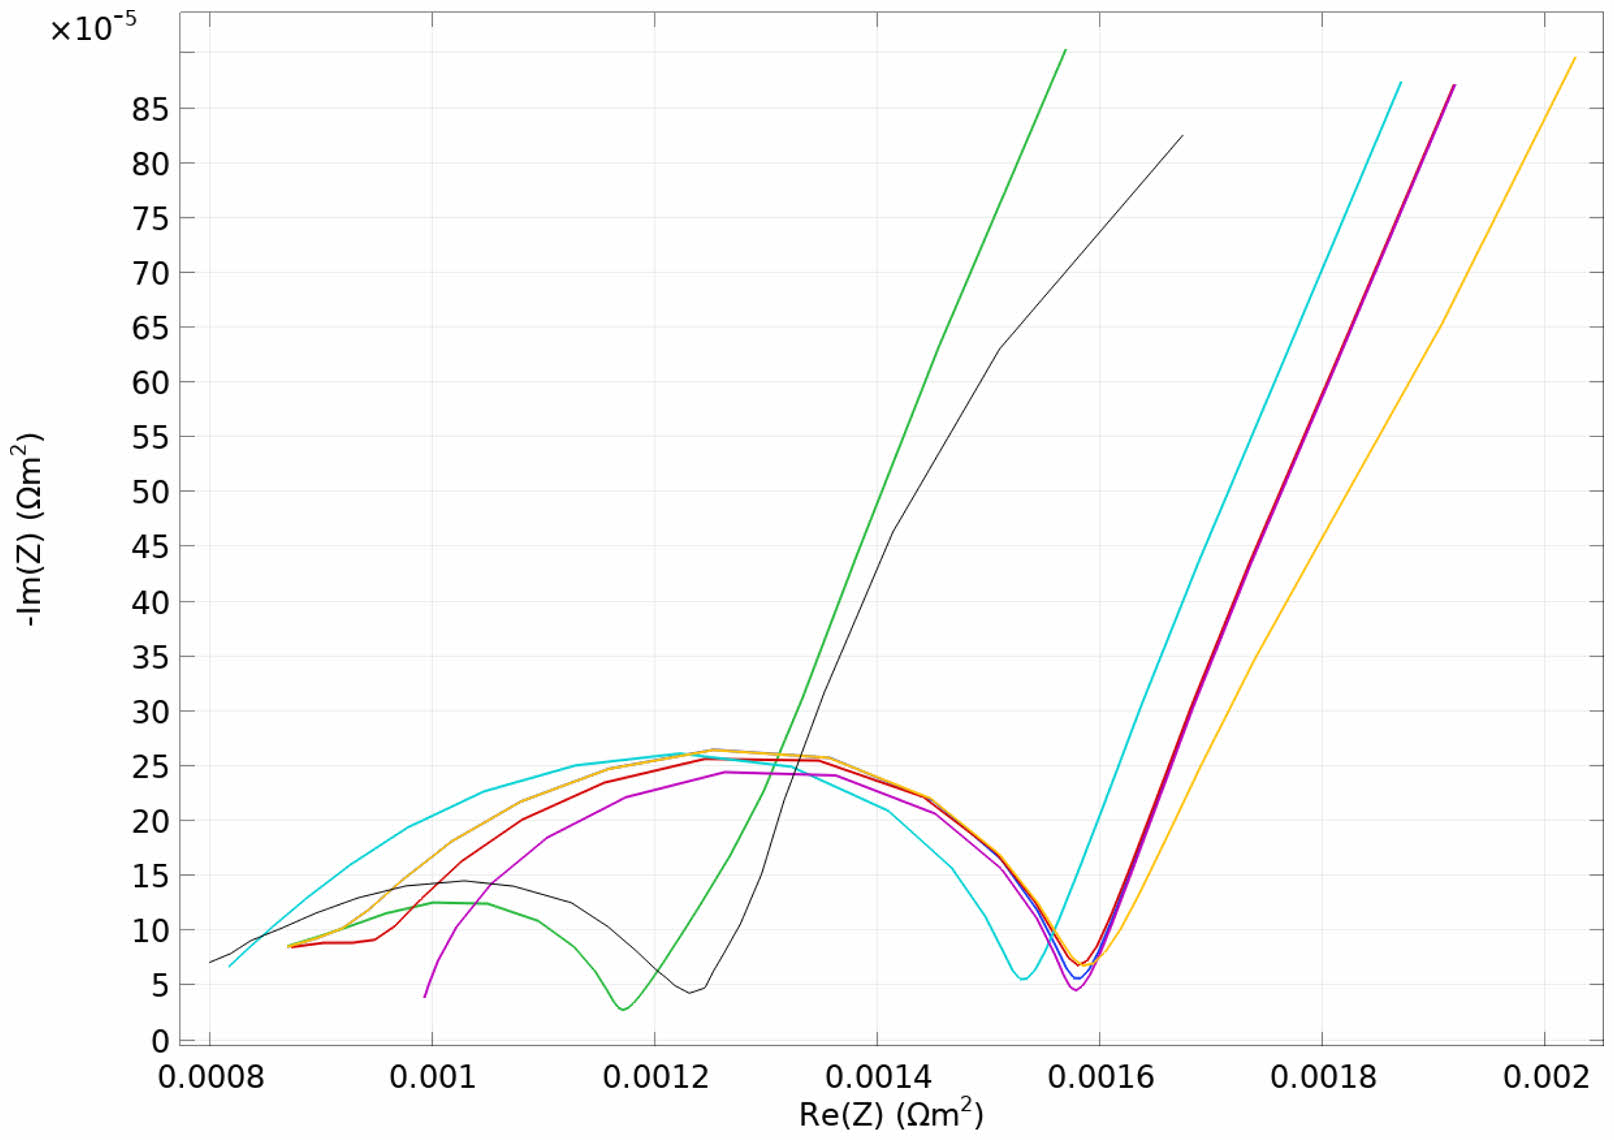
Compared with the normal lithium ions battery (green and black), the impedance spectrum of the battery with lithium precipitation (red, orange, purple, and blue) moves to the low-frequency range, the amplitude value of the impedance spectrum increases significantly, and the impedance spectrum span increases overall, as shown in Fig. 12. When lithium precipitation occurs inside the battery, the diffusion of lithium ions inside the battery is blocked, the diffusion rate of lithium ions slows down and leads the position of the impedance from the high-frequency range to the low-frequency range.
It is easy to distinguish normal batteries from batteries with lithium precipitation through the Linear Discriminant Analysis (LDA), as shown in Fig. 13. The impedances of the normal batteries (red) are distributed at low-value area of impedance and present higher aggregation and better consistency. However, due to lithium precipitation in the battery, the impedances of the batteries with lithium precipitation (blue) present higher values and divergence, which disperse in the cluster center. It is easy to distinguish the occurrence of lithium precipitation by measuring Zpole in the low-frequency range.

|
Fig. 4 Main circuit of the charging device. |

|
Fig. 5 Charging current control. |
|
Fig. 6 Schematic diagram of Burp charging method. |

|
Fig. 7 Discharge current Bang-Bang control diagram. |
|
Fig. 8 Real-time detection platform of lithium precipitation during the charging process. |

|
Fig. 9 Charging ripple current of different batteries at 1 Hz, (a)-(f) corresponding to the capacity of 703 mA·h, 940 mA·h, 1205 mA·h, 1678 mA·h, 2105 mA·h and 2422 mA·h, respectively. |
|
Fig. 10 Mean of ripple current at the low frequencies of 0.5 Hz, 1 Hz and 3 Hz. |
|
Fig. 11 Potential distribution near lithium dendrites. |
|
Fig. 12 Comparison between normal battery (green and black) and batteries with lithium precipitation (red, orange, purple, and blue). |
|
Fig. 13 Impedance distribution of the normal battery (red) and the battery with lithium precipitation (blue). |
In this paper, real-time detection of lithium precipitation integrated with the charging device is presented. Since the morphology and structure of the electrode surface are altered when lithium precipitation occurs, it is impossible to measure the concentration of lithium ions and observe the lithium dendrites inside the battery in the application scenario. It is significant to establish the relationship between the internal parameters at the micro-scale and the external variables at the macro scale. First, according to conical symmetry is in the battery with lithium precipitation, the diffusion model of lithium ions based on the Warburg model is extended to conical symmetry. Second, to measure the internal parameters inside the battery at the microscopic scales by the external variable at the macroscopic scales, the porous electrode model for lithium precipitation is created. Third, the detection method of lithium precipitation is integrated with the charging device, so real-time detection is implemented for the application scenario.
The integration of real-time lithium precipitation detection method can help detect thermal runaway or internal short circuits, thereby improving the safety of battery systems. By identifying and addressing degradation early, real-time detection can extend the operational life of batteries, reducing the need for frequent replacements. By reducing waste through more efficient battery management, real-time detection can contribute to a lower environmental footprint. Early detection of issues can prevent catastrophic failures, reducing repair and replacement costs, and potentially lowering insurance premiums for battery systems. The data generated by real-time detection systems can drive further innovation in battery technology, leading to more efficient and robust designs. In the future, to achieve continuous monitoring of battery performance, historical data will be gathered through a combination of data acquisition systems and cloud platforms. By establishing a correlation between the characteristics of this data and SOH of the batteries, it will be possible to predict their performance. This approach will enable proactive management and maintenance, ultimately enhancing the longevity and reliability of battery systems.
This work was supported in part by the Natural Science Foundation of Guangdong Province under Grant 2015A010106005.
- 1. P. Dong, J.B. Zhang, and Z.P. Wang, Journal of Automotive Safety and Energy Efficiency. Res 12[4](2021) 570-579 (Chinese)
- 2. J.C. Burns, D.A. Stevens, and J.R. Dahn, J. Electrochem. Soc. Res 162[6] (2015) 959-964.
-

- 3. S. Schindler, M. Bauer, M. Petzl, and M. A.Danzer, J. Power Sources. Res. 304[2] (2016) 170-180.
-

- 4. Y. Zhou, Z. Deng, and Z. Y. Huang, Journal of Ceramics. Res 50[1] (2022) 84-100. (Chinese)
- 5. S. Tao, M. Li, M. Lyu, L. Ran, R. Wepf, and I. Gentle, Nano Energy. Res. 96 (2022) 107083.1-107083.27.
-

- 6. S. Dayani, H. Markoetter, and A. Schmidt, J. Energy Storage, Res. 66[8] (2023) 107453.1-107453.9.
-

- 7. Henry A. Cortés, and H.R. Corti, Ultramicroscopy. Res. 230[11] (2021) 113369-113377.
-

- 8. G.M. Zhao, W. Xu, and Y.F. Wang, Automotive Innovation. Res. 6[4] (2023) 611-621.
-

- 9. S. Schindler, M. Bauer, M. Petzl, and M.A. Danzer, J. Power Sources. Res. 304[2] (2016) 170-180.
-

- 10. N. Schweikert, A. Hofmann, M. Schulz, M. Scheuermann, S.T. Boles, and T. Hanemann, J. Power Sources, Res. 228[4] (2013) 237-243.
-

- 11. C. Chen, H. Zhang, W. Shi, W. Zhang, and Y. Xue, Environ Modell Softw. Res. 163[5] (2023) 1-12.
-

- 12. R. Akolkar, J. Power Sources, Res. 232[6] (2013) 23-28.
-

- 13. A. Aryanfar, D.J. Brooks, and B.V. Merinov, Phys. Chem. Chem. Phys. Res 17[12] (2015) 8000-8005.
-

- 14. A. Aryanfar, D. Brooks, B.V. Merinov, W.A. Goddard III, A.J. Colussi, and M.R. Hoffmann, J. Phys. Chem. Lett. Res. 5[10] (2014) 1721-1726.
-

- 15. M. Doyle, F.F. Thomas, and J.S. Newman, J. Electrochem. Soc. Res. 140[6] (1993) 1526-1533.
-

- 16. M. Doyle, A.S. Gozdz, C.N. Schmutz, J.M. Tarascon, and J.S. Newman, J. Electrochem. Soc. Res. 143[6] (1996) 1890-1903.
-

- 17. Z. Chen, D.L. Danilov, R.A. Eichel, and P.H.L. Notten, Adv. Energy Mater. Res 12[32] (2022) 2201506.1-2201506.39.
-

- 18. P. Arora, M. Doyle, and A.S. Gozdz, J. Power Sources, Res. 88[2] (2000) 219-231.
-

- 19. M. Rosso, C. Brissot, and A. Teyssot, Electrochimica Acta, Res. 51[25] (2006) 5334-5340.
-

- 20. C. Brissot, M. Rosso, and J.N. Chazalviel, J. Power Sources, Res. 81[9] (1999) 925-929.
-

- 21. L. Su, J. Zhang, J. Huang, H. Ge, Z. Li, and F. Xie, J. Power Sources. Res 315[5] (2016) 35-46.
-

- 22. S. Cruz-Manzo, and P. Greenwood, Journal of Energy Storage, Res. 55[11] (2022) 701-714.
-

- 23. J. Huang, Electrochimica Acta, Res 281[8] (2018) 170-188.
-

- 24. M.D. Tikekar, S. Choudhury, Z. Tu, and L.A. Archer, Nat. Energy, Res. 1[9] (2016) 16114.
-

- 25. D.R. Ely, A. Jana, and R.E. Garcia, J. Power Sources. 272[12] (2014) 581-594.
-

- 26. J. Ning, B. Xiao, Wenhui Zhong, Bin Xiao, Measurement, Res. 189[2] (2022) 110502.
-

- 27. F. Ding, W. Xu, G.L. Graff, J. Zhang, M.L. Sushko, and X. Chen, J. Am. Chem. Soc. Res. 135[11] (2013) 4450-4456.
-

 This Article
-
2024; 25(5): 842-852
Published on Oct 31, 2024
- 10.36410/jcpr.2024.25.5.842
- Received on Jul 4, 2024
- Revised on Jul 29, 2024
- Accepted on Jul 31, 2024
 Services
- Abstract
introduction
theory
lithium precipitation simulation
experimental setups
conclusion
- Acknowledgements
- References
- Full Text PDF
Shared
 Correspondence to
- Bing Xiao
-
College of Automation Science and Engineering, South China University of Technology, Guangzhou, China
Tel : +86-020-87118500 - E-mail: aubxiao@scut.edu.cn


 Copyright 2019 International Orgranization for Ceramic Processing. All rights reserved.