- Eu2O3-doped transparent glass-ceramics containing nanoscale crystals for tunable Blue-to-Red photoluminescence
Yeonju Kim and Seunggu Kang*
Department of Advanced Material Engineering, Kyonggi University, Suwon, Kyonggi-do, 16227, Korea
This article is an open access article distributed under the terms of the Creative Commons Attribution Non-Commercial License (http://creativecommons.org/licenses/by-nc/4.0) which permits unrestricted non-commercial use, distribution, and reproduction in any medium, provided the original work is properly cited.
This study focuses on manufacturing transparent Y2O3-Al2O3-B2O3 (YAB) glass-ceramics with excellent Photoluminescence (PL) characteristics and controlling tunable PL properties from blue to red through Eu3+ doping. The YAB glass-ceramics was manufactured by nucleating at the maximum nucleation temperature (TI) of 784 ℃ and subsequently undergoing crystalline growth for 5 minutes to 4 hours at 900 ℃ to produce transparent glass ceramics. All processed samples exhibited Al4B2O9 crystal phases, especially with a short 5 min heat treatment, resulting in Al4B2O9 crystal phases below 590 nm, leading to optical transmittance levels similar to those of the parent glass. Moreover, PL analysis of Eu3+ ion-doped glass-ceramic samples revealed emissions at 592, 613, and 701 nm under UV excitation, with the 613 nm light exhibiting the main peak, and its intensity increasing with the Eu3+ ion doping amount. Additionally, through Commission International de l’Eclairage (CIE) coordinate analysis, it was observed that as the Eu3+ ion doping amount increased, the overall emission shifted from blue to red. This study demonstrates the successful fabrication of YAB glass-ceramics with transparency and superior PL characteristics, as well as effective control of luminescent properties through a 2-step processing method and Eu3+ ion doping.
Keywords: Glass-ceramic, Nano-crystal, Photoluminescence, Eu3+-doping, Al4B2O9.
Glass-ceramics are crystalline materials obtained by controlling the nucleation and crystallization heat treatment process of glass. The presence of more nuclei for crystal growth allows for more effective control of the microstructure [1-3]. Glass-ceramics offer the advantages of oxide glasses, including chemical durability and ease of shaping, making them increasingly applied across various fields [4, 5]. However, the emergence of crystalline phases in glass typically amplifies light scattering and diminishes transmittance, constraining its utility in optical materials [6, 7]. Consequently, there is active research on transparent glass-ceramic production. Achieving high transparency in glass-ceramics necessitates forming crystals smaller than the wavelength of light or with a refractive index akin to that of the glass matrix [7-11].
Recently, there has been an increasing demand for the fabrication of glass-ceramics with not only chemical durability, excellent thermal and optical properties but also high transparency to be applied to optical devices such as optoelectronics, optical gratings, and optical fibers [12, 13]. In general, borate glass exhibits transparency in a wide wavelength range from infrared to ultraviolet due to the characteristics of B2O3 that cause a decrease in refractive index and an increase in electronic band gap [12, 14].
Borate-based glass-ceramics are known to have low energy barriers for the substitution reaction of rare earth ions, making it easy for the added rare earth ions to invade the lattice. As a result, the ion density that becomes the luminescent center inside the lattice and traps can increase, leading to improved luminescence efficiency [15]. Furthermore, alumino-borate glass, which is borate-based glass composition with added Al2O3, is known for its excellent mechanical properties, chemical stability, and optical characteristics. Studies such as those by S. Bruns et al. have reported that adding Al2O3 to alkali borosilicate glasses enhances crack resistance and improves mechanical properties compared to borate glasses without alumina addition [16]. Additionally, E. Demirkesen et al. have shown that increasing the amount of Al2O3 enhances the chemical stability of glass in acidic or alkaline environments [17]. Moreover, due to the similarity in ionic radius (0.54 Å) and coordination number (6 oxygen atoms) of Al3+ ions with most rare-earth ions, alumino-borate glasses are known to enhance the solubility of rare-earth ions, thereby exhibiting superior optical properties [18, 19]. The Al4B2O9 crystalline phase in Y2O3-Al2O3-B2O3 glass-ceramics consists of 53% AlO6 and 47% AlO4 structures. AlO6 octahedral positions facilitate substitutions with rare-earth elements [18, 20]. This crystal structure enables easy incorporation of rare-earth ions, leading to diverse luminescent properties [15, 18]. In particular, europium doping at low concentrations can maintain transparency while exhibiting luminescent properties. However, at high concentrations, it can reduce optical transmittance, making the doping concentration a crucial factor for applications in optical devices and sensors [21]. Additionally, this enables various practical applications such as in lighting, display technologies, and optical devices.
This study focused on fabricating Y2O3-Al2O3-B2O3 glass-ceramics containing the Al4B2O9 crystalline phase and analyzing their optical properties alongside microstructural alterations. Luminescent properties were further investigated with varying doping concentrations of Eu2O3. Transparent glass-ceramics were produced by controlling thermal processing conditions to achieve nano-sized crystalline phases.
In this study, parent glass was manufactured using Y2O3 (99.99%, Tech Plus Co., Ltd., Republic of Korea), Al2O3 (99.99%, Kojundo Chemicals, Ltd., Japan), B2O3 (99.99%, Kojundo Chemicals, Ltd., Japan). The batch composition was 20Y2O3-15Al2O3-65B2O3 (mol%), and Eu2O3 (99.99%, Kojundo chemicals, Ltd., Japan) was doped within the range of 0.01 to 0.5 mol%. The oxide materials underwent a 12-hour ball milling process with zirconia balls (diameter of 5 mm and 20 mm) to achieve thorough mixing based on the mixing ratios. Next, they were melted at 1450 °C for 1 h in an alumina crucible. The melt was then poured into a graphite mold preheated to 400 °C and annealed for 1 h to manufacture the glass.
To analyze the thermal characteristics of the manufactured parent glass, the glass was ground to sizes below 45 μm, and then differential thermal analysis (DTA) was performed using a heating rate of 10 °C/min with a DTA instrument (STA 409PC - QMS 403C, Netzsch, Germany). X-ray Diffraction (XRD) analysis was conducted to confirm the crystalline phase of the manufactured glass-ceramics, utilizing the XRD equipment (X'pertpro, Pan'alytical, Netherlands). After etching the glass in a 3 wt% solution of HF for 5 s, the microstructure of the glass surface was observed using scanning electron microscopy (SEM, Nova Nano SEM450, FEI Company, USA).
After the glasses were polished to 2.5 mm, their transmittance was analyzed using a UV-ViS spectrophotometer (UV-ViS spectrophotometer, Kontron UVIKON 941, Germany) in the wavelength range 300-800 nm, which encompasses the visible range. The luminescent properties of the specimens were measured using photoluminescence (PL) at room temperature in the wavelength range of 380 to 780 nm, utilizing a 500W xenon lamp as the excitation source (PSI, Darsa-5000). To analyze the color of the emitted light comprehensively, Commission Internationale de l'Eclairage (CIE) color coordinates were employed.
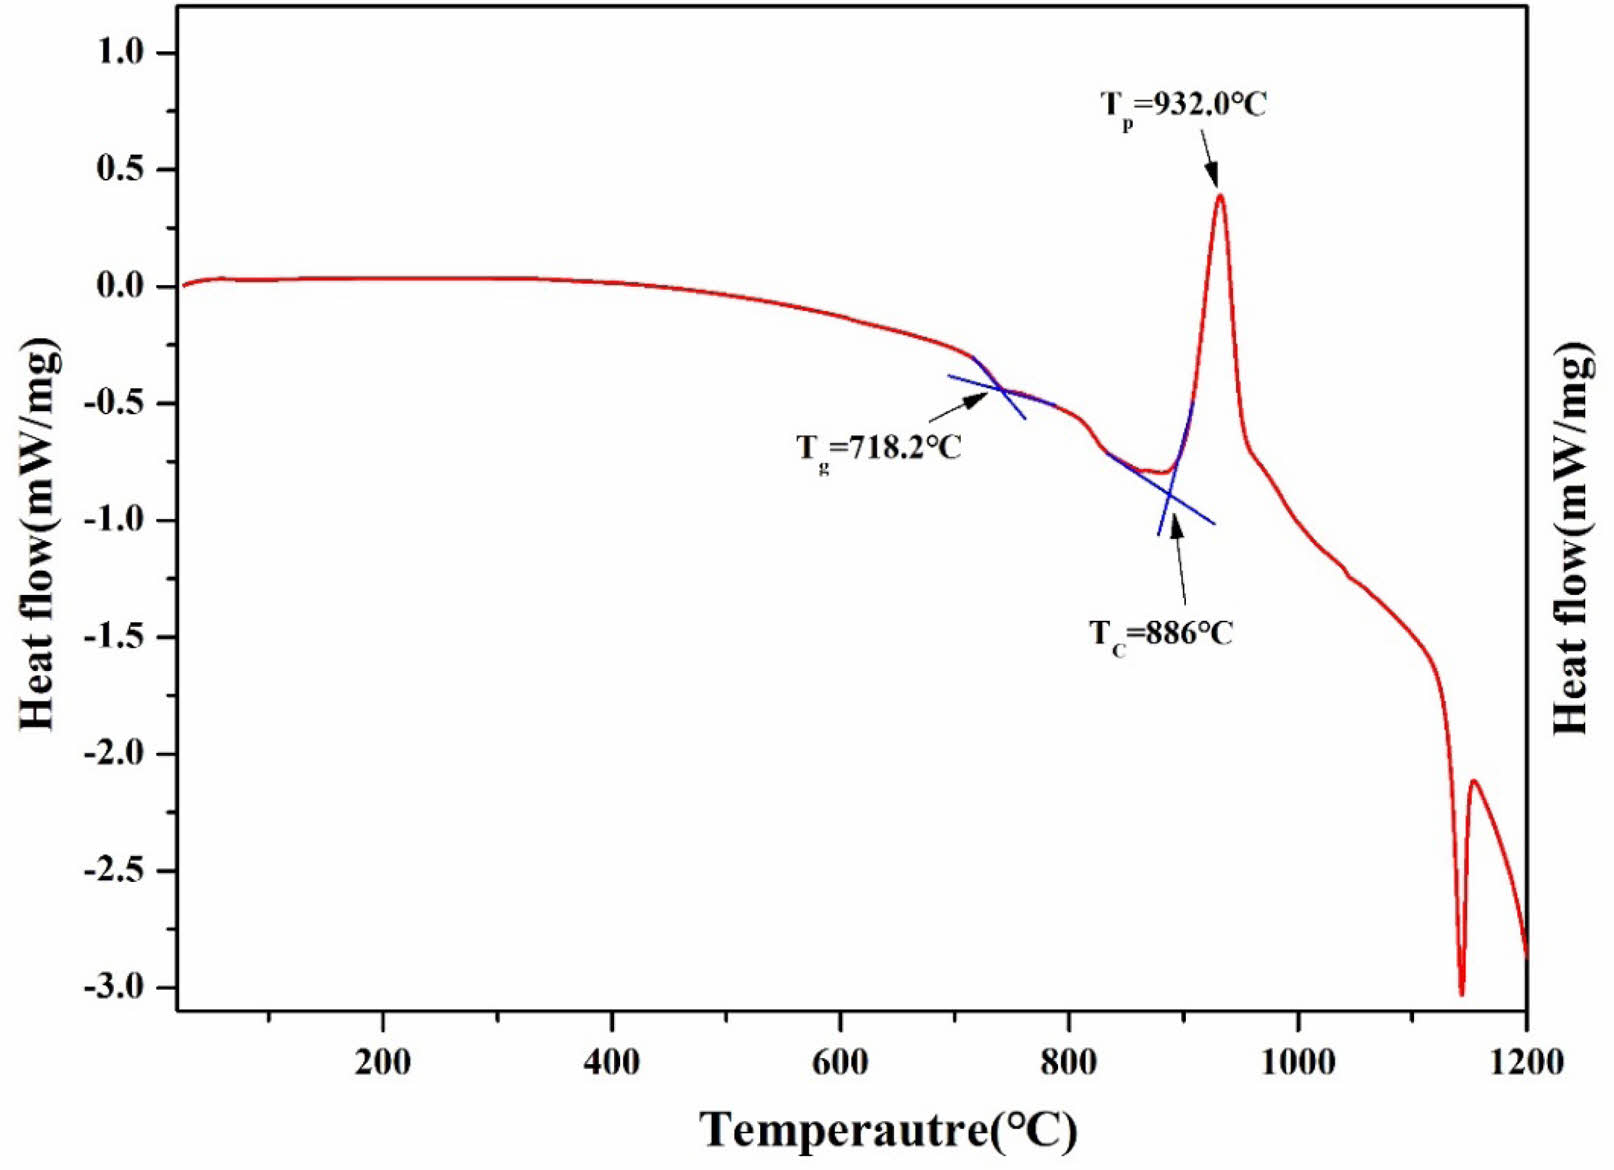
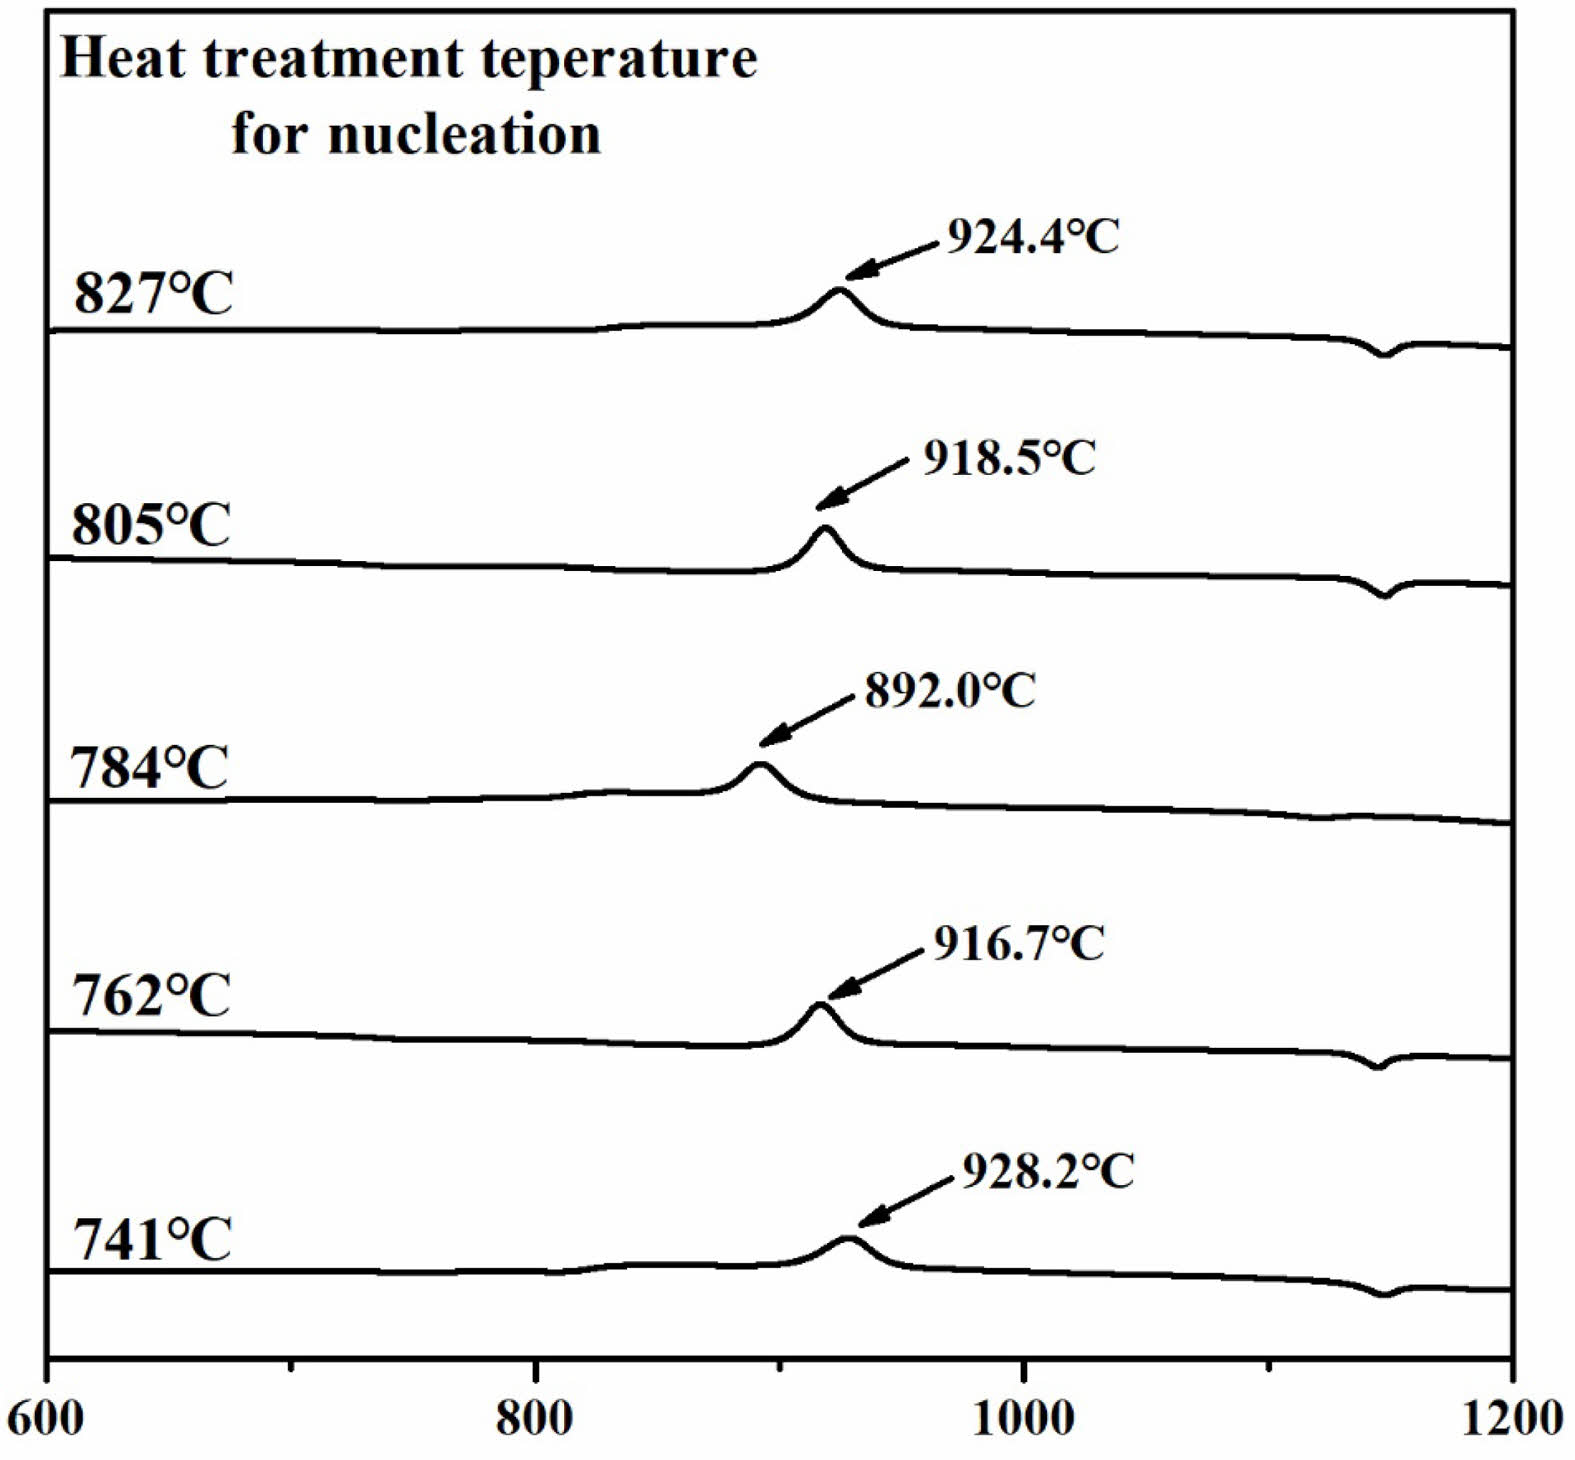
Fig. 1 illustrates the DTA analysis results of the parent glass to establish the heat treatment protocol. The glass transition temperature (Tg) was measured at 718.2 °C, while the crystal growth initiation temperature (Tc) and the maximum crystal growth temperature (Tp) were found to be 886.0 °C and 932.0 °C, respectively. To determine the optimal nucleation temperature, five temperatures ranging from 741 °C to 827 °C within the Tg to Tc range were selected. Subsequently, heat treatment was conducted for 12 hours at each selected temperature for the parent glass. After that, DTA analysis was performed on the five heat-treated specimens, and the results are shown in Fig. 2.
The DTA analysis results showed that in the specimen group heat-treated within the range of 741 ℃ to 784 ℃, the exothermic peak temperature gradually decreased as the heat treatment temperature increased. Conversely, in the specimen group heat-treated within the range of 784 ℃ to 827 ℃, the exothermic peak temperature increased with higher heat treatment temperatures. In the DTA analysis graph of the glass, the exothermic peak indicates crystallization. Samples with abundant nuclei formation facilitate crystal growth, resulting in a lower maximum crystal growth temperature (Tp) [22]. Therefore, the specimen with the lowest crystal growth temperature, 784 ℃, was selected, as the maximum nucleation temperature (Tc) for heat treatment.
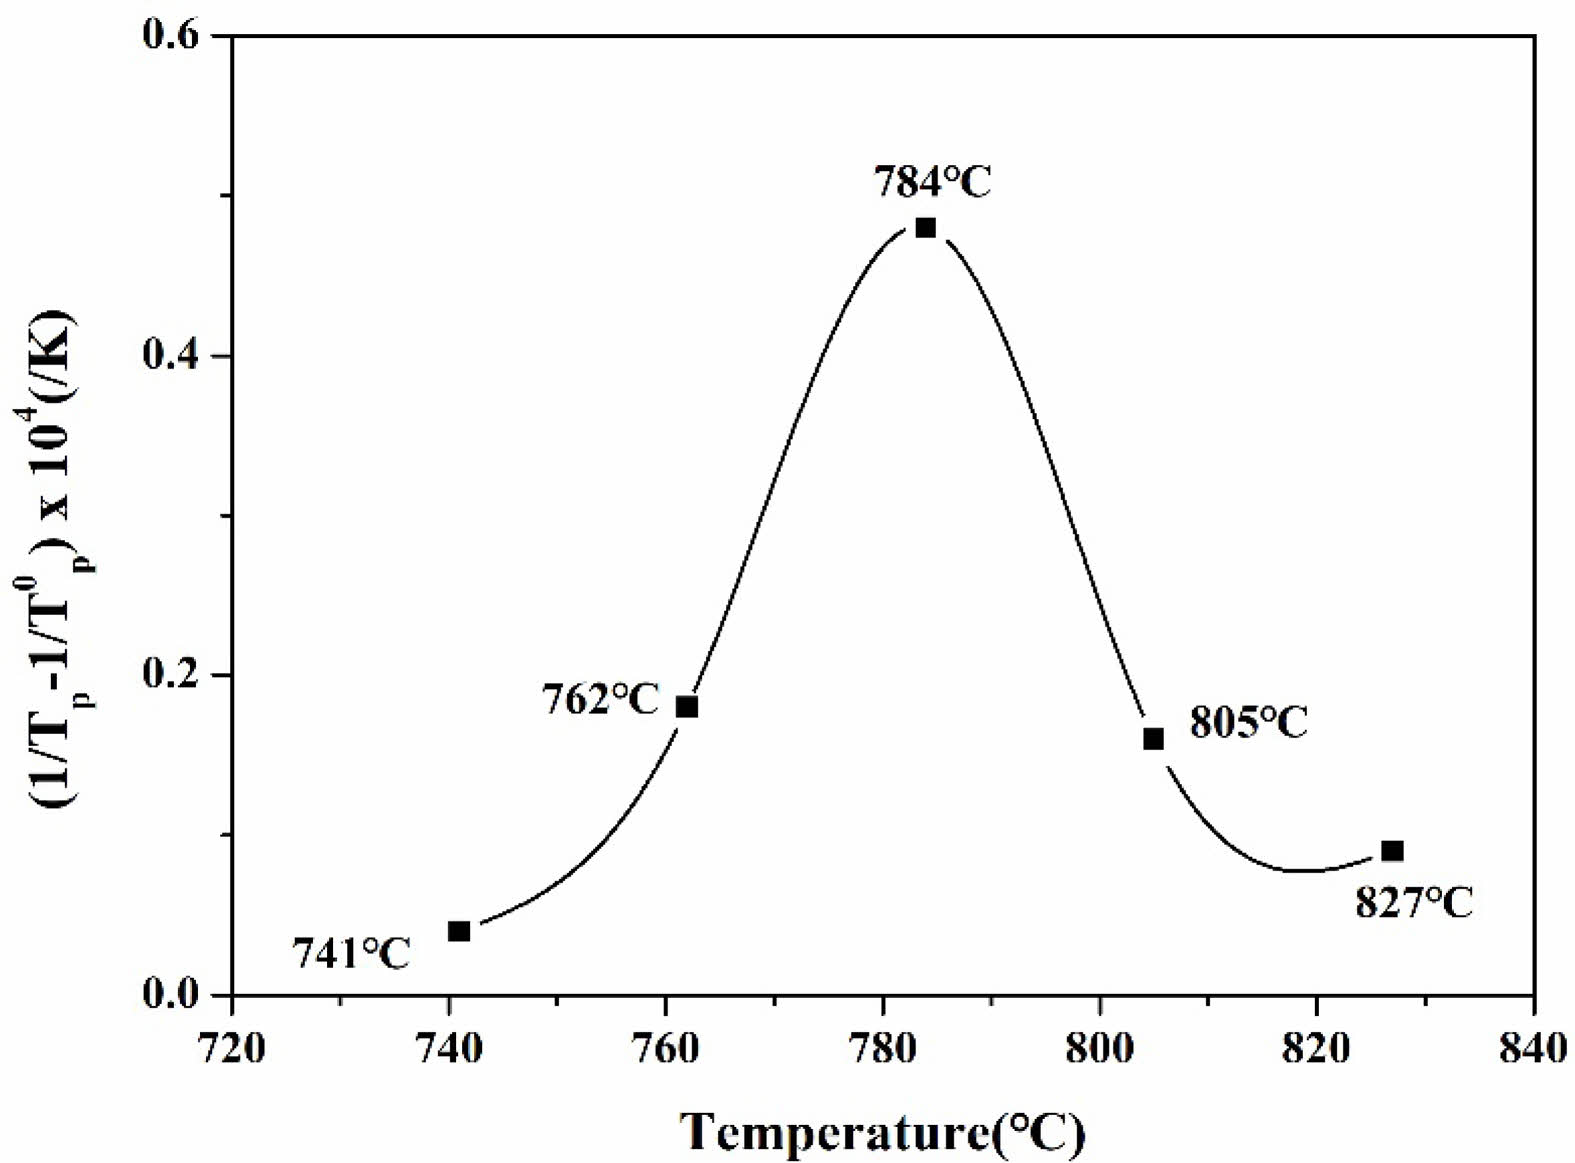
By plotting a temperature vs. ( ) graph from the maximum crystallization temperature (Tp) obtained from the five specimens, it can be intuitively demonstrated that the nucleation heat treatment temperature should be an appropriate intermediate value. This graph is shown in Fig. 3, where the temperature at the peak indicates the maximum nucleation temperature. Here, means the maximum crystal growth temperature of the parent glass [23, 24].
Based on this, a heat treatment process was designed with 784 ℃ selected as the maximum nucleation temperature, as shown in Table 1. Generally, higher heat treatment temperatures supply more energy for crystal growth. Therefore, crystallization at the maximum temperature of 932 ℃ was avoided because it exceeds the optimal energy supply observed at 900 ℃. Previous studies have indicated that crystallization at 932 ℃ leads to excessive crystal growth and the formation of micro- or larger crystal phases rather than nano-sized crystals. Consequently, opaque specimens were produced, rendering them unsuitable for manufacturing transparent crystallized glass. Therefore, in this study, the crystallization temperature was set at approximately 900 ℃, which is the midpoint between the crystallization onset temperature (Tc) of 886 ℃ and the maximum crystallization temperature (Tp) of 932 ℃.
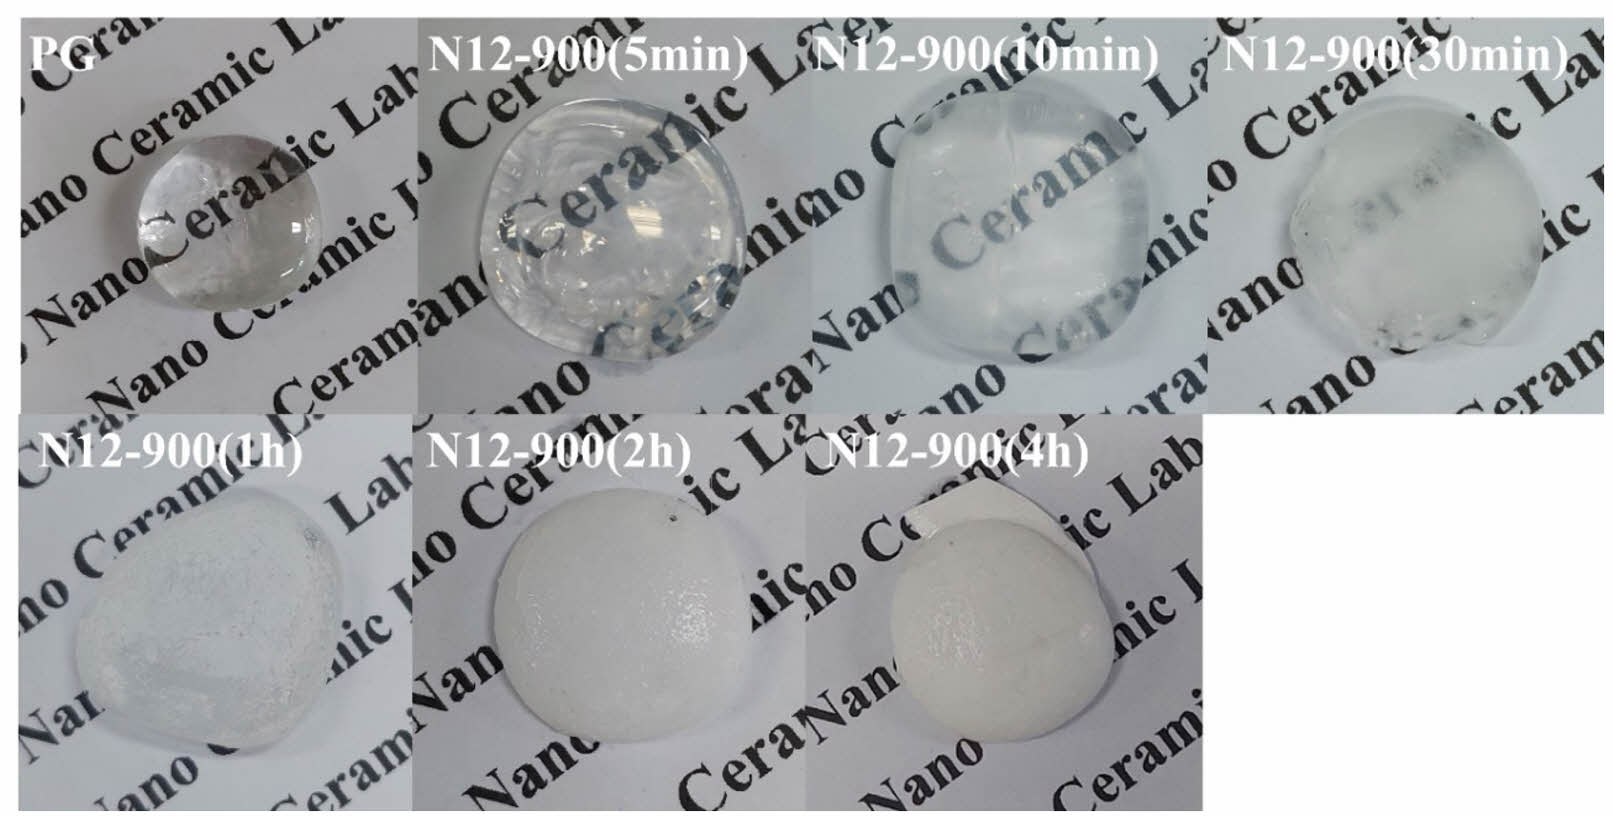
Fig. 4 shows the appearance of glass-ceramic specimens after nucleation heat treatment at 784 ℃ for 12 hours, followed by crystallization heat treatment at 900 ℃ for varying durations. As the crystallization heat treatment time increased, the transparency of the specimens tended to decrease. Notably, from the specimens heat-treated for 30 minutes, the text written on the surface beneath the specimens started to become obscured, and the specimens heat-treated for more than 2 hours were found to be completely opaque.
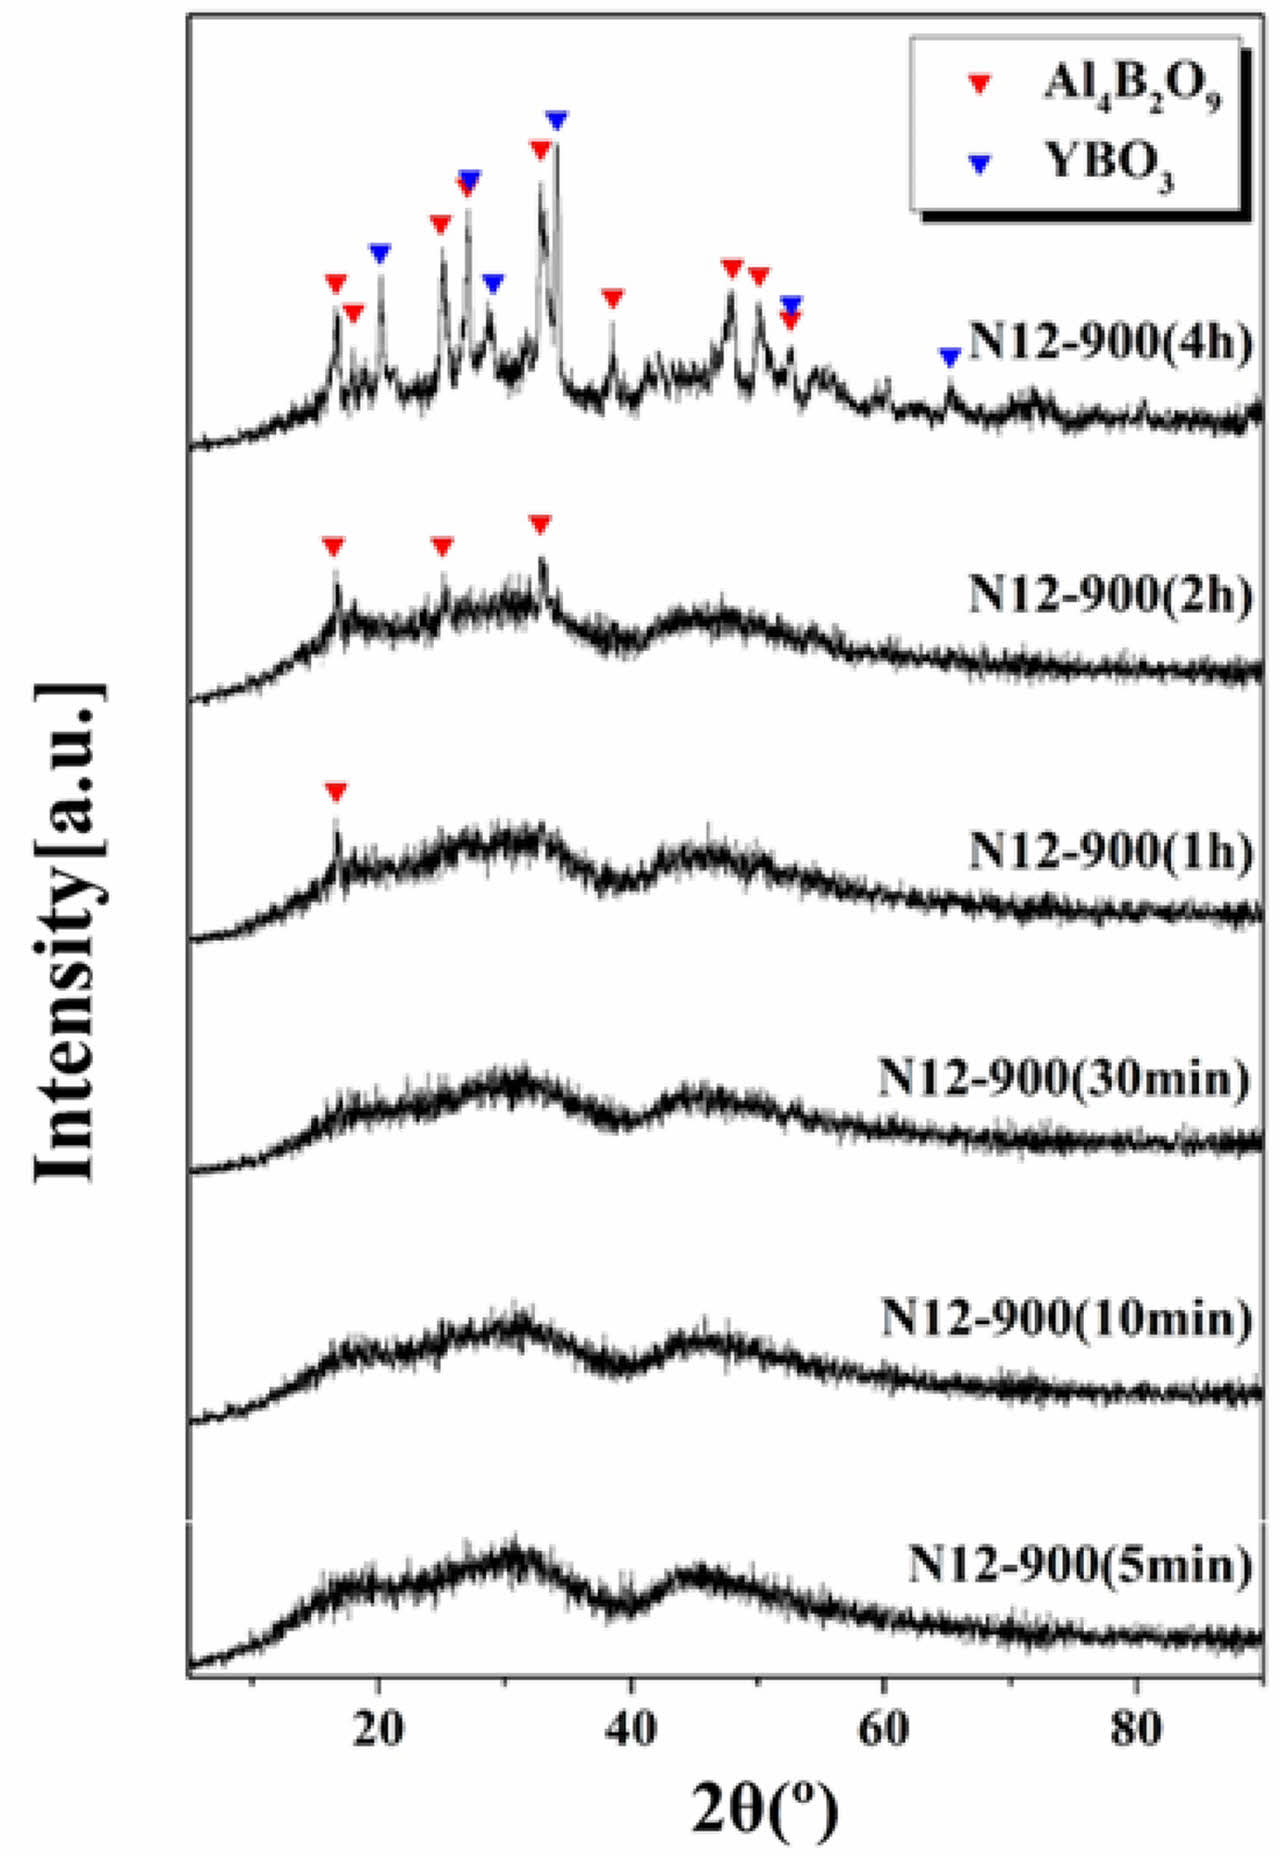
Figure 5 shows the XRD analysis results of the crystal phases of glass-ceramic specimens after nucleation heat treatment at 784 ℃ for 12 hours, followed by crystallization heat treatment at 900 ℃ for varying durations. In the case of glass-ceramic specimens heat-treated for 5 to 30 minutes, no crystal phases were detected, indicating an amorphous state. However, for glass-ceramic specimens heat-treated for more than 1 hour, peaks corresponding to the Al4B2O9 crystal phase began to appear, and the intensity of these peaks increased with the heat treatment time. In specimens heat-treated at 900 ℃ for 4 hours, the Al4B2O9 phase grew in all crystal planes, and the YBO3 crystal phase was also observed.
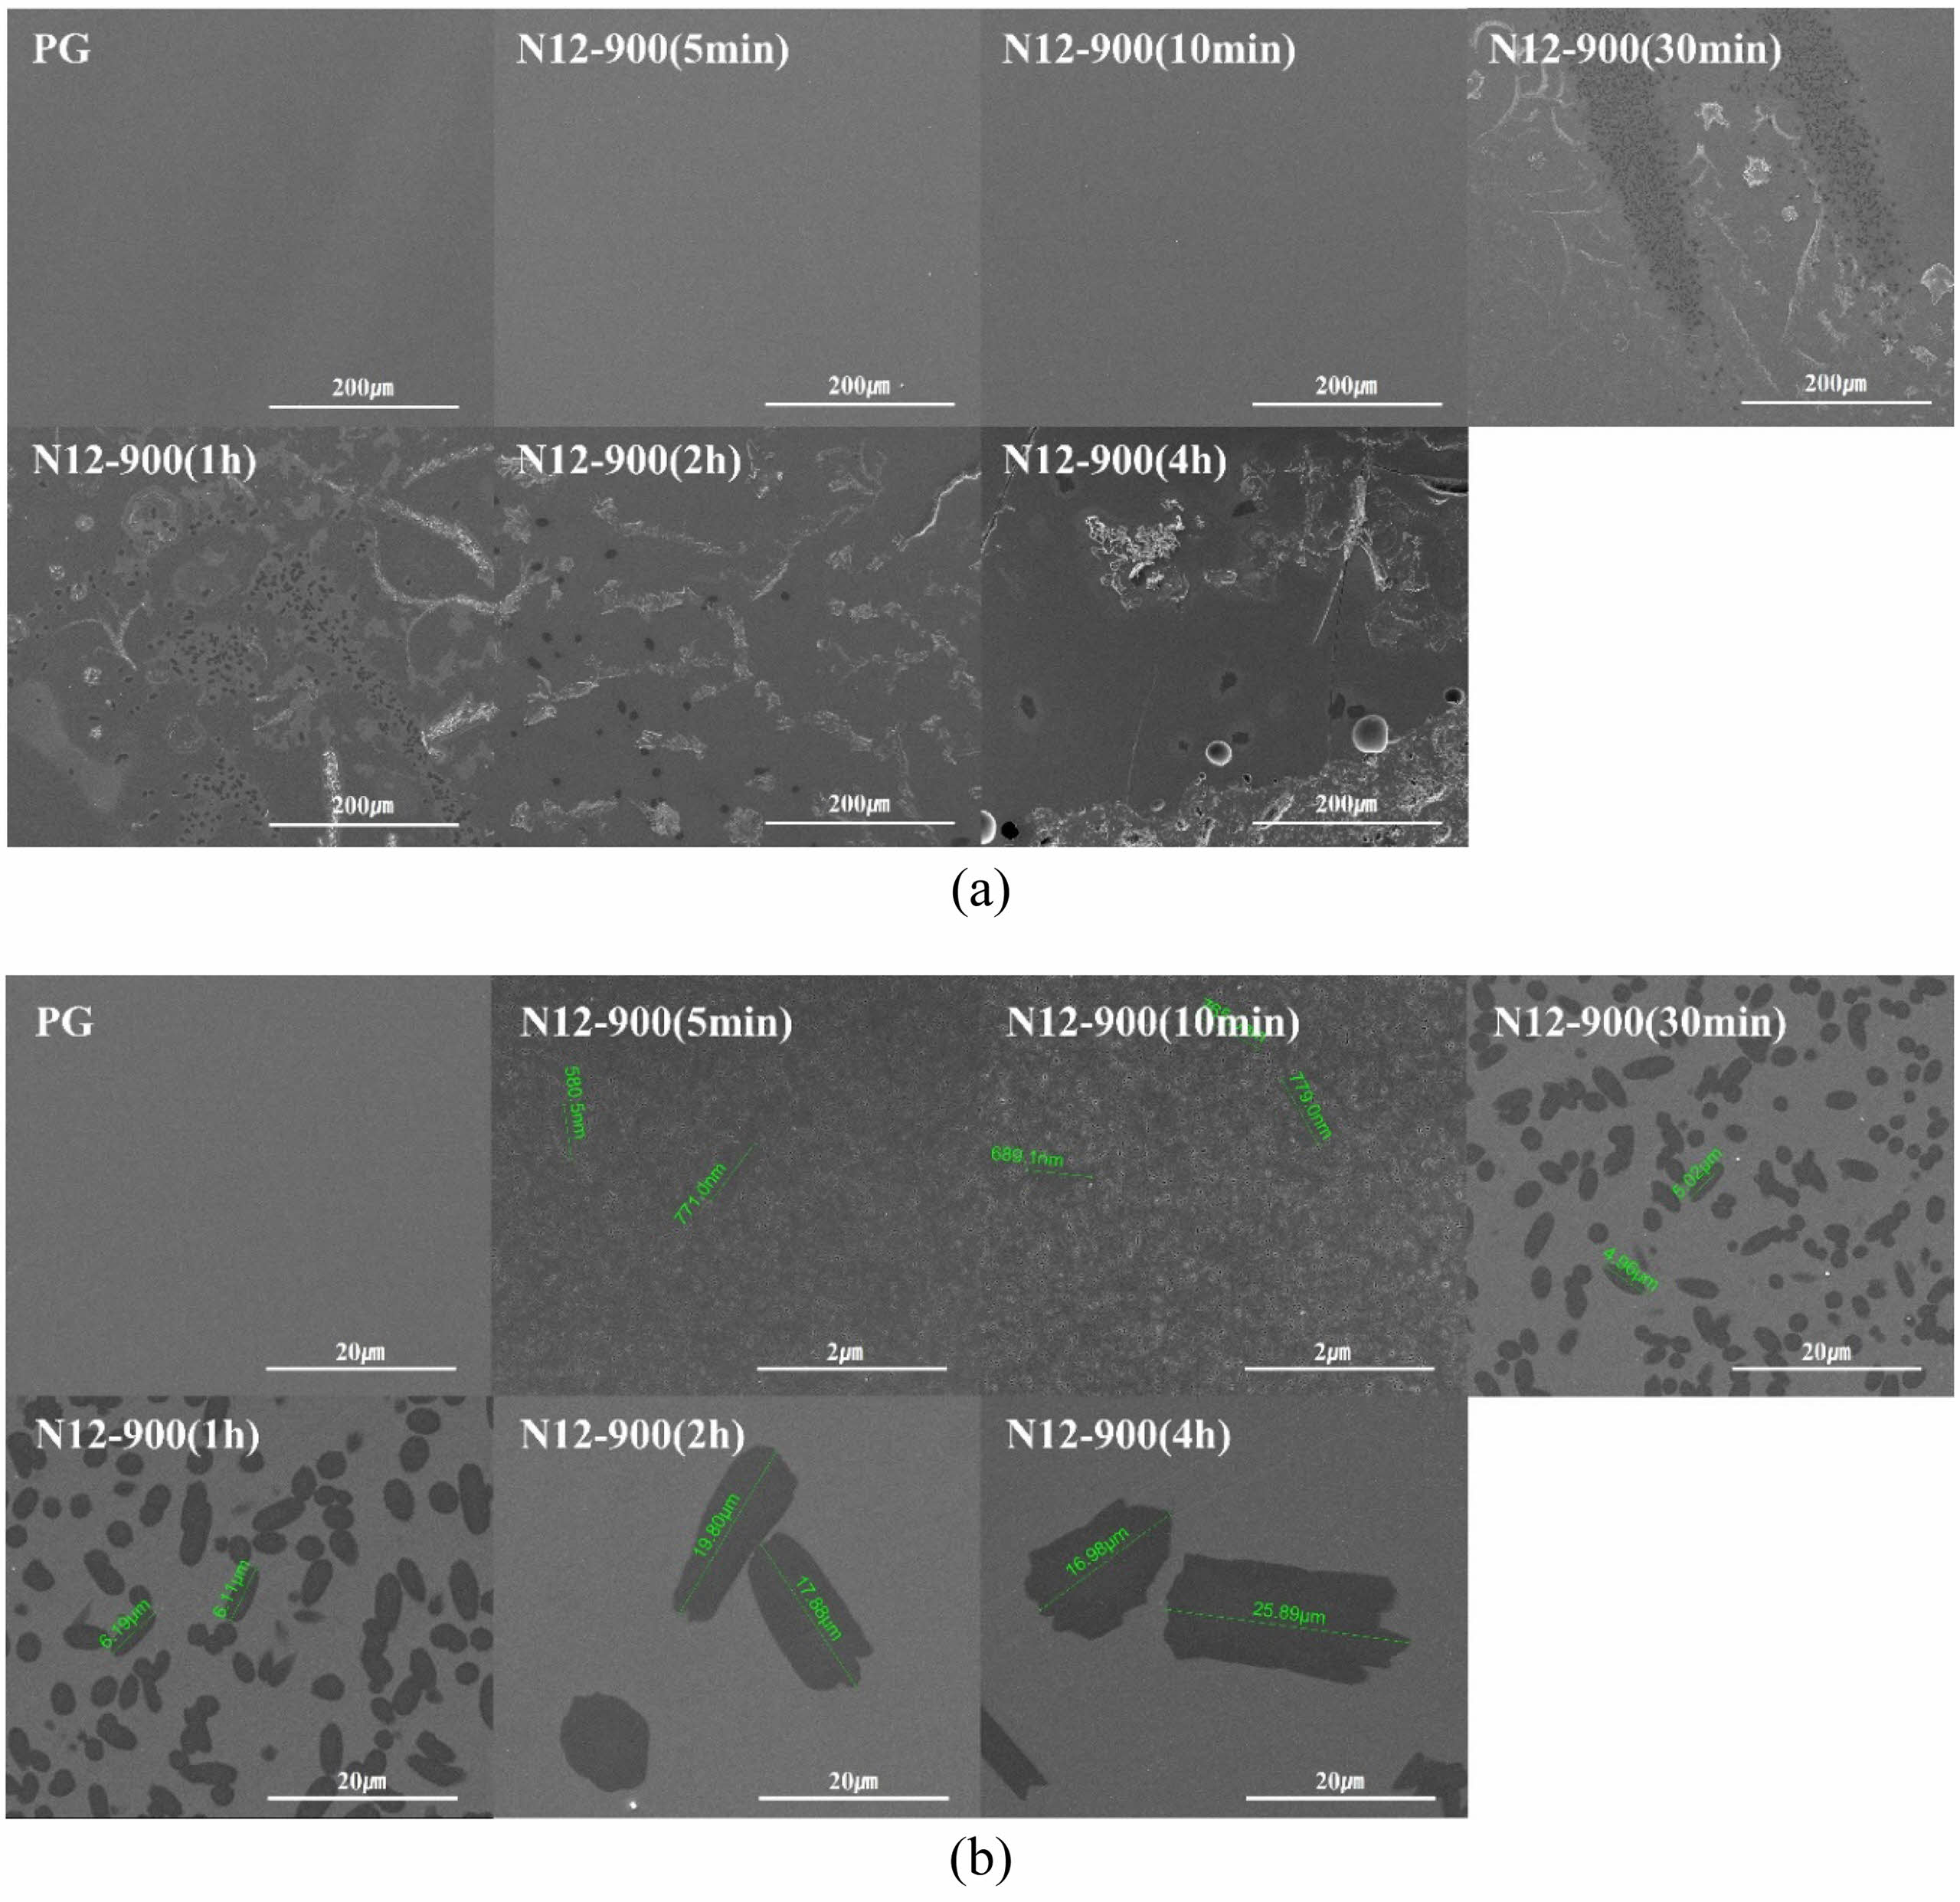
Fig. 6(a) and (b) depict the microstructures of the parent glasss and the glass-ceramic specimens treated for crystallization growth at 900 ℃ over time, observed using SEM. Fig. 6(a) shows the microstructure of the glass-ceramic specimens at low magnification (x500), revealing the onset of crystallization from the N12-900 (30 min) specimen treated for 30 minutes. Fig. 6 (b) presents the microstructures of the glass-ceramic specimens and parent glass observed at magnifications ranging from 5,000 to 50,000 times. Crystalline phases were observed in all glass-ceramic specimens except for the parent glass. While not visible at low magnifications, even specimens treated for 5 to 10 minutes exhibited nanometer-sized crystalline phases when observed at 50,000 times magnification. Thus, although not detected by XRD analysis (as shown in Fig. 5), crystalline phases were observed under high magnification electron microscopy. This suggests that the quantity and size of the formed crystals were minimal, surpassing the detection limits of the XRD instrument [25, 26].
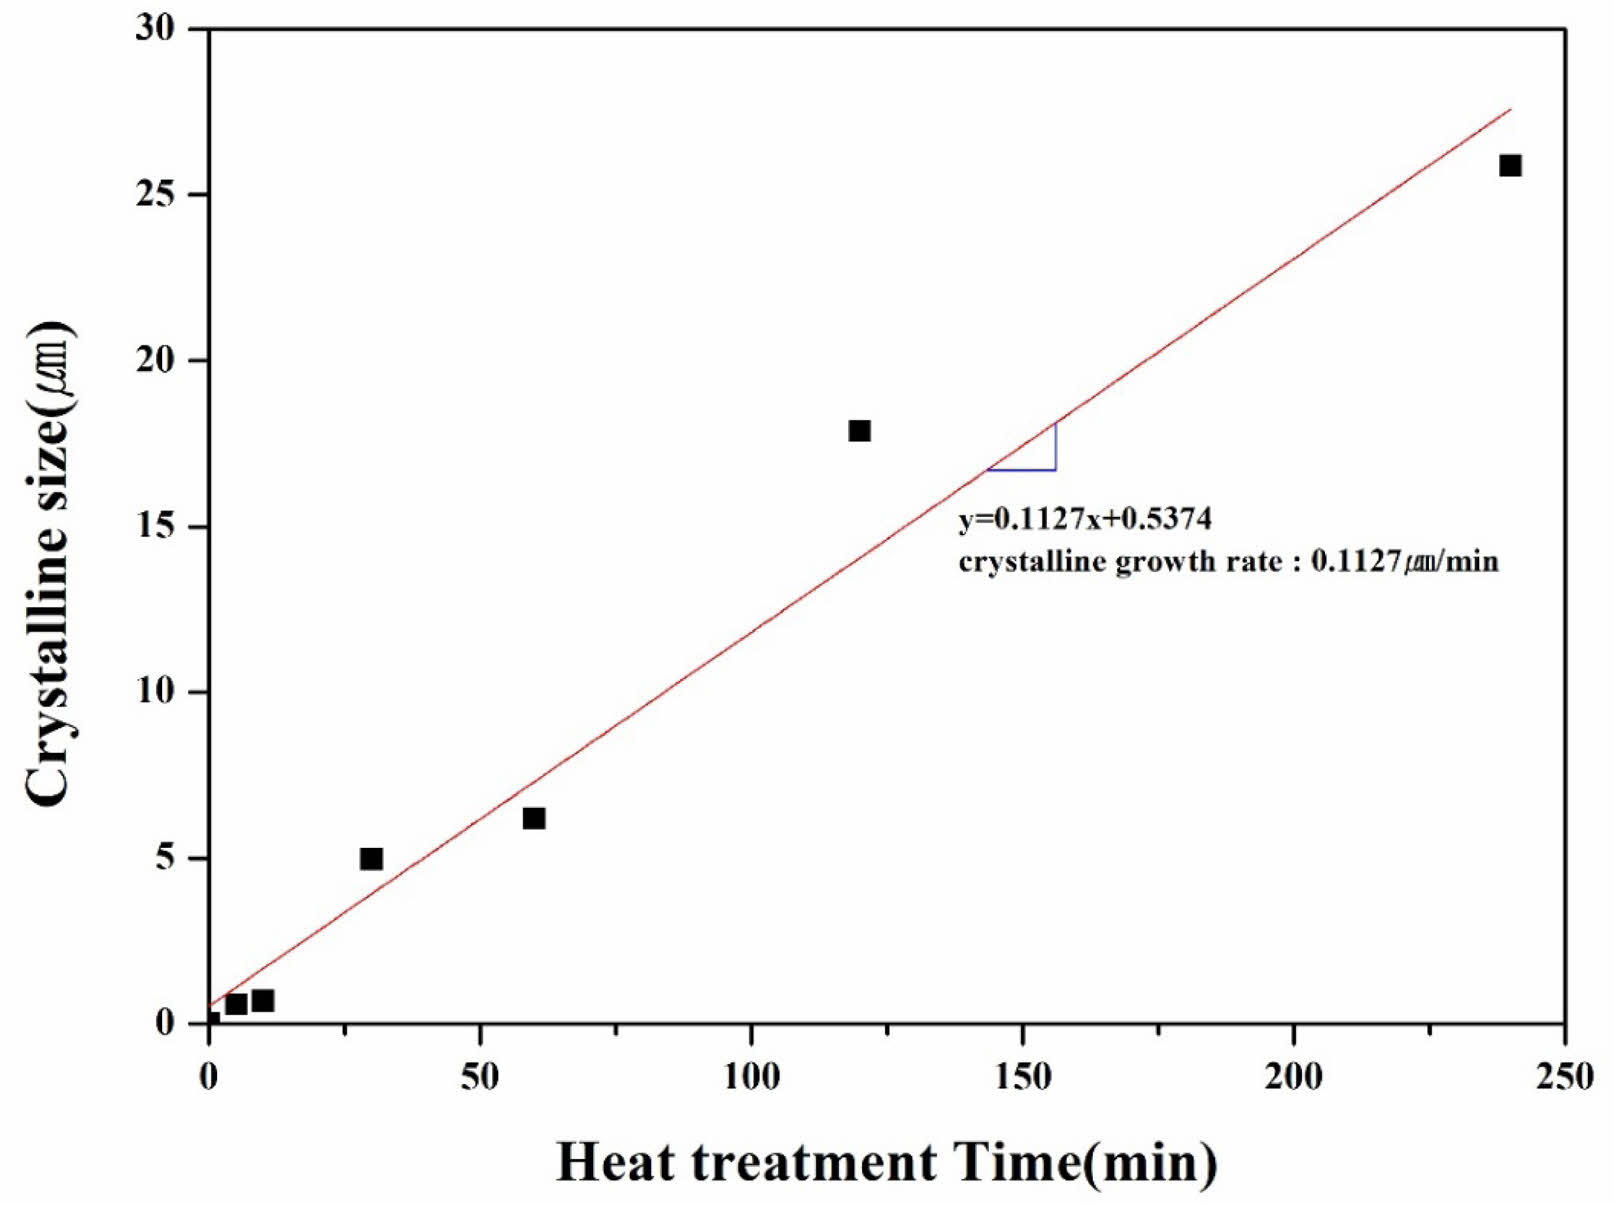
Fig. 6(b) shows that the crystals formed in the glass-ceramic specimens were all elliptical and uniformly distributed throughout the matrix. Generally, Specimens with successful nucleation form crystals of uniform size and distribution. Through this, it is determined that the specimens exhibit a high density of nuclei, resulting in an overall uniform microstructure. In the specimens heat-treated for 5 to 10 minutes, crystal particles approximately 500 to 800 nm in size were observed, while in the specimens heat-treated for 30 minutes or longer, the crystal particles had grown to a size in the micrometer range. As shown in Fig. 7, the size of the crystals as a function of heat treatment time exhibited an almost linear relationship, and the slope of the graph indicated a crystal growth rate of 0.1127 μm/min.
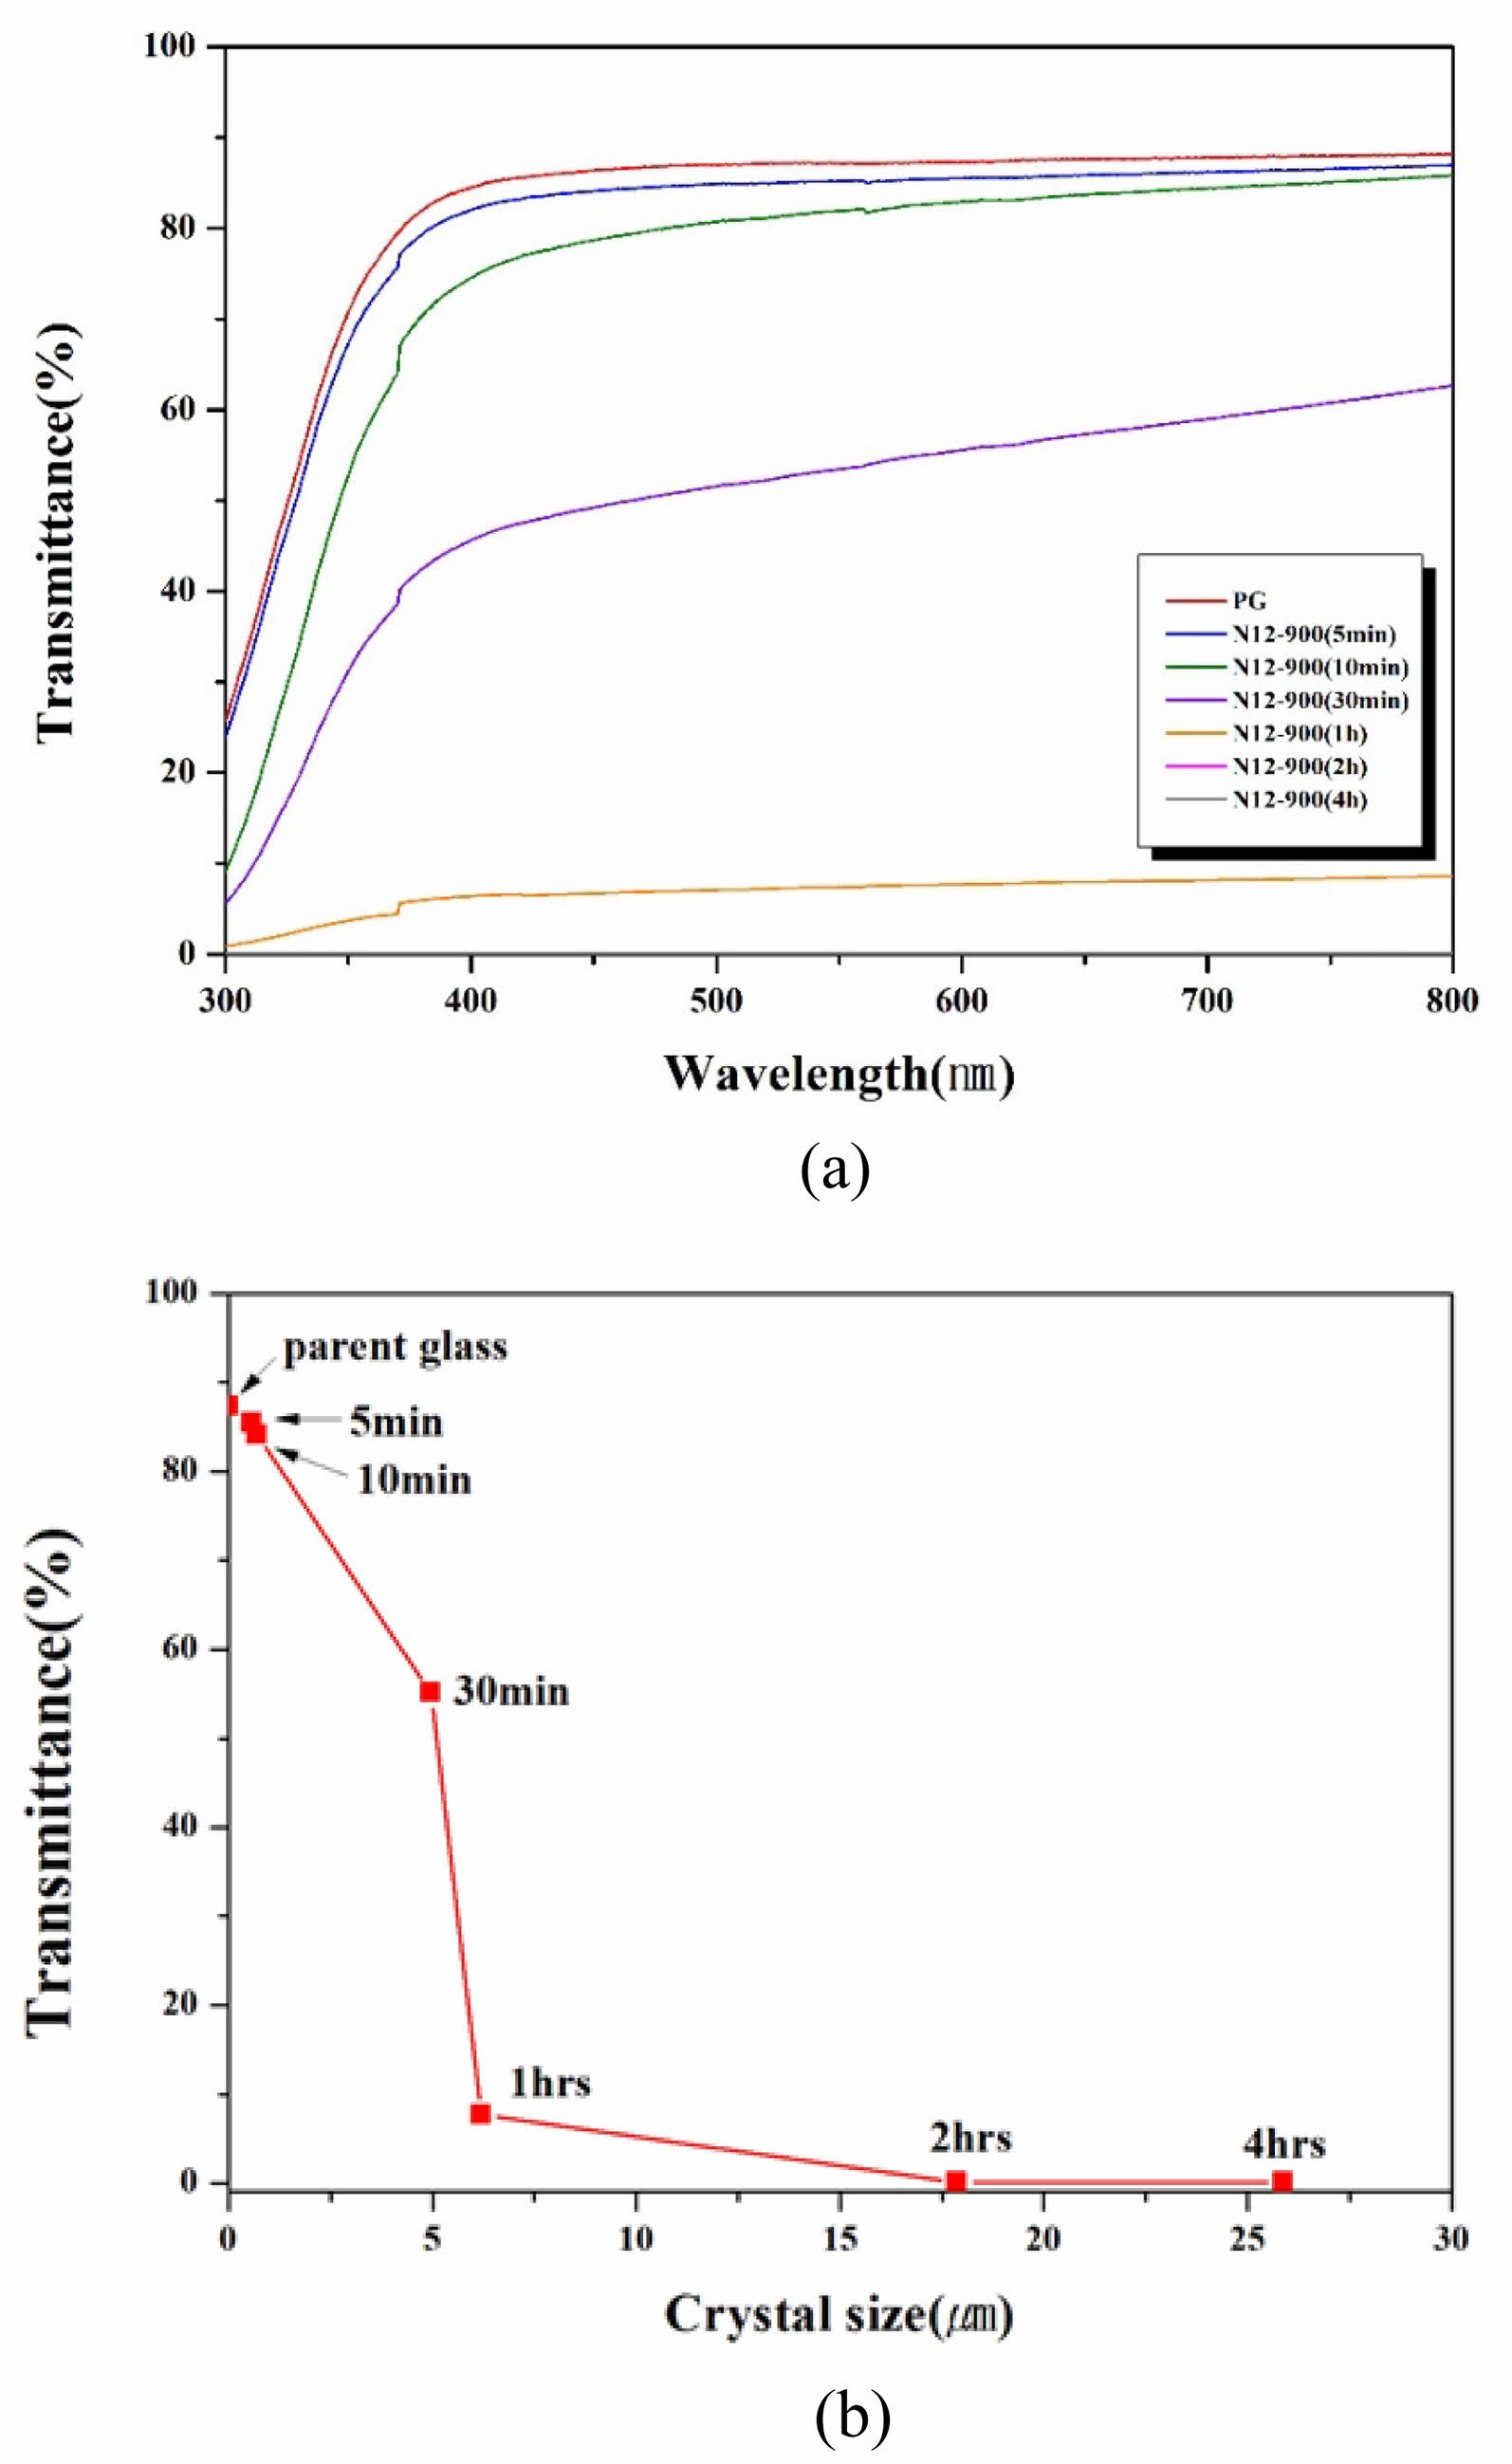
Fig. 8(a) shows the transmittance of glass-ceramic specimens in the visible light range after nucleation at 784 ℃ for 12 hours and subsequent crystallization at 900 ℃ for varying durations. The parent glass exhibited over 85% transmittance in the 400-800 nm range, the highest among all specimens. Specimens heat-treated for 5-10 minutes showed slightly lower but still high transmittance of 75-85%. However, transmittance sharply decreased with longer heat treatment times.
Fig. 8(b) displays the transmittance at 589.3 nm (sodium D-line) versus crystal size. The parent glass had 88% transmittance at this wavelength. Specimens with crystal sizes of 580.5 nm (5 min heat treatment) and 689.1 nm (10 min) had transmittance of 86% and 83%, respectively. Specimens with larger crystal sizes of 4.96 μm (30 min) and 6.19 μm (1 hour) had transmittance of 55% and 8%. Specimens treated for 2 and 4 hours, with crystal sizes of 17.88 μm and 25.89 μm, were completely opaque with 0% transmittance.
In conclusion, when the average crystal size is between 600 and 800 nm, the transmittance is over 80%, but it decreases sharply to below 55% when the crystal size exceeds approximately 5 μm. These results align with the findings of P.A. Tick et al., who reported increased light scattering with increased crystallinity and crystal size [7], and X. Hao et al., who observed improved optical transmittance with smaller crystal sizes [8]. This suggests that specimens with nanometer-sized crystals exhibit suppressed light scattering, resulting in transparent glass-ceramic specimens [11].
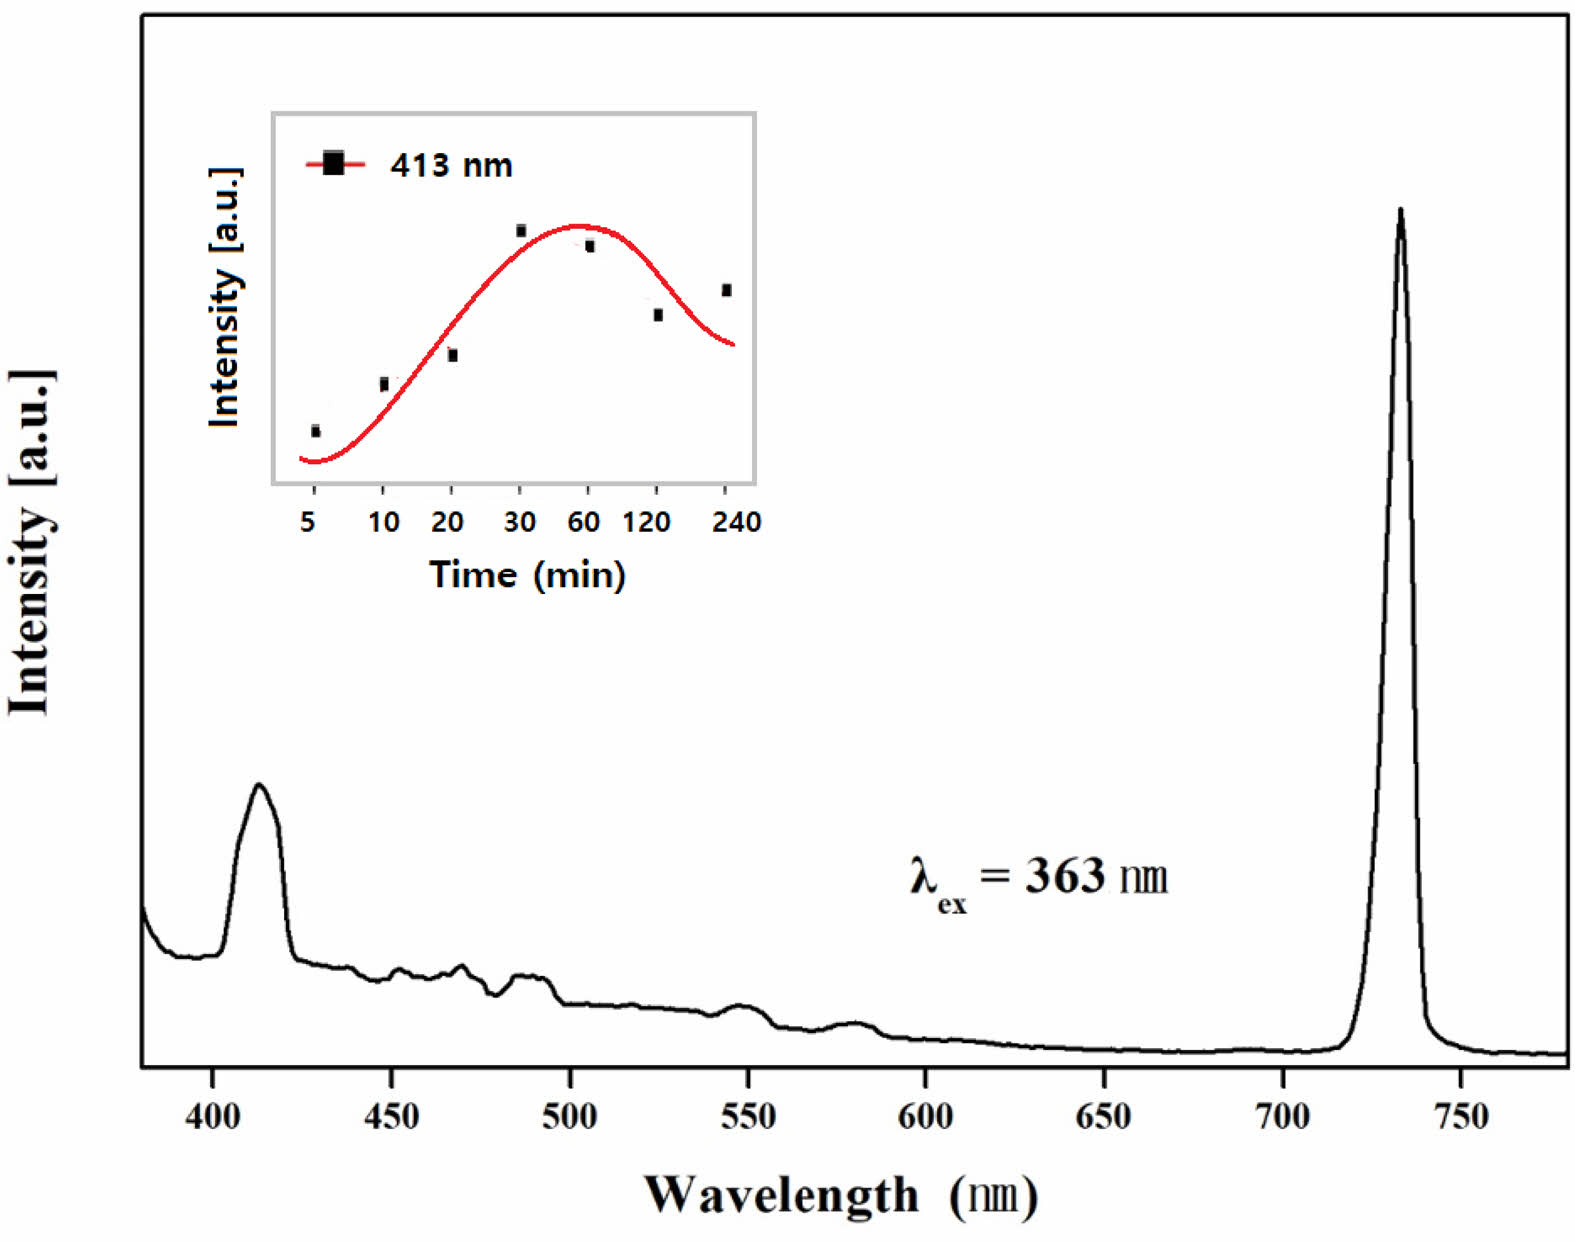
Fig. 9 shows the photoluminescence (PL) spectra of glass-ceramic specimens after nucleation heat treatment at 784 ℃ for 12 hours, followed by crystallization heat treatment at 900 ℃ for 30 minutes. When excited at a wavelength of 363 nm, emission peaks were observed at 413 nm and 733 nm, corresponding to the crystalline phases formed and the excitation wavelength, respectively [15, 27]. The inset in the upper left corner of Fig. 9 compares the relative PL intensity over different heat treatment times. The specimen treated for 30 minutes exhibited the highest emission peak. However, as the heat treatment time increased beyond 30 minutes, the peak intensity decreased. This decline in PL intensity is likely due to excessive crystal formation making the specimens opaque, which prevented the emitted light from escaping the specimens.
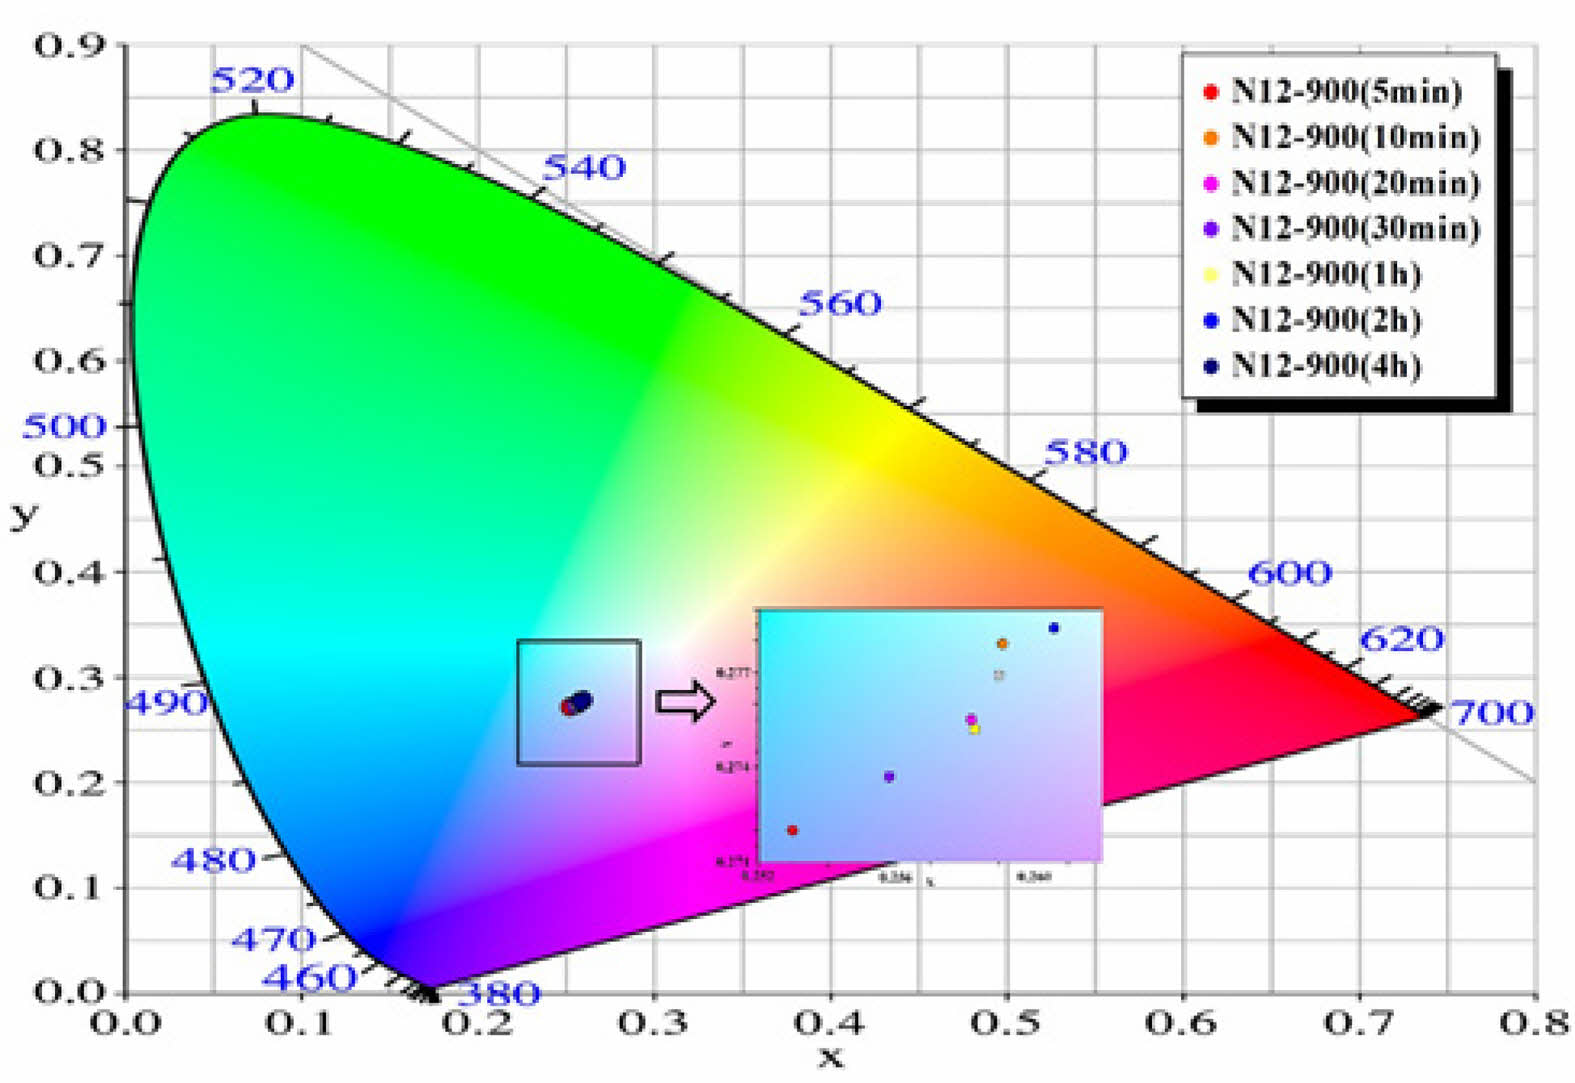
Based on the PL data of the glass-ceramic specimens, the CIE color coordinates for each specimen are shown in Fig. 10. All specimens are positioned within the range of 0.253 to 0.265 on the CIE x-axis and 0.272 to 0.279 on the CIE y-axis, indicating that they emit blue light near the boundary of green and red. This blue emission is attributed to the Al4B2O9 crystalline phase formed in the alumino-borate glass matrix [28].
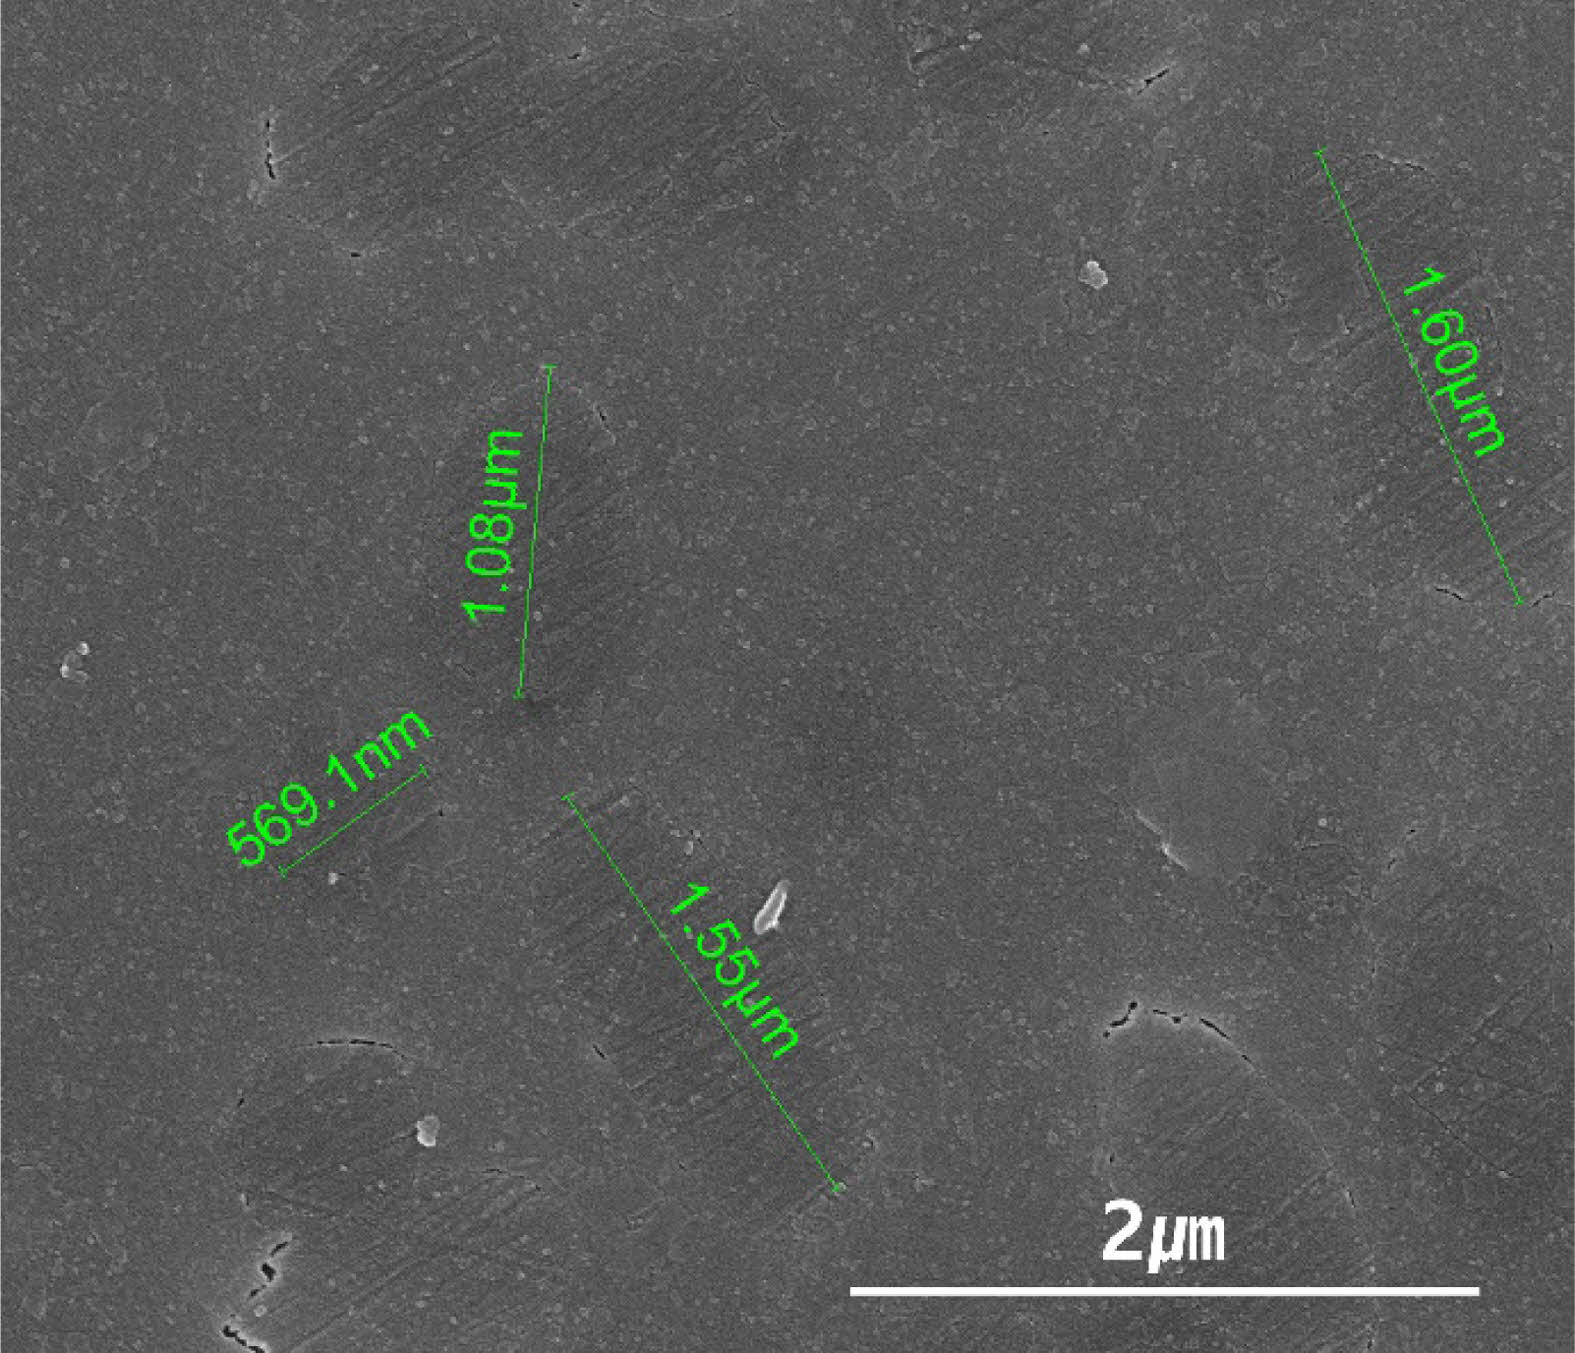
Fig. 11 shows the SEM analysis results of the microstructure of glass-ceramics doped with 0.1 mol% Eu2O3. The heat treatment conditions included nucleation at 784 ℃ for 12 hours, followed by crystallization at 900 ℃ for 5 minutes. This specific heat treatment duration was chosen based on previous experiments where the highest optical transmittance was observed. The SEM analysis revealed the formation of elliptical crystals ranging in size from 500 nm to 1.6 μm. This indicates a slight increase in crystal size compared to the glass-ceramic specimens shown in Fig. 5 and 6. It is presumed that the Eu3+ ions promote the growth of Al4B2O9 crystals, though further experiments are necessary for precise analysis.
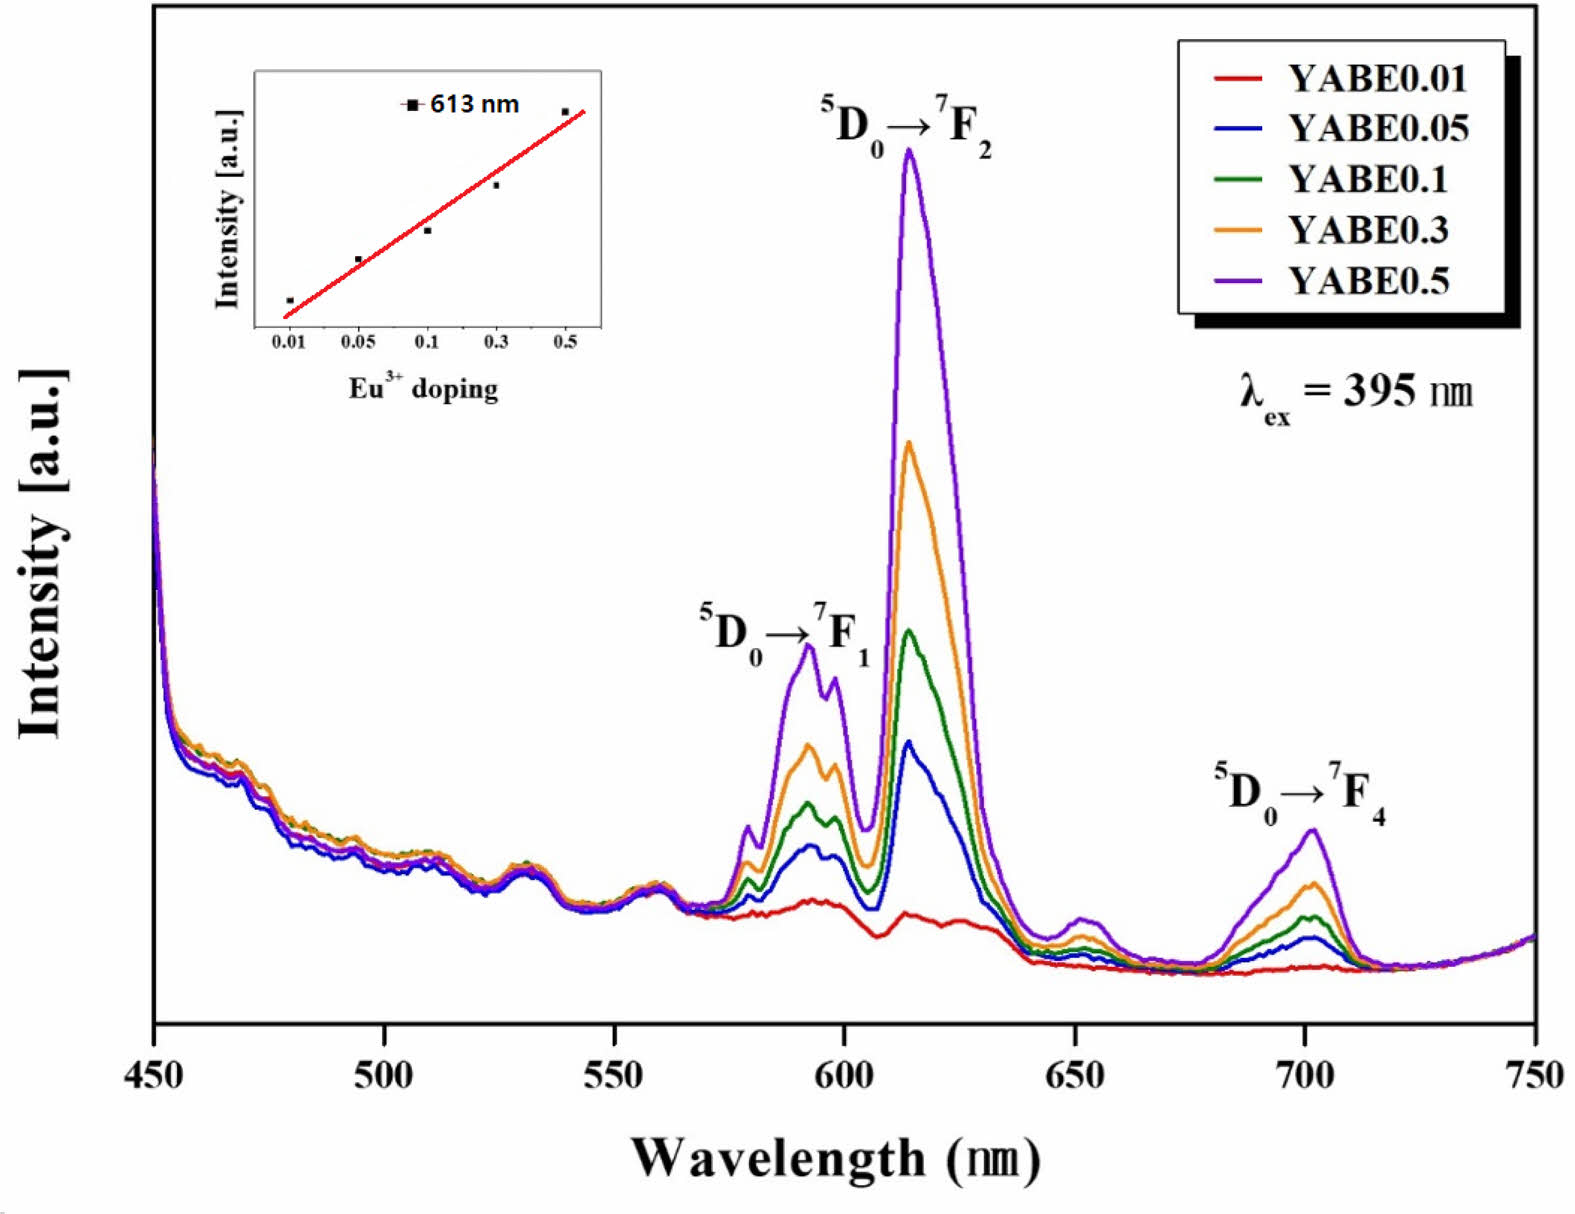
Fig. 12 shows the luminescence characteristics of glass-ceramic specimens doped with Eu2O3 in the range of 0.01 to 0.5 mol%. When excited at a wavelength of 395 nm, emission peaks were observed at 592 nm, 613 nm, and 701 nm, with the primary emission peak at 613 nm. These peaks result from the substitution of Al3+ by Eu3+ in the AlO6 octahedra structure of Al4B2O9 [18, 29]. The luminescence is due to the transitions from 5D0 to 7Fx (x=1, 2, 4) as a result of Eu3+ doping, with the intensity of each emission peak increasing with higher Eu3+ doping levels [30-33]. The maximum doping level in this experiment was 0.5 mol%, indicating effective substitution of Al3+ ions by Eu3+ within the crystal structure. The small graph in the inset of Fig. 12 compares the intensity of the primary emission peak at 613 nm across different Eu3+ ion doping levels, showing a nearly linear increase in PL intensity with increasing doping concentration.
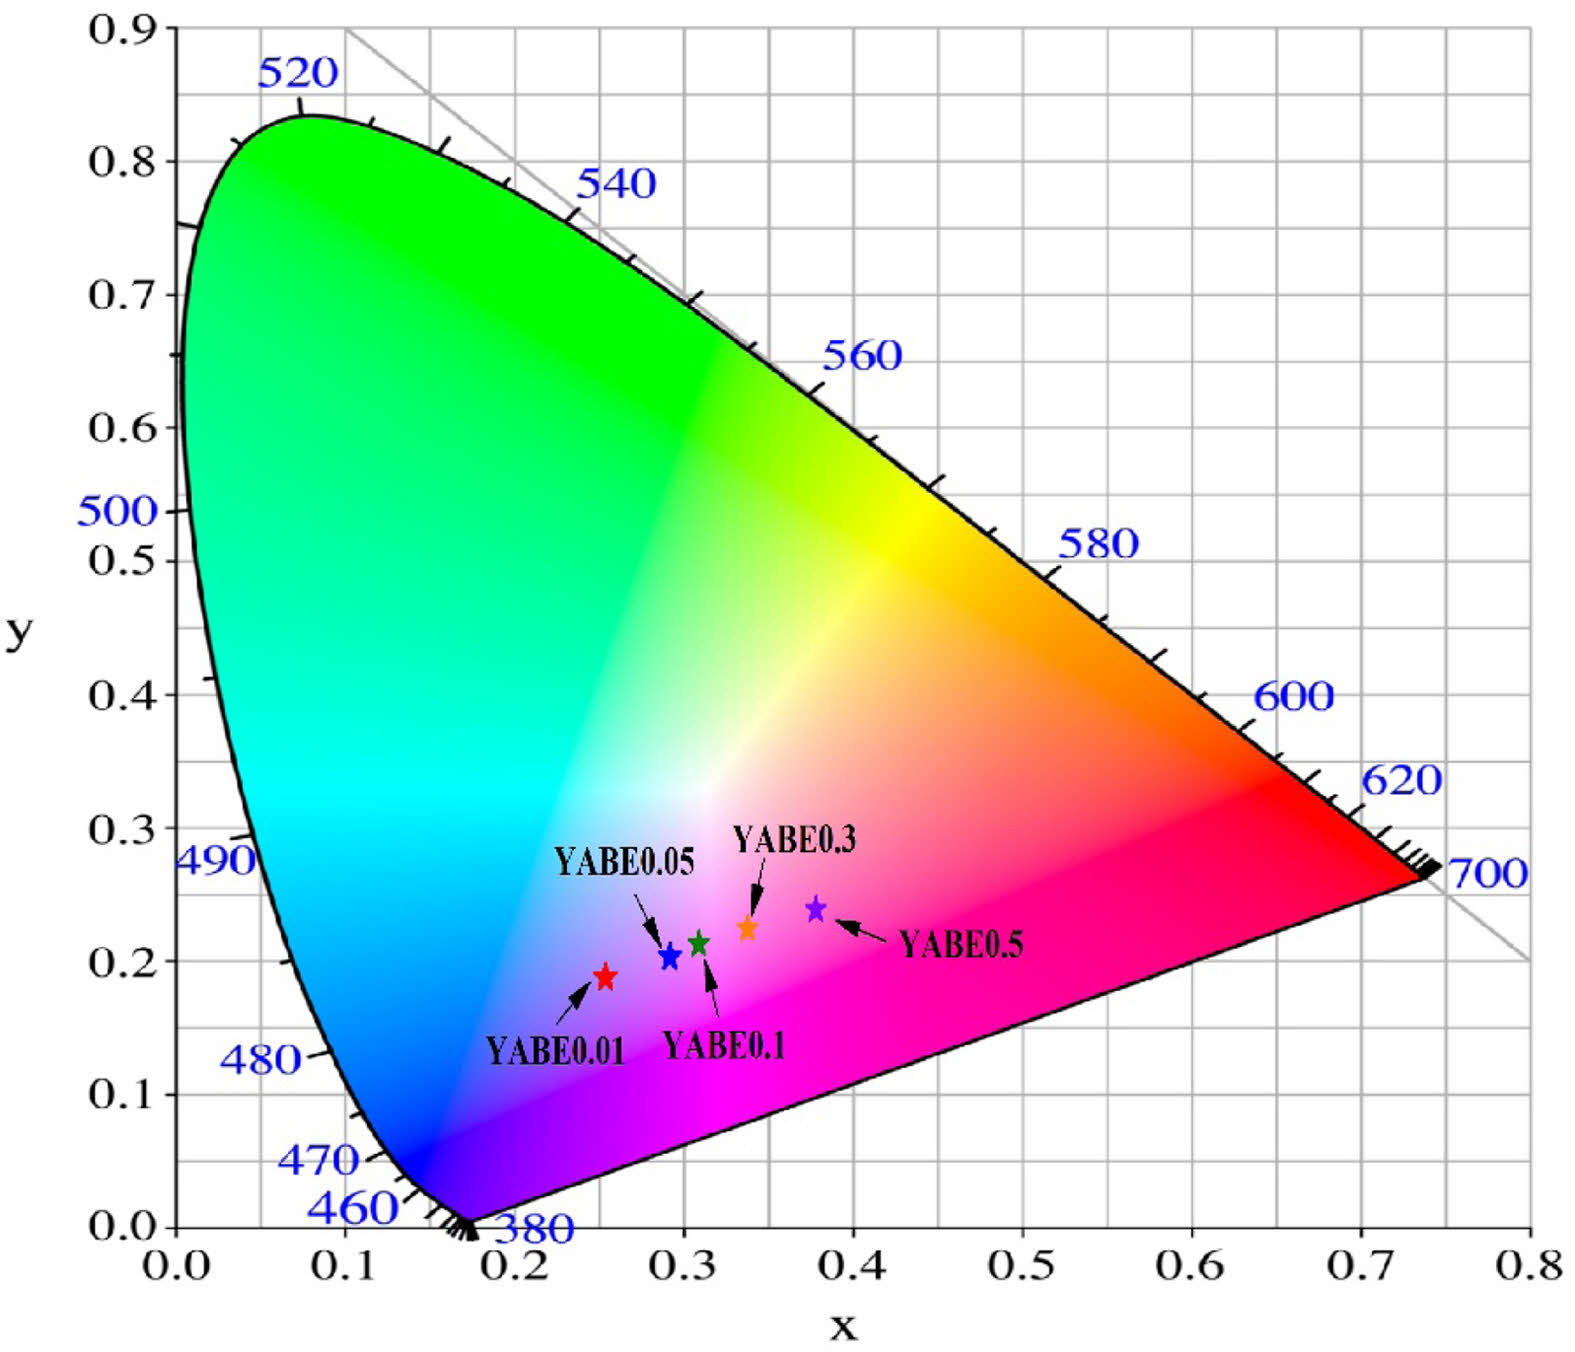
The CIE color coordinates for the specimens doped with Eu3+ ions are shown in Fig. 13. The specimen doped with 0.01 mol% Eu3+ (referred to as YABE0.01) exhibited blue emission with CIE coordinates of x=0.25 and y=0.19, which are similar to the CIE coordinates of the undoped specimens shown in Fig. 10. However, as the Eu3+ doping level increased, the blue emission shifted to red emission. Notably, the specimen doped with 0.5 mol% Eu3+ (YABE0.5) showed CIE coordinates of x=0.38 and y=0.24, indicating a complete shift to red emission. This demonstrates that while YAB-based glass-ceramics exhibit blue luminescence, doping with Eu2O3 shifts the CIE coordinates towards red emission.
|
Fig. 1 The DTA graph of parent YAB glass |
|
Fig. 2 The DTA graphs for glasses heat-treated at temperatures ranging from Tg to Tc. |
|
Fig. 3 The graph of temperature vs. ( |
|
Fig. 4 Photographs of the parent glass and glass-ceramic obtained after heat treatment for various durations at 900 ℃. |
|
Fig. 5 XRD results of parent glass and glass-ceramic obtained after heat treatment for various duration at 900 ℃. |
|
Fig. 6 (a) SEM image of the parent glass and glass-ceramic obtained after heat treatment for various durations at 900 ℃, magnified at 500x. (b) SEM image of the same samples, further magnified either 5,000 times or 50,000 times. |
|
Fig. 7 The relationship between crystal size and heat treatment time, demonstrating a linear correlation. The slope of the line, 0.1127 μm/min, represents the crystal growth rate. |
|
Fig. 8 (a) The transmittance spectra of both parent glass and glass-ceramics over time during heat treatment for crystal growth. (b) The relationship between the size of crystals grown within the glass-ceramics and the transmittance of the samples. The numbers written next to each data point represent the time of heat treatment for crystal growth. |
|
Fig. 9 Photo-luminescent spectra of the glass-ceramic excited at 363 nm revealing luminescence peaks at 420 and 730 nm. The small graph within figure illustrates the intensity variation of the 413 nm luminescence peak with respect to the duration of crystalline growth heat treatment. |
|
Fig. 10 Indication of CIE color coordinate for the emitted light from Y2O3-Al2O3-B2O3-based glass-ceramics. The data in the small box within the figure shows that as the crystallization heat treatment time increases, the emission coordinates of the glass-ceramic shift from the blue region to the red region. |
|
Fig. 11 SEM image of glass-ceramic doped with 0.1 mol% Eu3+ ion (referred to as YABE0.1) revealing crystal sizes ranging from 560 nanometers to 1.60 micrometers. |
|
Fig. 12 Photo-luminescent spectra of the glass-ceramic doped with Eu3+ showing three luminescent peaks at 560, 625, and 700 nm. The graph in the small box within this figure indicates that the luminescent peak intensity increases with heat treatment time for crystal growth. |
|
Fig. 13 Indication of CIE color coordinates for the emitted light from Y2O3-Al2O3-B2O3-based glass-ceramics doped with Eu3+. As the amount of Eu3+ doping increases, the emission coordinates of the glass-ceramic shift from the blue region to the red region. |
|
Table 1 The process parameters of a two-step heat-treatment method used in the fabrication of Y2O3-Al2O3-B2O3-based glassceramics containing nanometer-sized crystals. |

In this study, transparent glass-ceramic specimens were fabricated by generating nanometer-sized Al4B2O9 crystals in YAB-based glass. Through isothermal thermal analysis, the optimal nucleation temperature for the crystallization of the parent glass was determined to be 784 ℃, and the crystallization heat treatment was conducted at 900 ℃ for durations ranging from 5 minutes to 4 hours. The crystals formed within the specimens were identified as the Al4B2O9 phase, with the additional YBO3 phase appearing in specimens heat-treated for 4 hours. Specimens heat-treated for up to 10 minutes exhibited nanometer-sized crystals and showed visible light transmittance of over 80%. In contrast, specimens heat-treated for more than 30 minutes showed crystal growth exceeding 4.96 μm, resulting in a sharp decrease in light transmittance to below 55%. PL spectra analysis indicated that while YAB-based glass-ceramics displayed blue luminescence, doping with Eu2O3 resulted in a primary emission peak at 613 nm, shifting from blue to red luminescence as the doping concentration increased. This study demonstrated that various optical properties could be controlled by adjusting the nanocrystal size and Eu doping levels in Y2O3-Al2O3-B2O3(Eu) glass-ceramic specimens. Consequently, these findings suggest the potential application of the glass-ceramic specimens in photonic devices such as optoelectronics, optical grating, and optical waveguides.
This work was supported by Kyonggi University Research Grant 2021.
- 1. L.R. Pinkney and G.H. Beall, J. Am. Ceram. Soc. 91[3] (2008) 773-779.
-

- 2. E. Enriquez, V. Fuertes, M.J. Carbrera, J. Seores, D. Munoz, B. Galiana, and J.F. Fernandez, Ceram. Int. 45[7] (2019) 8899-8907.
-

- 3. G.H. Beall and L.R. Pinkney, J. Am. Ceram. Soc. 82[1] (1999) 5-16.
-

- 4. H. Masai, T. Ueno, T. Toda, Y. Takahashi, and T. Fujiwara, J. Non-cryst. Solids. 356[52-54] (2010) 3080-3084.
-

- 5. Y.H. Na, Y.S. Kim, K.H. Lee, T.H. Kim, Y.J. Jung, N.J. Kim, S.H. Yim, and B.K. Ryu, J. Ceram. Process. Res. 10[2] (2009) 230-234.
-

- 6. C. Ji, L. Li, W. Gao, J. Wang, and J. Han, Ceram. Int. 49[7] (2023) 10652-10662.
-

- 7. P.A. Tick, N.F. Borrelli, and I.M. Reaney, Opt. Mater. 15[1] (2000) 81-91.
-

- 8. X. Hao, X. Hu, Z. Luo, T. Liu, Z. Li, T. Wu, A. Lu, and Y. Tang, Ceram. Int. 41[10] (2015) 14130-14136.
-

- 9. N.H. Golshan, B.E. Yekta, and U.K. Marghussian, Opt. Mater. 34[4] (2012) 596-599.
-

- 10. S. Jung, W. Cho, and C. Lee, J. Ceram. Process. Res. 16[4] (2015) 411-417.
-

- 11. T. Benitez, S.Y. Gómez, A.P.N. de Oliveira, N. Travitzky, and D. Hotza, Ceram. Int. 43[16] (2017) 13031-13046.
-

- 12. A. Chakrabarti and A.R. Molla, J. Non-cryst. Solids. 505[1] (2019) 354-366.
-

- 13. H. Guo, F. Li, J. Li, and H. Zhang, J. Am. Ceram. 94[6] (2011) 1651-1653.
-

- 14. A. Marzuki, F.D. Ega, and A. Saraswati, Mater. Res. Express. 9[2] (2022) 025203.
-

- 15. B. Wuyunga, S. Chunhui, and Z. Hongbo, J. Phys. Conf. Ser. (2021) 012046.
-

- 16. S. Bruns, T. Uesbeck, D. Well, D. Moncke, L.V. Wullen, K. Durst, and D. Ligny, Front. Mater. 28[7] (2020) 189-192.
-

- 17. E. Demirkesen and G. Goller, Ceram. Int. 29[4] (2003) 463-469.
-

- 18. L.J.Q. Maia and F.M.F. Filho, Nanophotonics (2020) 31-44.
-

- 19. Manjeet, A. Kumar, Anu, Ravina, N. Deopa, A. Kumar, R.P. Chahal, S. Dahiya, R. Punia, and A.S. Rao, J. Non-cryst. Solids. 588[15] (2022) 121613.
-

- 20. A.F. Silva, F. Elan, E.L. Falcao-Filho, L.J.Q. Maia, and C.B. de Araujo, J. Mater. Chem. C. 5 (2017) 1240-1246.
-

- 21. M. Walas, M. Lisowska, T. Lewandowki, A.I. Becerro, M. Lapinski, A. Synak, W. Sadowski, and B. Koscielska, J. Alloys Compd. 806 (2019) 1410-1418.
-

- 22. X. Guo, H. Yang, C. Han, and F. Song, Ceram. Int. 33[7] (2007) 1375-1379.
-

- 23. Y.H. Na, Y.S. Kim, K.H. Lee, T.H. Kim, Y.J. Jung, N.J. Kim, S.H. Yim, and B.K. Ryu, J. Ceram. Process. Res. 10[2] (2009) 230-234.
-

- 24. Y. Rho and S. Kang, J. Nanosci. Nanotechnol. 20[1] (2020) 324-330.
-

- 25. H.A. Ano-Mosallam, D. Kim, H. Kim, and H. Lee, Ceram. Int. 42[4] (2016) 5107-5112.
-

- 26. K. Boudeghdegh, V. Diella, A. Bernasconi, A. Roula, and Y. Amirouche, J. Eur. Ceram. Soc. 35[13] (2015) 3735-3741.
-

- 27. Y.W. Lu, X.W. Du, J. Sun, X. Han, and S.A. Kulinich, J. Appl. Phys. 100 (2006) 063512.
-

- 28. P. Burner, in “New generation of LED lighting luminophores” Doctoral theses, Univ. Comm. Grenoble Alpes (2016) p.103.
- 29. V.A. Kravets, E.V. Ivanova, K.N. Orekhova, M.A. Petrova, G.A. Gusev, A.N. Trofimov, and M.V. Zamoryanskaya, J. Lumin. 226 (2020) 117419.
-

- 30. L. Zhao, Z. Cao, X. Wei, M. Yin, and Y. Chen, J. Rare Earths. 35[4] (2017) 356.
-

- 31. U. Gangadharini, A.R. Molla, A. Tarafder, and B. Karmakar, J. Am. Ceram. Int. 96[7] (2013) 2155-2162.
-

- 32. Y. Wu, F. Yang, H. Zhang, F. Yan, and R. Zuo, J. Ceram. Process. Res. 22[4] (2021) 436-440.
-

- 33. X. Tian, L. Li, M. Wei, C. Ji, Z. Huang, X. Liu, J. Wen, and Y. Peng, J. Ceram. Process. Res. 22[5] (2021) 555-567.
-

 This Article
-
2024; 25(5): 768-775
Published on Oct 31, 2024
- 10.36410/jcpr.2024.25.5.768
- Received on May 24, 2024
- Revised on Aug 16, 2024
- Accepted on Sep 5, 2024
 Services
- Abstract
introduction
experimental procedure
results and discussion
conclusion
- Acknowledgements
- References
- Full Text PDF
Shared
 Correspondence to
- Seunggu Kang
-
Department of Advanced Material Engineering, Kyonggi University, Suwon, Kyonggi-do, 16227, Korea
Tel : +82-31-249-9767 Fax: +82-31-249-9774 - E-mail: sgkang@kyonggi.ac.kr


 ) indicating that the maximum point represents the optimum temperature for nucleation. Here, Tp signifies the crystallization temperature of the parent glass.
 Copyright 2019 International Orgranization for Ceramic Processing. All rights reserved.