- Constitutive modeling of transition in a micro-alloyed forging steel from static to metadynamic recrystallization
Wen-Bo Yang*, Ji-Peng Zhao, Tian-Ju Ma, Jian-Jun Zhang, Hai Zhang, Xue-Hu Yang and Gang-Gang Li
Science and Technology on Vacuum Technology and Physics Laboratory, Lanzhou Institute of Physics, Lanzhou 730000, China
This article is an open access article distributed under the terms of the Creative Commons Attribution Non-Commercial License (http://creativecommons.org/licenses/by-nc/4.0) which permits unrestricted non-commercial use, distribution, and reproduction in any medium, provided the original work is properly cited.
To obtain the post-recrystallization behaviors of a micro-alloyed forging steel, isothermal interrupted hot compression tests were performed on a Gleeble thermo-mechanical simulator. Double hit schedules were used for compression testing in the following temperature ranges: 1000 ℃-1150 ℃ for deformation, 0.01 s-1-10 s-1 for strain rate, and 0.5 s-20 s for inter-pass duration. To investigate the transition between static and metadynamic recrystallization, three distinct pre-strains (0.32, 0.40, and 0.48) were performed in the initial compression. According to experimental results, the post-recrystallization softening behaves differently depending on the imposed pre-strain and becomes strain-independent as the deformation temperature rises, which suggests that the transition and metadynamic recrystallization are included in the post-recrystallization for the steel under the deformation conditions above. Then, a model was constituted to predict the kinetics of the transition, while accounting for strain-dependence compensation. The assessed outcomes suggest that the proposed constitutive model may provide a precise prediction for the kinetics of the transition in the micro-alloyed forging steel.
Keywords: Post-recrystallization behavior, Pre-strain, Constitutive model, Micro-alloyed forging steel.
In hot forming operations, metal can undergo three common softening mechanisms: dynamic recrystallization (DRX) during deformation, metadynamic recrystallization (MDRX), and static recrystallization (SRX) during inter-pass periods [1-9]. Usually, when the critical strain εc is reached, DRX will occur. So, DRX is strain-dependent significantly. The critical strain is related to the strain for the peak stress in the flow curve, called peak strain εp. The deformation temperature and strain rate have a significant influence on the peak strain during the deformation process. It is well documented that SRX acts as the primary post-recrystallization softening process in modeling hot working if the pre-strain during deformation is smaller than εc. If the pre-strain during deformation is greater than εc, MDRX is caused by the continuous growth of nuclei generated as a result of DRX between deformation passes. The majority of researchers approved that strain rate had less of an impact on SRX than pre-strain and deformation temperature [10-13]. Conversely, strain rate was the main factor influencing the kinetics of MDRX, with deformation temperature having a minor impact but no bearing on pre-strain [14-19].
Actually, the post-recrystallization is divided into SRX and MDRX within a pre-strain range, εc-εT. At pre-strains under εc, the classical SRX performs as the post-recrystallization softening mechanism. There is a transition where both SRX and MDRX are involved in the pre-strain range of εc-εT. Only MDRX takes place after εT is applied. These phenomena were observed by Bai [20] and Uranga [13] by studying the post-recrystallization softening mechanism in Nb microalloyed steel. Bai obtained a relationship of εT =1.5εp. Uranga derived a combined model to predict the kinetics of post-recrystallization for the pre-strain range based on the contributions of both SRX and MDRX. However, a great deal of experiments are needed to investigate SRX behaviors. Furthermore, because of significant delays between both kinetics [12], the combined model is very complicated for employing computer program to simulate the behavior of materials. Therefore, it is essential to further study the kinetics of the transition and constitute a convenient and accurate model to predict the kinetics of the transition.
A micro-alloyed forging steel, which is widely used in hot forging automotive, is studied in this investigation. The softening mechanisms are obvious during the hot forming process. So, isothermal interrupted hot compression experiments are applied to examine the post-recrystallization behaviors of the steel. The effects of pre-strain on the kinetics of post-recrystallization were discussed. Then, the model was developed to predict the kinetics of the transition between SRX and MDRX while taking strain dependence into account. Finally, an additional evaluation of the proposed constitutive model’s accuracy was conducted.
This study’s material is a type of forging steel with a representative micro-alloy. The material is widely employed for hot forging automotive components. The primary advantages of this type of steel, aside from its excellent strength, hardness, and wear resistance, are economical and environmentally friendly production methods, for its important strength and toughness improvements are mostly obtained by utilizing elements like Nb, Ti, V and controlled rolling or forging [21]. Table 1 provides the chemical composition of the material. Isothermal interrupted hot compression tests were performed on cylindrical specimens measuring 8 mm in diameter and 12 mm in height to examine the post-recrystallization behaviors.
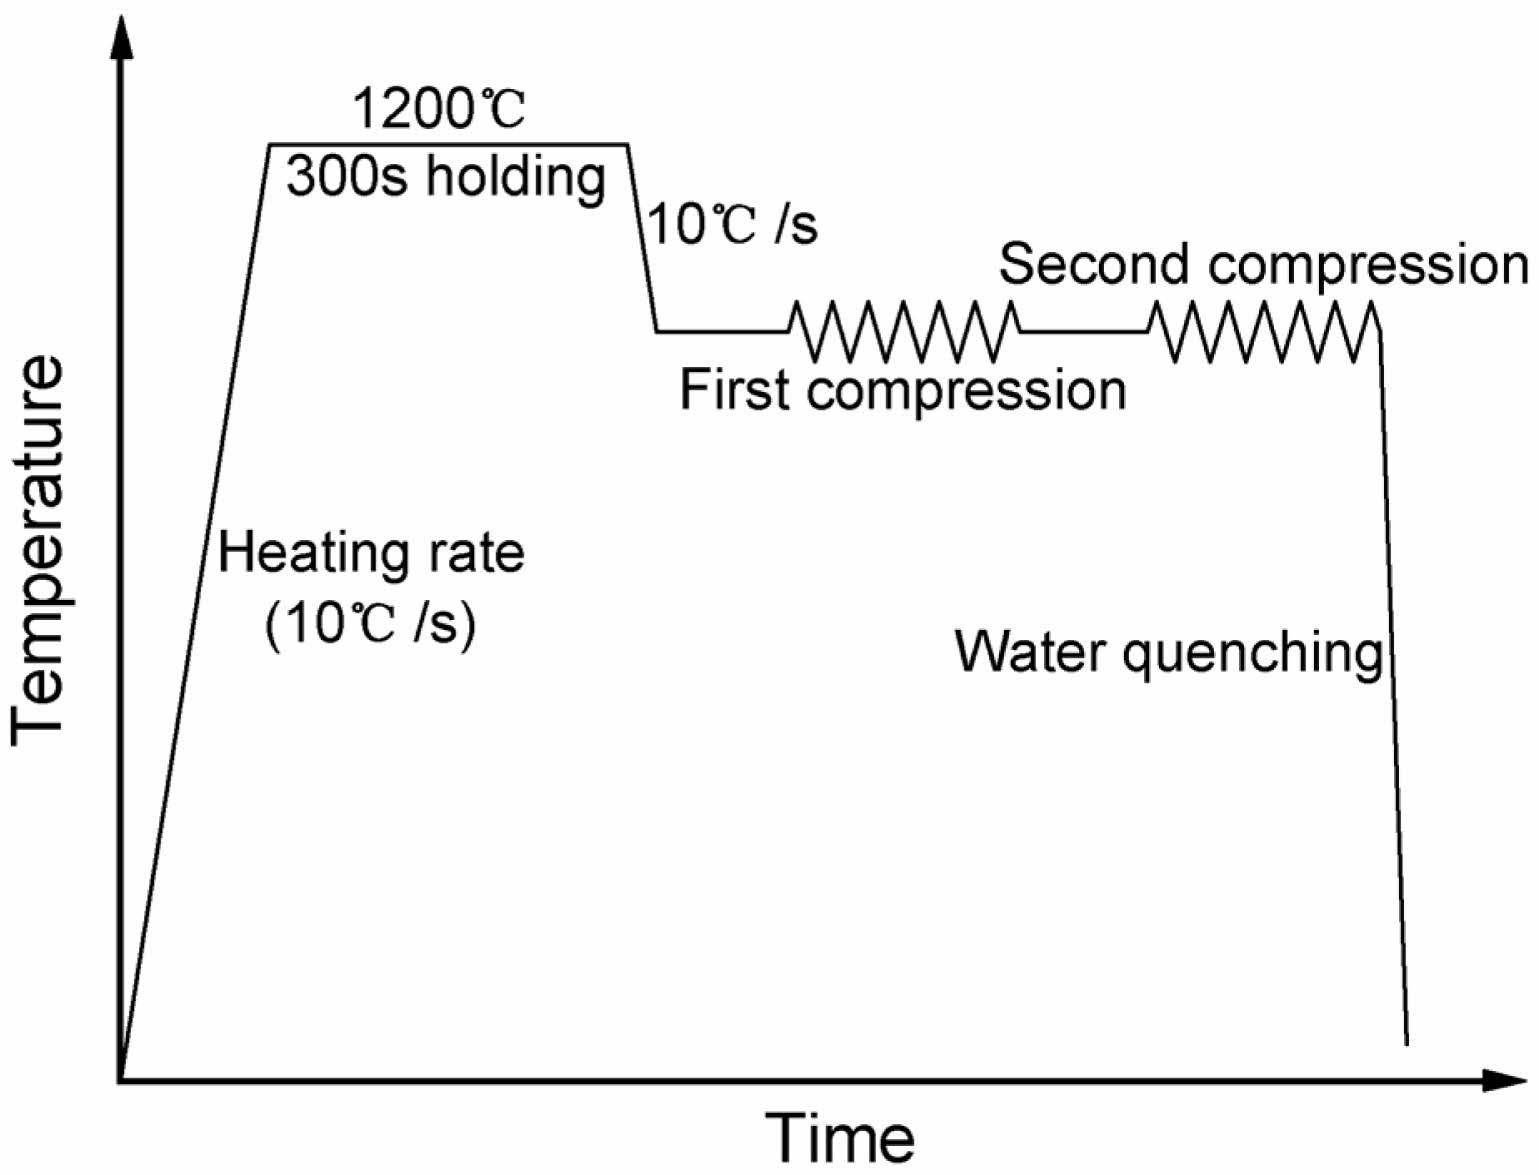
Employing a Gleeble thermo-mechanical simulator, the isothermal interrupted hot compression experiments were carried out. To reduce the level of friction between the anvils and the specimens’ end faces, graphite was applied to their end faces. A schematic diagram of the compression process is displayed in Fig. 1. To ensure that all the specimens’ initial grain sizes matched one another, the specimens were heated to 1200 °C at a rate of 10 °C/s and kept there for 300 seconds before being compressed. After that, in order to determine the SRX and MDRX under the deformation conditions of the hot forming process, the specimens were cooled at a rate of 10 °C/s to deformation temperatures (1000 °C, 1050 °C, 1100 °C, and 1150 °C), and they were kept there for 30 seconds to eliminate the temperature gradient. Subsequently, the initial compressions were performed at four different strain rates (0.01 s-1, 0.1 s-1, 1 s-1 and 10 s-1). Three different pre-strains (0.32, 0.40, and 0.48), which are greater than εc, in the initial compression were applied to describe the transition between SRX and MDRX. Naturally, the initial deformation is less than the steady-state strain (about 1.5εp) and above the critical strain for DRX. Following, the specimens were released from the load and kept at the deformation temperatures for several intervals of durations (0.5, 1, 2, 5, 10, and 20 seconds) to facilitate post-recrystallization. Subsequently, the specimens performed a 0.1 strain application to start the second compression. The strain rates and deformation temperatures were similar to those of the initial compression. Immediately following the second compression, the specimens underwent quenching to maintain the austenite microstructures’ grain boundaries.
|
Fig. 1 Schematic diagram of the compression process. |
Flow stress-strain curves
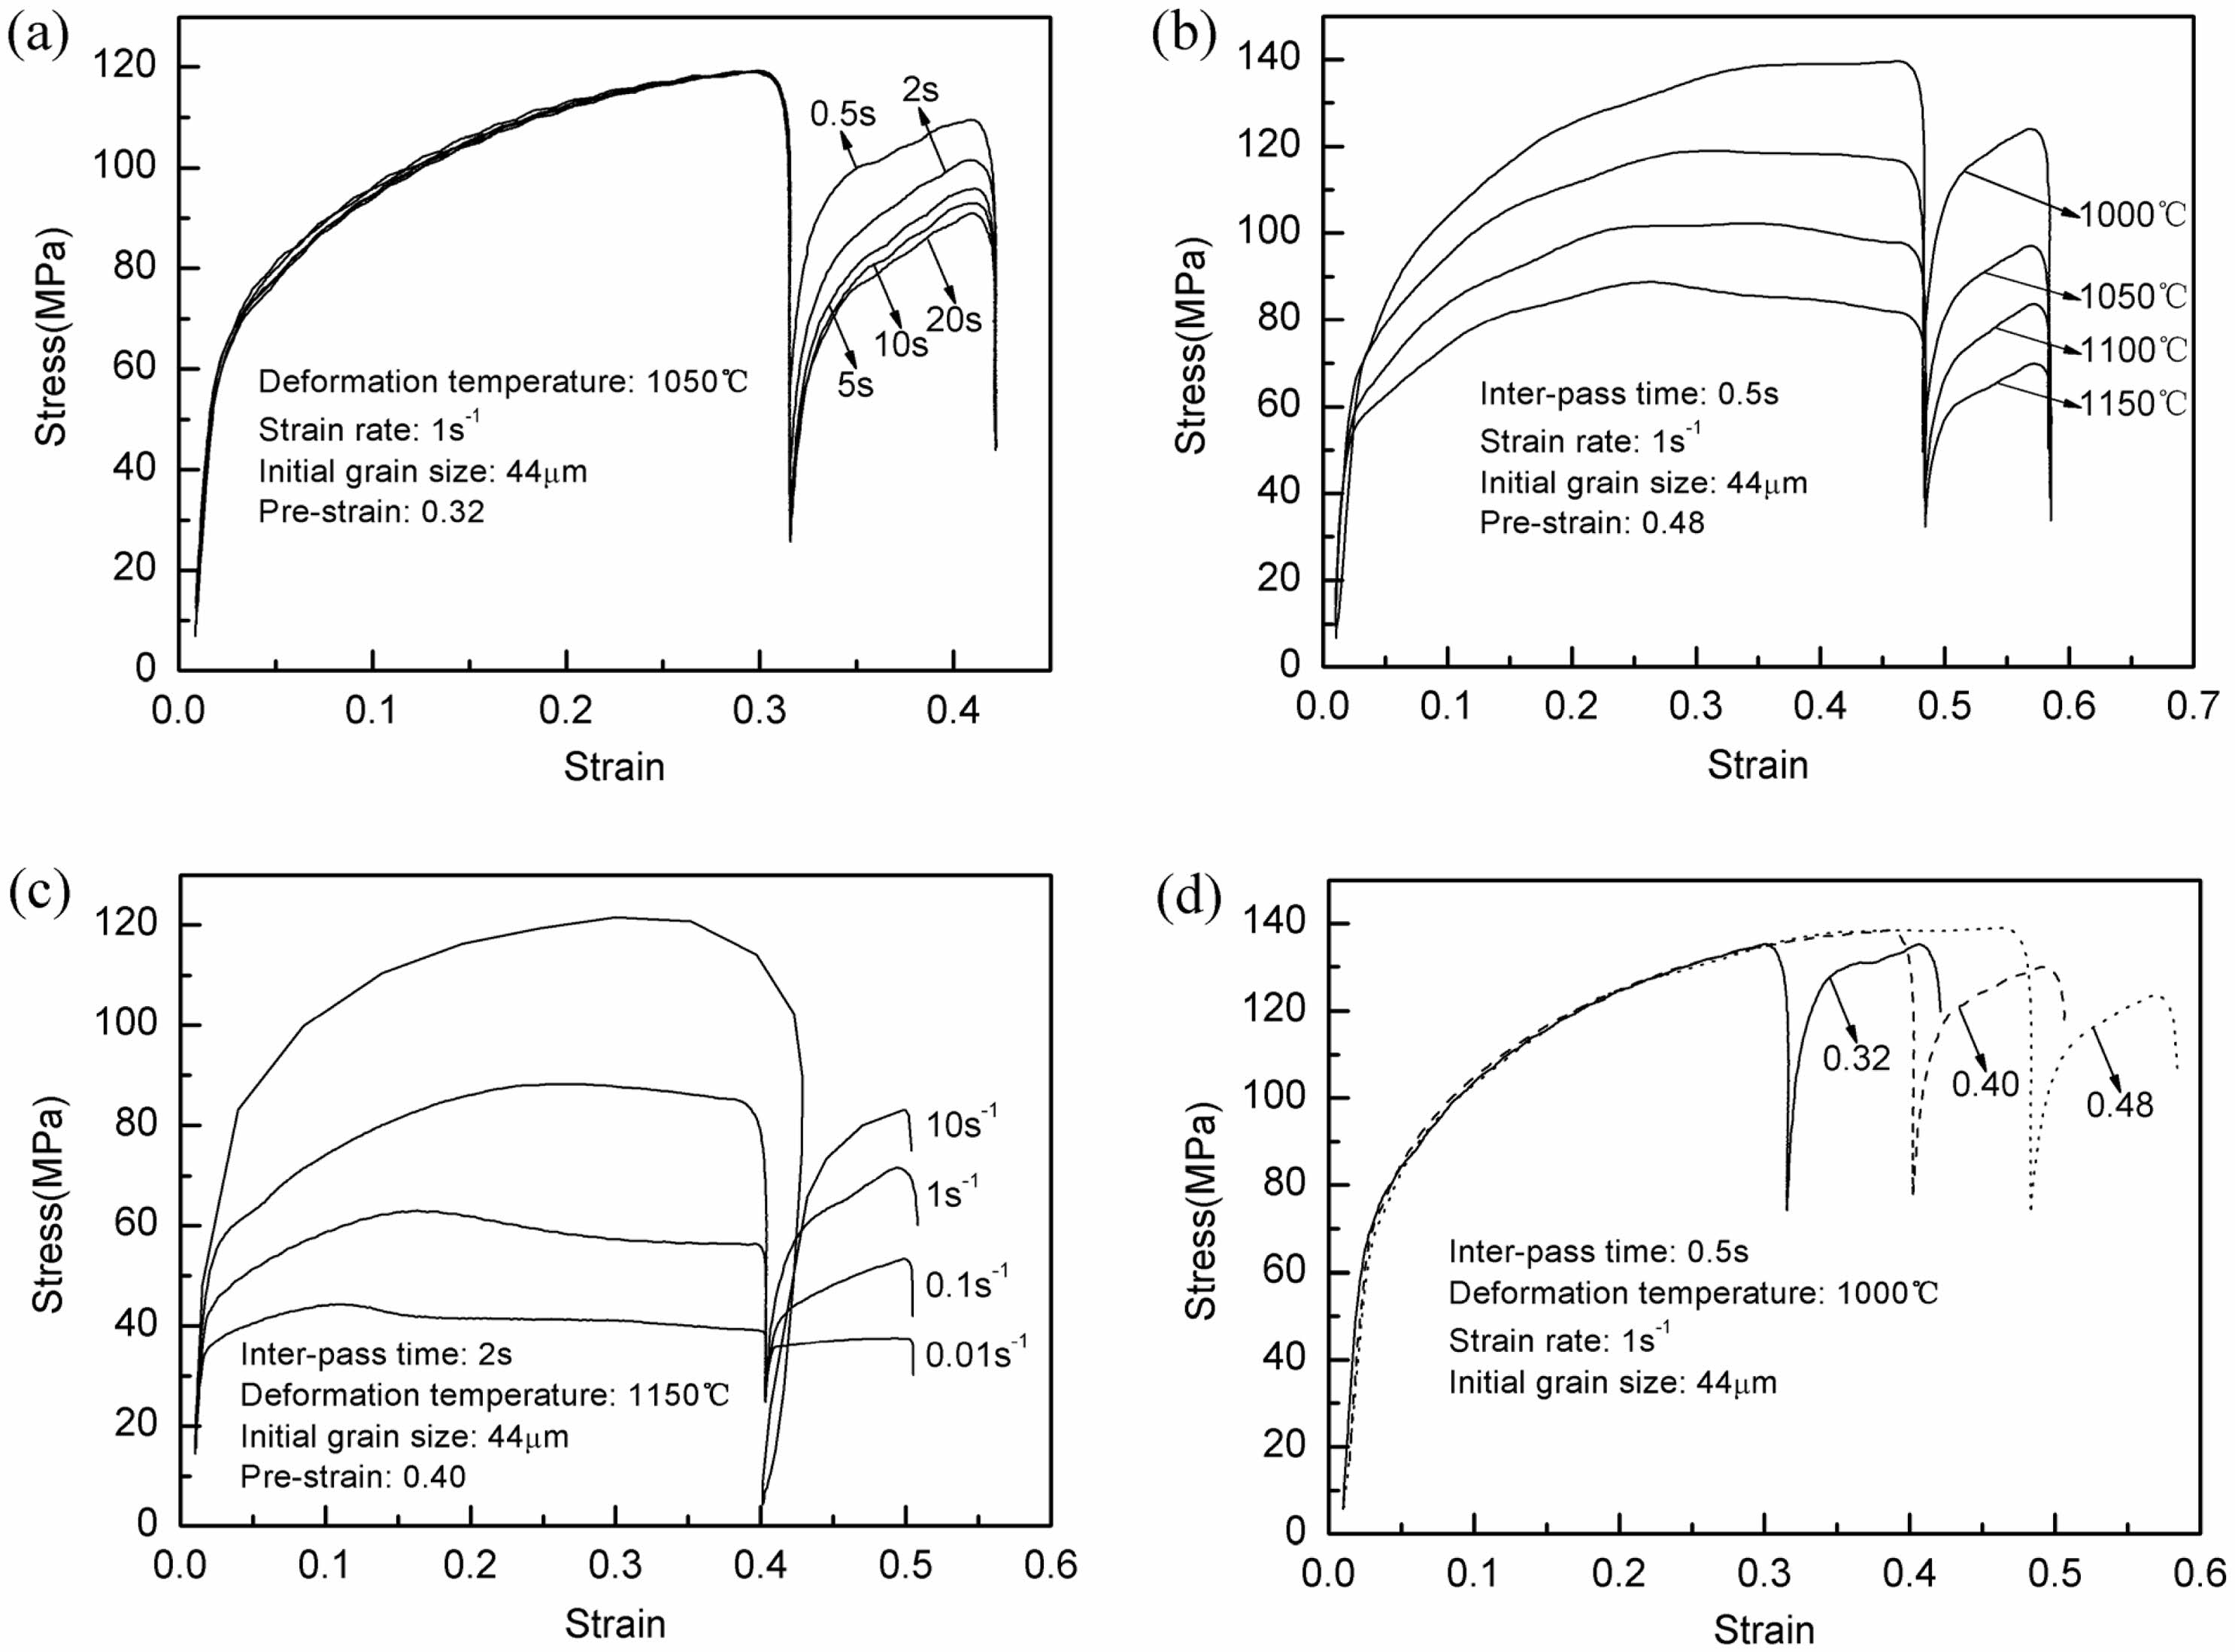
Figure 2 illustrates the picked flow stress-strain curves that were acquired during the micro-alloyed forging steel’s isothermal interrupted hot compression tests at various inter-pass durations, deformation temperatures, strain rates, and pre-strains. Fig. 2(a) shows that, in general, the yield stress in the second compression falls as the inter-pass duration increases. This indicates that, with increasing inter-pass time, significant post-recrystallization occurred. The yield stress in the second compression equals that of the initial compression as the inter-pass duration increases to 10 s, indicating full post-recrystallization [18, 22, 23]. Furthermore, as Fig. 2(b) and (c) demonstrate, the flow stress is found to be sensitive to both strain rate and deformation temperature. At the other fixed experimental conditions, there is a noticeable decrease in the flow stress level with increasing deformation temperature or decreasing strain rate. Fig. 2(d) displays the flow stress-strain curves at different pre-strains with a deformation temperature of 1000 ℃. It is evident that, under the other set of experimental circumstances, the yield stress in the second compression normally falls as the pre-strain increases.
Softening curves
The yield stress at high temperature is a sensitive indicator of structural alterations, which is the foundation of the interrupted deformation approach. The post-recrystallization softening fraction was measured in this work using the 0.2% offset yield strength. The following formula is used to calculate the softening fraction X [24-27]:

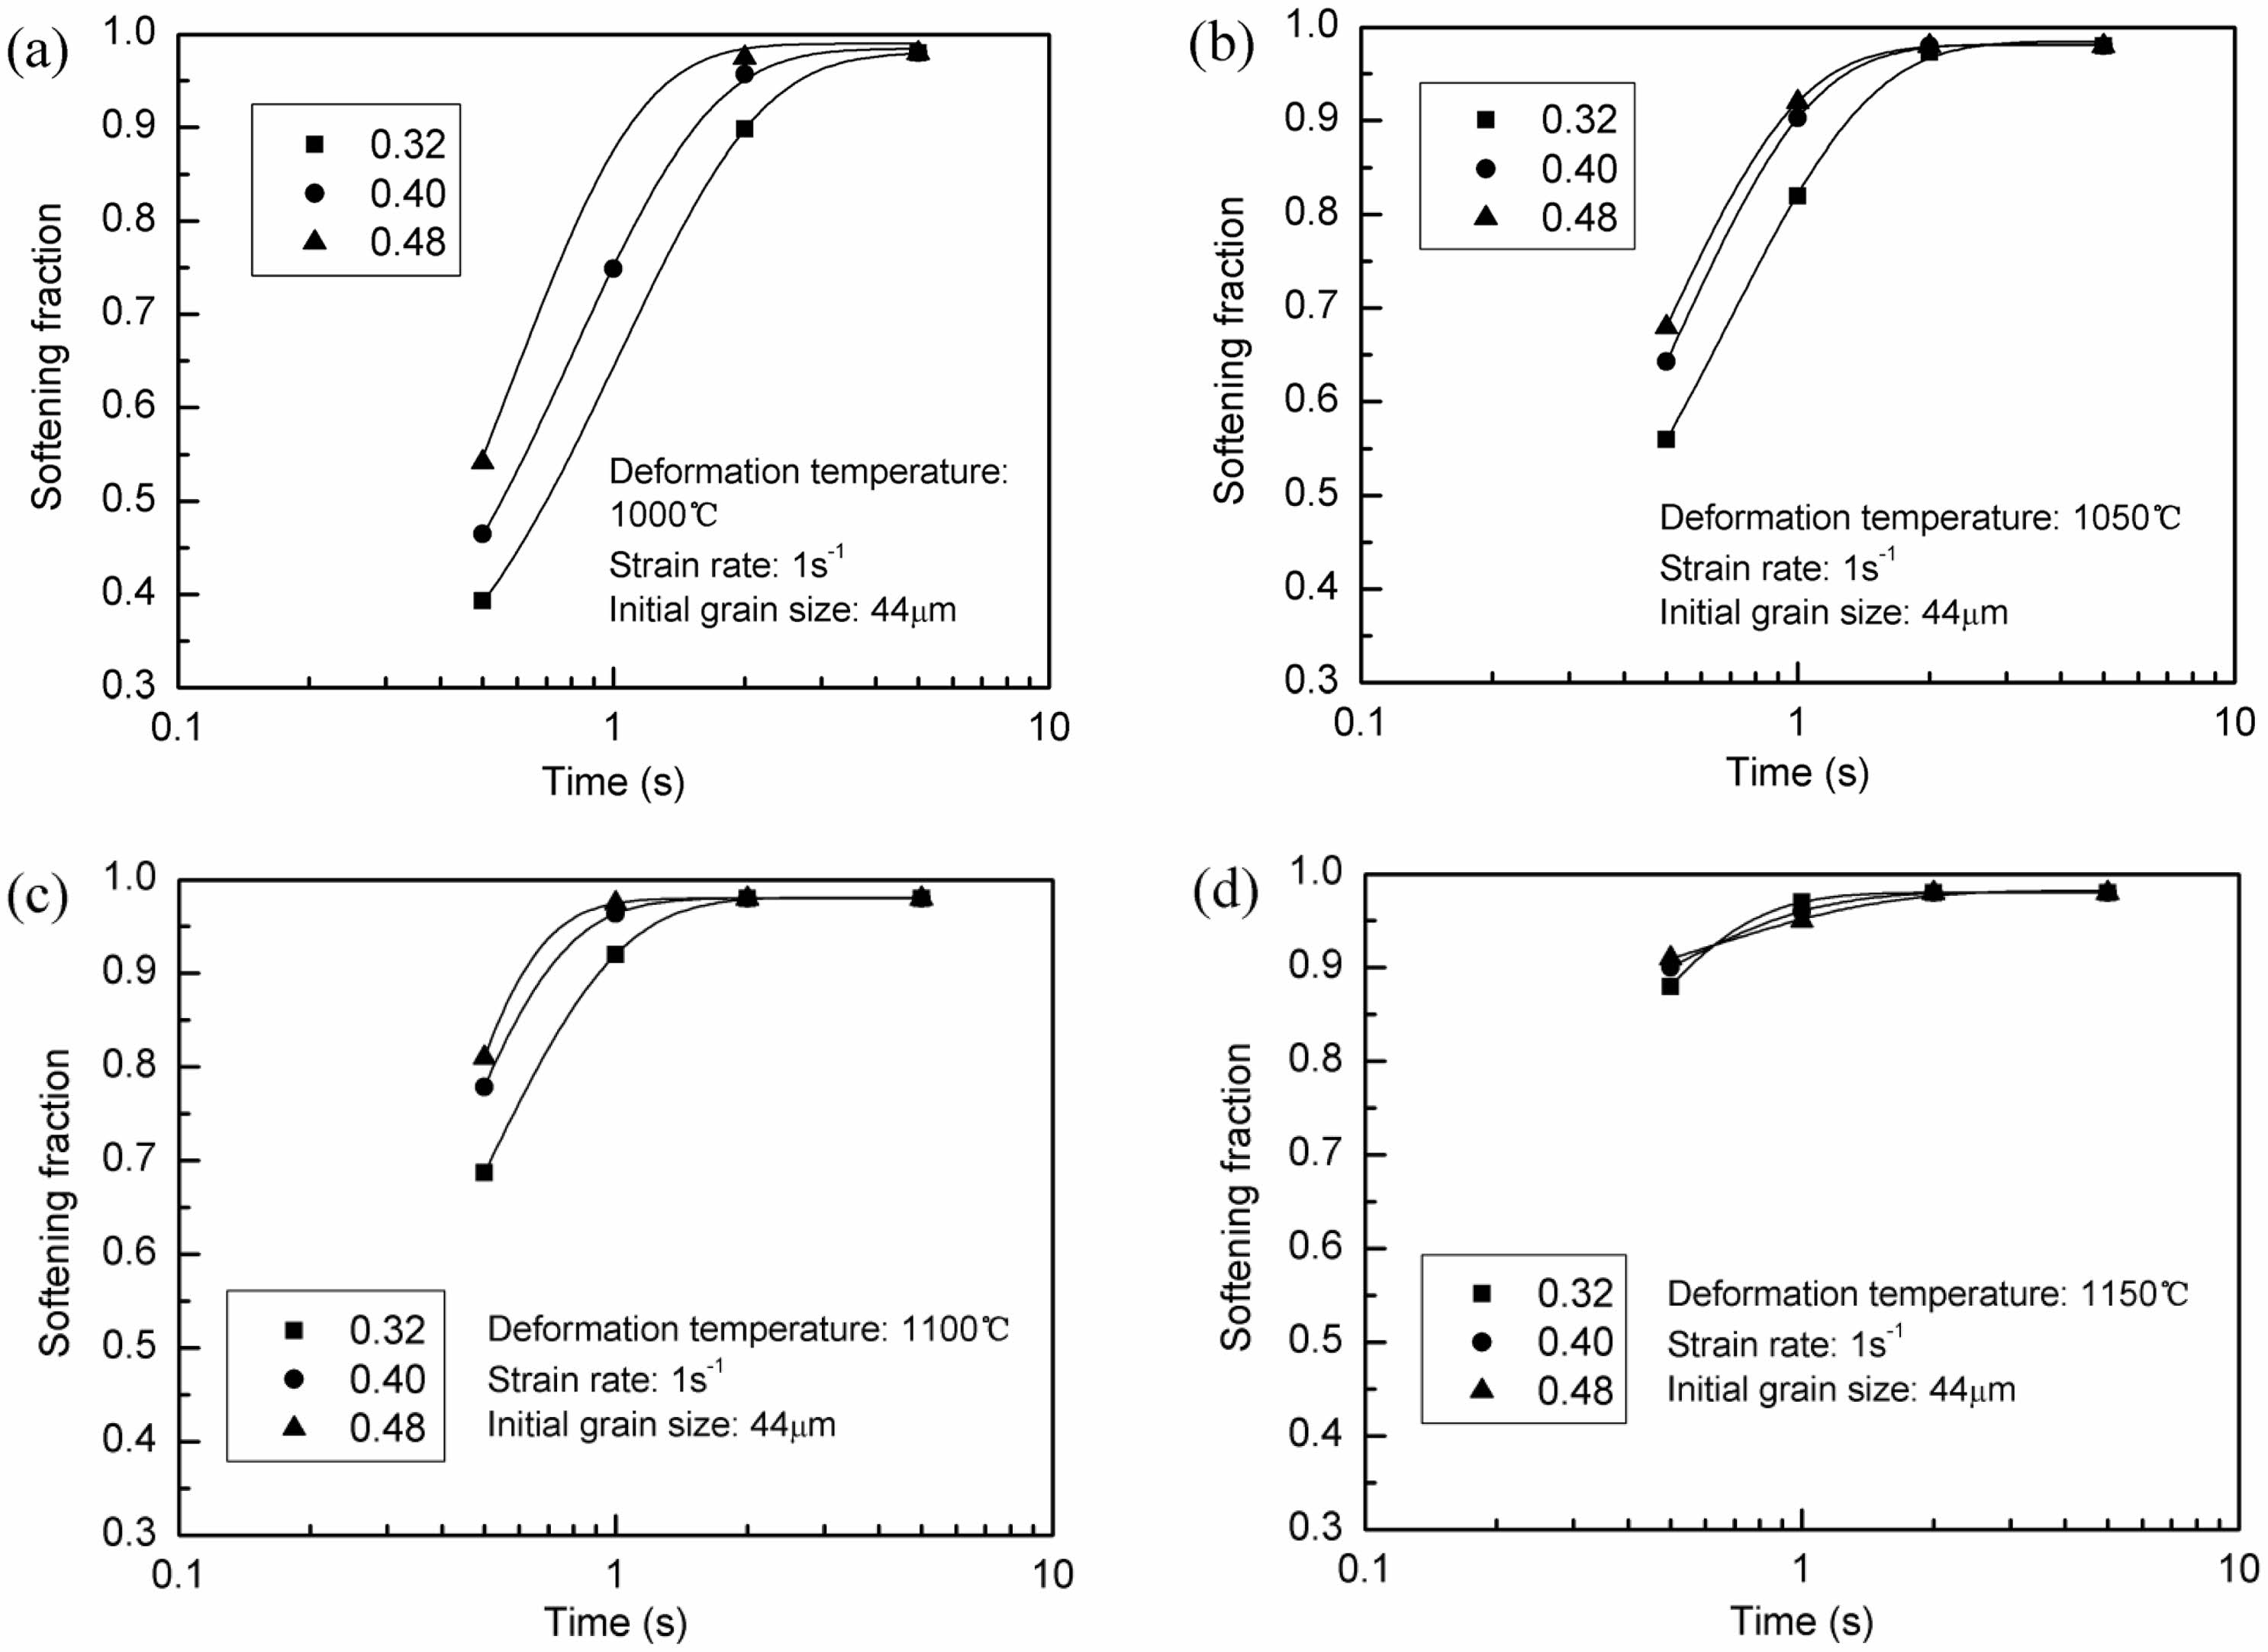
where the flow stress at the end interruption is represented by σm, the 0.2% offset yield flow stress in the initial compression is denoted by σ1, and in the second, by σ2. Eq. (1) can be utilized to ascertain the steel’s post-recrystallization softening fraction by using the flow strain-stress data that was acquired. Plotting the softening fraction versus the inter-pass duration for three distinct pre-strains at a strain rate of 1 s-1 is demonstrated in Fig. 3(a-d). According to Fig. 3(a), the MDRX softening fraction at the inter-pass duration of 0.5 s is only 39.3% at the pre-strain of 0.32 and rises to 53.5% at the pre-strain of 0.48. The complete post-recrystallization softening occurs at the inter-pass duration of 5s. All the softening curves show that as inter-pass duration increases, the rate of softening decreases. With the increase of the deformation temperature, the post-recrystallization softening phenomena are more obvious, the softening fractions at the deformation temperature can be up to 85%. Evidently, the Avrami equation is followed by the softening curves [28]. The softening fraction at the pre-strain of 0.48 is much larger than that at the pre-strain of 0.40 in Fig. 3(a) when compared to the softening curves in Fig. 3(a-d). However, in Fig. 3(b) and (c), the softening fraction at the pre-strain of 0.48 is close to that at the pre-strain of 0.40. The variation in softening fraction between the pre-strains is not very noticeable at the deformation temperature of 1150 ℃. It is clear that the changes in metadynamic softening fraction are not very marked for three different pre-strains, which proposed that there are variations in the softening mechanisms based on the imposed pre-strain.
|
Fig. 2 Flow stress-strain curves for various inter-pass durations (a), deformation temperatures (b), strain rates (c), and pre-strains (d) in the isothermal interrupted hot compression tests. |
|
Fig. 3 Post-recrystallization softening curves under different deformation conditions. 1000 ℃, (b) 1050 ℃, (c) 1100 ℃, (d) 1150 ℃. |
Effects of pre-strain on the softening behaviors
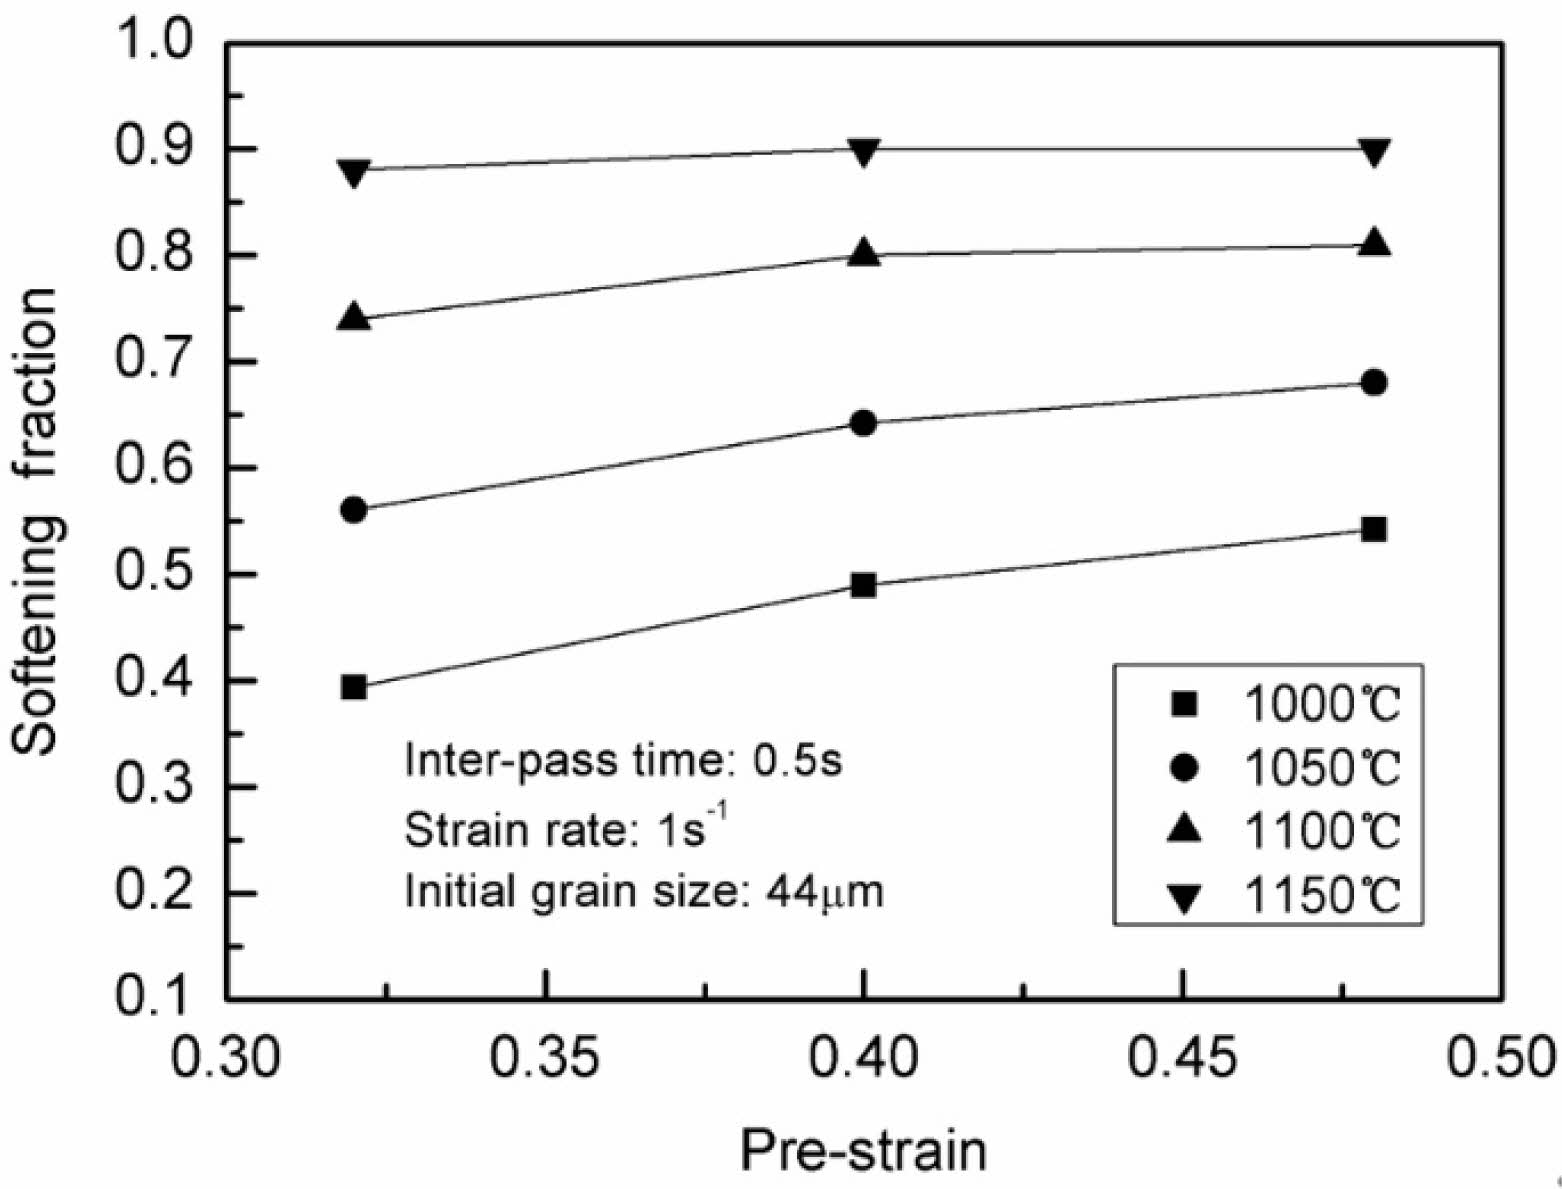
As demonstrated in Fig. 4, the determined softening fraction is plotted against the pre-strain for four distinct deformation temperatures at a 0.5 s inter-pass duration. The softening fraction rises with the applied pre-strain at the deformation temperature of 1000 °C. However, the softening fraction is roughly 0.9 for various pre-strains at the deformation temperature of 1150 °C, and it is unaffected by additional increases in the applied pre-strain. As the deformation temperature increases, the softening presents two distinct behaviors depending on the applied pre-strain and eventually becomes strain-independent.
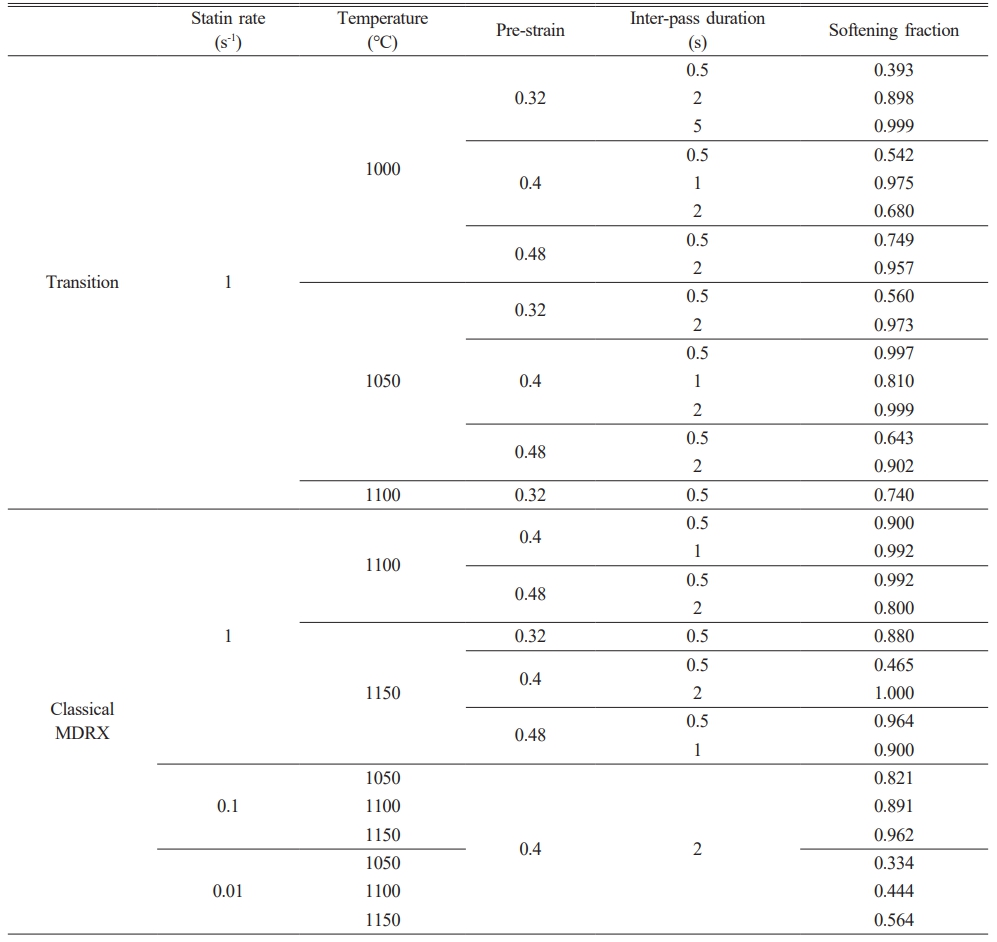
Based on the relationship of εT =1.5εp obtained by Bai [20], the measured values of εc and εT under various deformation circumstances are listed in Table 2. According to Fig. 4, the pre-strains are in the pre-strain range of εc-εT for the post-recrystallization behaviors at the deformation temperature of 1000 ℃, while they are out of the pre-strain range for these when the temperature of deformation is 1150 ℃, which suggests that the transition between SRX and MDRX occurs at the deformation temperature of 1000 ℃. The softening fraction exhibits the strain-dependent behavior under these deformation conditions. On the contrary, the classical strain-independent MDRX occurred when the temperature of deformation is 1150 ℃. Therefore, the transition and MDRX are included in the post-recrystallization for the steel under the deformation conditions. The values of two kinds of softening fractions are given in Table 3.
Modeling the kinetics of the transition
The softening kinetics in the strain range of εc-εT involve SRX and MDRX. It can be inferred that the characteristics of the transition are similar to those of SRX and MDRX. Typically, the Avrami equation has the following form to characterize the softening kinetics of both static and metadynamic softening [15-19]:

where n is the material dependent constant, t0.5 is the time for 50% static or metadynamic recrystallization, and Xmdrx/srx is the static or metadynamic softening fraction. t0.5 is commonly expressed as follows for a particular initial grain size:

where ὲ is the strain rate, T is the absolute temperature, Qmdrx/srx is the apparent activation energy for static or metadynamic recrystallizatin, R is the gas constant, A, p and q are material dependent constants. q is equal to 0 for strain-independent MDRX. It can be found that the expression of SRX kinetics is similar to that of MDRX kinetics in many respects. Therefore, the kinetics of the transition can be described as the similar expression above. The softening kinetics of the transition can be described by the modified equation in the following form:

where Xtran is the softening fraction in the pre-strain range, t0.5/tran is the corresponding time for 50% recrystallizatin, k is the material dependent constant.
Determination of k
When both sides of Eq. (4) are logarithmically taken twice, the following results are obtained:

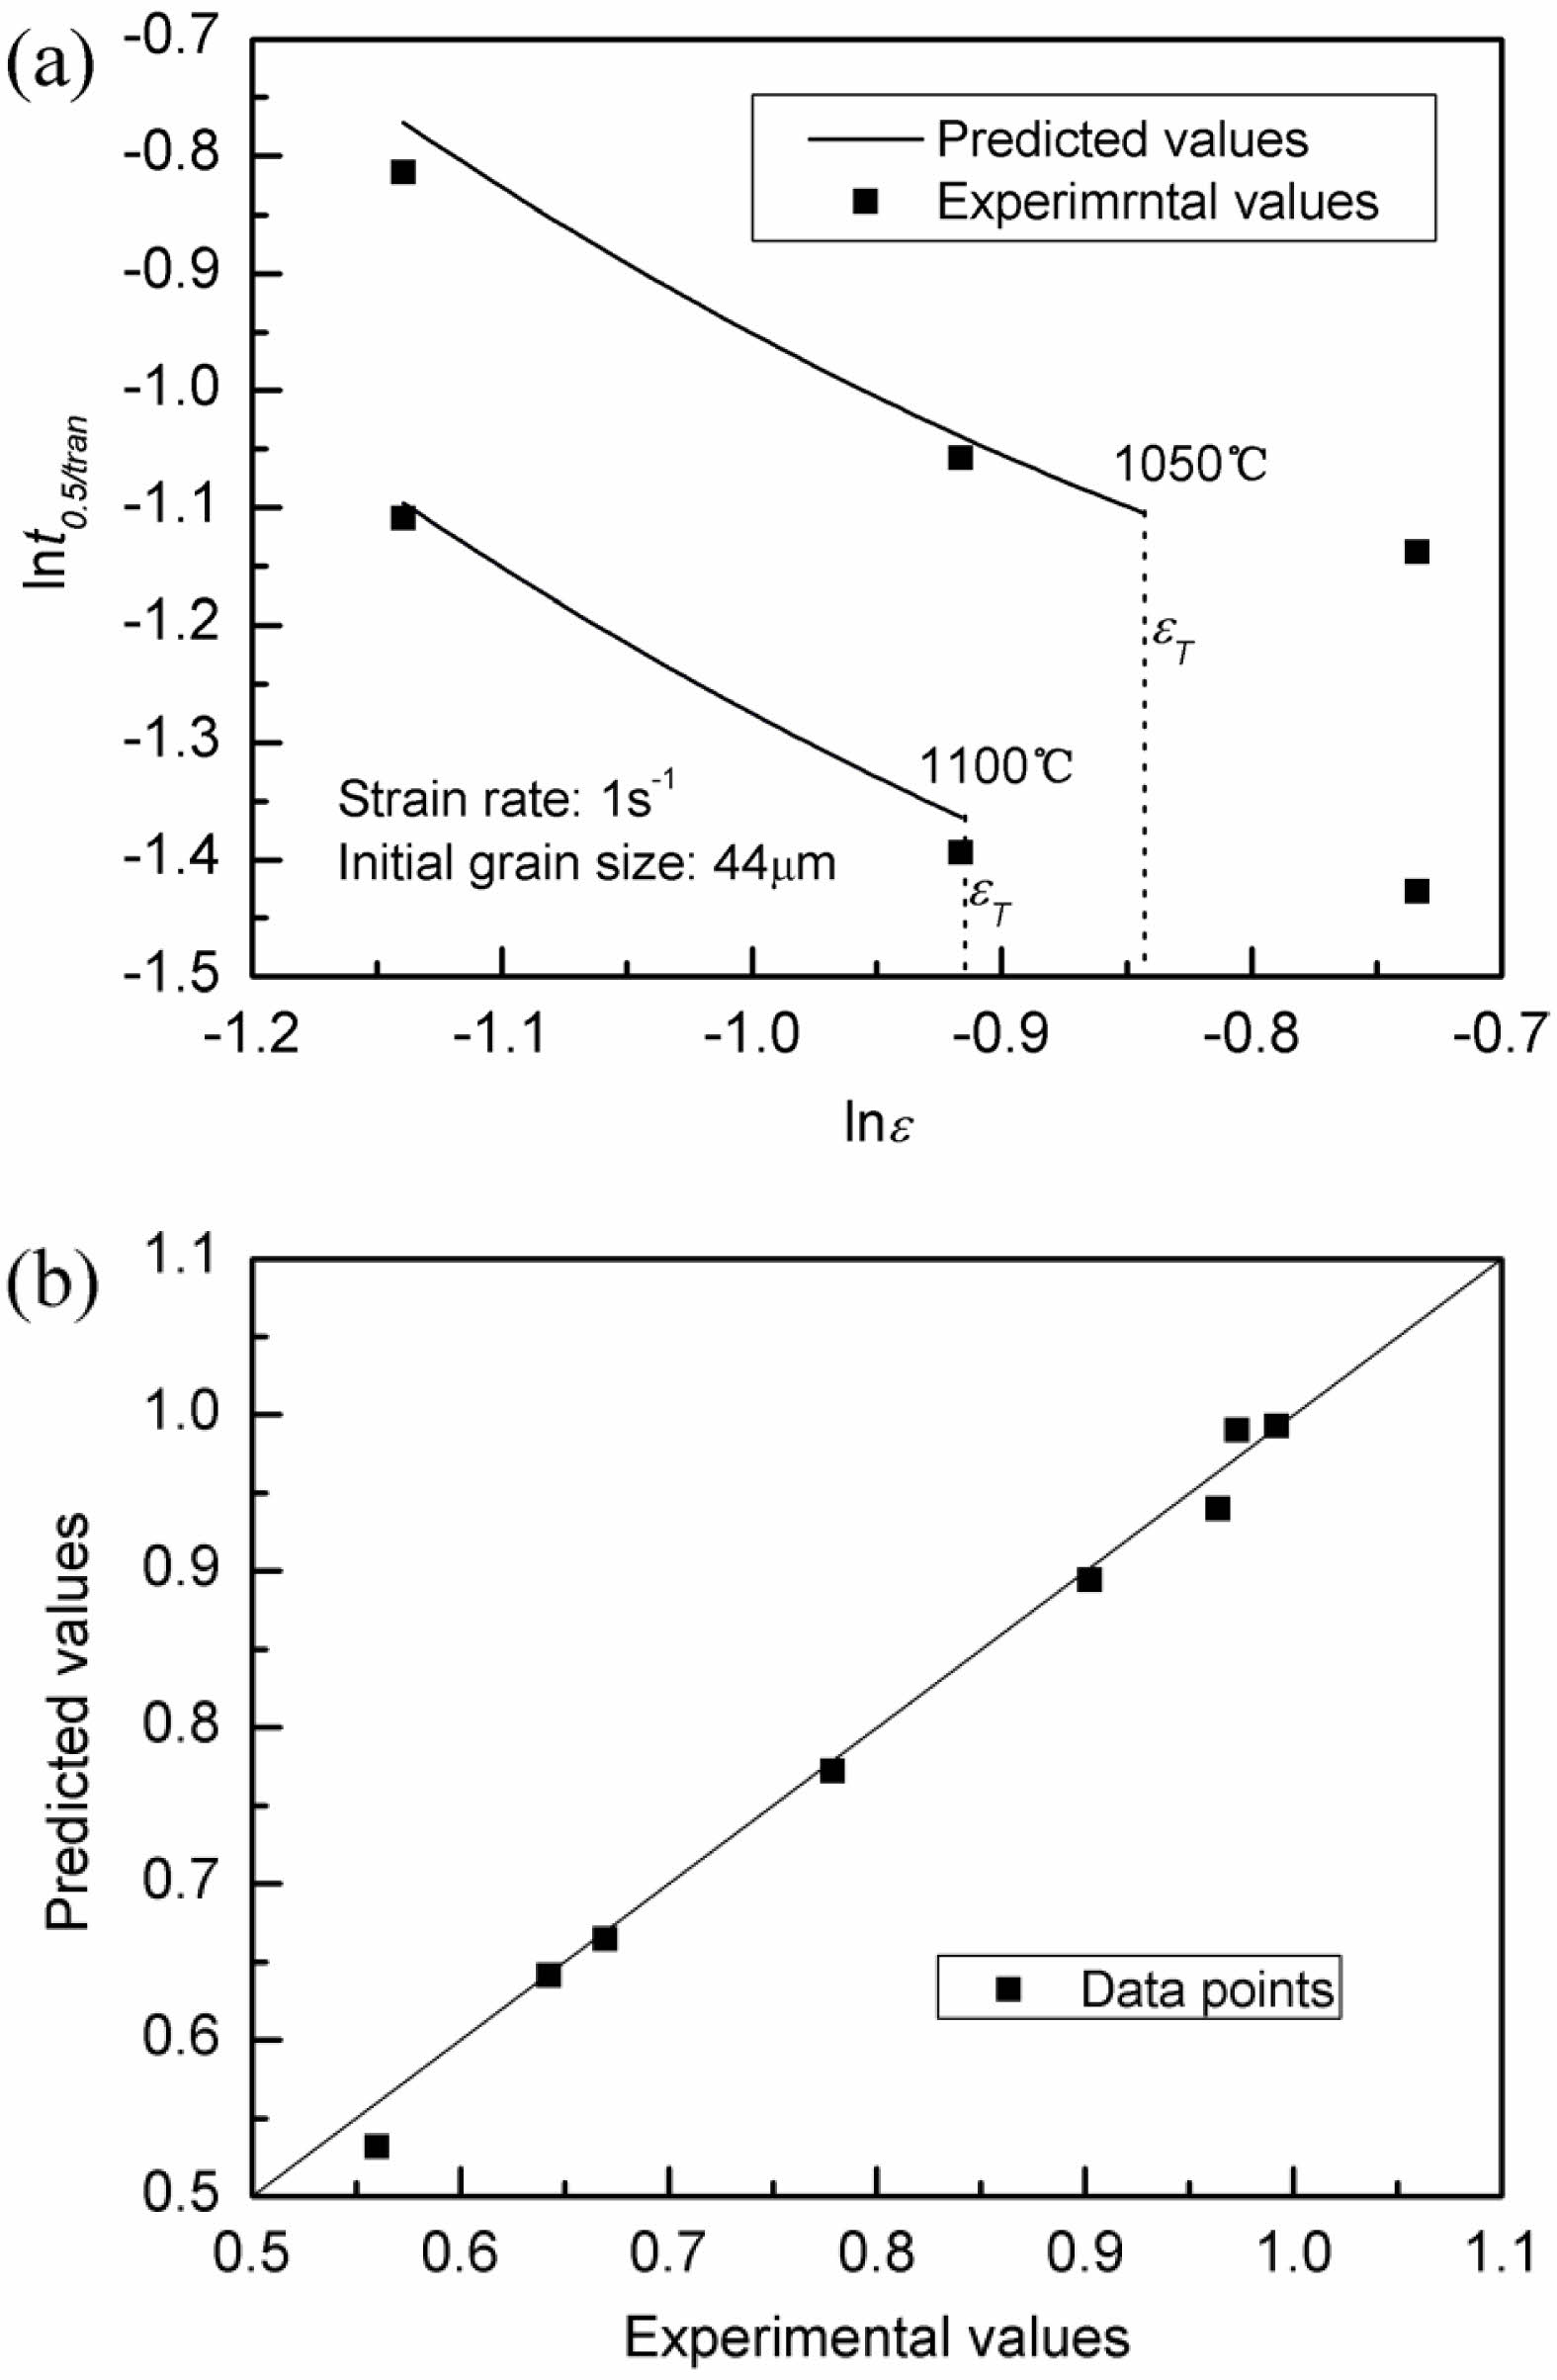
The values of the softening fraction Xtran and the associated inter-pass duration are then substituted into Eq. (5), as Table 3 illustrates. Fig. 5 displays the graphs of ln(ln(1/(1-Xtran))) vs lnt. The linear slope yields the values of k, and its average value is 1.13.
Determination of the expression of t0.5/tran
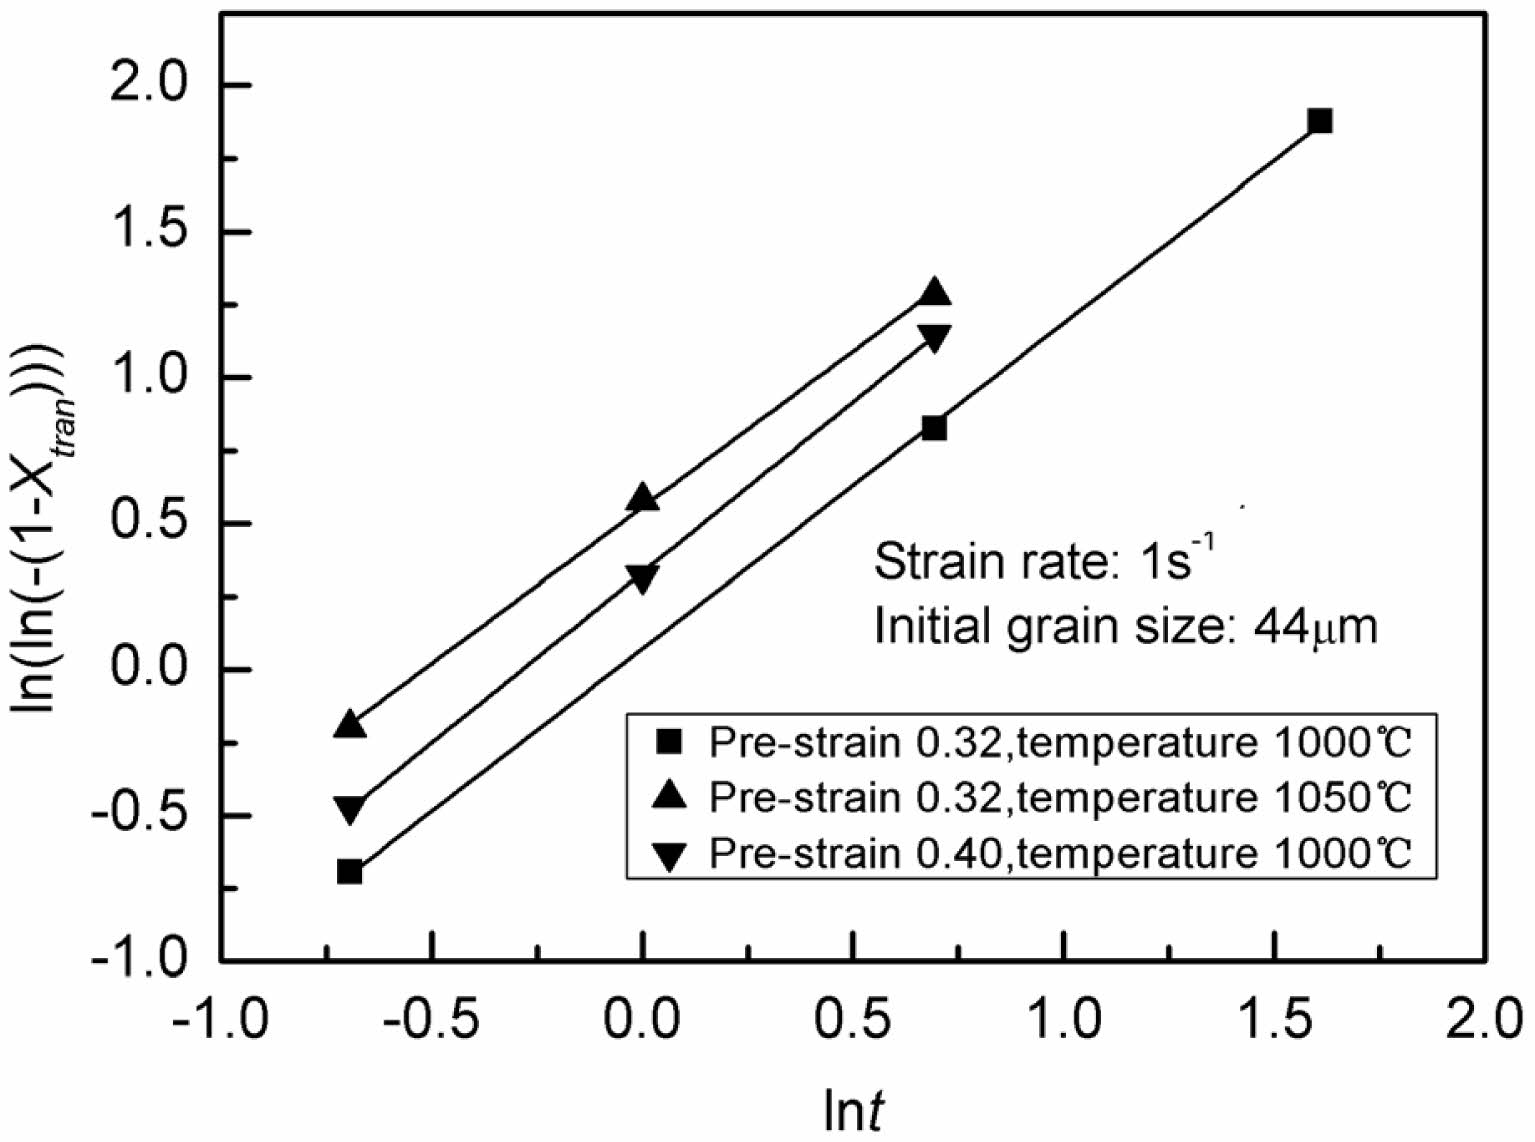
Plots of ln(ln(1/(1-Xmdrx))) vs lnt for the classical MDRX of the steel are displayed in Fig. 6 after the logarithm of both sides of Eq. (2) is taken twice and the values of the MDRX softening fraction Xmdrx and associated inter-pass duration are substituted. The linear slope gives the values of n, and its average value is 1.10. Accordingly, the average value of k is approximately to that of n, which suggests that MDRX is the dominant in the transition where SRX and MDRX are involved. Therefore, in order to simplify the expression of t0.5/train, it is supposed that the transition is regarded as strain-dependent MDRX, and the value of the apparent activation energy for the transition Qtran is approximately to that of MDRX. In addition, according to the experimental findings, pre-strain, strain rate, and deformation temperature all affect the transition’s kinetics. Thus, the expression for t0.5/tran is as follows.

where f (ε) is the strain-dependent compensating factor for SRX.
The logarithm of each side in Eq. (6) is as follows.

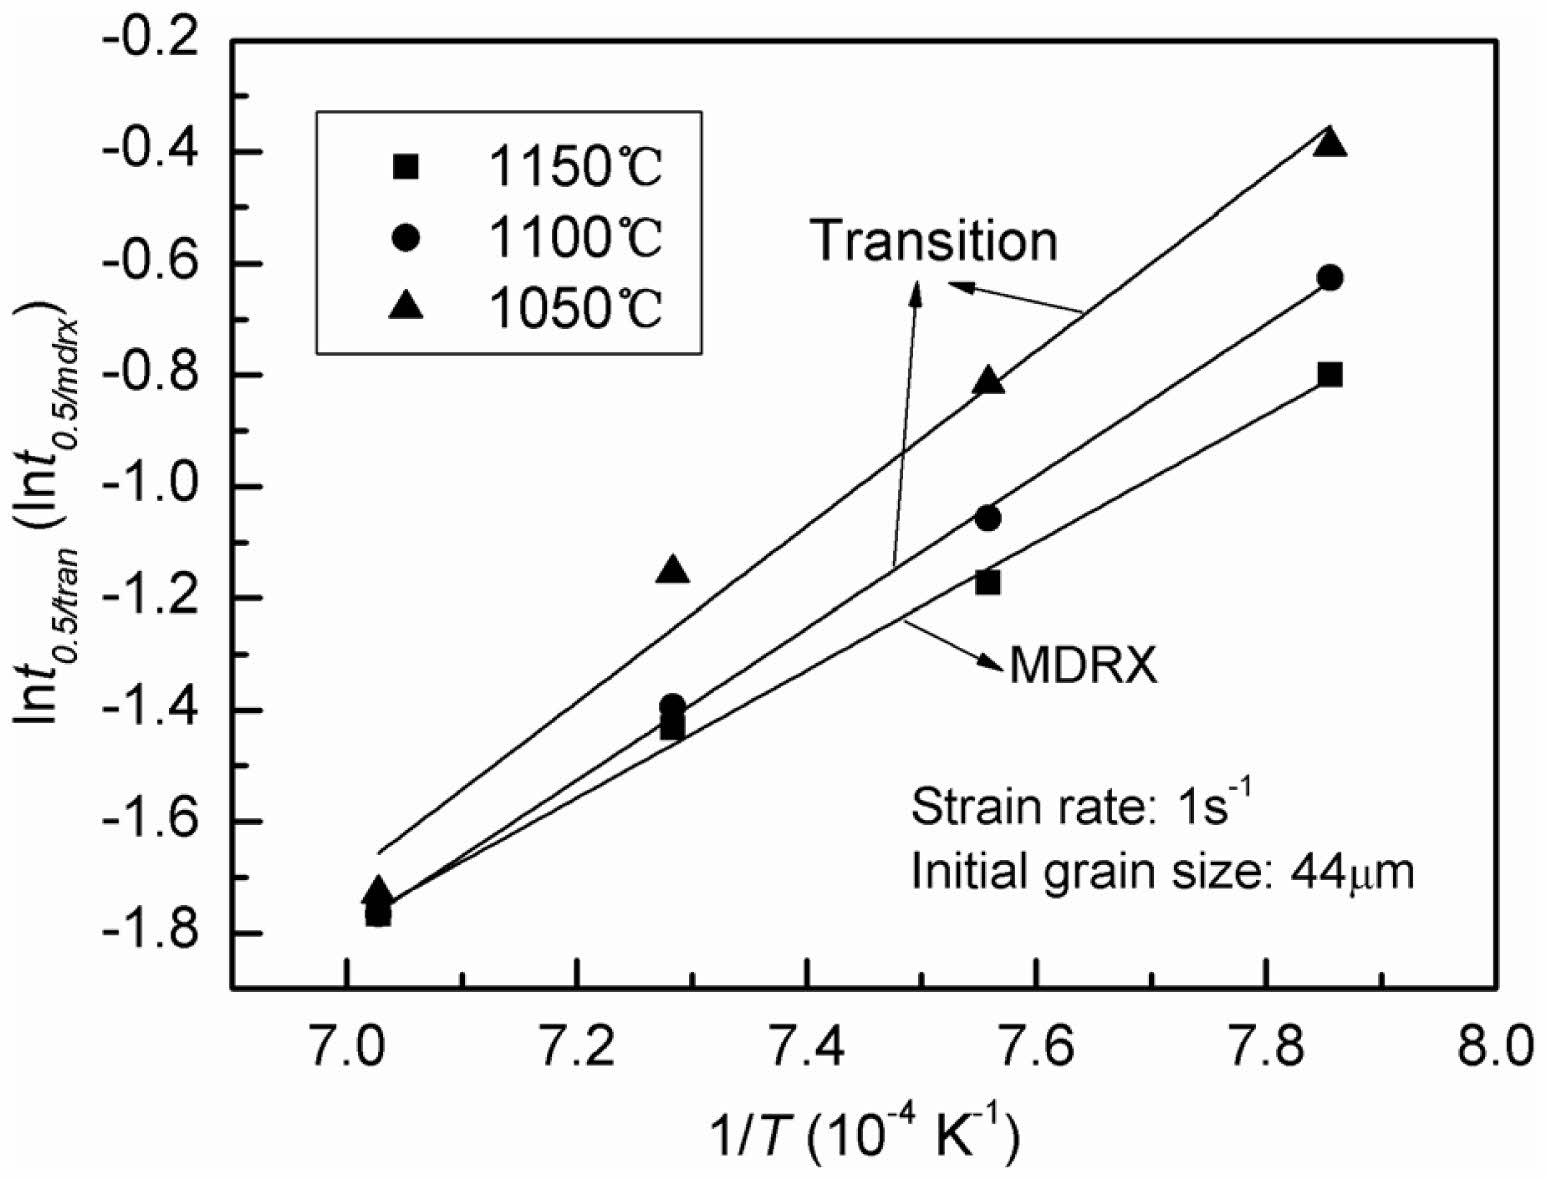
The values of t0.5/tran under various deformation conditions can be obtained from the relationships between Xtran and the associated inter-pass duration. Then, the relationships between lnt0.5/tran (lnt0.5/mdrx) and 1/T can be obtained as shown in Fig. 7. It can be found that the apparent activation energy for MDRX is smaller than that for the transition. The reason is that the activation energy for SRX is considerable higher than for MDRX [12]. The apparent activation energy Qmdrx is also obtained as 95.15 kJ/mol.
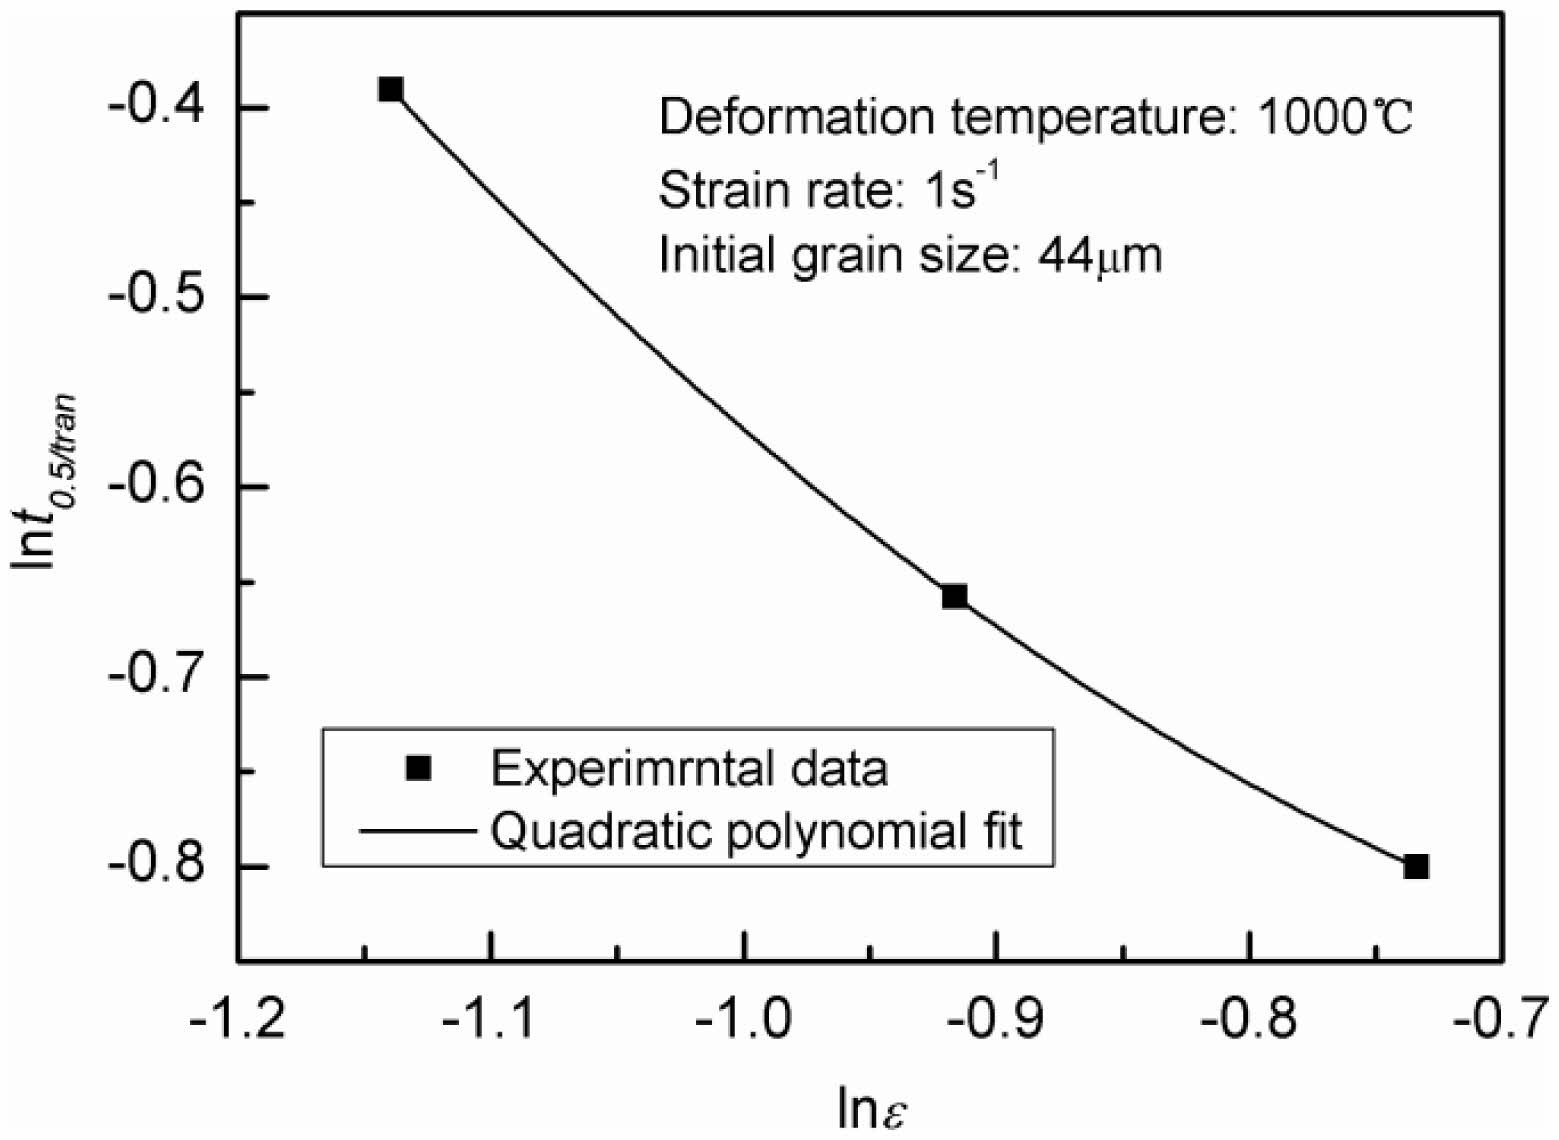
Then, the relationship between lnt0.5/tran and lnε can be obtained as shown in Fig. 8. A quadratic polynomial is used to fit the relationship. Therefore, the strain-dependent compensating factor f (ε) can be described as follows,
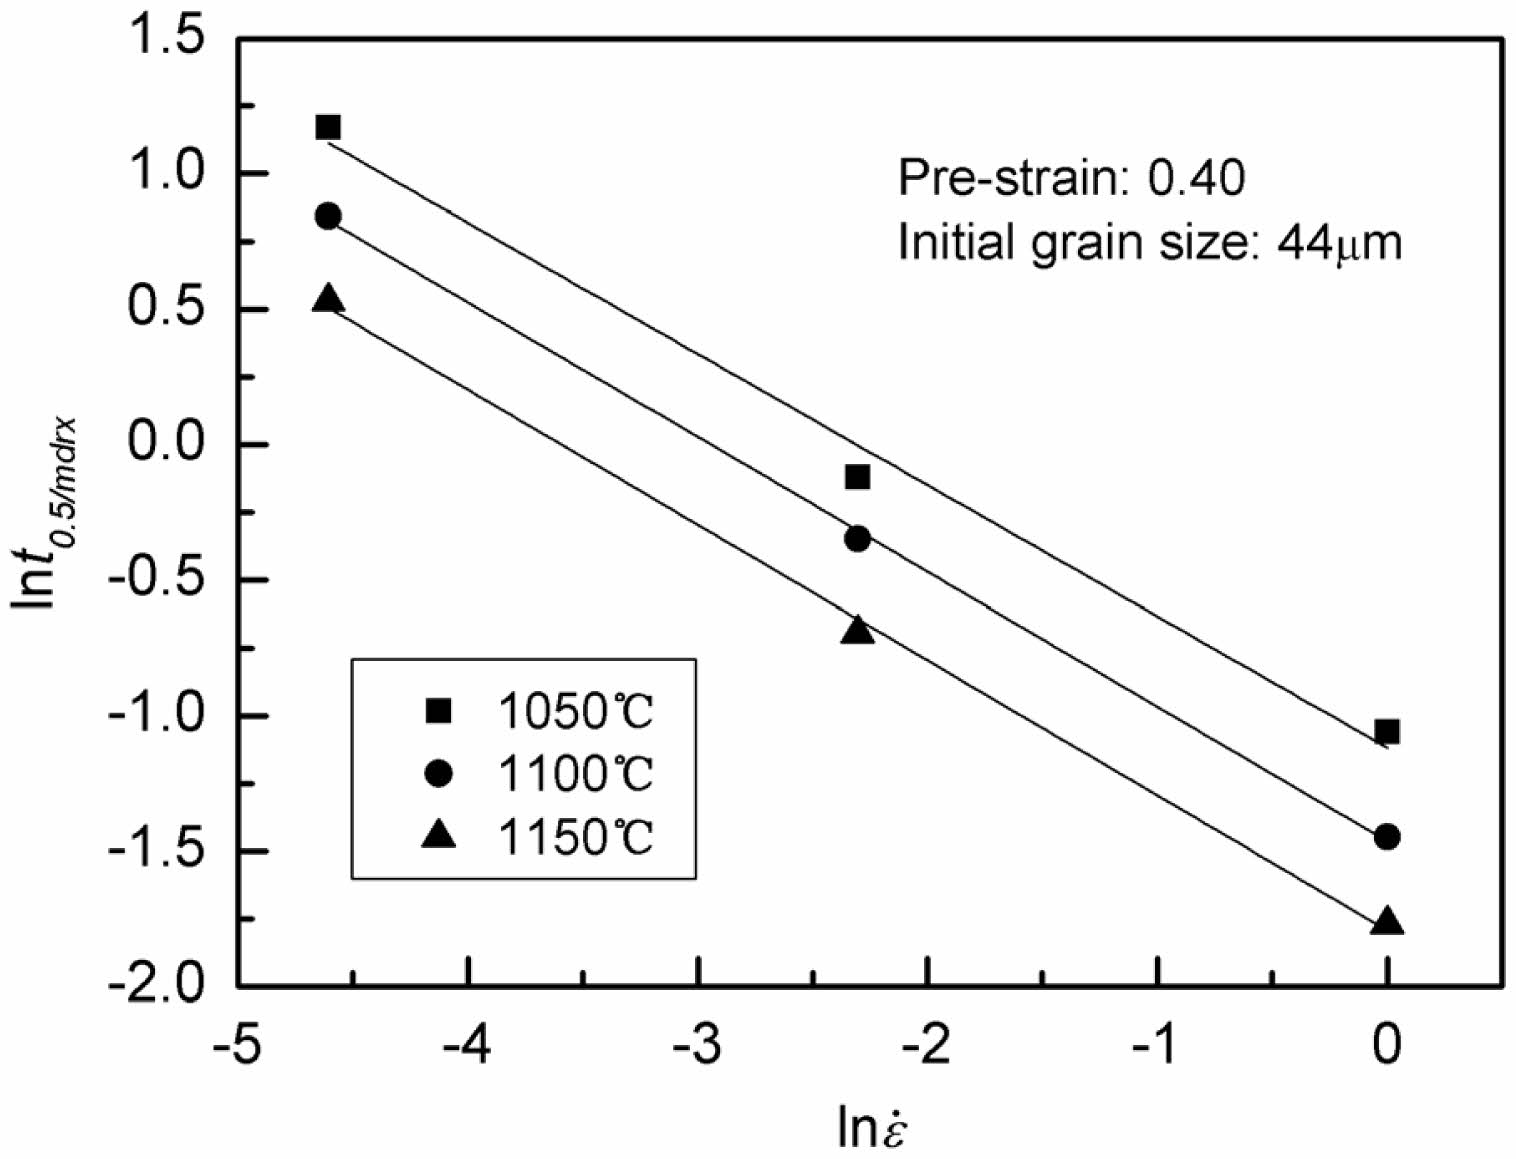
The correlations between lnt0.5/mdrx and can be calculated using the experimental data for the classical MDRX, as illustrated in Fig. 9. The value of the material dependent constant p is easily determined to be -0.493, and the value of A is derived from Eq. (7) to be 1.1210-4.
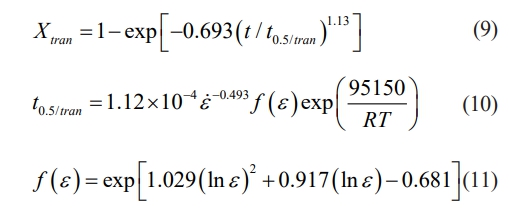
Subsequently, the subsequent equations can be used to express the kinetics of the transition in steel:
Model verifications
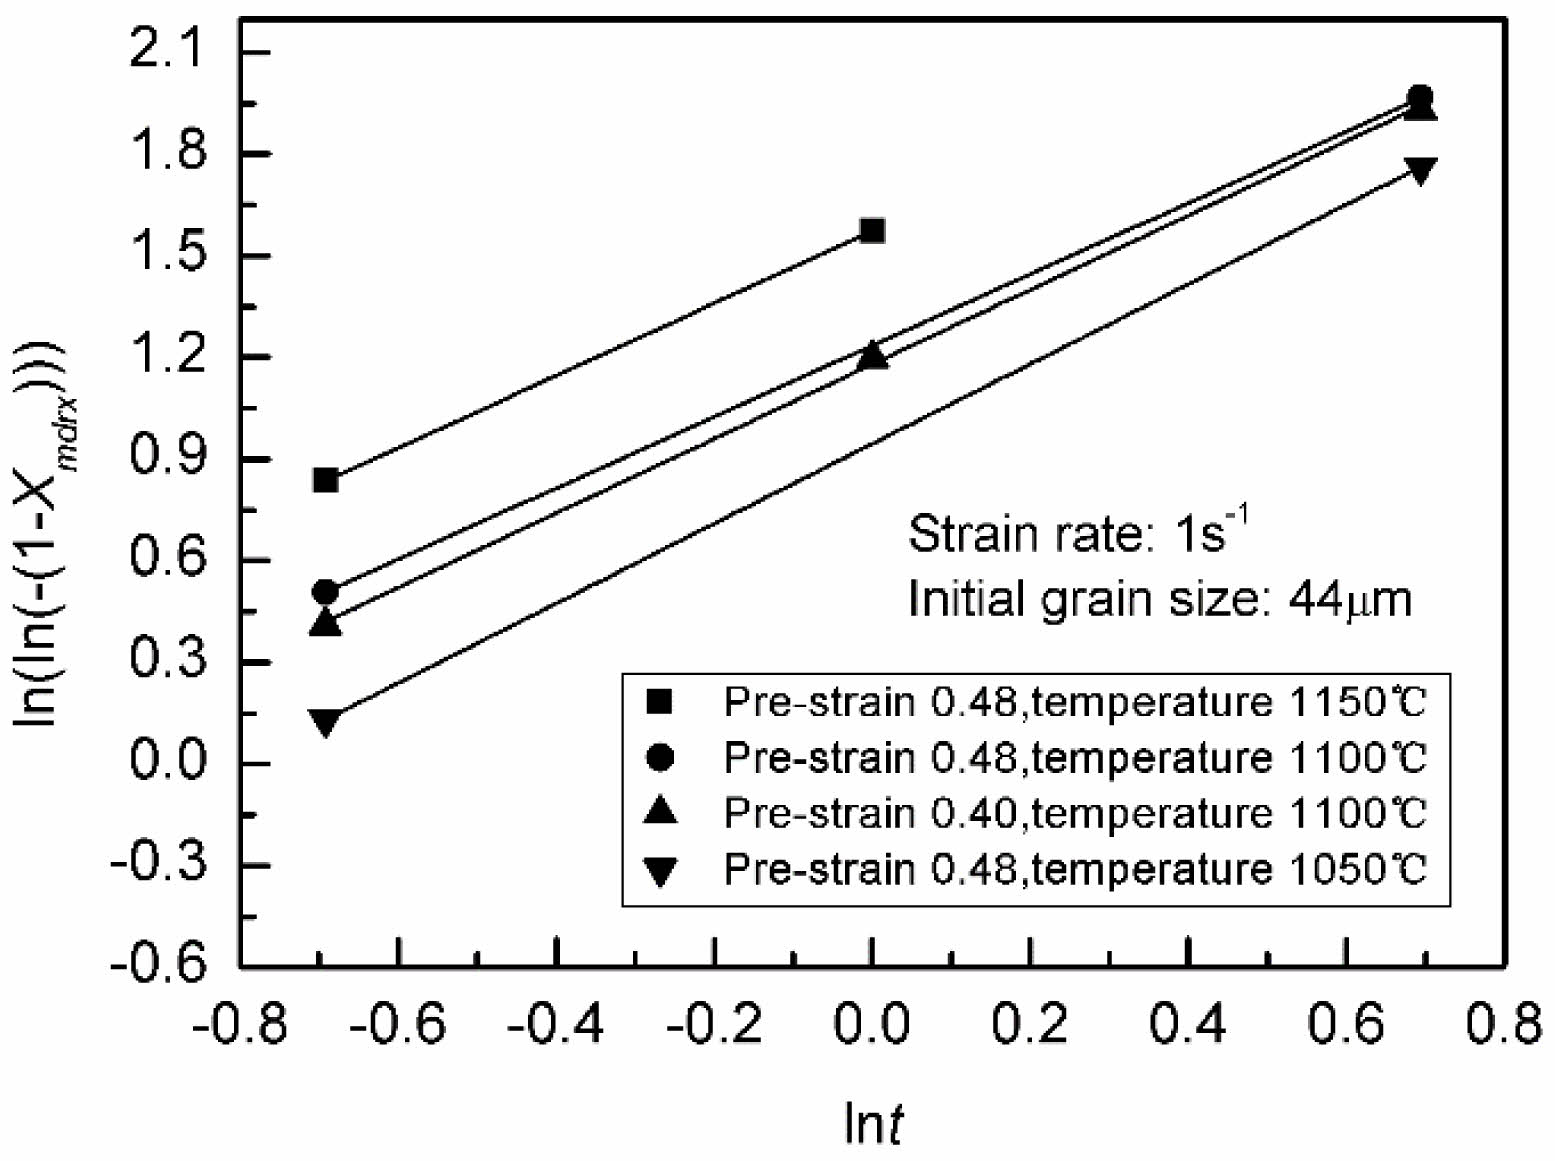
As illustrated in Fig. 10, comparisons between the predicted and experimental values were performed to confirm the availability of the proposed constitutive model. The experimental values which used to verify the availability of the proposed constitutive model are not used for the establishing model. It is evident that the experimental values of Xtran and t0.5/tran are rather close to the predictions made by the proposed constitutive model, indicating that the model may be able to provide a reliable estimate of the kinetics of the transition in steel.
|
Fig. 4 Pre-strain effects on the softening fraction. |
|
Fig. 5 Relationships between ln(ln(-(1-Xtran))) and lnt. |
|
Fig. 6 Relationships between ln(ln(-(1-Xmdrx))) and lnt. |
|
Fig. 7 Relationships between lnt0.5/tran (lnt0.5/mdrx) and 1/T |
|
Fig. 8 Relationship between lnt0.5/tran and lnε |
|
Fig. 9 Relationships between lnt0.5/mdrx and ln ὲ. |
|
Fig. 10 Correlations between the predicted and experimental values for (a) t0.5/tran and (b) Xtran. |
|
Table 2 Values of εc and εT in various temperatures at the strain rate of 1 s -1. |

Isothermal interrupted hot compression tests were used to examine the post-recrystallization behaviors of the micro-alloyed forging steel. The study focused on the dynamics of the change from SRX to MDRX. From the findings of this study, the following deductions have been made.
(1) The post-recrystallization softening exhibits two different behaviors in relation to the applied pre-strain, and it changes strain-dependent to strain-independent as the deformation temperature increases, which suggests that the transition and MDRX are included in the post-recrystallization for the steel in conditions of deformation.
(2) By regression analysis of the experimental data, a model was constituted to predict the kinetics of the transition by the modified Avrami equation, while accounting for strain-dependence compensation. The apparent activation energy for the transition was determined to be 95.15 kJ/mol.
(3) The predicted values made by the proposed constitutive model are rather close to the experimental ones, which shows that the proposed constitutive model may be able to predict the kinetics of the transition in the micro-alloyed forging steel with reasonable accuracy.
We would like to express our gratitude to the financial support by the Gansu Province Major Science and Technology Projects (Nos. 22ZD6GA011).
No potential conflict of interest was reported by the authors.
- 1. Z. Zhang, C. Song, W. Wu, H. Wang, and Z. Sun, J. Mater. Res. Technol. 27 (2023) 8084-8099.
-

- 2. S. Shanmugam, S. Mahalingam, and A. Ranjithkumar, J. Ceram. Process. Res. 24[3] (2023) 495-502.
-

- 3. K.P. Rao, Y.K.D.V. Prasad, and E.B. Hawbolt,J. Mater. Process. Tech. 77[1-3] (1998) 166-174.
-

- 4. C. Liu, S. Liang, S. Guo, R. Li, S. Barella, Y. Peng, A. Gruttadauria, M. Belfi, W. Li, C. Yuan, and C. Mapelli, J. Mater. Res. Technol. 26 (2023) 3332-3352.
-

- 5. Z. Li, X. Zhang, G. Ma, D. Zheng, R. He, and T. Du, J. Ceram. Process. Res. 24[1] (2023) 51-57.
-

- 6. H. Mirzadeh,J. Mater. Res. Technol. 25 (2023) 7050-7077.
-

- 7. S. Serajzadeh, Mater. Sci. Eng. A 448[1-2] (2007) 146-153.
-

- 8. Z. Tong, C. Xu, J. Wang, and Z. Jia, J. Ceram. Process. Res. 24[1] (2023) 17-28.
-

- 9. C.X. Yue, L.W. Zhang, J.H. Ruan, and H.J. Gao. Appl. Math. Model. 34[9] (2021) 2644-2653.
-

- 10. S.H. Cho and Y.C. Yoo, J. Mater. Sci. 36[17] (2001) 4273-4278.
-

- 11. Y.C. Lin and M.S. Chen, J. Mater. Sci. 44[3] (2009) 835-842.
-

- 12. A.M. Elwazri, P. Wanjara, and S. Yue, ISIJ Int. 43[7] (2003) 1080-1088.
-

- 13. P. Uranga, A.I. Fernández, B. López, and J.M. Rodriguez-Ibabe, Mater. Sci. Eng. A 345[1-2] (2003) 319-327.
-

- 14. D. Liu, J. Chen, H. Chai, Y. Jiang, Z. Li, W. Qiu, and Z. Guo, J. Mater. Res. Technol. 15 (2021) 1179-1189.
-

- 15. P.D. Hodgson, J. Mater. Process. Tech. 60[1-4] (1996) 27-33.
-

- 16. A.R. Morgridge, B. Mater. Sci. 25[4] (2002) 291-299.
-

- 17. K.H. Jung, H.W. Lee, and Y.T. Im, Mater. Sci. Eng. A 519[1-2] (2009) 94-104.
-

- 18. J. Liu, Y.G. Liu, H. Lin, and M.Q. Li, Mater. Sci. Eng. A 565 (2013) 126-131.
-

- 19. S. Solhjoo and R. Ebrahimi, J. Mater. Sci. 45[21] (2010) 5960-5966.
-

- 20. D.Q. Bai, S. Yue, J.J. Jonas, and T.M. Maccagno, Metall. Mater. Trans. A 29[5] (1998) 1383-1394.
-

- 21. Y. Luo, J.M. Peng, H.B. Wang, and X.C. Wu, Mater. Sci. Eng. A 527[15] (2010) 3433-3437.
-

- 22. Y.C. Lin, L.T. Li, and Y.C. Xia, Comp. Mater. Sci. 50[7] (2011) 2038-2043.
-

- 23. F. Chen, Z.S. Cui, D.S. Sui, and B. Fu, Mater. Sci. Eng. A 540 (2012) 46-54.
-

- 24. C.X. Yue, L.W. Zhang, S.L. Liao, and H.J. Gao, Comp. Mater. Sci. 45[2] (2009) 462-466.
-

- 25. A. Yanagida and J. Yanagimoto, Mater. Sci. Eng. A 487[1-2] (2008) 510-517.
-

- 26. A. Dehghan-Manshadi, M.R. Barnett, and P.D. Hodgson, Metall. Mater. Trans. A 39 (2008) 1359-1370.
-

- 27. S.H. Cho and Y.C. Yoo, J. Mater. Sci. 36[17] (2001) 4279-4284.
-

- 28. S. Choi and Y. Lee, Met. Mater. Int. 8[1] (2002) 15-23.
-

 This Article
-
2024; 25(5): 760-767
Published on Oct 31, 2024
- 10.36410/jcpr.2024.25.5.760
- Received on Apr 25, 2024
- Revised on May 29, 2024
- Accepted on Jun 11, 2024
 Services
- Abstract
introduction
material and experimental method
results
discussion
conclusions
- Acknowledgements
- Conflict of Interest
- References
- Full Text PDF
Shared
 Correspondence to
- Wen-Bo Yang
-
Science and Technology on Vacuum Technology and Physics Laboratory, Lanzhou Institute of Physics, Lanzhou 730000, China
Tel : 008609314585184 Fax: 008609318265391 - E-mail: lz228402551@qq.com


 Copyright 2019 International Orgranization for Ceramic Processing. All rights reserved.