- Finite element parametric analysis of bond-slip performance between epoxy-coated rebar and high-strength concrete
Tian Pengganga,b,*, Wang Kaia,b, Niu Jianhuia,b, Xie Zhixuna,b, Liu Kangninga,b and Wang Zhenshanc
aSCEGC City of Future Scientific and Technological Innovation Co., Ltd. Xi'an, China
bSCEGC-XJTU Joint Research Center for Future City Construction and Management Innovation, Xi'an Jiaotong University, Xi'an, China
cSchool of Civil Engineering and Architecture, Xi'an University of Technology, Xi'an, ChinaThis article is an open access article distributed under the terms of the Creative Commons Attribution Non-Commercial License (http://creativecommons.org/licenses/by-nc/4.0) which permits unrestricted non-commercial use, distribution, and reproduction in any medium, provided the original work is properly cited.
Epoxy-coated rebar is a crucial material in marine construction. To study the bond performance of epoxy-coated rebar with high-strength concrete in different structural forms, pull-out tests were conducted on 18 specimens. The failure patterns and bond-slip behavior of different epoxy-coated rebar-high strength concrete specimens were analyzed. Based on these tests, finite element analysis software Abaqus was used to conduct a parametric analysis by varying the rebar diameter and bond length, investigating the ultimate bond strength of components under different parameters. The results indicate that due to the relatively low compressive strength of the concrete, specimens exhibited rebar pull-out failure, concrete splitting failure, and rebar fracture failure during the pull-out tests. As the rebar diameter increased, the anchoring capacity of the epoxy-coated rebar improved. Specifically, for every 1 mm increase in diameter, the ultimate bond load increased by 16.9% to 23.9%. Additionally, increasing the bond length of the rebar enhanced the ultimate bond strength of the specimens, with the ultimate bond load increasing by 13.2% to 24.2% for every 1d increase in length. The conclusions drawn from this research provide technical support for the engineering application of epoxy-coated rebar in high-strength concrete.
Keywords: Epoxy-coated rebar, Pull-out test, Finite element analysis, Parametric analysis, Ultimate bond strength.
Marine construction not only supplements onshore resources but also represents a product of contemporary development [1, 2]. However, extreme weather conditions and saltwater corrosion in marine environments can weaken the strength of rebar, severely threatening the durability of structures [3]. Epoxy-coated rebar, known for its strong corrosion resistance, is widely used in marine construction [4]. However, the bond performance between the epoxy coating and concrete is relatively low, and slip failures between the two can affect the overall performance of the structure. Therefore, determining the appropriate specifications for epoxy-coated rebar has become a crucial aspect of marine construction development.
To enhance the strength of concrete, researchers have incorporated ceramic waste as coarse aggregate, finding that the tensile strength of the concrete improved by 13% [5]. Chaitanya has developed high-permeability and durable pervious concrete with notable erosion resistance [6]. Additionally, epoxy-based composite materials, known for their high bonding and tensile strength, are commonly used in marine construction [7, 8]. The epoxy-coated rebar used in this study has anti-corrosion properties. Numerous scholars have conducted electrochemical tests on epoxy-coated rebar in various environments, revealing that its corrosion current density is significantly lower than that of ordinary rebar [9-11]. Zhou [12] used lysine-modified graphene oxide to enhance epoxy coatings and found that the corrosion rate of coated rebar was approximately two orders of magnitude lower than that of ordinary rebar. Cui [13] proposed a novel composite coating combining graphene and epoxy resin, revealing that Popd nanoparticles within the composite coating can improve the barrier properties of the epoxy resin, passivating the rebar surface and thereby enhancing its corrosion resistance.
The bond performance between epoxy-coated rebar and high-strength concrete significantly affects the load-bearing capacity of marine structures. Many researchers have employed central pull-out tests, central push-out tests, and beam tests to determine the bond performance between the two [14, 15]. Xue [16] conducted pull-out tests on epoxy-coated rebar with different coating thicknesses and concrete beams. He introduced a magnification factor to calculate the normal section design of the beam, addressing the issue of wider cracks between coated rebar and concrete. Nie [17, 18] conducted comparative bending performance tests on beams with epoxy-coated rebar and found that the anchoring strength of epoxy-coated rebar was on average 13.8% lower than that of uncoated rebar, with the crack width increasing by an average of 10.8%. Choi [19] studied the effects of rebar diameter, rib shape, and coating thickness on the bond strength of epoxy-coated rebar through pull-out tests. It revealed that increasing the coating thickness and rebar diameter weakened the bond performance of the epoxy-coated rebar, but increasing the relative surface area of the rebar ribs enhanced the bond performance. Huang [20] conducted pull-out tests to study the bond behavior between epoxy-coated rebar and seawater sand recycled concrete by varying the bond length, rebar diameter, concrete strength, and concrete cover thickness. He analyzed the failure patterns, bond strength, and bond-slip curves of each specimen and derived expressions for the bond-slip curves.
Combining experimental and numerical analysis techniques has become an effective method for studying the bond-slip behavior between rebar and high-strength concrete [21, 22]. Zhang [23] used numerical software to set up friction, interference, and bond forces to simulate the bond-slip behavior at the interface between FRP (Fiber Reinforced Polymer) rebar and concrete. Ouyang [24, 25] defined a concrete-filled steel tube model using contact elements and calculated the load-displacement curves under eccentric and axial loads, with the results closely matching experimental data. Xue [26] used a spring element model between nodes to define the force-deformation relationship curves of each spring, simulating the bond-slip behavior at the interface of circular steel tube concrete under constant high temperatures. Yin [27] defined interface elements using a simplified bilinear bond-slip constitutive relationship to study the effects of FRP rebar diameter, bond length, and coral aggregate seawater concrete strength on bond performance.
To study the collaborative performance of epoxy-coated rebar and concrete, this paper considers the effects of rebar bending form, bond length, and diameter, designing 18 specimens. Pull-out tests were conducted on epoxy-coated rebar-high strength concrete, and the failure patterns and bond-slip behavior of each specimen were analyzed in conjunction with numerical techniques. Based on these tests, a parametric analysis was performed to provide recommendations for optimal performance concerning different rebar diameters and bond lengths. These findings offer technical support for the engineering application of epoxy-coated rebar in high-strength concrete.
Specimen Design and Loading Scheme
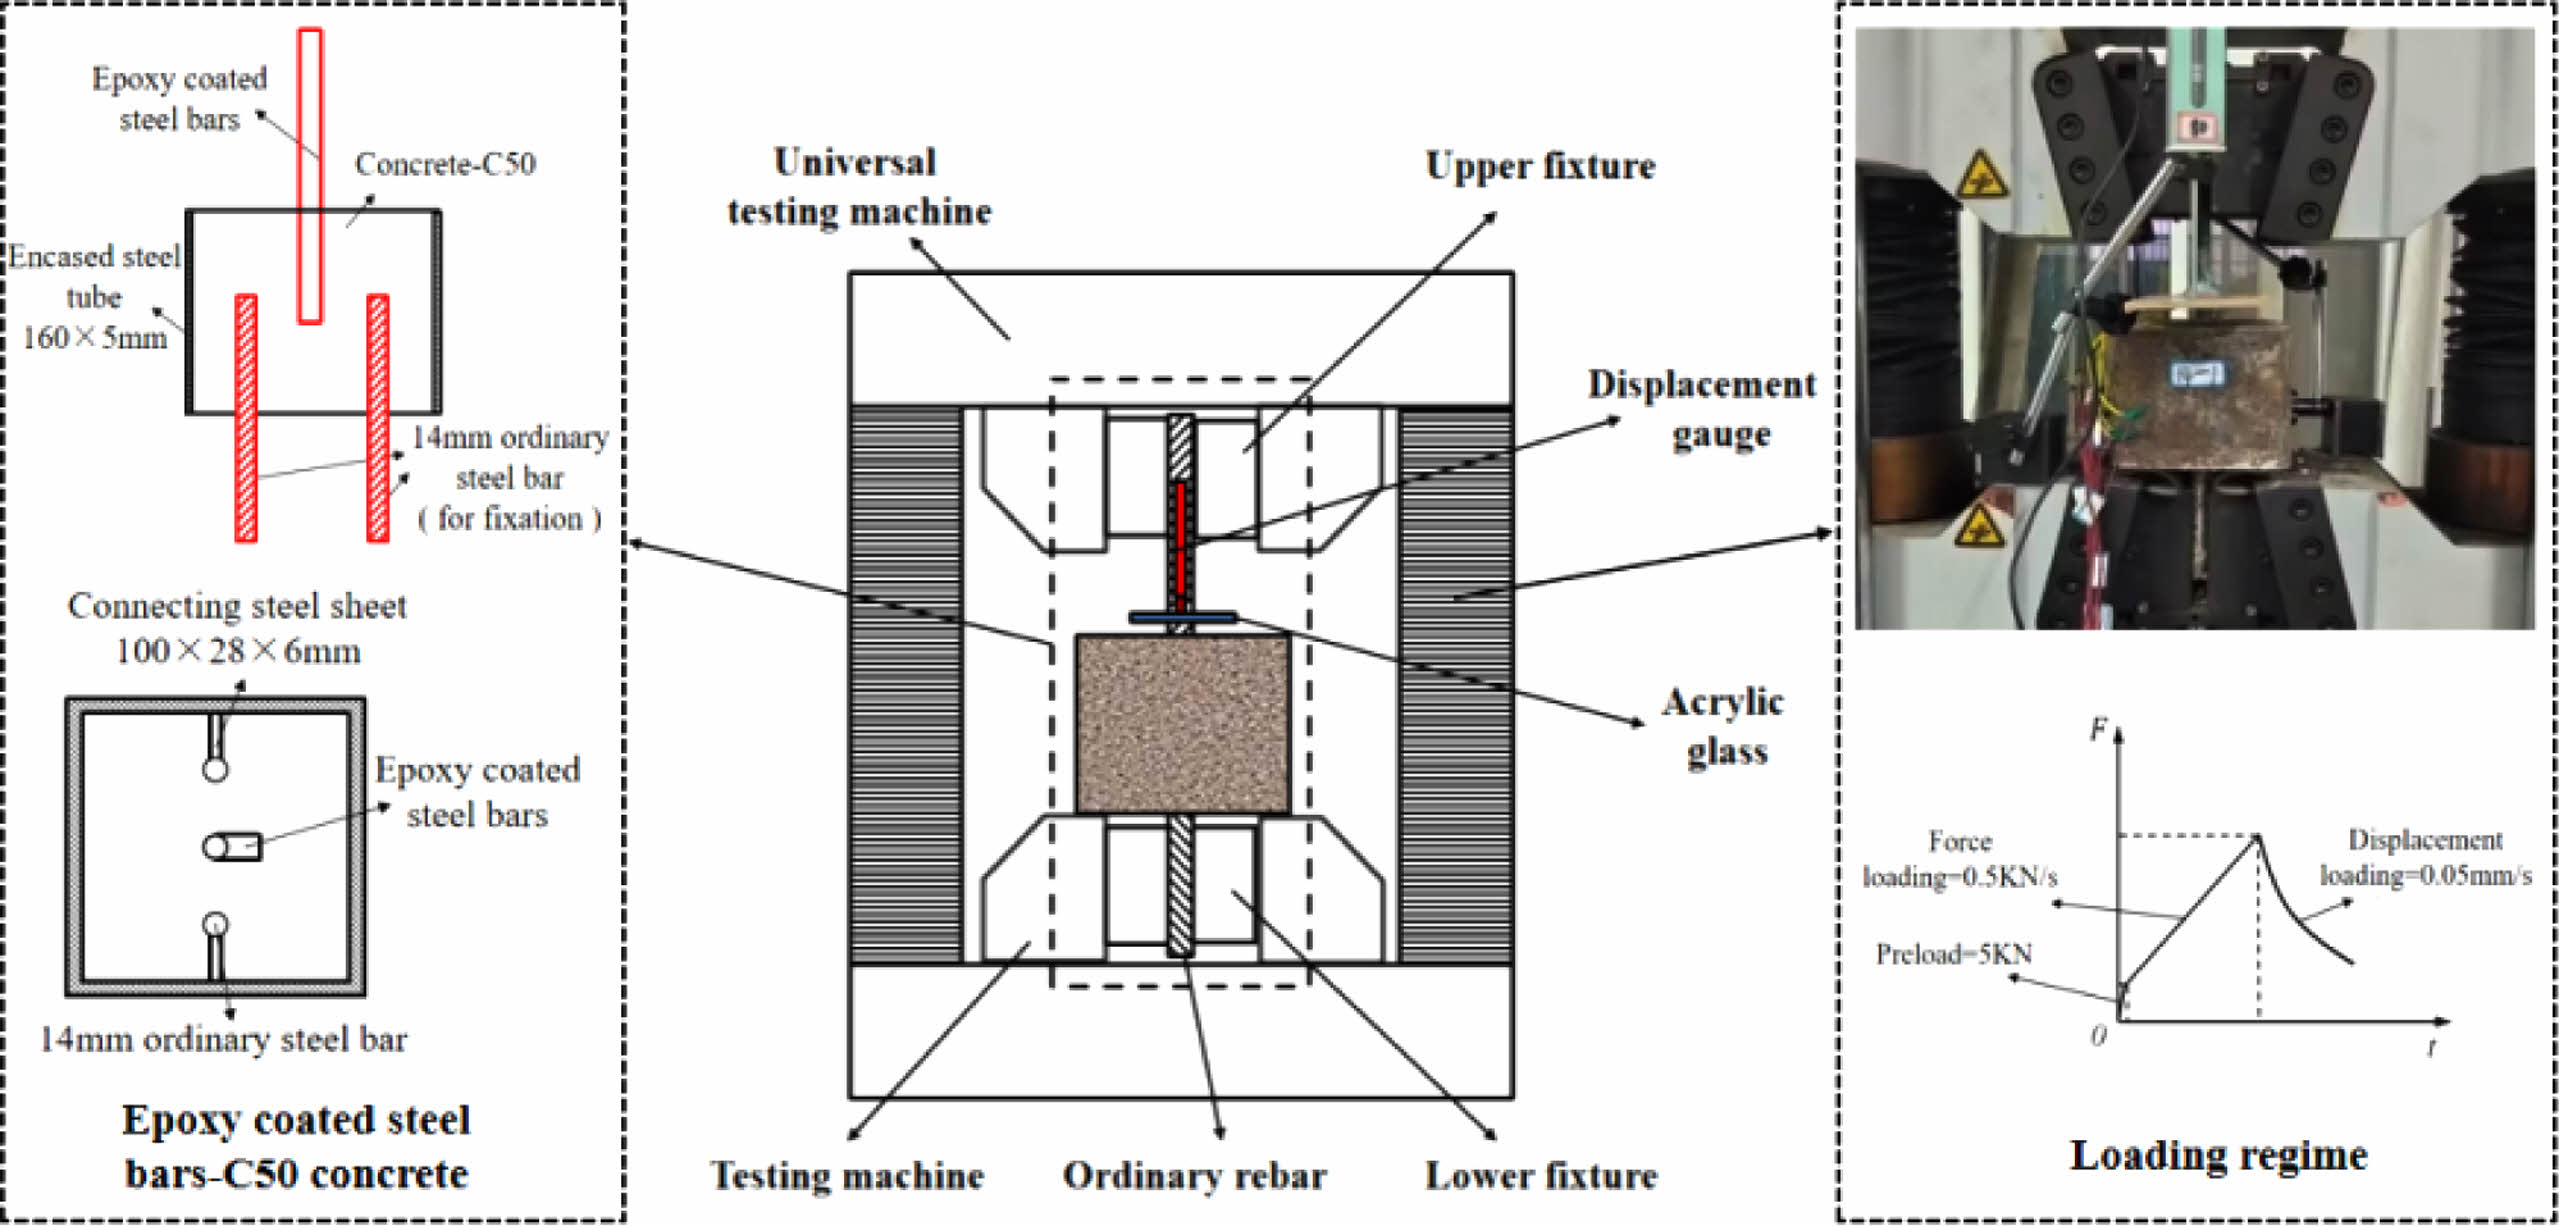
The specimens are prepared from high-strength commercial concrete (C50) and epoxy-coated reinforcement bars (HRB400). The mechanical properties of different materials are obtained through material tests [28-30], as shown in Table 1 and Table 2. To mitigate the tensile failure of concrete, steel sleeves with a thickness of 5 mm are installed around its perimeter. Considering the influence of rebar diameter (d), bond length (la), and bending form on the performance of the structure, 18 specimens are designed, with specific dimensions detailed in Table 3.
Considering the influence of loading rate on the bond strength of specimens [31, 32], the experiments are conducted with a combination of load and displacement control, and two displacement gauges are set up to monitor deformation. Before slip occurs, force control is utilized at a rate of 0.5 kN/s; after slip, displacement control is employed at a rate of 0.05 mm/s. The test concludes when the rebars fracture or are pulled out. The loading device is illustrated in Fig. 1.
Failure Phenomena
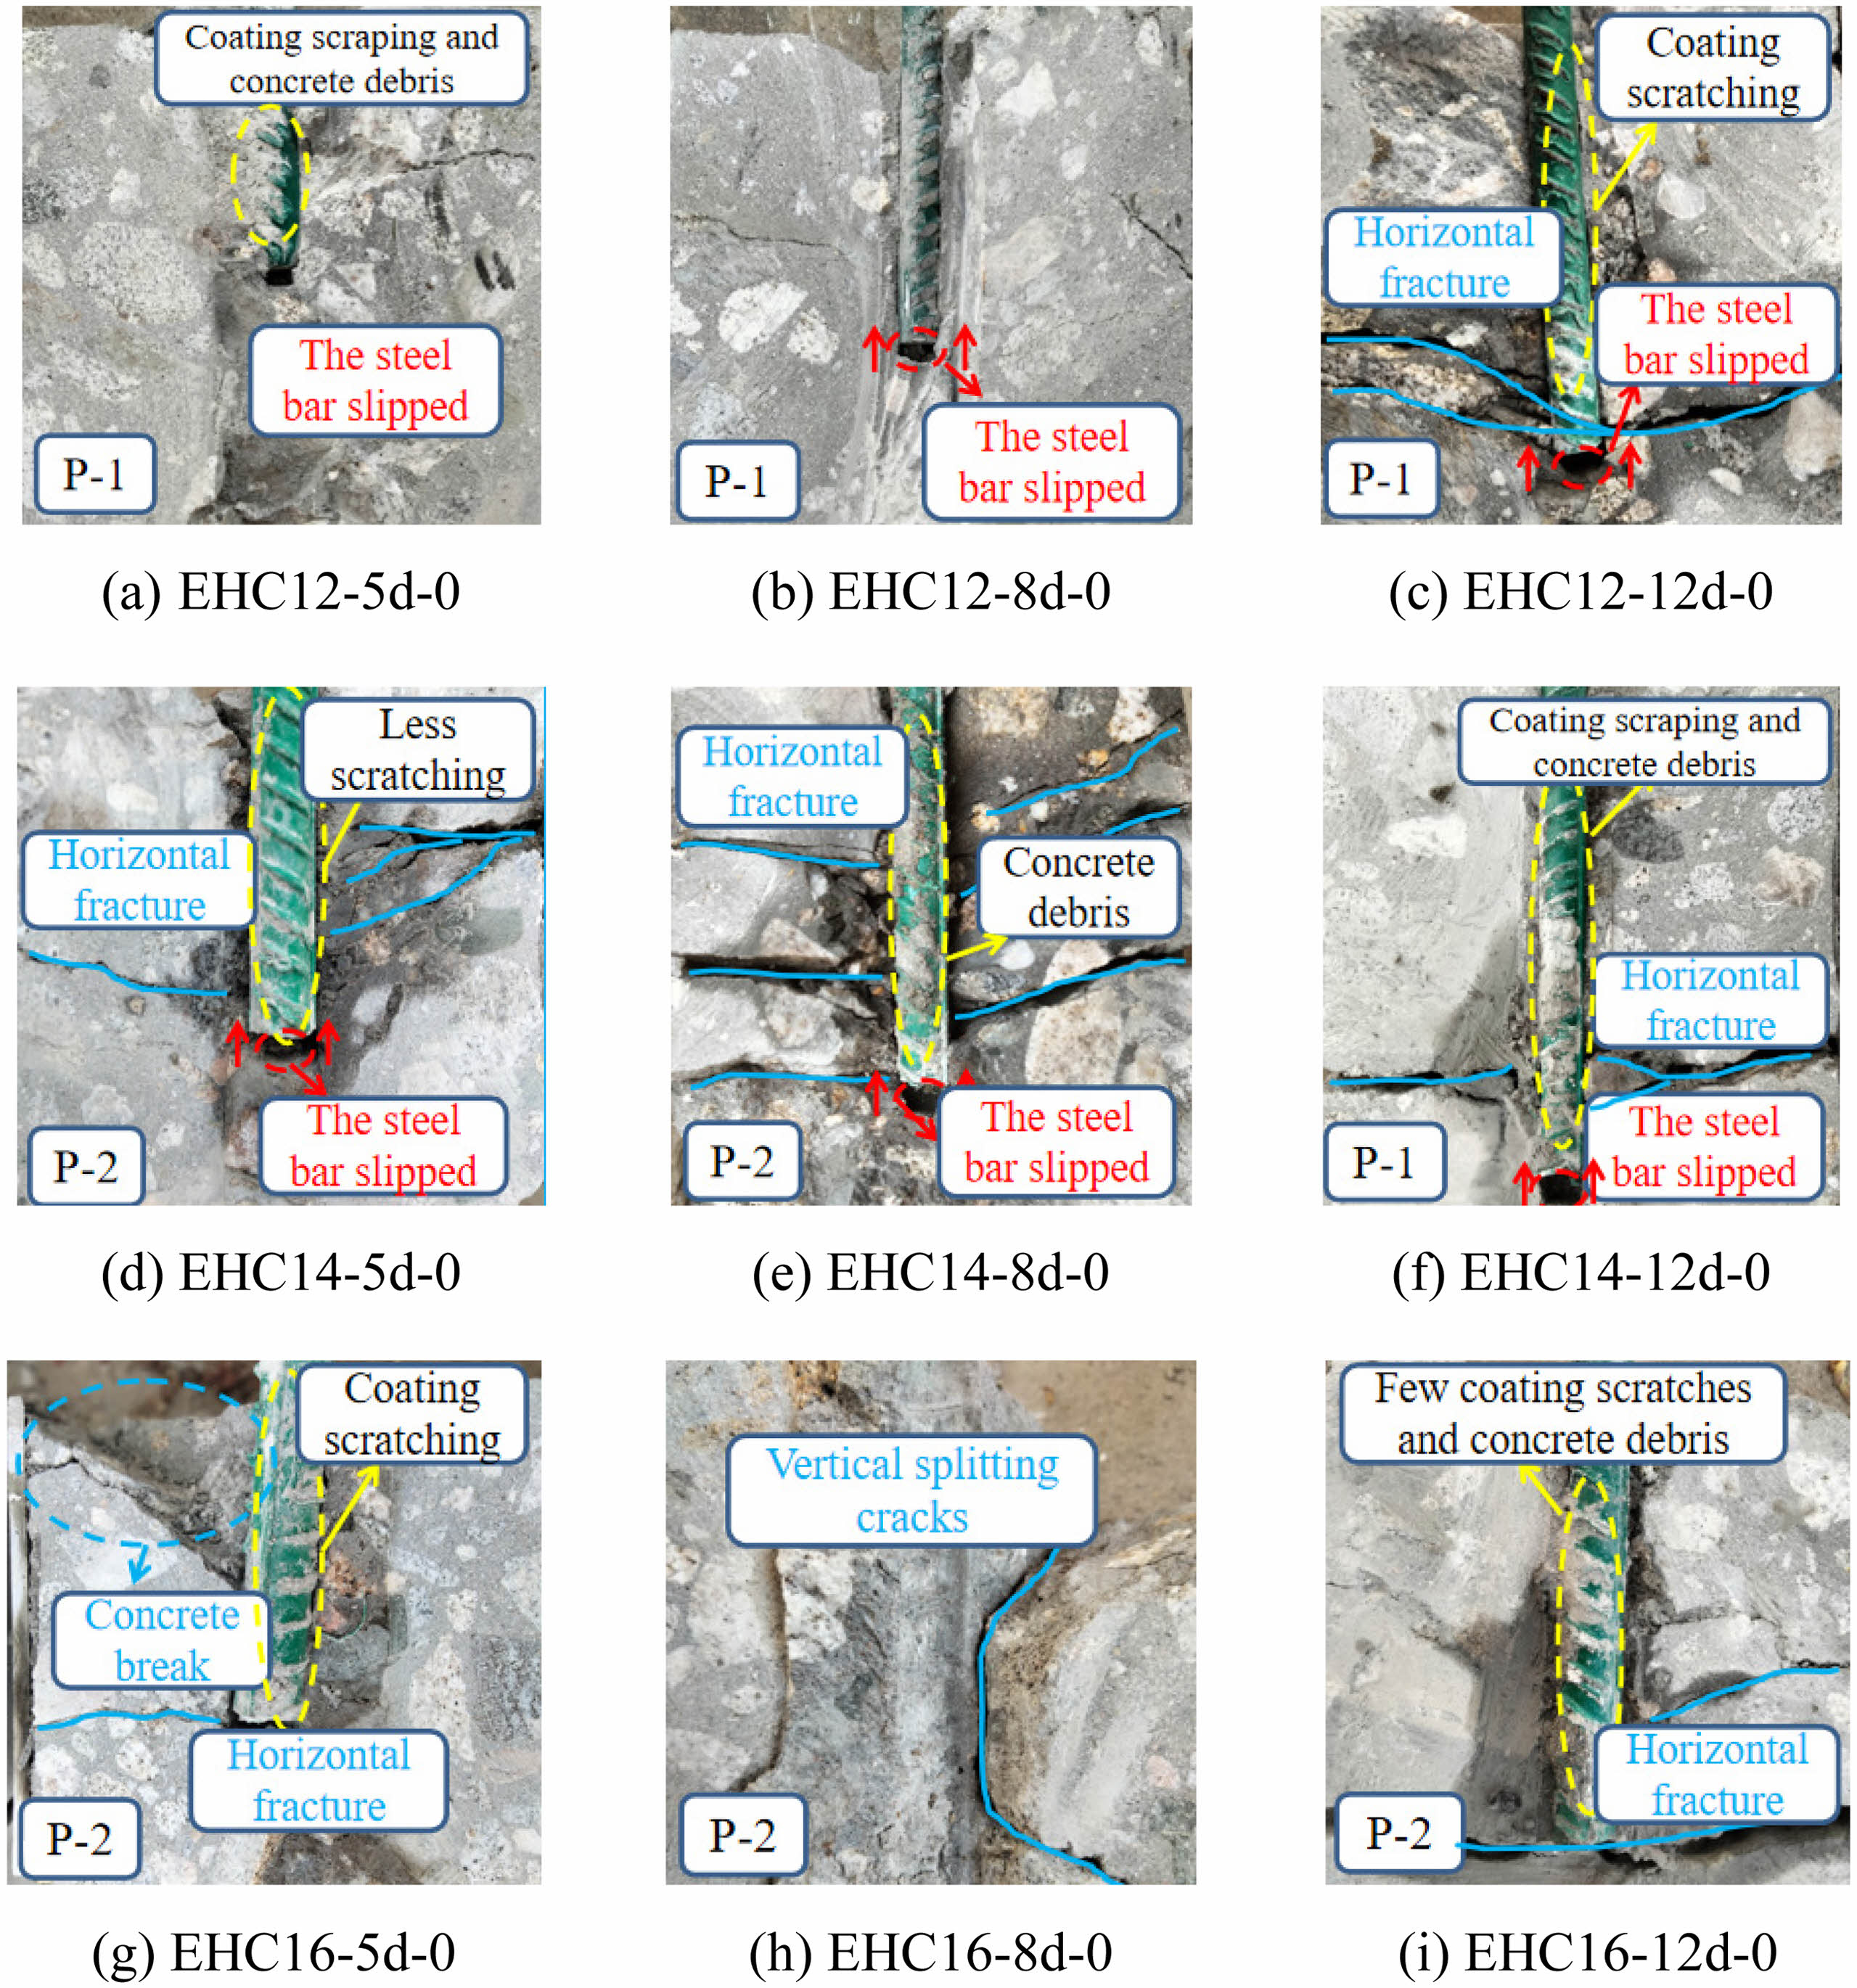
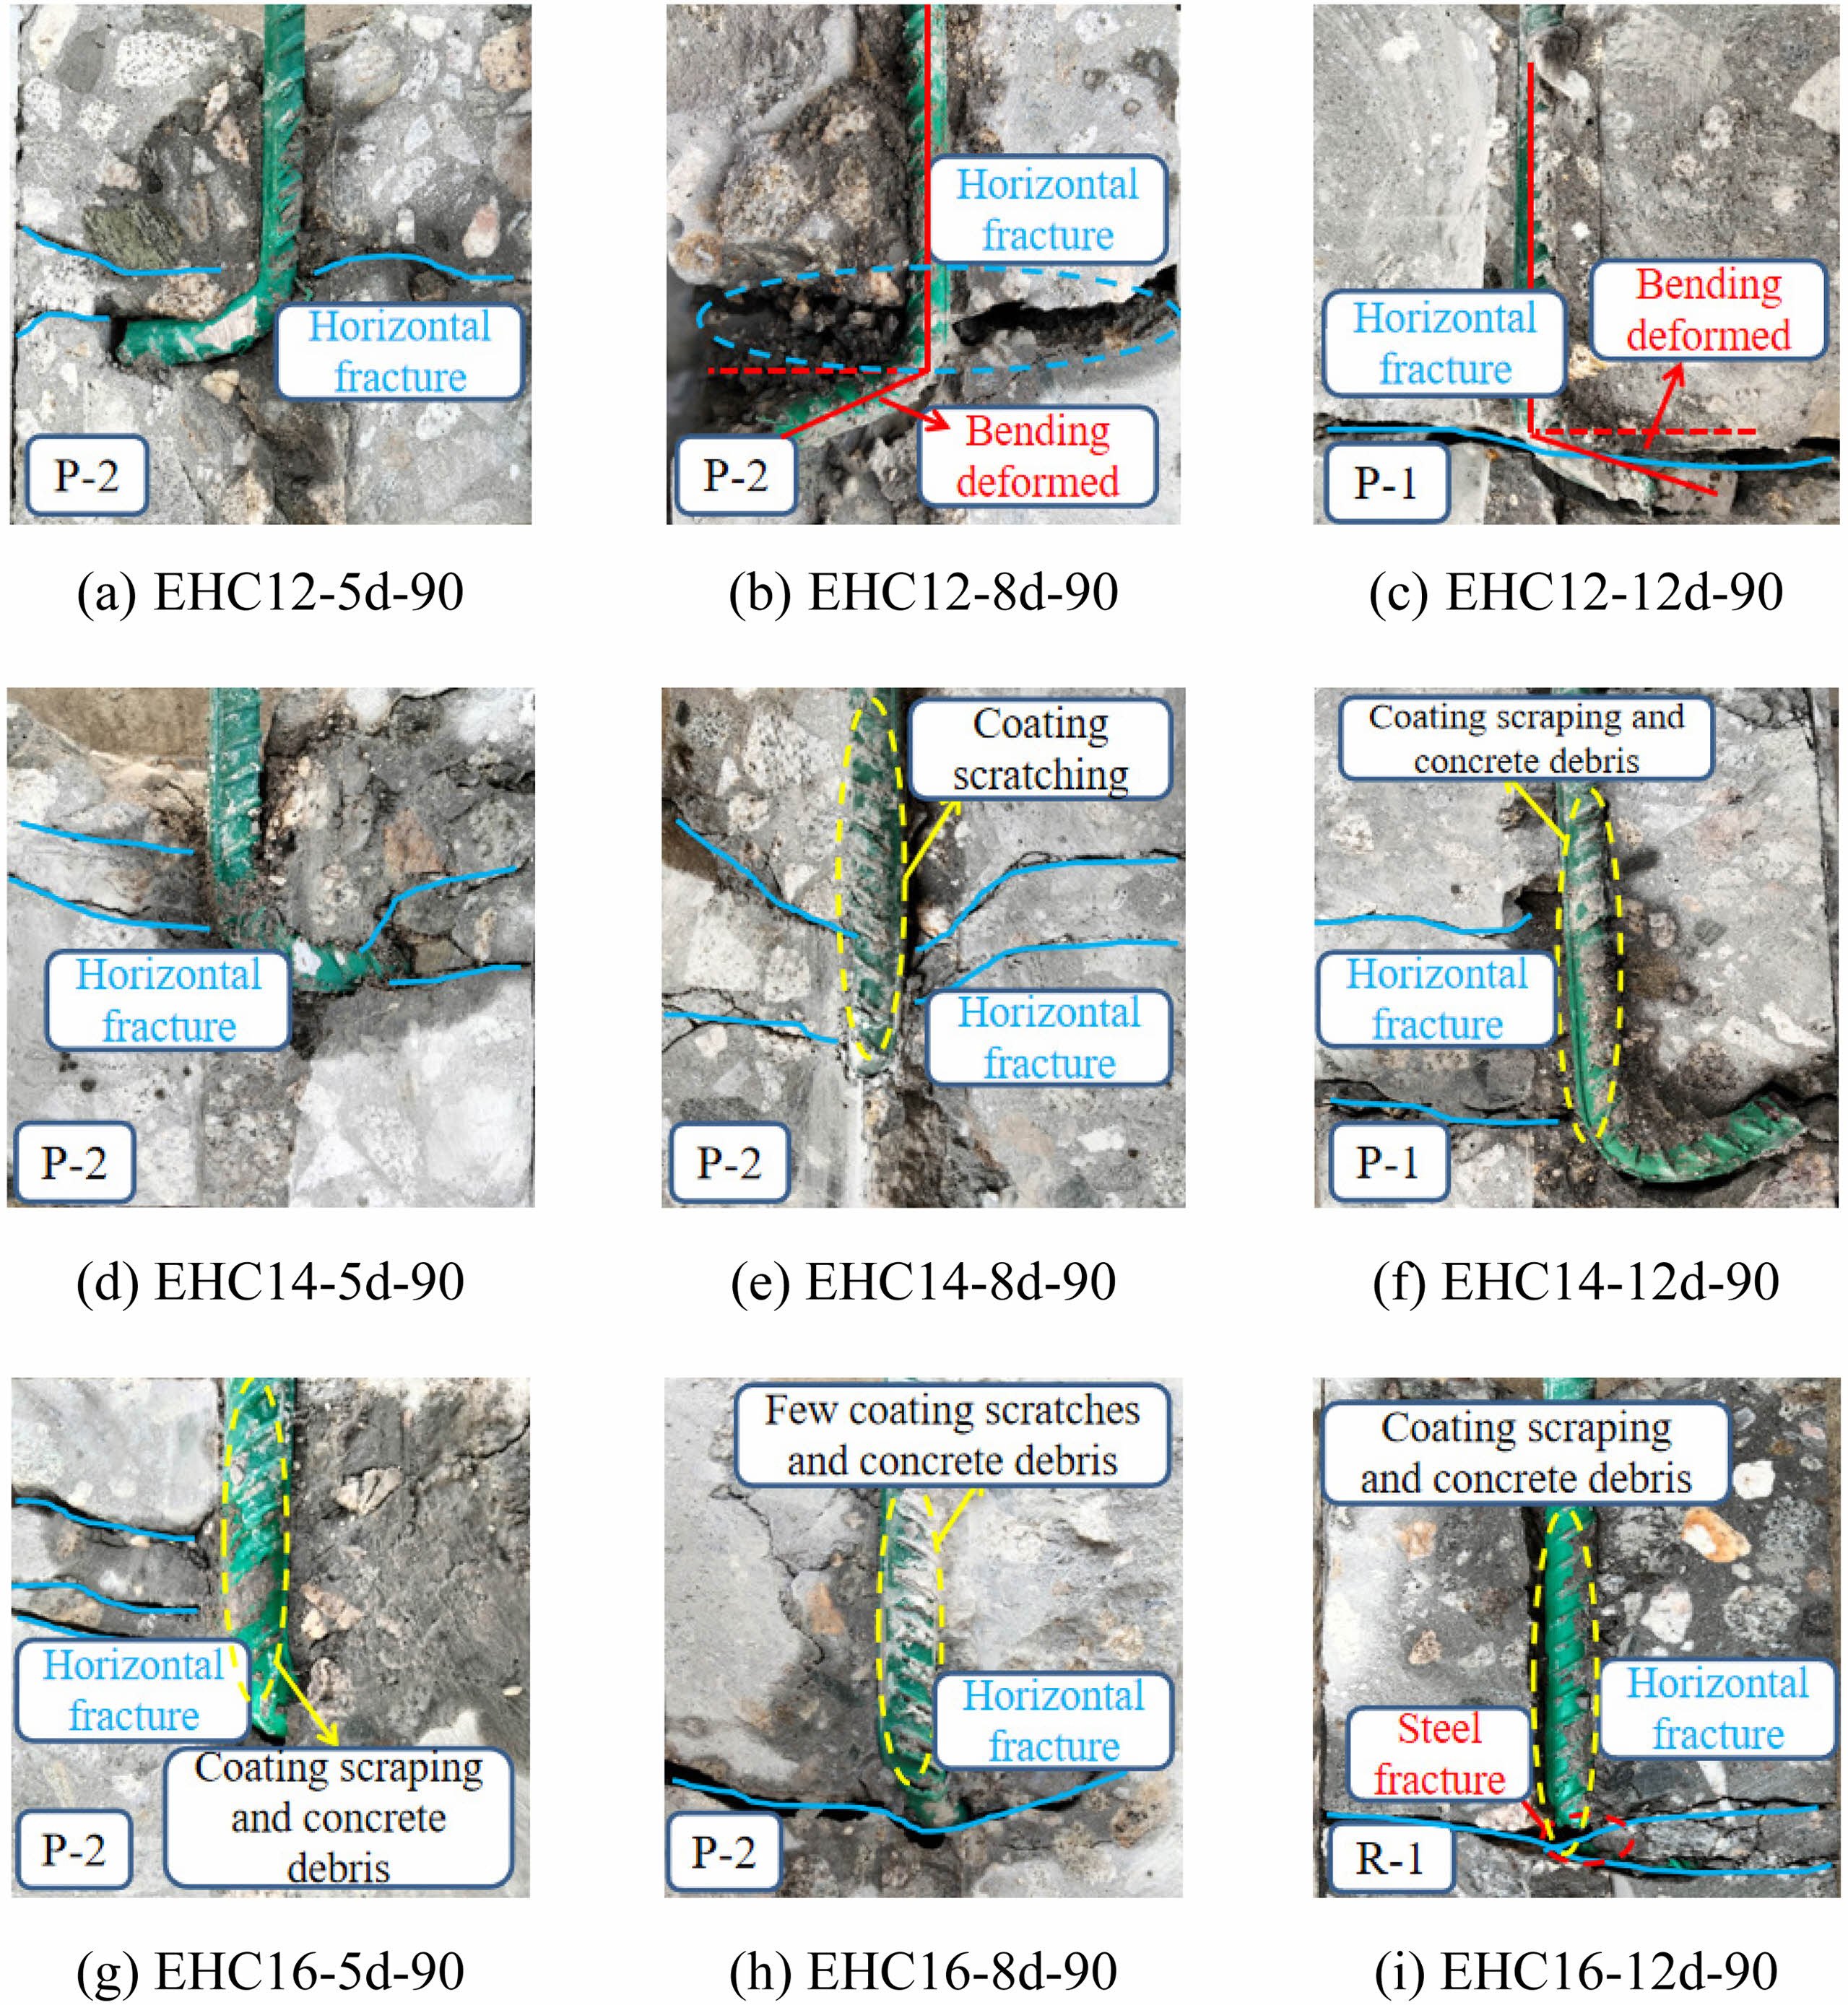
The failure pattern of rebar specimens without bending angles is illustrated in Fig. 2. When the rebar diameter is 12 mm, as the load increases, the concrete cracks first due to its low shear strength. A small amount of concrete debris is carried out along with the pulled-out rebar, leading to rebar pullout failure (P-1). With the increase in the tensile strength of the rebar specimens (d=14 mm, 16 mm), the concrete reaches its tensile stress limit state first. Cracks appear around the rebars, quickly penetrating the concrete surface, resulting in specimen splitting failure (P-2). The failure pattern of rebars with a bending hook angle of 90° is essentially the same as that of specimens without a bending hook angle, as shown in Fig. 3. Specimens with bond lengths of 5d and 8d all exhibit concrete splitting failure, while specimens with a bond length of 12d primarily fail due to rebar pullout. Influenced by the deformation of the rebar bending region, in the specimen (EHC16-12d-90), the rebar reaches its ultimate load-carrying capacity first. The rebar fractures at the bending region, accompanied by concrete cracking, resulting in rebar rupture failure (R-1).
From the observed failure phenomena, it is evident that as the diameter of the rebars increases, the extent of concrete damage in the specimens also increases, mostly resulting in a splitting failure pattern. When the d=12 mm, the bond-slip between the rebar and concrete is minimal, with only slight cracks appearing in the concrete. When the diameter of the rebar reaches 14 mm, the compressive capacity of the concrete increases, forming several distinct penetrating cracks. With the rebar diameter increasing to 16 mm, the crack width continues to deepen, reaching the ultimate compressive state of the concrete, which splits into 2-3 pieces. It can be inferred that as the diameter of the rebars increases, the relative thickness of the protective layer of the specimen decreases, leading to a lower cracking load during the pulling process and making it more susceptible to cracking.
Bond-Slip Curves
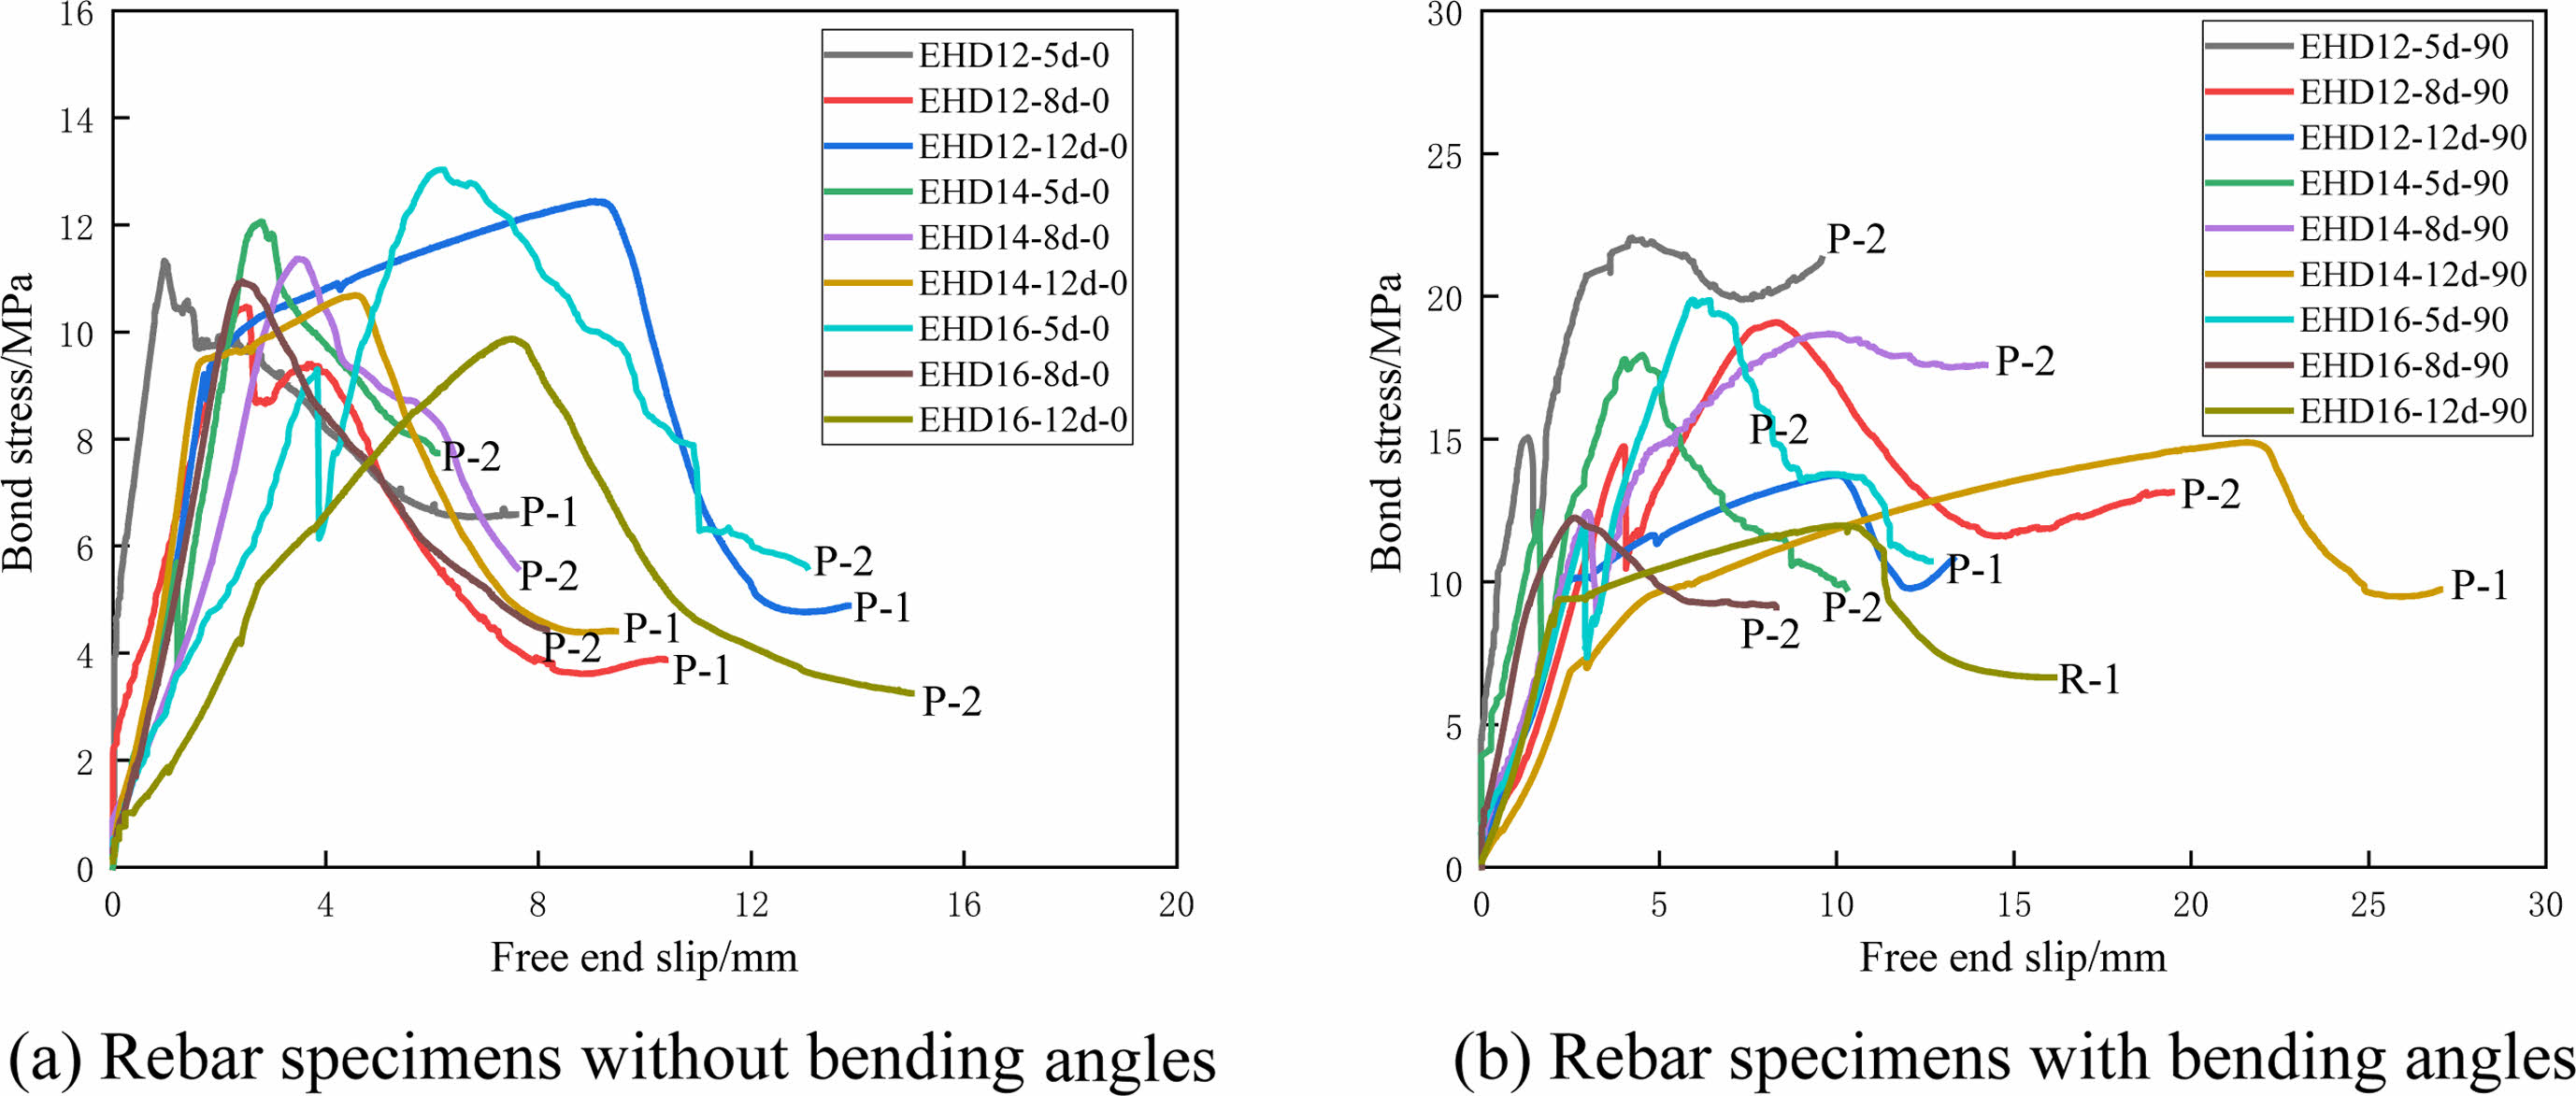
According to the standard "JG/T 502-2016" [33], the bond-slip curves of each specimen are extracted to analyze the entire process of bonding between epoxy-coated reinforcement bars and high-strength concrete, as shown in Fig. 4. The bond-slip process of each specimen is divided into four stages: micro-slip stage, slip stage, smooth stage, and descending stage. In the initial stage of loading, as the rebars undergo tensile stress, there is minimal slip at the loading end of the specimen, resulting in an upward trend in the curve. This stage is primarily resisted by chemical adhesion force against the pullout force. As the load increases, tensile deformation of the rebars causes slip at the free end, and the bonding force is mainly composed of mechanical interlocking force between the ribs of the straight portion of the rebars. When the pullout force reaches a certain level, the slope of the curve decreases significantly, but the bonding stress of the specimen continues to increase. This is because the coating on the surface of the straight portion of the rebars is damaged and detached due to concrete failure, and the concrete between the ribs is also subjected to shear failure, failing in the bonding effect between the straight portion of the rebars and the concrete interface. The bending portion of the rebars then fully bears the pullout force. Until the pullout force reaches its limit value, the curve starts to descend, indicating complete failure of the bond between the rebars and the concrete interface, leading to the rebars being pulled out. However, after a certain displacement in the descending stage, the curve shows a smooth stage. This is because there is residual anchoring force and friction force in the rebars, maintaining a certain resistance effect in the specimen.
Bond Strength
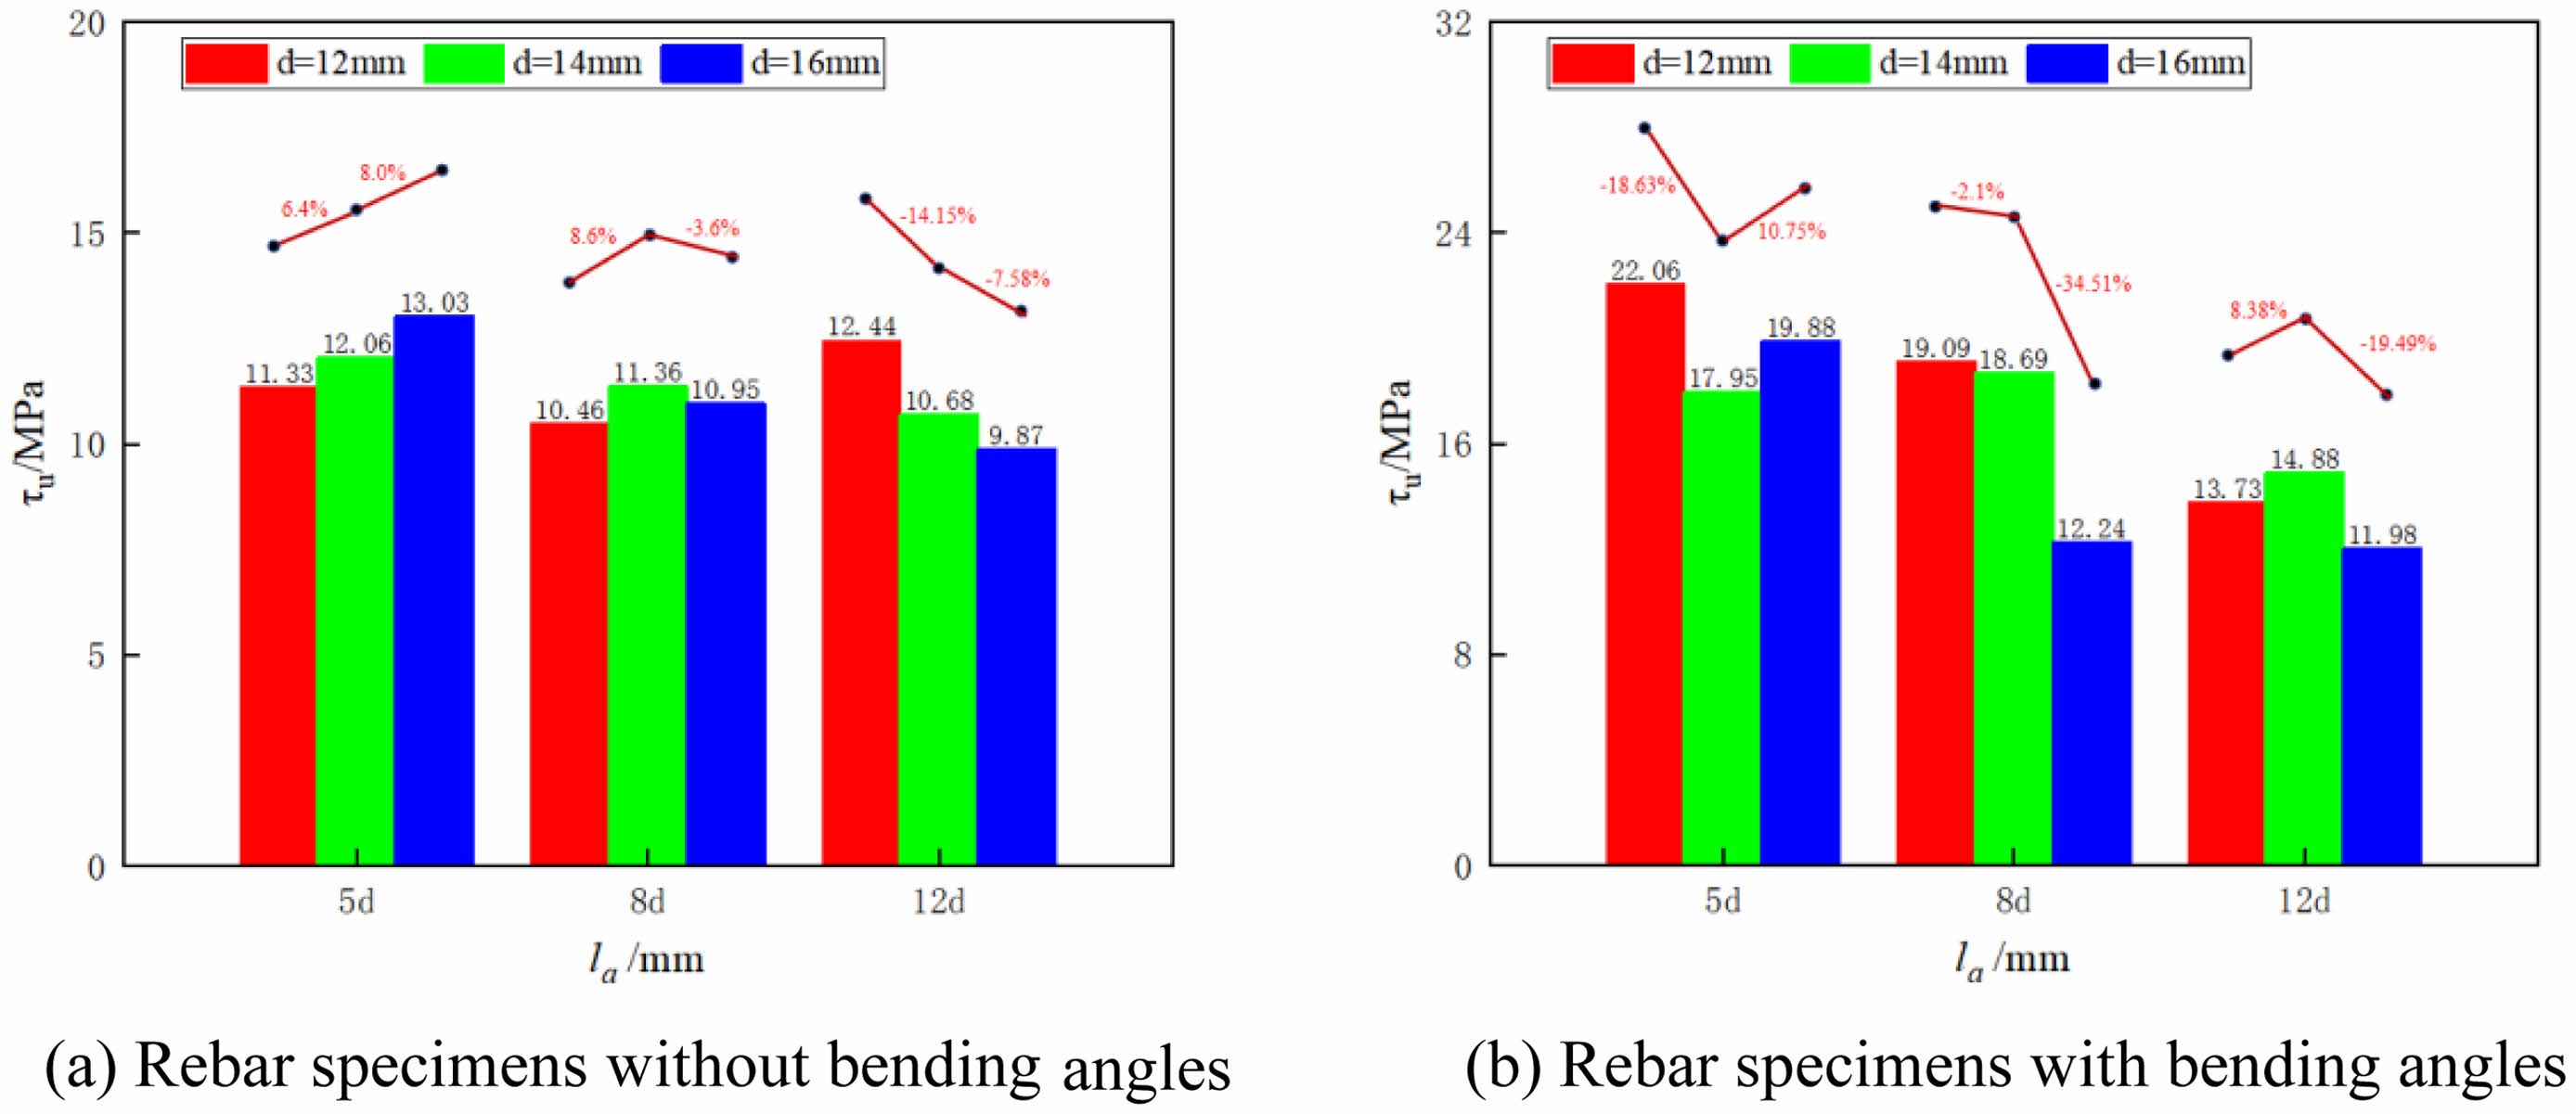
To analyze the impact of different parameters on bond-slip performance, the ultimate bond strength values (τu) for each specimen were extracted, as shown in Fig. 5. For specimens with straight rebar, when la=5d, the bond strength increases with the rebar diameter. When la=8d, the bond strength initially increases and then decreases. When la=12d, the bond strength decreases as the rebar diameter increases. This indicates that a long bond length with small-diameter rebar and a short bond length with large-diameter rebar can effectively enhance the bond strength of the specimens. For specimens with angled rebar, the bond strength is highest for those with a short bond length and small-diameter rebar. When the d=12 mm or d=16 mm, the bond strength decreases as the bond length increases; when d=14 mm, the bond strength initially increases and then decreases. This shows that rebar with different diameters and bond lengths has a significantly varied impact on the bond-slip performance of the specimens.
|
Fig. 1 Loading apparatus for pull-out test. |
|
Fig. 2 Failure pattern of rebar specimens without bending angles. |
|
Fig. 3 Failure pattern of rebar specimens with bending angles. |
|
Fig. 4 Bond stress-slip curves of specimens. |
|
Fig. 5 Comparison of ultimate bond stress for specimens |
|
Table 1 Mechanical properties of concrete materials. |

Note: fcu is the compressive strength of standard concrete cubes; fc is the compressive strength of concrete cores; ft is the tensile strength of concrete cores. |
|
Table 2 Mechanical properties of epoxy-coated reinforcement bars |

Note: ECR is reinforcement type. |
|
Table 3 Specimen dimensions and forms. |
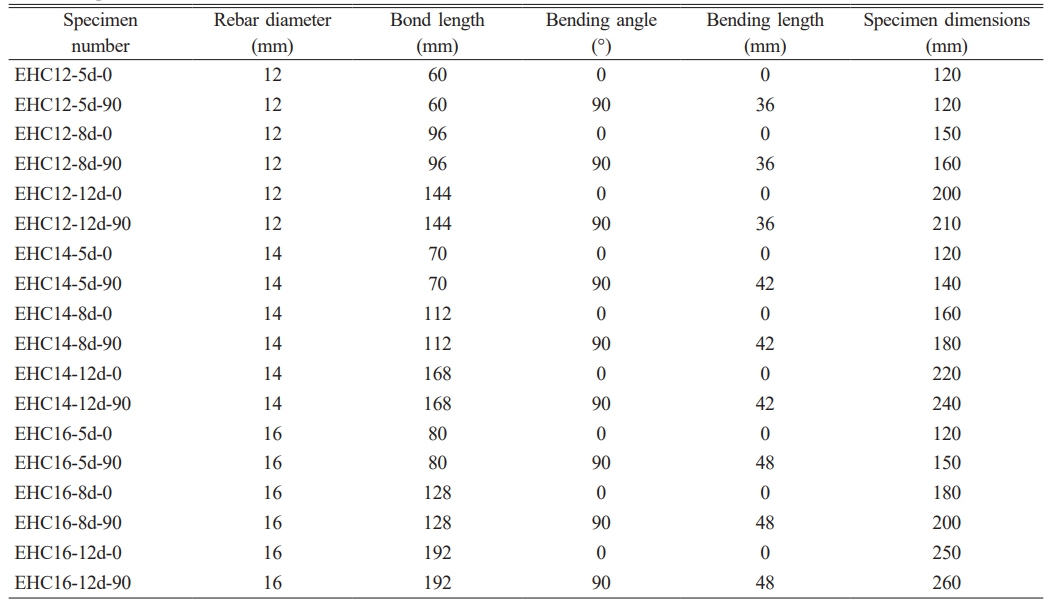
Note: EHC represents epoxy-coated reinforcement-high-strength concrete members; 12, 14, and 16 represent rebar diameters; 5d, 8d, and 12d represent bond lengths of reinforcement bars; 0, 90 represent bending hook angles of reinforcement bars. |
Numerical Model
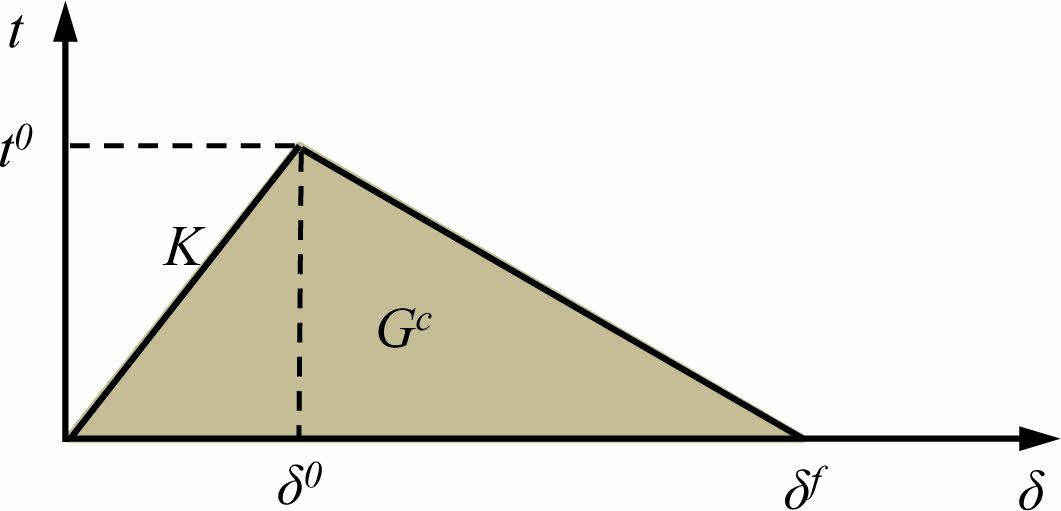
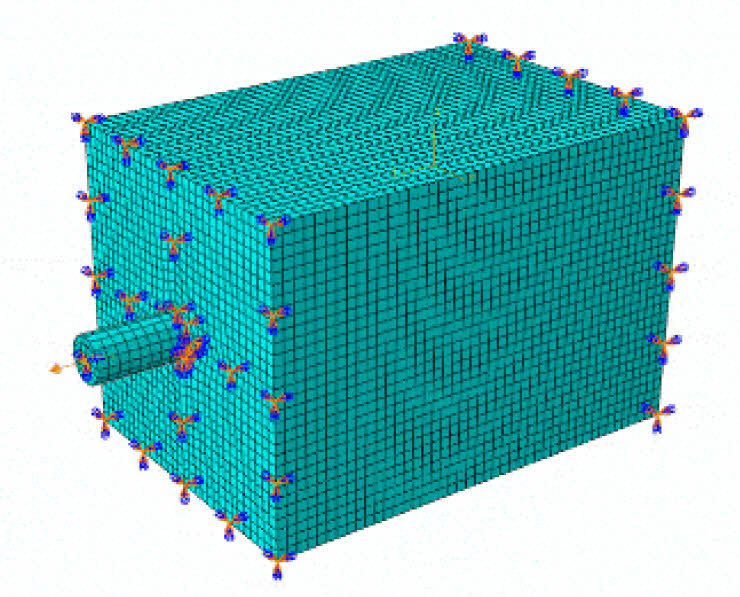
To highlight the bond-slip characteristics between epoxy-coated rebar and high-strength concrete, a cohesive constitutive model was used to define the bond performance between the two materials, as shown in Fig. 6. Finite element software Abaqus was utilized to create models for each specimen. The sides of the concrete were treated as rigid connections, with constraints applied to displacements and rotations in various directions, as illustrated in Fig. 7. To simulate the pull-out process, displacement was applied at the pull-out end of the epoxy-coated rebar using an amplitude curve, with a loading rate of 1 mm/min. Based on material property test results, the following parameters were used: specimen stiffness K=1.6×10⁴ MPa/m, peak stress t0=20 MPa, plastic displacement δ0=10 mm, an exponential parameter of 0.5, a viscosity coefficient of 0.0001, and a friction coefficient of 0.586.
Constitutive Model
Referencing the Code for Design of Concrete Structures (GB50010-2010) [26], the material strength values were obtained. The elastic modulus of C50 concrete is calculated as 35,148 MPa, with a Poisson's ratio of 0.2. The expression for the stress-strain curve under uniaxial tension for concrete is provided [30]:

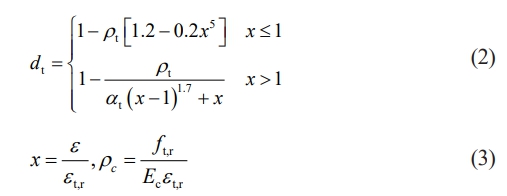
Where: αt is the parameter value of the descending segment of the stress-strain curve for uniaxial tensile behavior of concrete; ft,r is the representative value of the uniaxial tensile strength of concrete; εt,r is the peak tensile strain of concrete associated with the representative value of uniaxial tensile strength; dt is the parameter for the damage evolution of concrete under uniaxial tension.
The expression for the stress-strain curve under uniaxial compression is:
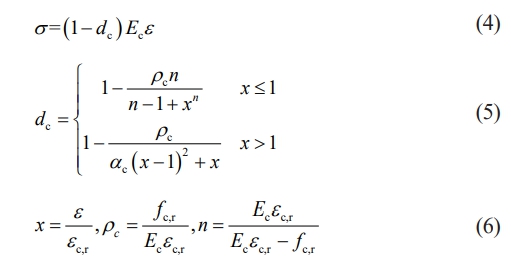
Where: αc is the parameter value of the descending segment of the stress-strain curve for uniaxial compression of concrete; fc,r is the ultimate compressive stress of concrete; εc,r is the ultimate compressive strain of concrete associated with fc,r; εc,u is the compressive strain at concrete failure; dc is the parameter for the damage evolution of concrete under uniaxial compression.
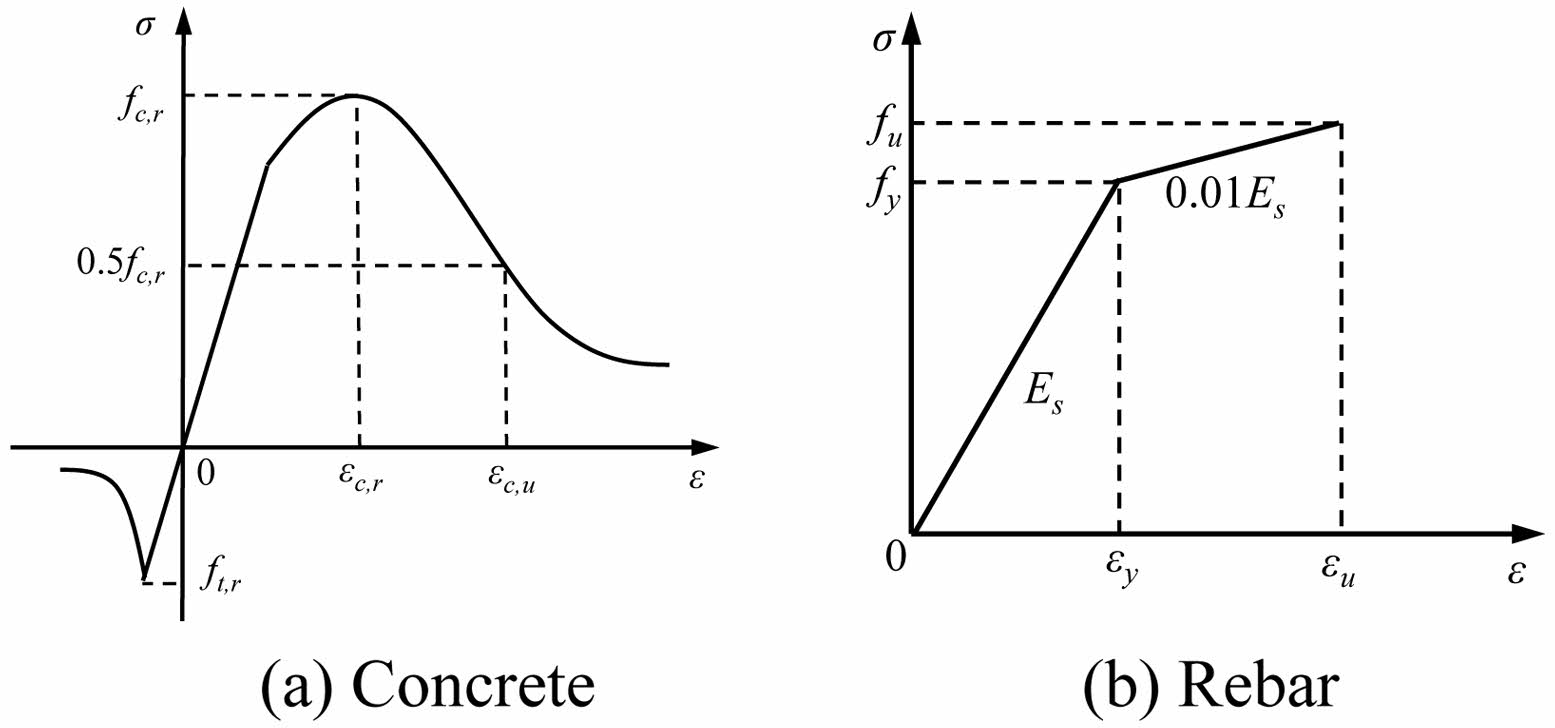
Incorporating the variation pattern of the concrete stress-strain curve (Fig. 8a), the plastic damage model for concrete follows the Lubiner yield criterion. The yield surface is defined by introducing the ratio of equivalent biaxial to uniaxial initial strength ()
and the ratio of the second stress invariant to the uniaxial equivalent stress (). To simplify the complex stress-strain relationship during rebar deformation [34], a bilinear kinematic hardening model is adopted for the rebar (Fig. 8b). Specific constitutive model parameters are provided in Tables 4 and 5.
Calculation Result
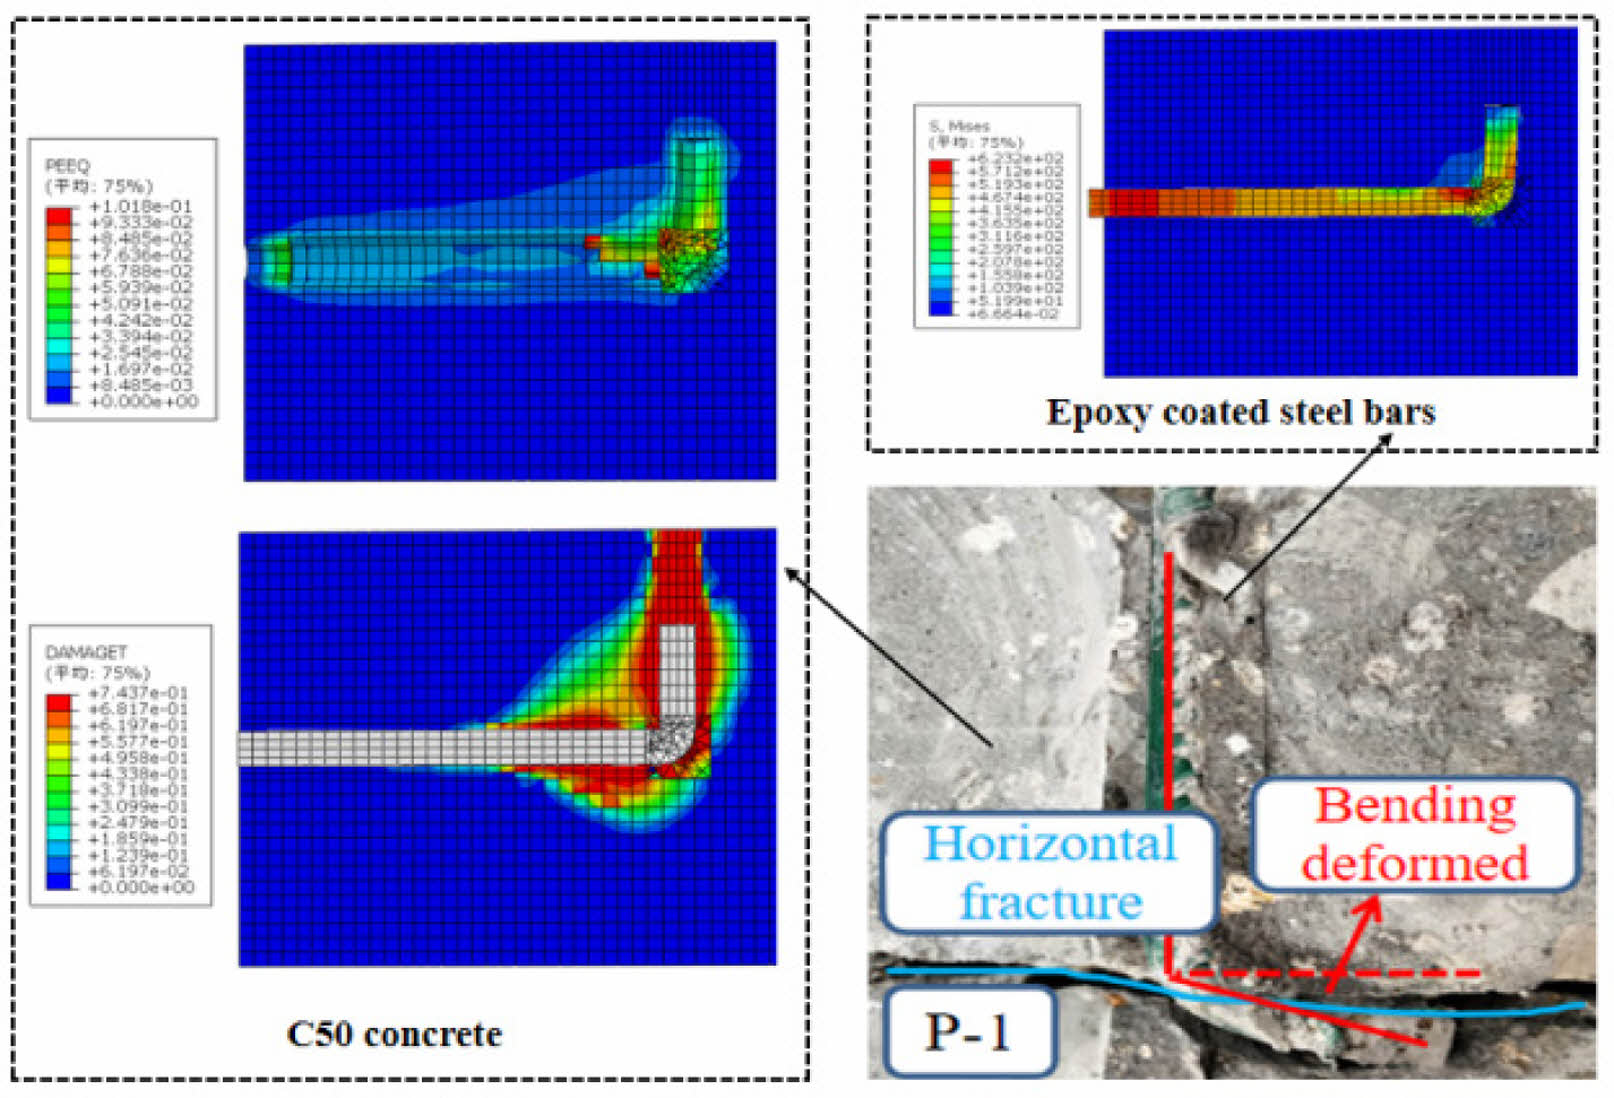
To extract the Plastic Strain Energy Density graphs (PEEQ), Tensile Damage graphs (DAMAGET), and rebar Yield Stress graphs (Mises) for typical specimens EHC12-12d-90 and EHC16-12d-0 after calculation, and to compare them with experimental results for validation.
Specimen EHC12-12d-90
For specimen EHC12-12d-90, after calculation, the failure mode observed was rebar pullout, and the concrete failure region aligned well with the experiment, as depicted in Fig. 9. The maximum plastic strain in concrete was found near the rebar hook, surpassing the material's strain limit significantly. This indicates severe plastic deformation in the concrete around the rebar hook. In the tensile damage graph, the concrete failure concentrated around the rebar hook and extended along the direction of the hook. However, the calculated results showed that the cracks did not penetrate the entire concrete cross-section, differing slightly from the experimental findings. This discrepancy may be attributed to idealized constraints in the numerical model, preventing concrete from undergoing full-scale slip. Upon examining the calculated yield stress, it was found that the Mises stress values mainly concentrated at the loading end of the rebar and the rebar hook, peaking at 623.8 MPa, which closely matched the experimental value of 613.2 MPa.
Specimen EHC16-12d-0
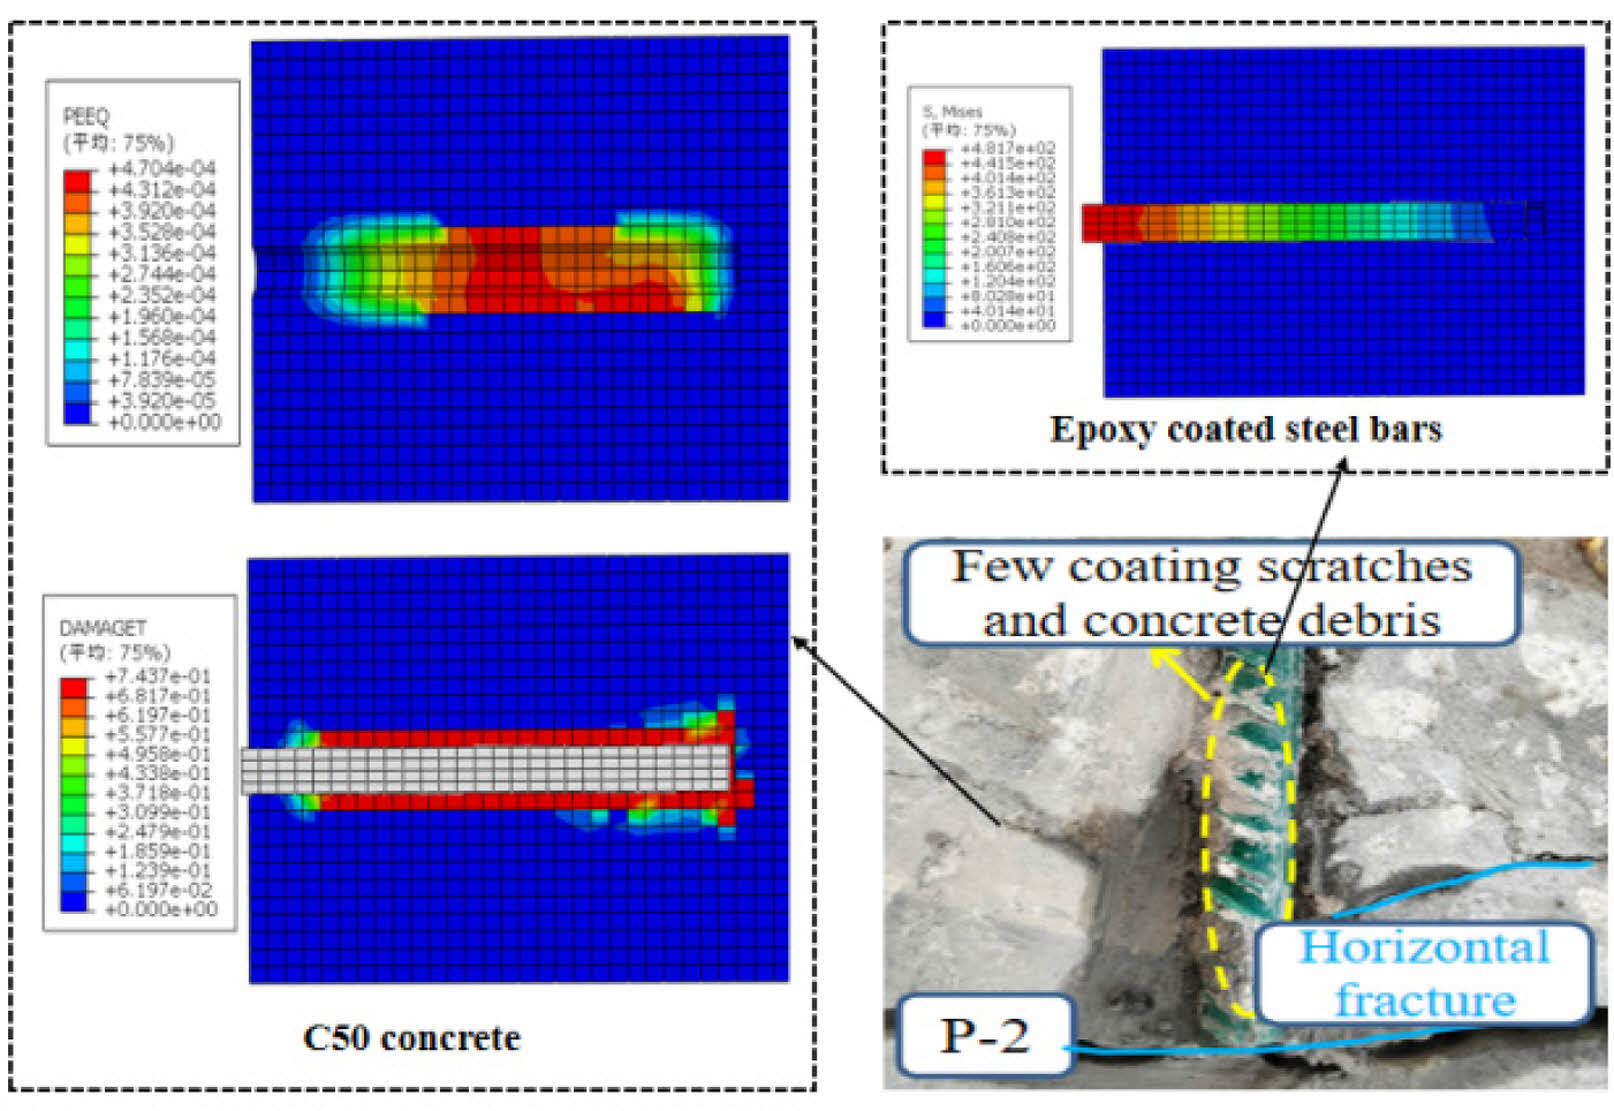
After the calculation for the specimen EHC16-12d-0 (Fig. 10), it was found that the maximum plastic strain in concrete occurs near the free end of the rebar and covers the surrounding concrete. However, the maximum plastic strain value does not reach the limit of the concrete material, primarily because the model does not account for the influence of rebar ribs, reducing the extent of damage to the concrete wall during rebar pullout. From the tensile damage plot of concrete, it is observed that the damage concentrates at the contact points of the rebar and appears transverse cracking near the free end of the rebar, consistent with experimental observations. The peak Mises stress for the rebar without bend angle occurs at the loading end, with a value of 481.7 MPa, which is close to the experimental value of 455.4 MPa.
Load-Displacement Curve
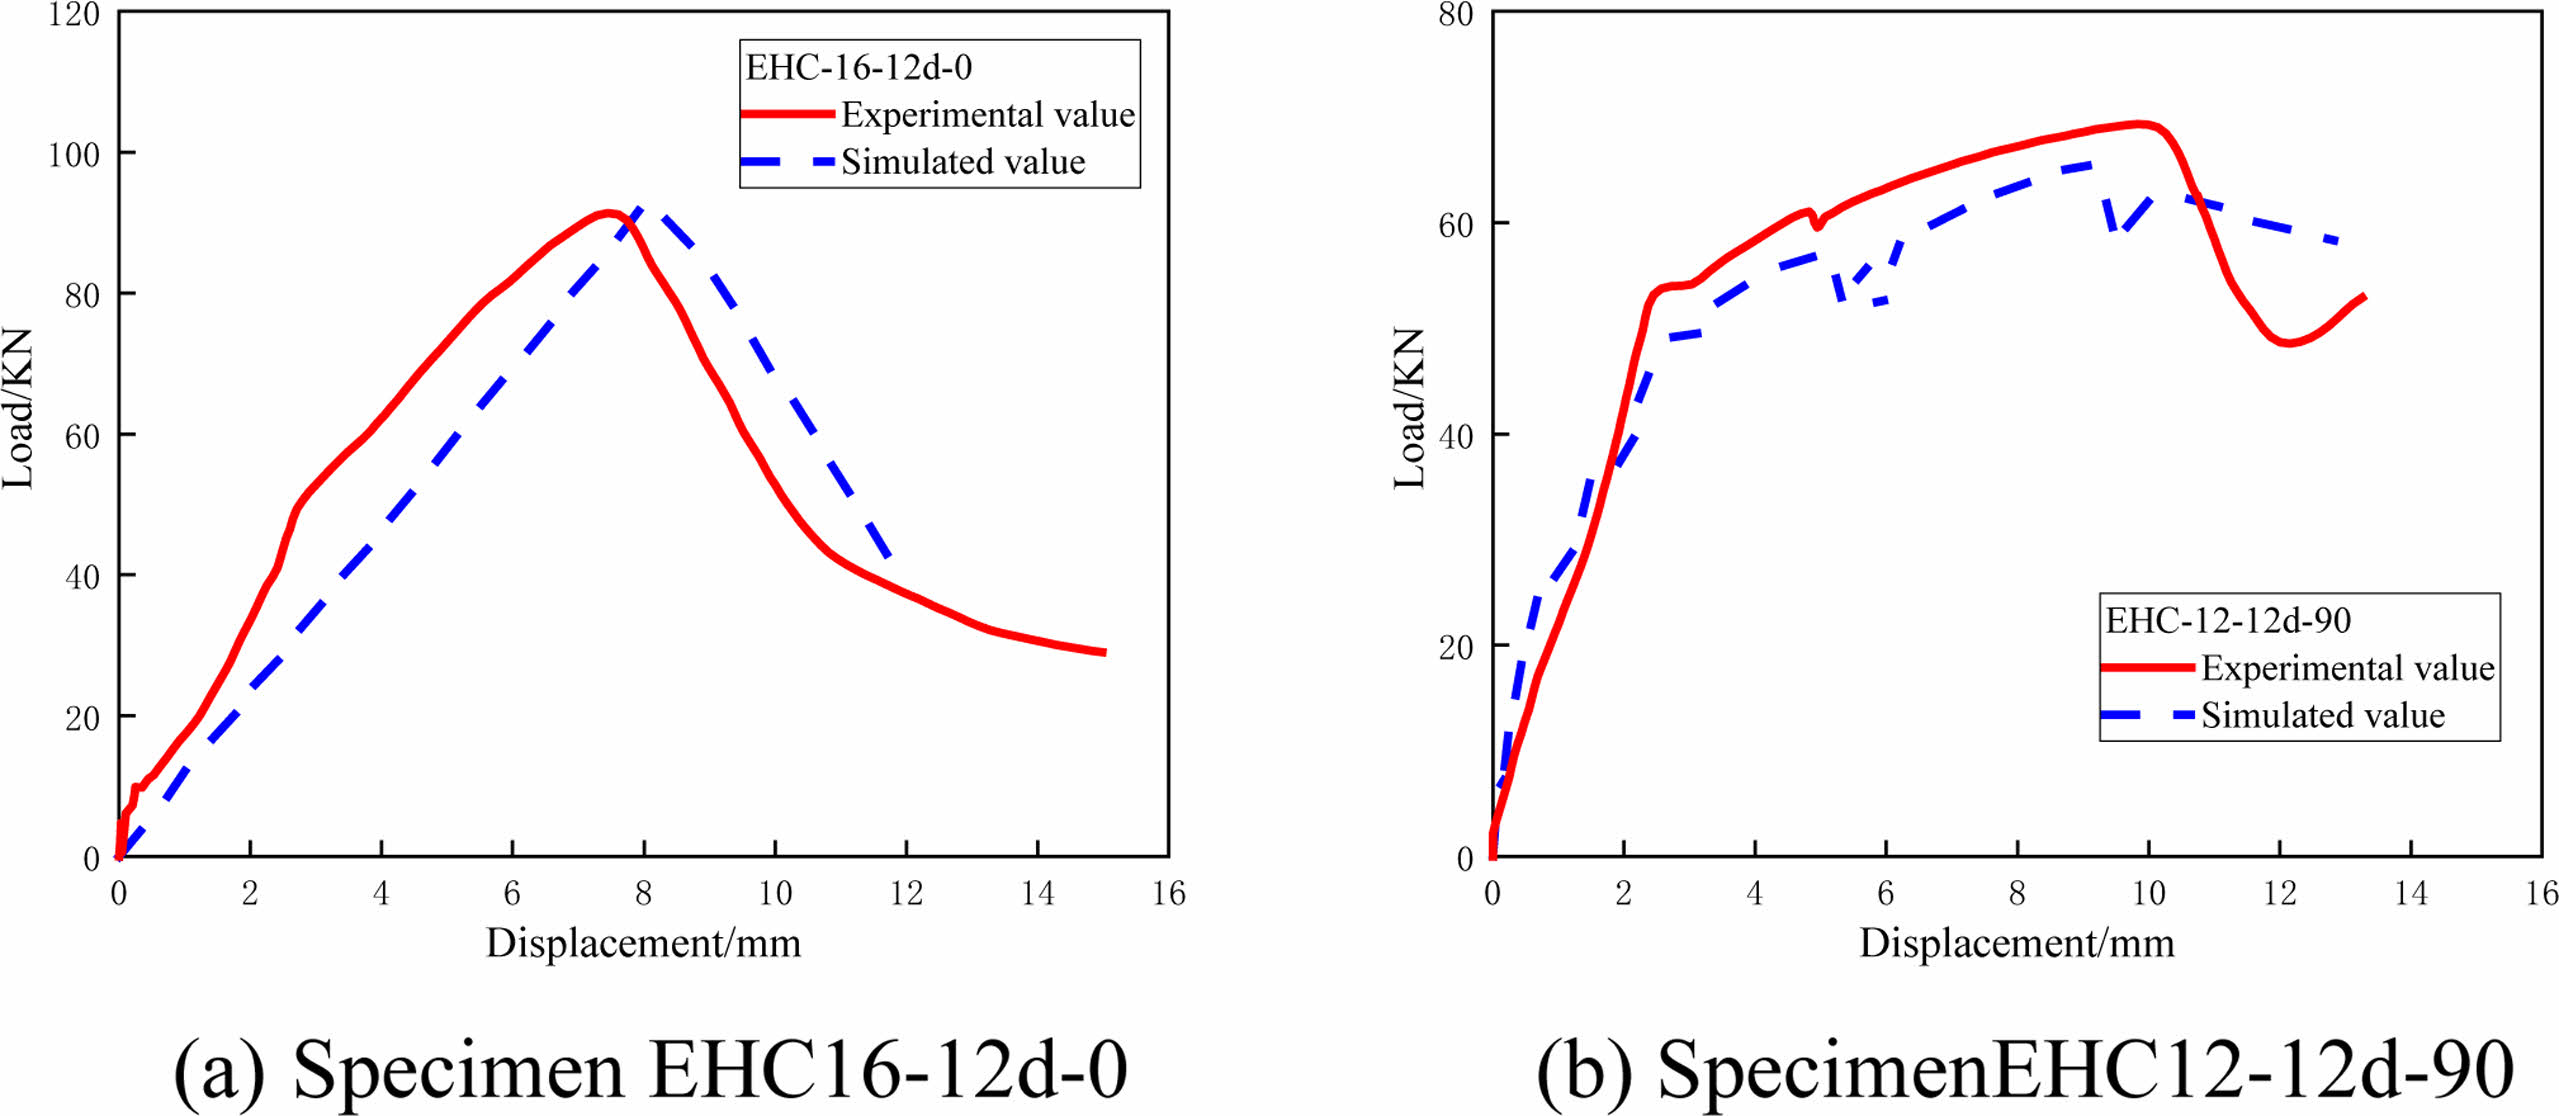
From the pull-out tests, it is observed that the load-displacement curves for specimen EHC16-12d-0 (Fig. 11a) exhibit a trend of initial increase followed by a sharp decrease, with experimental and computational results showing great agreement. In contrast, for specimen EHC12-12d-90 (Fig. 11b), the presence of bent rebars impedes the pullout process, resulting in a curve with ascending and smooth segments. Additionally, during the calculation process, stress redistribution in the concrete causes a sudden drop in the load. Overall, comparing experimental and computational results reveals that the peak loads and trends are in good agreement, indicating that the model is suitable for further analysis and extension.
|
Fig. 6 Cohesive constitutive model |
|
Fig. 7 Finite element model |
|
Fig. 8 Stress-strain curve. |
|
Fig. 9 Compares the finite element analysis with experimental results for specimen EHC12-12d-90. |
|
Fig. 10 Compares the finite element analysis with experimental results for specimen EHC16-12d-0. |
|
Fig. 11 Load-displacement curve. |
Parameter Determination
Based on the established numerical model and without considering the bend angle of the rebars, the analysis focuses on the influence of different factors on the ultimate bond strength of pullout specimens. The parameters for variation include rebar diameter (d) and bond length (la). The design forms of the specimens are shown in Table 6.
Damage Analysis
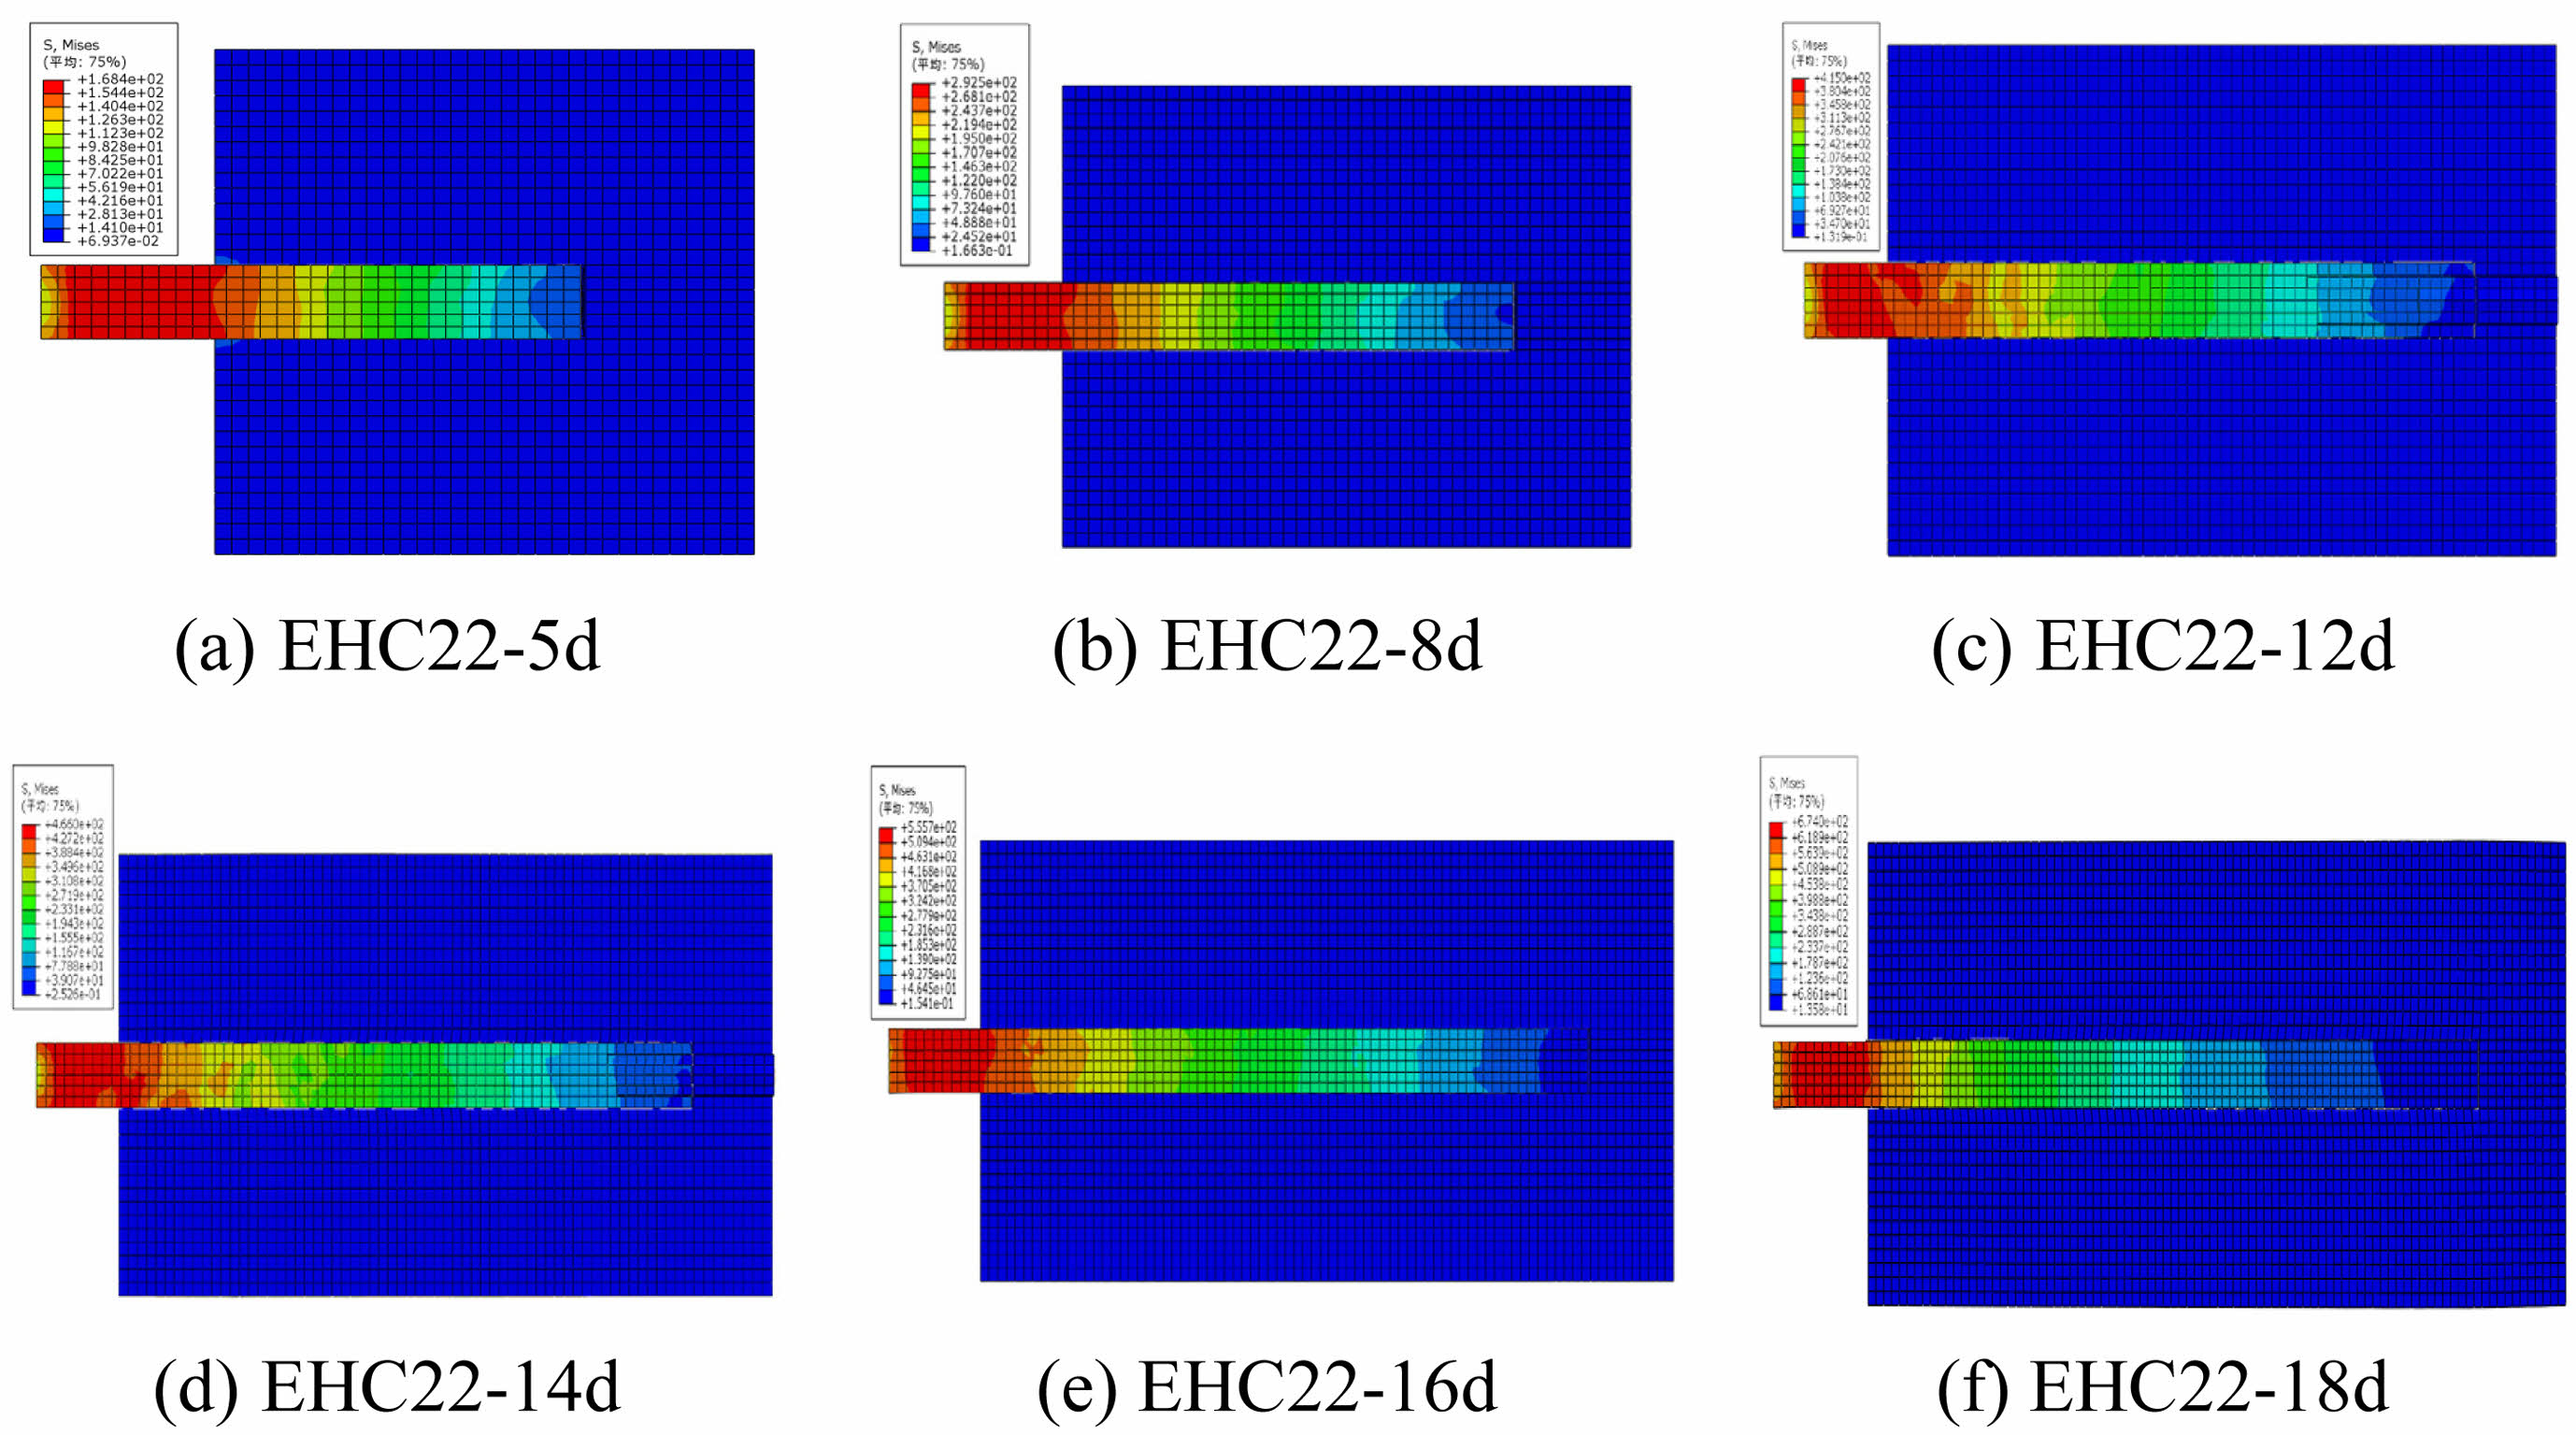
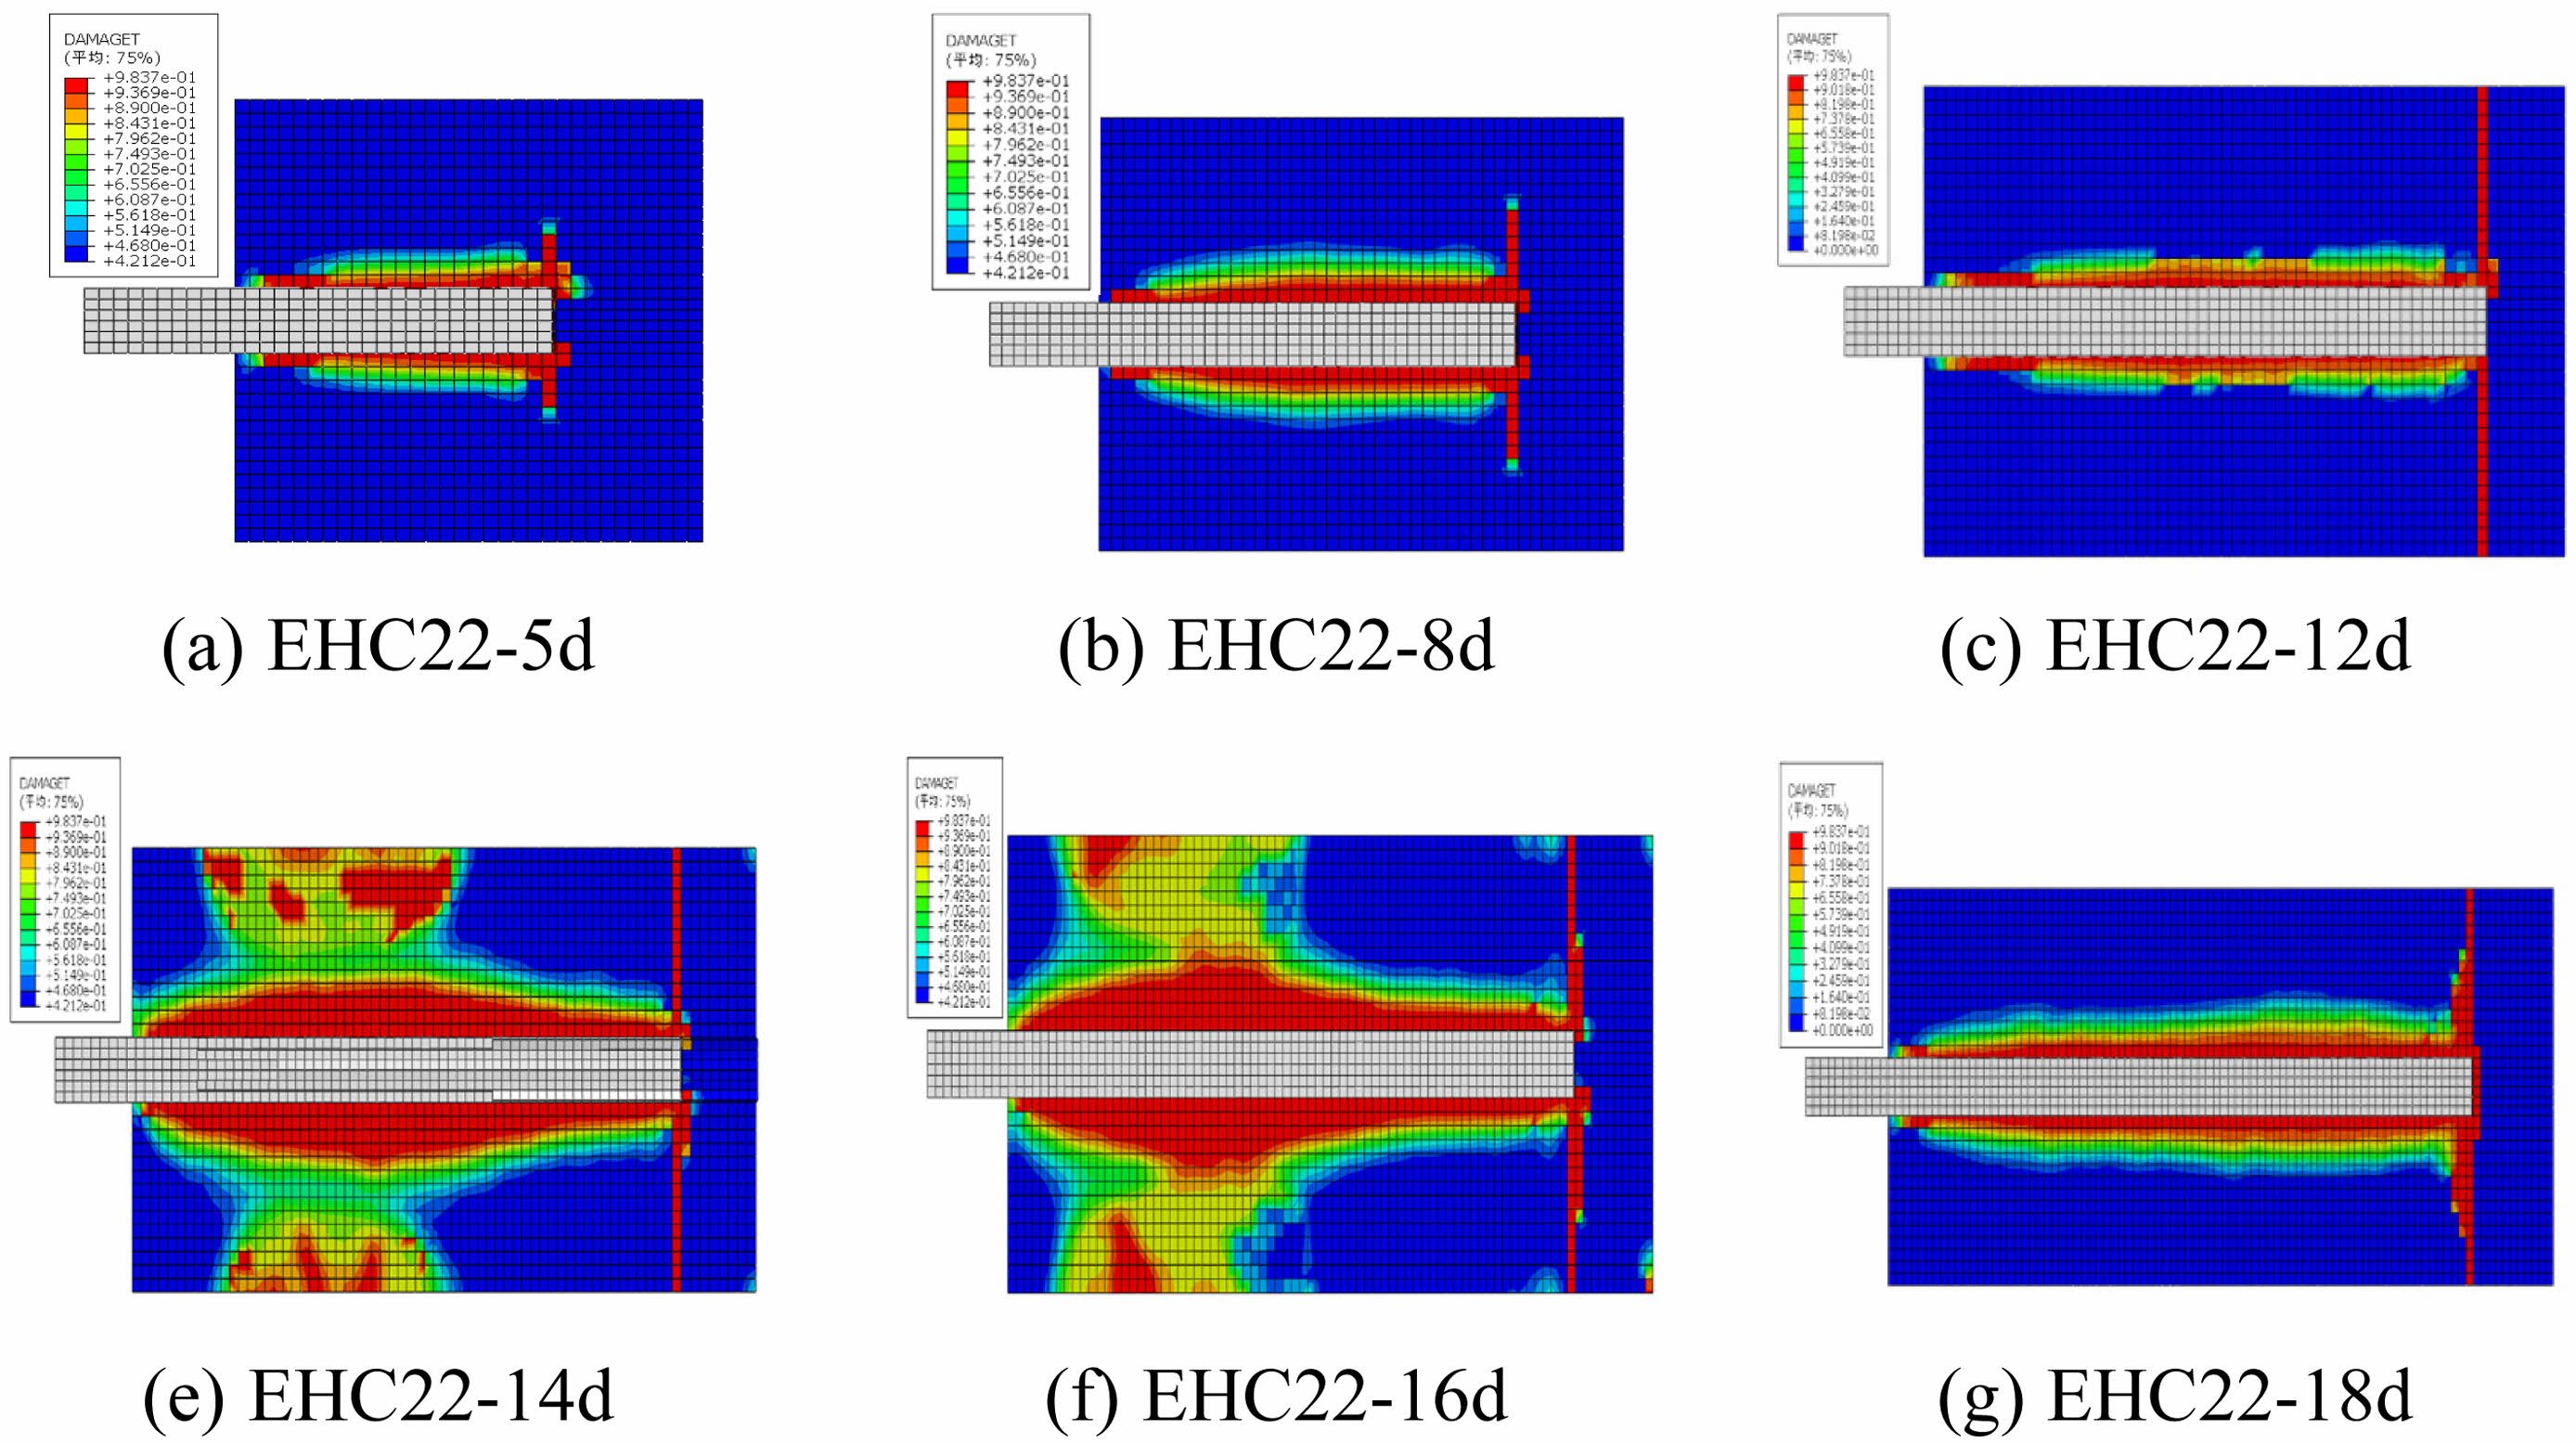
Select specimens with a rebar diameter of 22 mm for analysis. The stress-strain graph of the rebar and the tensile damage graph of the concrete at the ultimate state for each specimen are shown in Fig. 12 and Fig. 13, respectively.
In Fig. 12, the variation of reinforcement stress across different specimens is generally consistent. Under the ultimate state, the stress in the reinforcement is primarily concentrated at the loading end, gradually decreasing from the loading end to the free end, until it reaches zero at the surface of the free end. For the rebar bond lengths ranging from 5d to 18d, the maximum stress for each specimen is 168.4 MPa, 292.5 MPa, 415.0 MPa, 466.0 MPa, 555.7 MPa, and 674 MPa, respectively. Notably, when the bond length is 12d, the reinforcement stress reaches the yield strength; when the bond length is 18d, the reinforcement stress reaches the material's ultimate strength, resulting in significant pull-out deformation.
From the concrete damage contour plots under the ultimate state for each specimen (Fig. 13), it can be observed that the weak spots are consistently located at the interface between the epoxy-coated reinforcement and the high-strength concrete, displaying a circumferential distribution. The closer to the bond interface, the greater the tensile damage. Additionally, there is a longitudinal concrete damage zone at the free end of the reinforcement, with the damaged area increasing as the bond length increases. This occurs because, during reinforcement pull-out, the concrete section containing the reinforcement undergoes compressive deformation due to the bond force, while the concrete section without reinforcement undergoes tensile deformation due to end restraint, resulting in a longitudinal damage zone at the interface of tensile and compressive stresses. For bond lengths of 14 mm and 16 mm (Figs. 13d and 13e), tensile damage through the mid-section of the concrete appears because the bond force of the reinforcement at the loading end causes tensile cracking in the concrete before the reinforcement is fully pulled out. However, when the bond length increases to 18d, the reinforcement reaches its ultimate stress and fractures before the concrete, leading to a reduction in concrete damage.
Load-displacement Curve
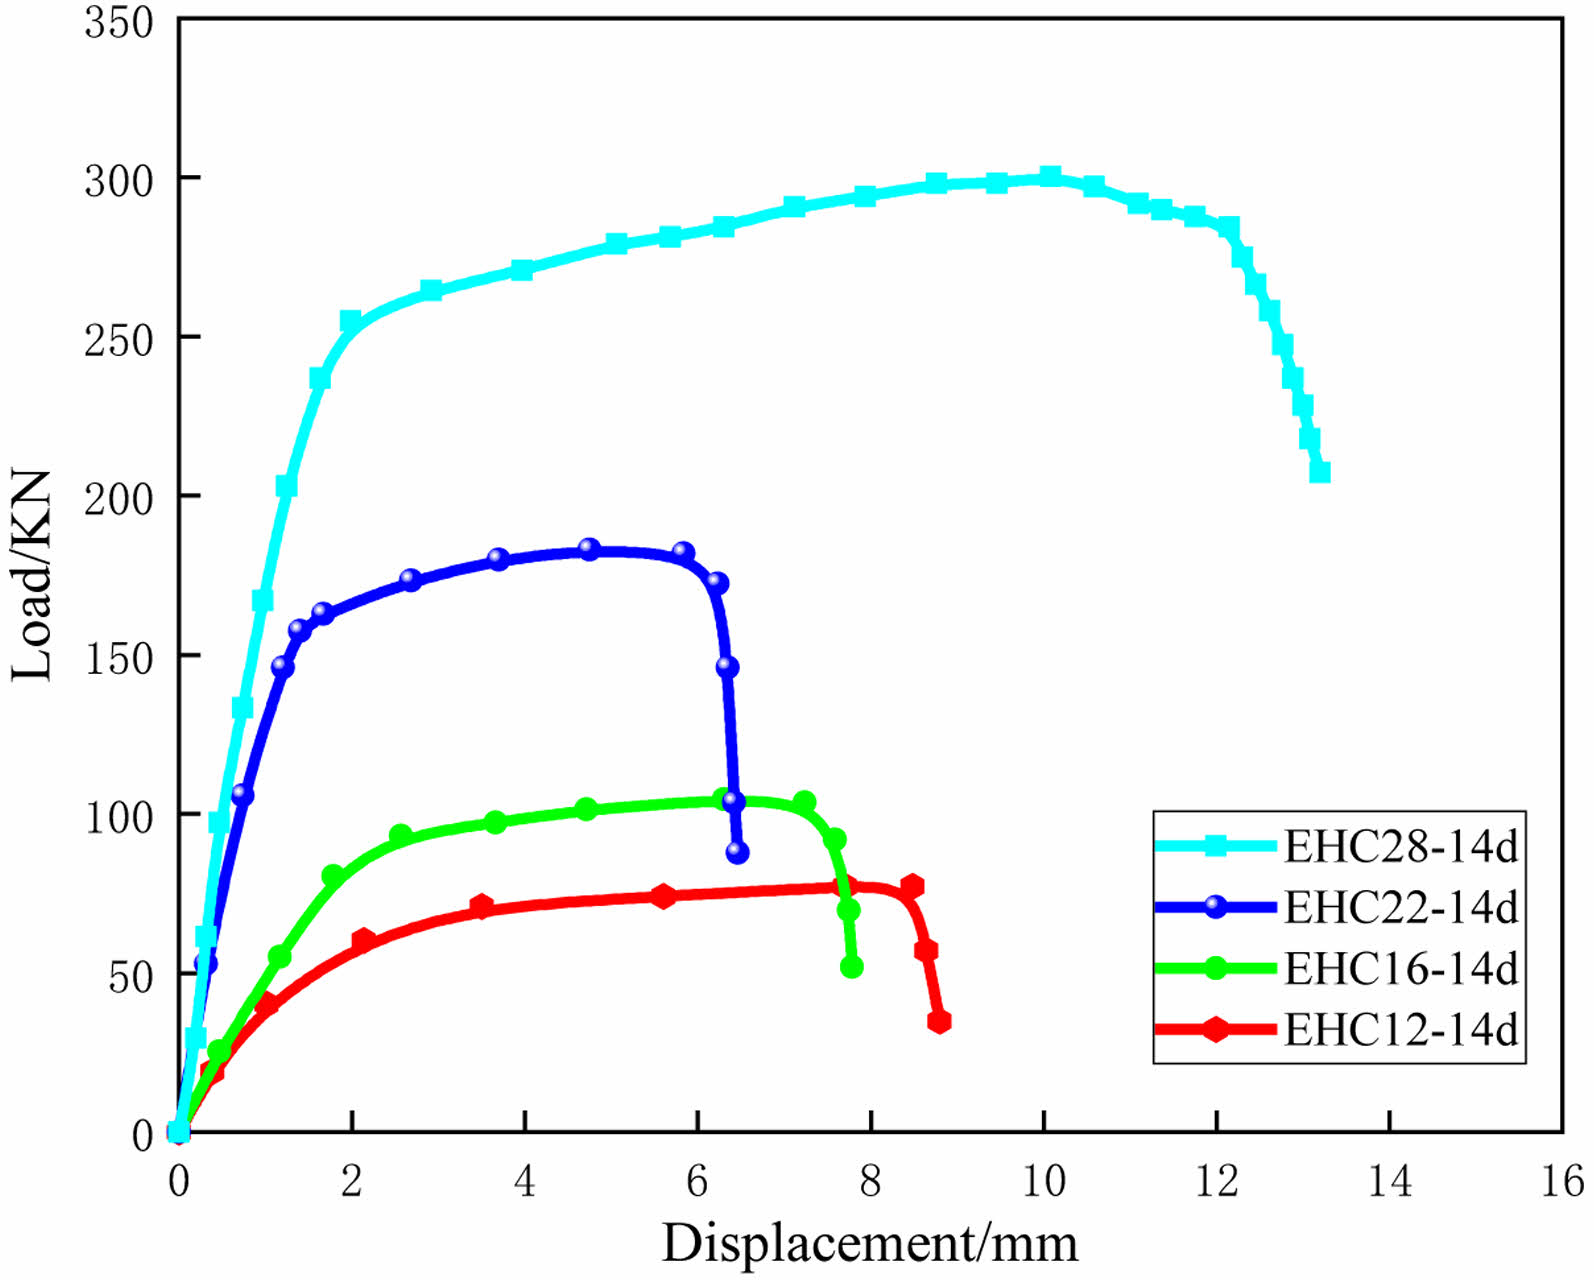
In Fig. 14, the load-displacement curves for specimens with different rebar diameters and a constant bond length of 14d exhibit a three-stage pattern: ascending stage, plateau stage, and descending stage. With a constant bond length, as the rebar diameter increases, the anchorage failure load of the specimens also increases. This is primarily because a larger rebar diameter increases the contact area with the concrete, thereby enhancing the bonding capacity.
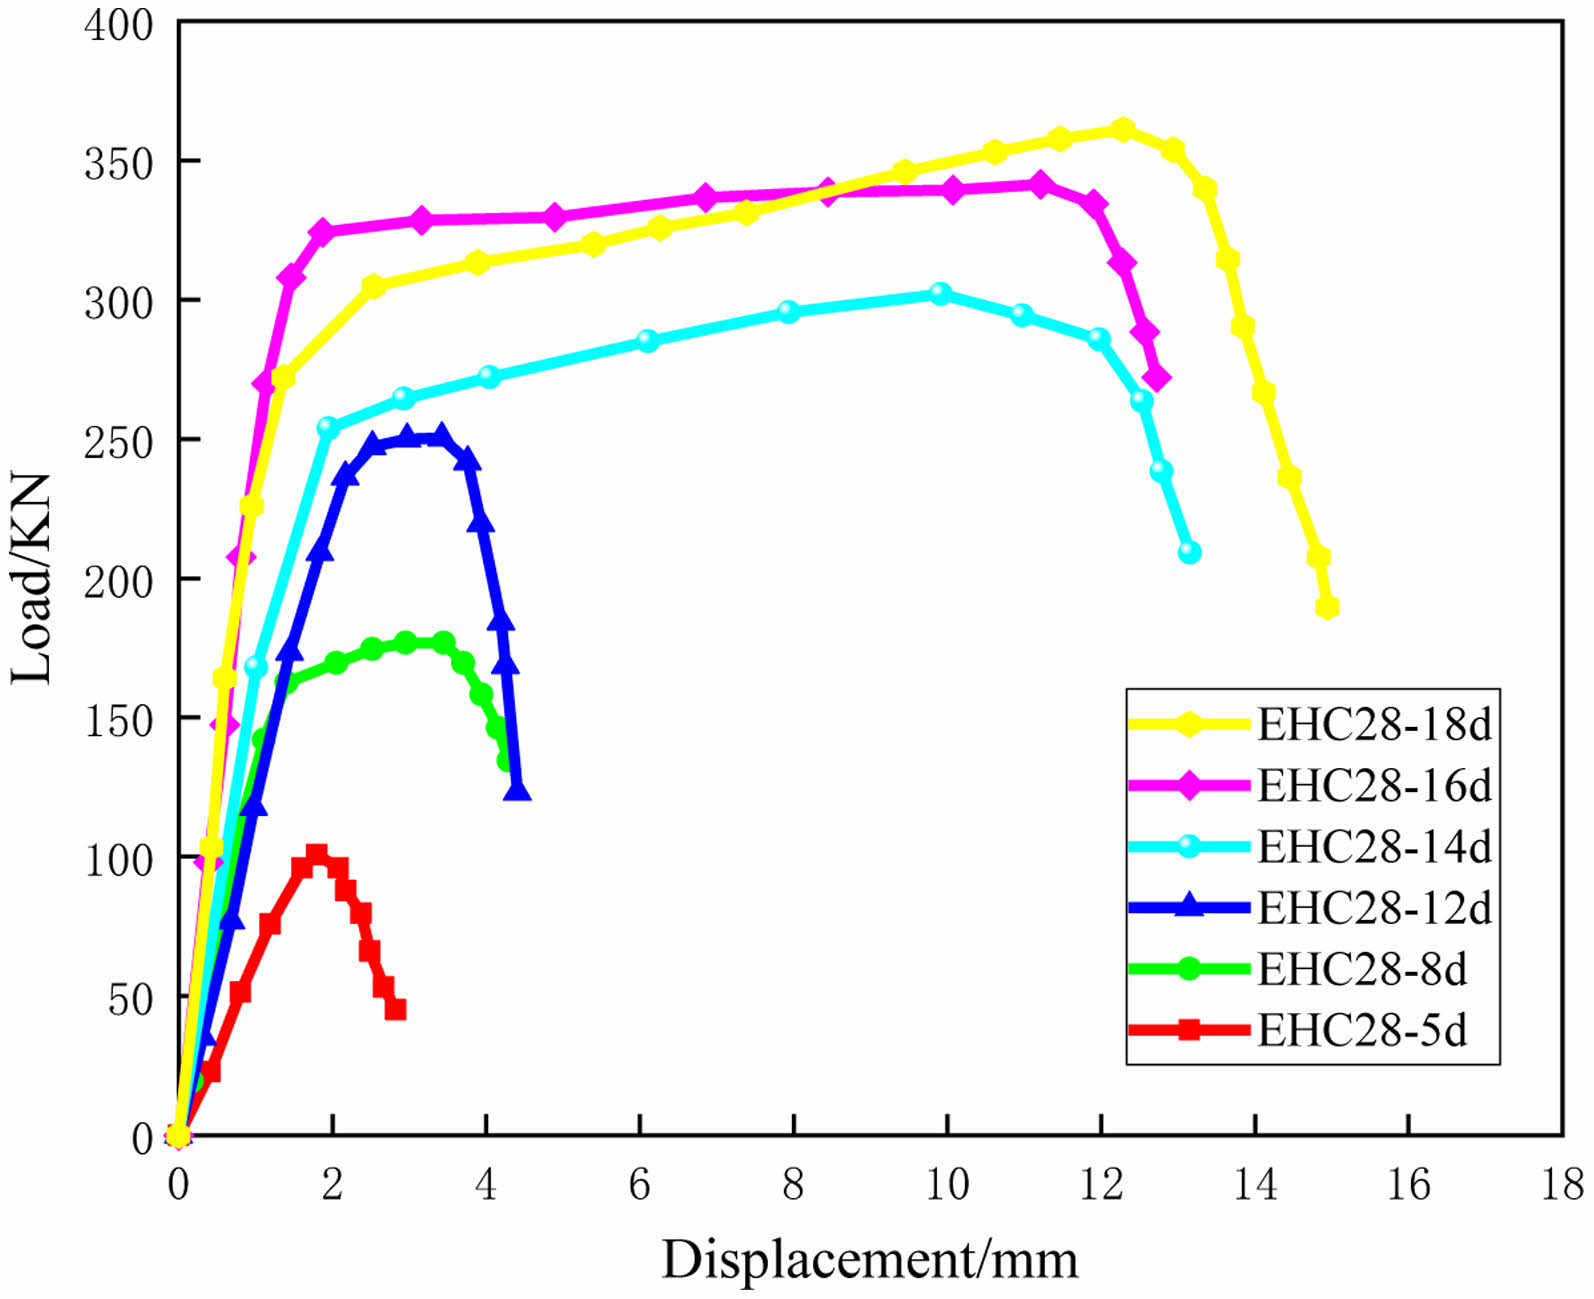
In Fig. 15, the load-displacement curves for specimens with varying bond lengths and a constant rebar diameter of 18 mm indicate that as the bond length increases, the anchorage failure load of the specimens correspondingly increases. Due to the uneven stress distribution on the surface of the reinforcement, the rate of increase in anchorage load decreases with the increasing bond length. The variation in the curves reveals that as the bond length increases, the slope of the ascending stage gradually increases. This is because specimens with shorter bond lengths are more prone to slippage during the pull-out process.
Discussion
After conducting parametric analysis, the ultimate bond loads and ultimate bond stress values of each specimen were extracted. Comparative analysis was conducted to investigate the variation trends of the bond strength between epoxy-coated rebars and high-strength concrete under different rebar diameters (d) and bond lengths (la).
Rebar diameter
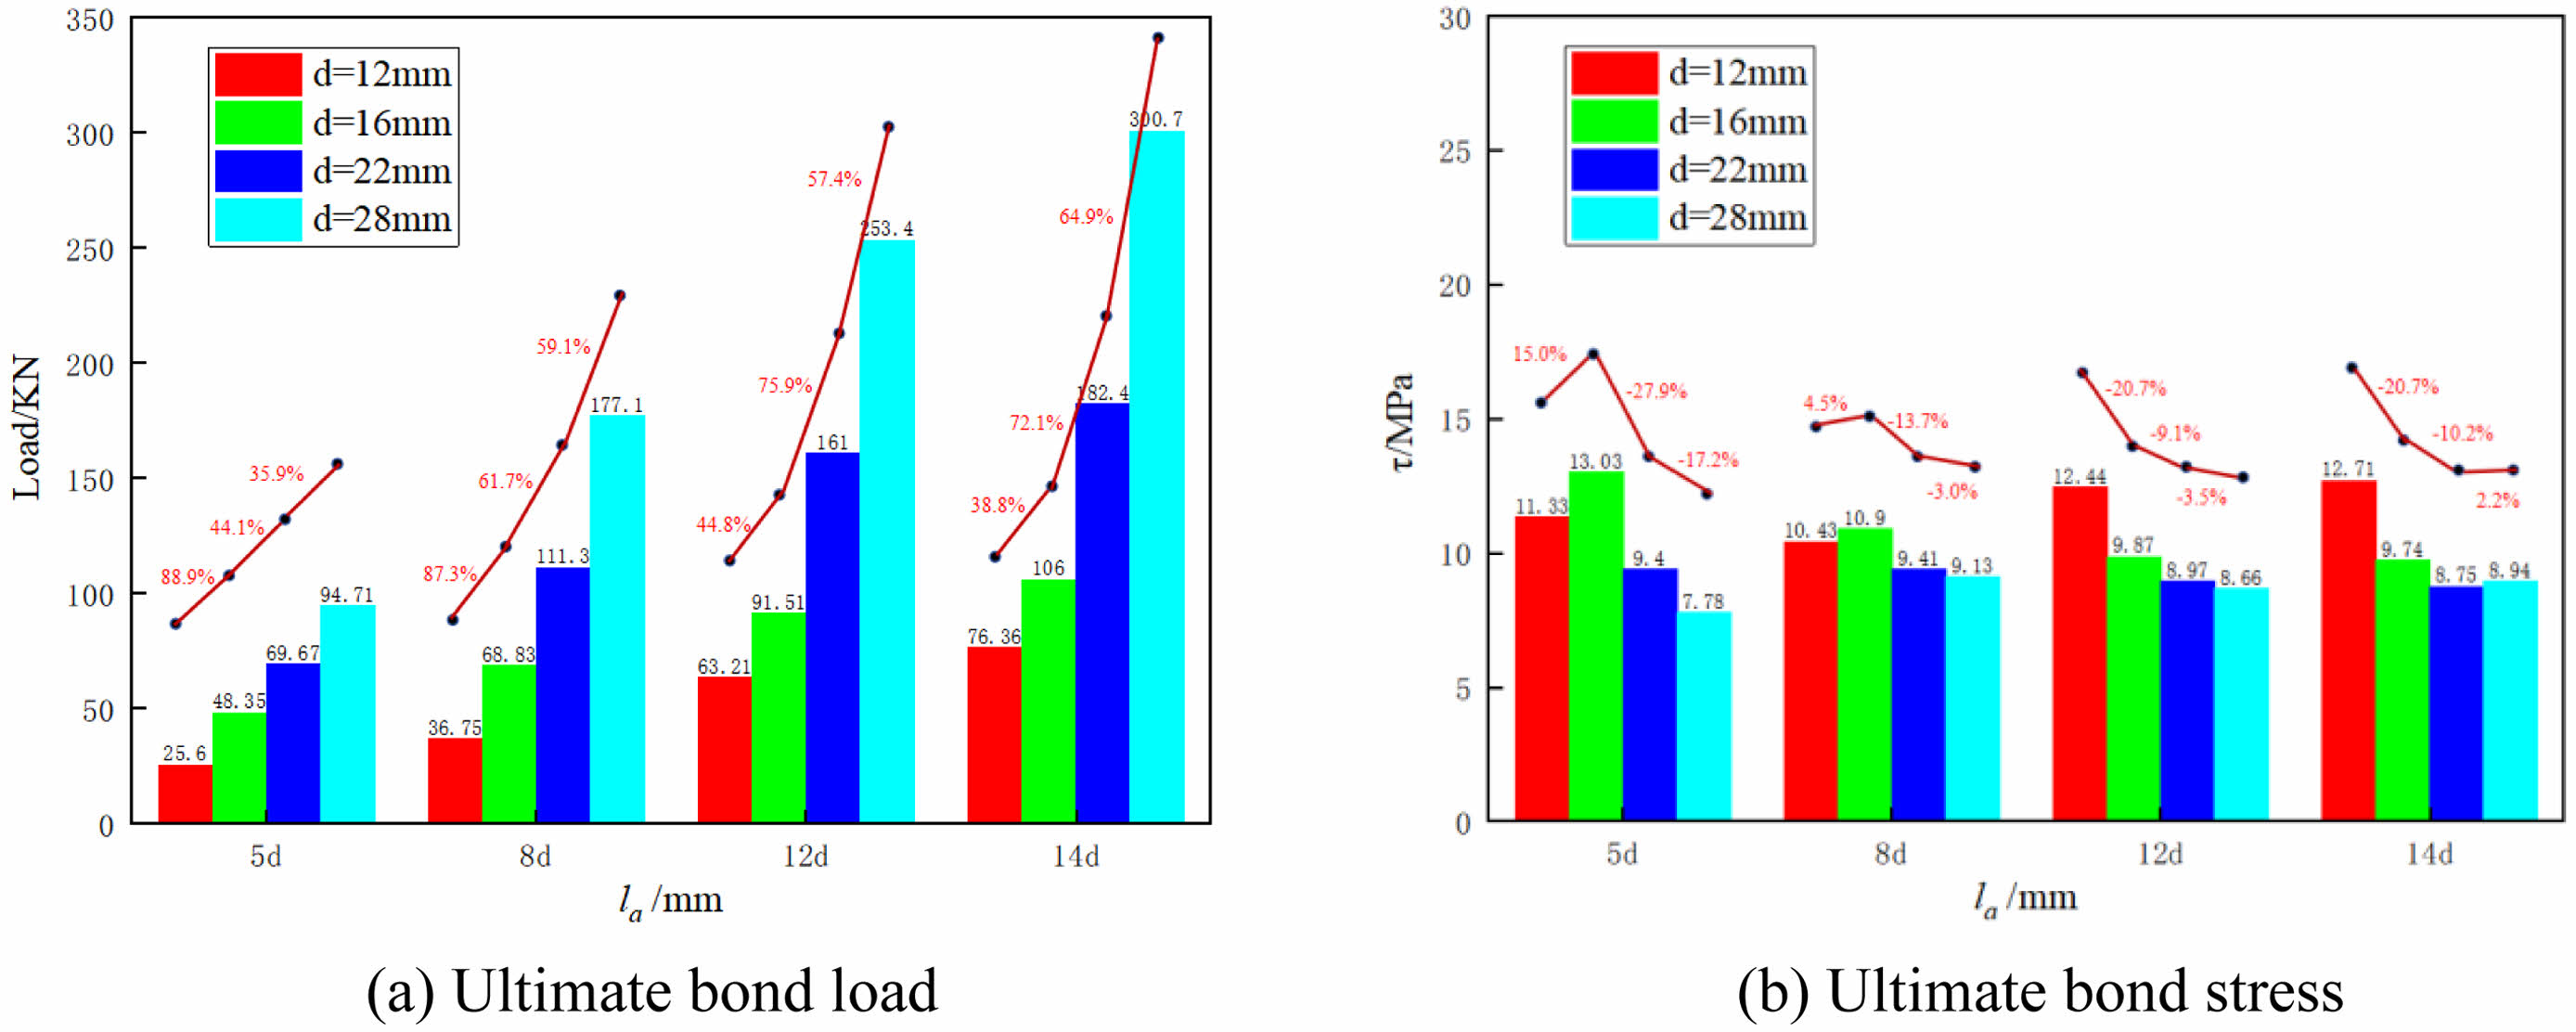
A comparison of the ultimate bond loads of specimens with different rebar diameters (Fig. 16a) reveals that increasing the rebar diameter effectively enhances the ultimate load capacity of the specimens, thus improving the anchorage ability of epoxy-coated rebars. Compared to specimens with d=12 mm, for each 1 mm increase in diameter, the growth values and proportions of ultimate bond loads are as follows: 4.32 MPa (16.9%), 8.77 MPa (23.9%), 11.88 MPa (18.8%), 14.02 MPa (18.4%). It can be observed that both the numerical and proportional increases of the ultimate bond loads for specimens with a bond length of 5d are smaller than those of other specimens. This is because the contact area between the rebar and concrete in this specimen is relatively small, and the increase in rebar diameter does not significantly increase the contact area of the specimen. Consequently, the bonding effect experienced by epoxy-coated rebars during the pullout process is relatively small, resulting in an insignificant increase in load-bearing capacity. In specimens with long-bonded rebars, increasing the diameter of the rebar can effectively enhance the ultimate bond load. The rate of change follows a trend of initially increasing, then decreasing and eventually stabilizing.
The comparison results of the ultimate bond stress of specimens with different rebar diameters (Fig. 16b) reveal that with the increase in rebar diameter, the specimens with bond lengths of 5d and 8d exhibit a trend of initially rising and then falling ultimate stress. Within the decreasing region, for each 1 mm increase in diameter, the bond stress of the specimens decreases by 3.4% and 1.4%, respectively. For specimens with bond lengths of 12d and 14d, the ultimate stress gradually decreases as the rebar diameter increases. For every 1mm increase in diameter, the bond stress of the specimens decreases by 1.9% and 1.8%, respectively.
Rebar bond length
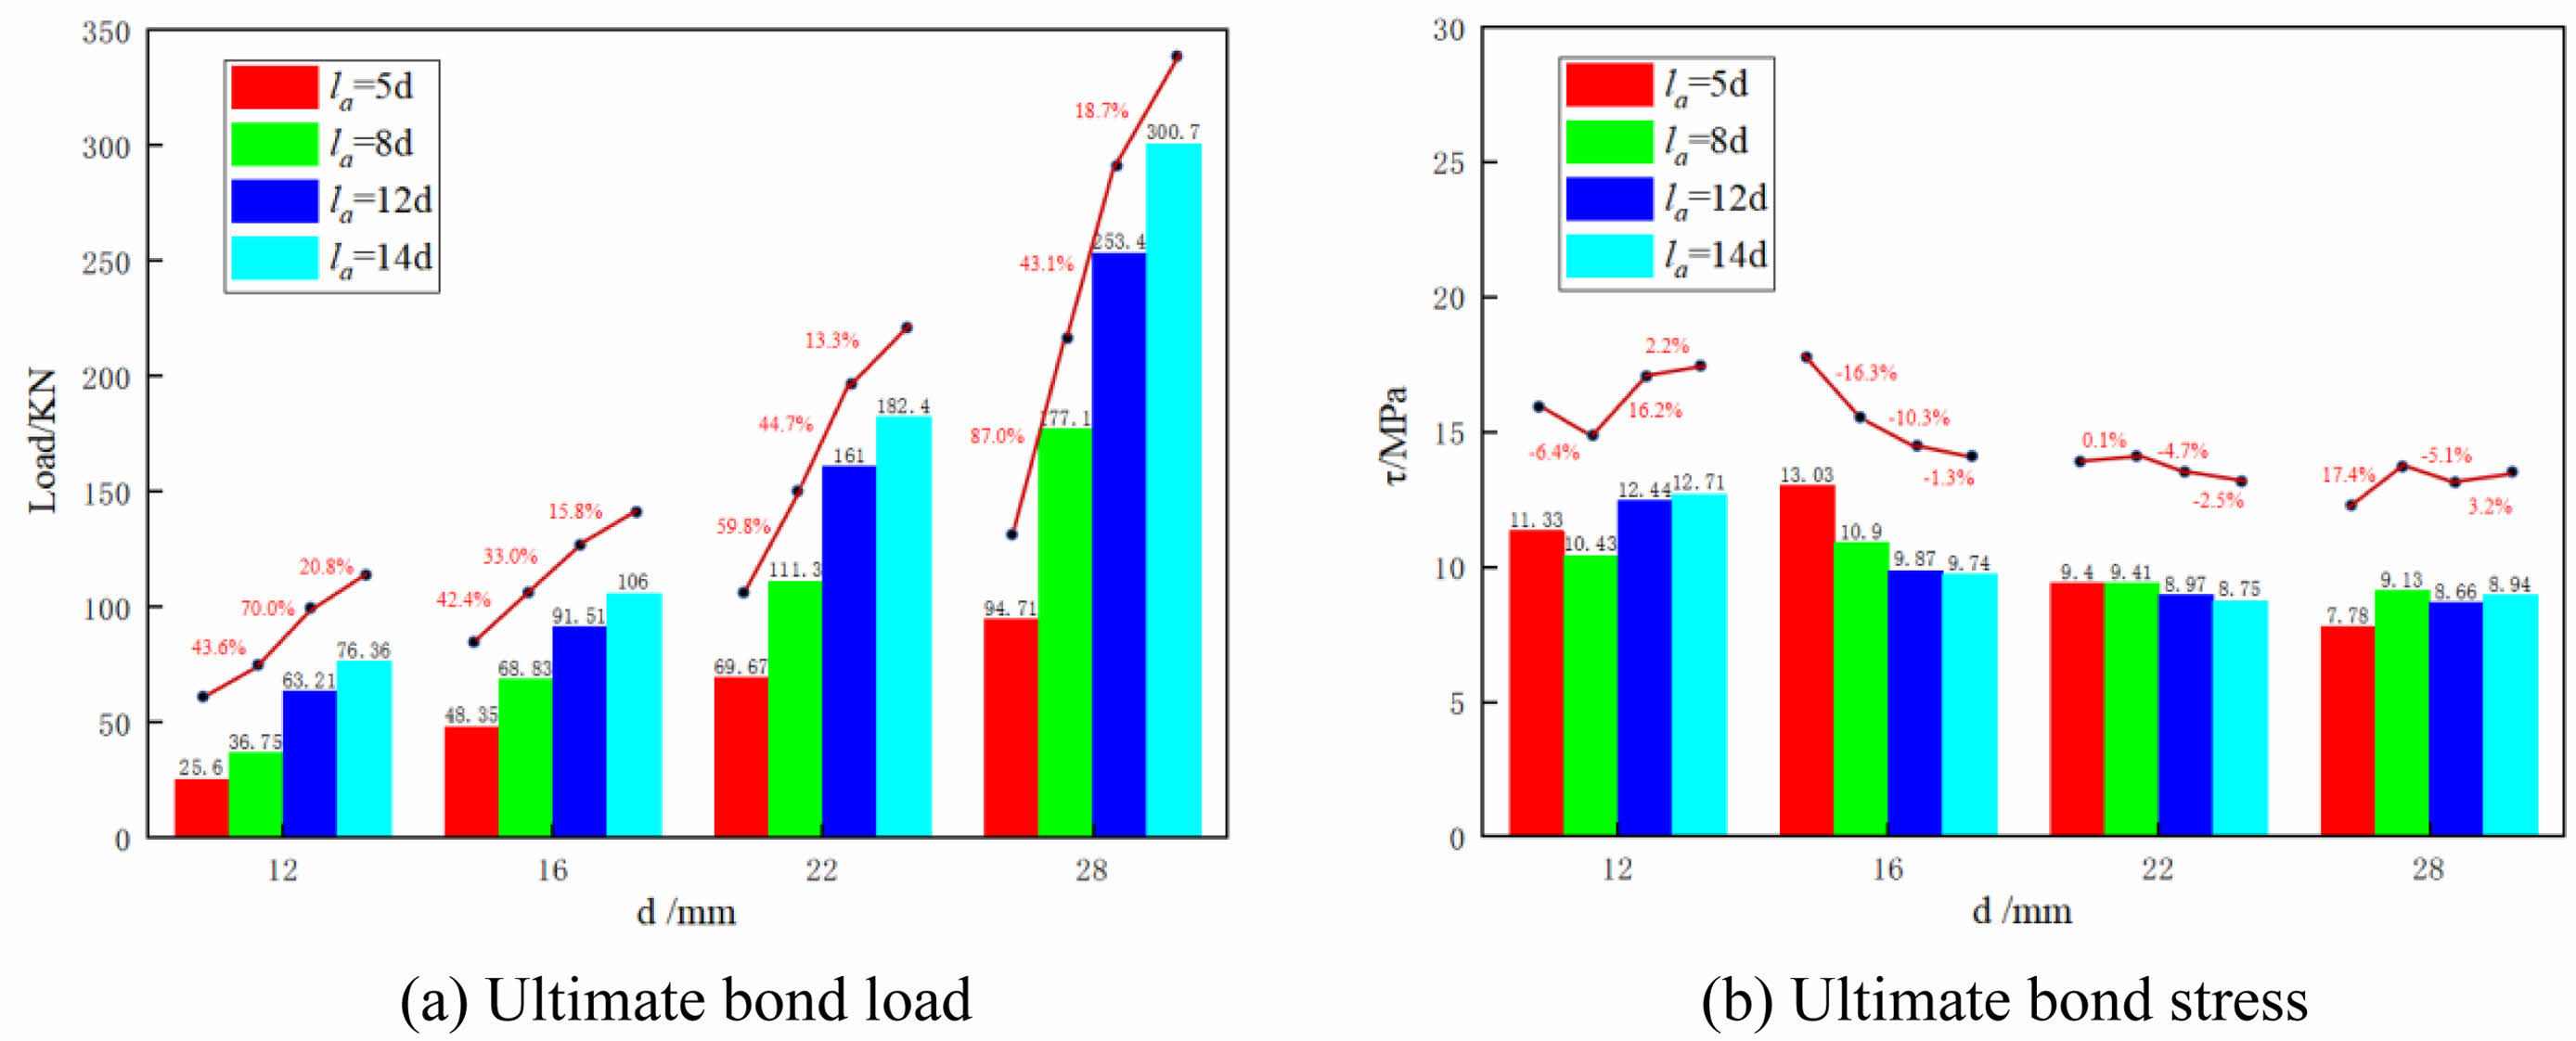
From the comparison of the ultimate bond loads of specimens with different bond lengths (Fig. 17a), it is evident that increasing the bond length enhances the ultimate bond load for specimens with different rebar diameters. Compared to specimens with la=5d, for each additional 1d of bond length, the growth values and proportions of ultimate bond load are 5.64 MPa (22.0%), 6.41 MPa (13.2%), 12.53 MPa (18.0%), 22.88 MPa (24.2%) respectively. It is noticeable that increasing the bond length has a better effect on enhancing the bond load for larger-diameter specimens.
By examining the ultimate bond stress graph of specimens with different bond lengths (Fig. 17b), it is observed that for specimens with a rebar diameter of d=12 mm, the ultimate bond stress increases gradually with the increase in bond length. Each additional 1d of bond length results in an average increase of 1.3% in the ultimate bond stress. In specimens with d=16 mm, each additional 1d of bond length leads to a decrease of 2.8% in the ultimate bond stress. For specimens with d=22 mm, an increase of 1d in bond length results in a decrease of 0.7% in the ultimate bond stress, which is much less significant than that of specimens with d=16 mm. This is because specimens with d=12 mm are in a shallow burial state, where the bonding performance is fully utilized, hence increasing the bond length enhances the ultimate bond stress. However, for specimens with d=28 mm, the ultimate bond stress remains largely unchanged. This is due to the large diameter of the rebar causing the specimen to fail mainly through concrete splitting based on uneven stress distribution, leading to severe interface destruction upon specimen failure, thus the bonding performance is not fully realized.
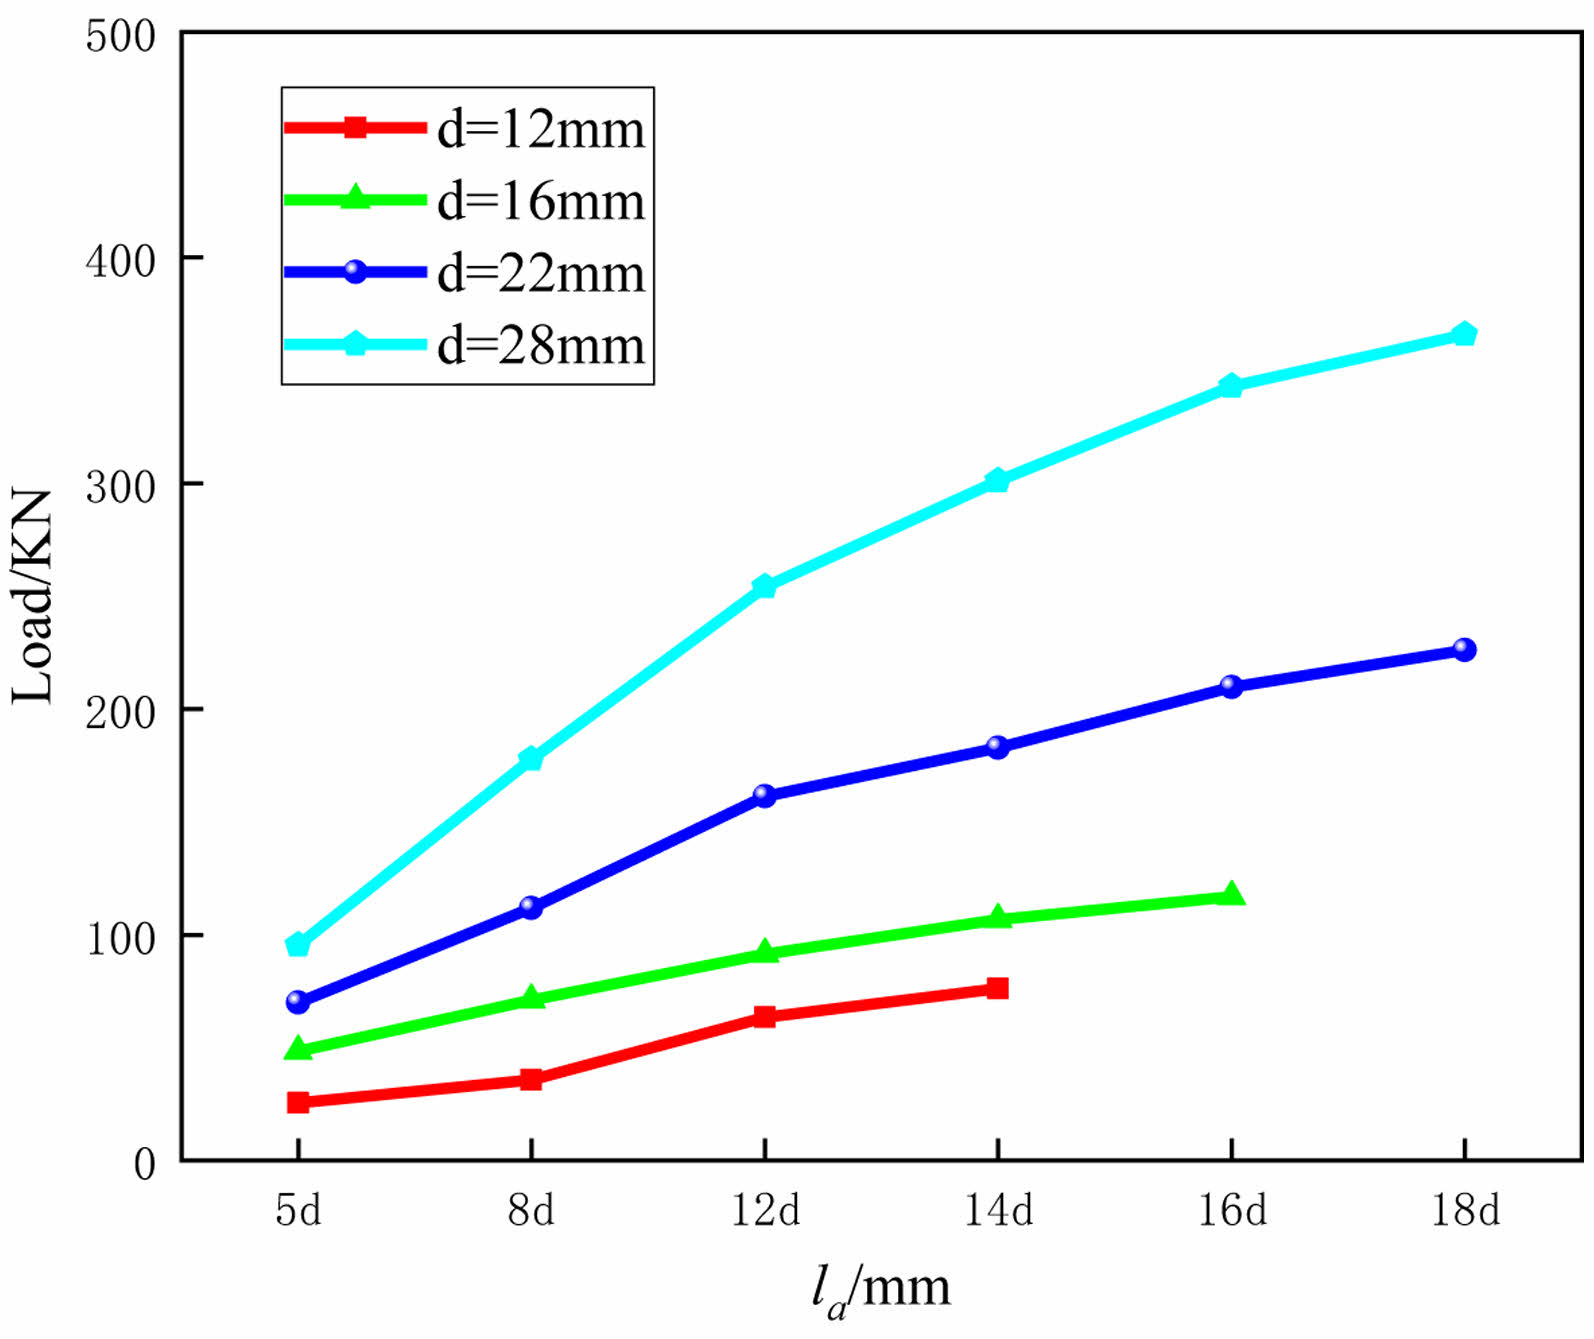
In summary, with the gradual increase in bond length, the bonding performance between epoxy-coated rebars and high-strength concrete will correspondingly improve, thereby providing more anchorage load. However, when the bond length value becomes excessively large, the bond strength between the rebar and concrete exceeds the tensile strength of the rebar. During the pullout process, the rebar will experience premature fracture failure, preventing the full utilization of the bonding performance between the rebar and concrete. Considering the ultimate bond load values of various specimens from experimental and parametric analyses (see Fig. 18), it is recommended that the minimum bond length for direct anchorage specimens of epoxy-coated rebars and high-strength concrete be as follows: when the d=12 mm, the value should not be less than 14d; when the d=16 mm, the value should not be less than 16d; when the d=22 mm, the value should not be less than 18d; and when the d=28 mm, the value should not be less than 18d.
|
Fig. 12 Mises stress graphs of reinforcement under ultimate state for different specimens. |
|
Fig. 13 Concrete damage graphs under ultimate state for different specimens. |
|
Fig. 14 Load-displacement curves for specimens with different rebar diameters. |
|
Fig. 15 Load-displacement curves for specimens with different bond lengths. |
|
Fig. 16 Comparison of specimens with different rebar diameters. |
|
Fig. 17 Comparison of specimens with different rebar bond lengths |
|
Fig. 18 Summary of ultimate bond load. |
Through conducting pull-out tests and parametric analysis of numerical models for epoxy-coated rebar-high strength concrete with different rebar diameters, bent forms, and bond lengths, the following conclusions were obtained:
The failure patterns of epoxy-coated rebar-high strength concrete specimens are primarily rebar pullout failure and concrete splitting failure. Their bond-slip curves consist of micro-slip, slip, smooth, and descending stages. For small-diameter, long-bond specimens, the rebar undergoes significant tension, resulting in higher ultimate bond strength and a tendency for rebar pullout failure. For large-diameter, short-bond specimens, the ultimate bond strength is lower, the concrete's anchorage force exceeds the rebar's tensile capacity, and concrete splitting failure is more likely.
Increasing the rebar diameter effectively enhances the anchorage capacity of epoxy-coated rebars, thereby increasing the specimens' relative ultimate load. For each 1mm increase in rebar diameter, the ultimate bond load can increase by 16.9% to 23.9%. However, the ultimate bond stress of the specimens tends to decrease with increasing rebar diameter, with an average reduction of 1.4% to 3.4%.
Increasing the rebar bond length can enhance the ultimate bond load of the specimens. For each 1d increase in bond length, the ultimate bond load can increase by 13.2% to 24.2%. For small-diameter specimens, the ultimate bond stress increases by an average of 1.3% with increasing bond length. For medium-diameter specimens, it decreases by an average of 0.7% to 2.8%, while for larger-diameter specimens, the ultimate bond stress remains largely unchanged.
Based on parametric analysis, the optimal bond length for direct anchorage specimens of epoxy-coated rebar-high strength concrete is recommended as follows: for rebar diameters less than 16 mm, the bond length should be greater than 16d; for rebar diameters greater than 16 mm, the bond length should be greater than 18d.
The authors would like to thank the financial support from the Future City Construction and Management Innovation Joint Research Center Leadership Funded Project (2024WHZ0220)and the General Project of the Shaanxi Provincial Natural Science Basic Research Program (2024JC-YBMS-383).
- 1. N. Etteyeb, L. Dhouibi, H. Takenouti, and E. Triki, Cem. Concr. Compos. 55 (2015) 241-249.
-

- 2. N. Etteyeb, L. Dhouibi, H. Takenouti, and E. Triki, Cem. Concr. Compos. 65 (2016) 94-100.
-

- 3. C. Zhang, Bulletin of the Chinese Ceramic Society 42[7] (2023) 2382-2391.
- 4. Z. Cheng, D. Song, J. Jiang, K. You, and A. Ma, Hot Working Technology 45[6] (2016) 14-19.
- 5. M. Harikaran, P. Kulanthaivelb, and A.R. Krishnaraja, J. Ceram. Process. Res. 24[2] (2023) 266-273.
-

- 6. M. Chaitanya and G. Ramakrishna, J. Ceram. Process. Res. 24[2] (2023) 257-265.
-

- 7. S. Sridhar, S. Nandhakumar, M. Nallusamy, and R. Maguteeswaran, J. Ceram. Process. Res. 23[4] (2022) 498-502.
-

- 8. K.M Senthilkumar, N. Kathiravan, L. Girisha, and M. Sivaperumal, J. Ceram. Process. Res. 23[4] (2022) 541-545.
-

- 9. S. Erdogdu, T.W. Bremner, and I.L. Kondratova, Cement Concrete Res. 31[6] (2001) 861-867.
-

- 10. H.Z. Lopez-Calvo, P. Montes-Garcia, I. Kondratova, T.W. Bremner, and M.D.A. Thomes, Mater. Corros. 64[7] (2013) 599-608.
-

- 11. P. Montes, T.W. Bremner, and I. Kondratova, Corrosion-US. 60[10] (2004) 974-981.
-

- 12. X. Zhou, H. Huang, R. Zhu, X. Sheng, D. Xie, and Y. Mei, Prog Org Coat. 136 (2019) 105200.
-

- 13. M. Cui, S. Ren, J. Pu, Y. Wang, H. Zhao, and L. Wang, Corros Sci. 159 (2019) 108131.
-

- 14. F.A. Aljahdali, F.F. Wafa, and S.A. Shihata, Special Publication. 149 (1994) 507-522.
-

- 15. R.F. CEB, Mater Struct. 6[2] (1973) 79-118.
- 16. W. Xue, Journal of Tongji University. 29[7] (2001) 769-773.
- 17. Y. Nie, Port and Waterway Engineering. 307[8] (1999) 25-32.
- 18. Y. Nie, X. Tao, Build. Sci. 16[1] (2000) 24-27+33.
- 19. O.C. Choi, H. Hadje-Ghaffari, D. Darwin, and S.L. Mccabe, ACI Mater. J. 88[2] (1991) 207-217.
- 20. Y. Huang, Y. Zhang, X. Li, and J. Ying, Structures 30[305] (2021) 866-876.
-

- 21. D.H. Nguyen, W.K. Hong, H.J. Ko, and S.K. Kim, Eng. Struct. 185 (2019) 141-158.
-

- 22. Y.H. Wang and X.H. Zhou, Mater Struct. 49[12] (2016) 5227-5241.
-

- 23. Y. Zhang, F. Fu, J. Zheng, and Y. Chen, Building Structure. 1-11.
- 24. Y. Ouyang, A.K.H. Kwan, S.H. Lo, and J.C.M Ho, Eng Struct. 148 (2017) 387-398.
-

- 25. Y. Ouyang and A.K.H. Kwan, Eng Struct. 156 (2018) 443-459.
-

- 26. Y. Xue and Z. Cai, Value Engineering. 42[29] (2023) 106-108.
- 27. S, Yin, Y. Li, and Y Liu, Journal of Basic Science and Engineering 31[1] (2023) 210-223.
- 28. GB/T 228.1-2010, Metallic materials—tensile testing—part 1: method of test at room temperature[S]. Standards Press. Beijing, China. 2010.
- 29. GB/T 50081-2019, Standard for test method of mechanical properties on ordinary concrete[S]. China Architecture Building Press. Beijing, China. 2019.
- 30. GB 50010-2010, Code for design of concrete structures[S].China Architecture Industry Press. Beijing, China. 2015.
- 31. R. Eligehausen, E.P. Popov, and V.V. Bertero, Calif. The Univ. (2016).
- 32. G.J. Morris, D.K. Bull, and B.A. Bradley, Con-ference Proceedings of the New Zealand Society of Earthquake Engi-neering. Rotorua,New Zealand. (2015).
-

- 33. JG/T502-2016, Epoxy resin coateel bars[S]. China Architecture Industry Press. Beijing, China. 2016.
- 34. M. Sun, Zhejiang University. (2015).
 This Article
-
2024; 25(4): 704-716
Published on Aug 31, 2024
- 10.36410/jcpr.2024.25.4.704
- Received on Jun 20, 2024
- Revised on Jul 19, 2024
- Accepted on Jul 31, 2024
 Services
- Abstract
introduction
pull-out test
finite element analysis
parameter analysis
conclusion
- Acknowledgements
- References
- Full Text PDF
Shared
 Correspondence to
- Tian Penggang
-
aSCEGC City of Future Scientific and Technological Innovation Co., Ltd. Xi'an, China
bSCEGC-XJTU Joint Research Center for Future City Construction and Management Innovation, Xi'an Jiaotong University, Xi'an, China
Tel : +86 13572193825 Fax: +86 029-88963533 - E-mail: tpg97537@163.com


 Copyright 2019 International Orgranization for Ceramic Processing. All rights reserved.