- Correlation between bending strength and porosity in vermiculite added ceramic bodies
Umut Önena,* and Tahsin Boyrazb
aMersin University, Metallurgical and Materials Engineering, Mersin, Türkiye
bSivas Cumhuriyet University, Metallurgical and Materials Engineering, Sivas, TürkiyeThis article is an open access article distributed under the terms of the Creative Commons Attribution Non-Commercial License (http://creativecommons.org/licenses/by-nc/4.0) which permits unrestricted non-commercial use, distribution, and reproduction in any medium, provided the original work is properly cited.
In this study focused on the production, characterization and bending strength-porosity relationship of vermiculite-added floor tiles, porcelain and sanitary ware bodies. The materials used in this study are calcined vermiculite, quartz, clay, kaolin, feldspar and porcelain powder as ceramic raw materials. Calcined vermiculite was incorporated into the ceramic bodies at concentrations of 0.10% and 20% by weight, following a heat treatment at 1050°C for 1 hour. The mixtures underwent homogenization in alumina ball mills operating at 60 rpm for 24 hours and were subsequently shaped via uniaxial dry pressing at 100 MPa. The resulting pressed samples were then subjected to sintering at temperatures ranging from 1050 to 1150°C for 1 hour. Evaluation of the fabricated samples included analysis of microstructure using scanning electron microscopy (SEM), phase analysis via X-ray diffraction (XRD), and assessment of mechanical properties through 3-point bending tests. Additionally, physical properties such as percentage shrinkage, water absorption, porosity, and density were measured. The results demonstrated that higher concentrations of calcined vermiculite resulted in improvements in the properties of the ceramic bodies. After the characterization results, the bending strength-porosity relationship was examined. Correlation coefficient, t-test and p values were calculated. There is a strong negative correlation with the correlation coefficient at -0.898, -0.875 and -0.907 for floor tiles, porcelain and sanitary ware respectively.
Keywords: Floor tile, Porcelain, Sanitary ware, Vermiculite, Bending strength, Porosity, Correlation.
The term “vermiculite” originates from the Latin word “vermicularis,” meaning wormlike, due to the formation of curved, elongated, and twisted columns when crystals undergo sudden exposure to high temperatures. Vermiculite, a mineral resembling mica with sparkling flakes, belongs to the phyllosilicate group. It is generated through the weathering of biotite or phlogopite, as well as hydrothermal alteration processes. The composition of vermiculite primarily consists of SiO2 (37-42 wt%), MgO (14-12), Al2O3 (10-13), Fe2O3 (5-17), H2O (8-18), and FeO [1-3]. Research findings suggest that vermiculite holds promise as a building material and can serve as an aggregate in lightweight concrete and plaster due to its exceptional thermal, fire, and sound insulation properties. Notably, vermiculite exhibits low specific gravity, high flame and heat resistance, and a significant ion exchange capacity, rendering it valuable in various sectors including construction, agriculture, animal husbandry, and wastewater treatment [4-7].
Ceramic floor tiles are a popular choice in construction, serving both functional and aesthetic purposes. However, in buildings where occupants require thermal comfort, the technological aspect becomes crucial. It has been observed that ceramic tiles may lack sufficient thermal comfort in certain scenarios [8]. These tiles are essentially vitrified products resulting from the combination of clay, quartz sand, and feldspar, followed by heat treatment typically within the range of 1,150-1,180°C. Clays impart plasticity and dry strength to the tile body, with kaolin being a particularly significant industrial clay mineral. Feldspars serve as fluxing agents, lowering the sintering temperature by facilitating the formation of a liquid phase during firing. Quartz provides structural integrity to the tile body. Similar to the production processes of many ceramic materials, the manufacturing of ceramic floor tiles involves the use of clay, kaolin, feldspar, and quartz raw materials. Above 1000°C, a stable mullite phase forms within the ceramic bodies [8-13].
Porcelain is characterized by its notable technological attributes, including high mechanical strength, low water absorption, translucence, and durability [15-17]. It is a dense, fine-grained material that is typically nonporous and translucent, achieved through high vitrification during firing. Composed primarily of kaolin, quartz, and a feldspathic rock, porcelain undergoes firing at elevated temperatures. Its formulation typically consists of approximately 50% clay, 25% flux, and 25% filler. Porcelain serves various technical and artistic purposes, whether glazed or unglazed, and can transmit light to some extent. The manufacturing process involves sintering a mixture of clay, feldspar, and quartz at temperatures ranging from 1,200°C to 1,400°C, resulting in a glass-ceramic composite. Kaolinite in the clay imparts plasticity to the raw paste and acts as a precursor to mullite crystals. Feldspar acts as a fluxing agent, while quartz serves as a filler, contributing to the strength of unfired tiles. Fired porcelain bodies exhibit a microstructure consisting of coarse quartz grains bound by a finer matrix containing mullite crystals and a glassy phase [19-29]. Various studies have explored the effects of pure oxides such as MgO and TiO2, as well as industrial by-products like fly ash and ceramic waste, on porcelain compositions [30-34]. Ngayakamo and Park [35] suggest the potential use of Kalalani vermiculite as a raw material for manufacturing high-strength porcelain insulators.
Sanitary ware encompasses a range of clay-based objects traditionally used in bathroom facilities, including toilets, washbasins, pedestals, bidets, urinals, cabinets, and laundry facilities. Typically composed of clay, kaolin, feldspar, and quartz, along with minor additives, these goods are known for their high-gloss, stain-resistant surfaces suitable for bathroom and kitchen environments. The production process involves casting a slip made from these ingredients into plaster moulds to form a green body, which is then air-dried to achieve a smooth finish. Glazing is applied prior to firing at temperatures around 1200°C to create sanitary ware with minimal water absorption. Sanitary ware is classified under ceramic products and is considered cost-effective and durable in the long term, capable of withstanding loads exceeding 400 kg and offering excellent resistance to chemical attacks. The glossy surface properties of sanitary ware facilitate easy cleaning. Ceramic materials find extensive use across a wide range of industrial applications, from the manufacture of sanitary products to high-performance mechanical components, owing to their superior mechanical strength, chemical and thermal stability, and impermeability. Various pore-forming materials, including organic and thermal pore materials such as vermiculite, have been utilized in the production of sanitary bodies for controlled decomposition and volatilization, contributing to the desired porous structure [36-43].
Correlation analysis assesses the existence and strength of linear relationships between two variables, as indicated by the correlation coefficient. This coefficient ranges from -1 to 1, with negative values signifying a negative relationship, positive values indicating a positive relationship, and values nearing zero suggesting a weak relationship. Perfect correlation occurs when the coefficient is either 1 or -1. In the field of ceramics and materials science, correlation coefficient (r), along with t-tests and p-values, are commonly employed for various studies. These include investigating correlations between powder properties and sintering behaviours, phase transitions and luminescent properties, as well as crystalline phases and optical reflectance [44-46].
This study aims to assess the correlations between bending strength and porosity properties in ceramic bodies doped with vermiculite, specifically in floor tiles, porcelain, and sanitary ware. The correlation coefficient will quantify the degree and direction of the relationship between these quantitative variables, using the Pearson correlation coefficient due to the continuous nature of our data. Additionally, the significance of these correlations will be tested to determine their reliability and statistical validity.
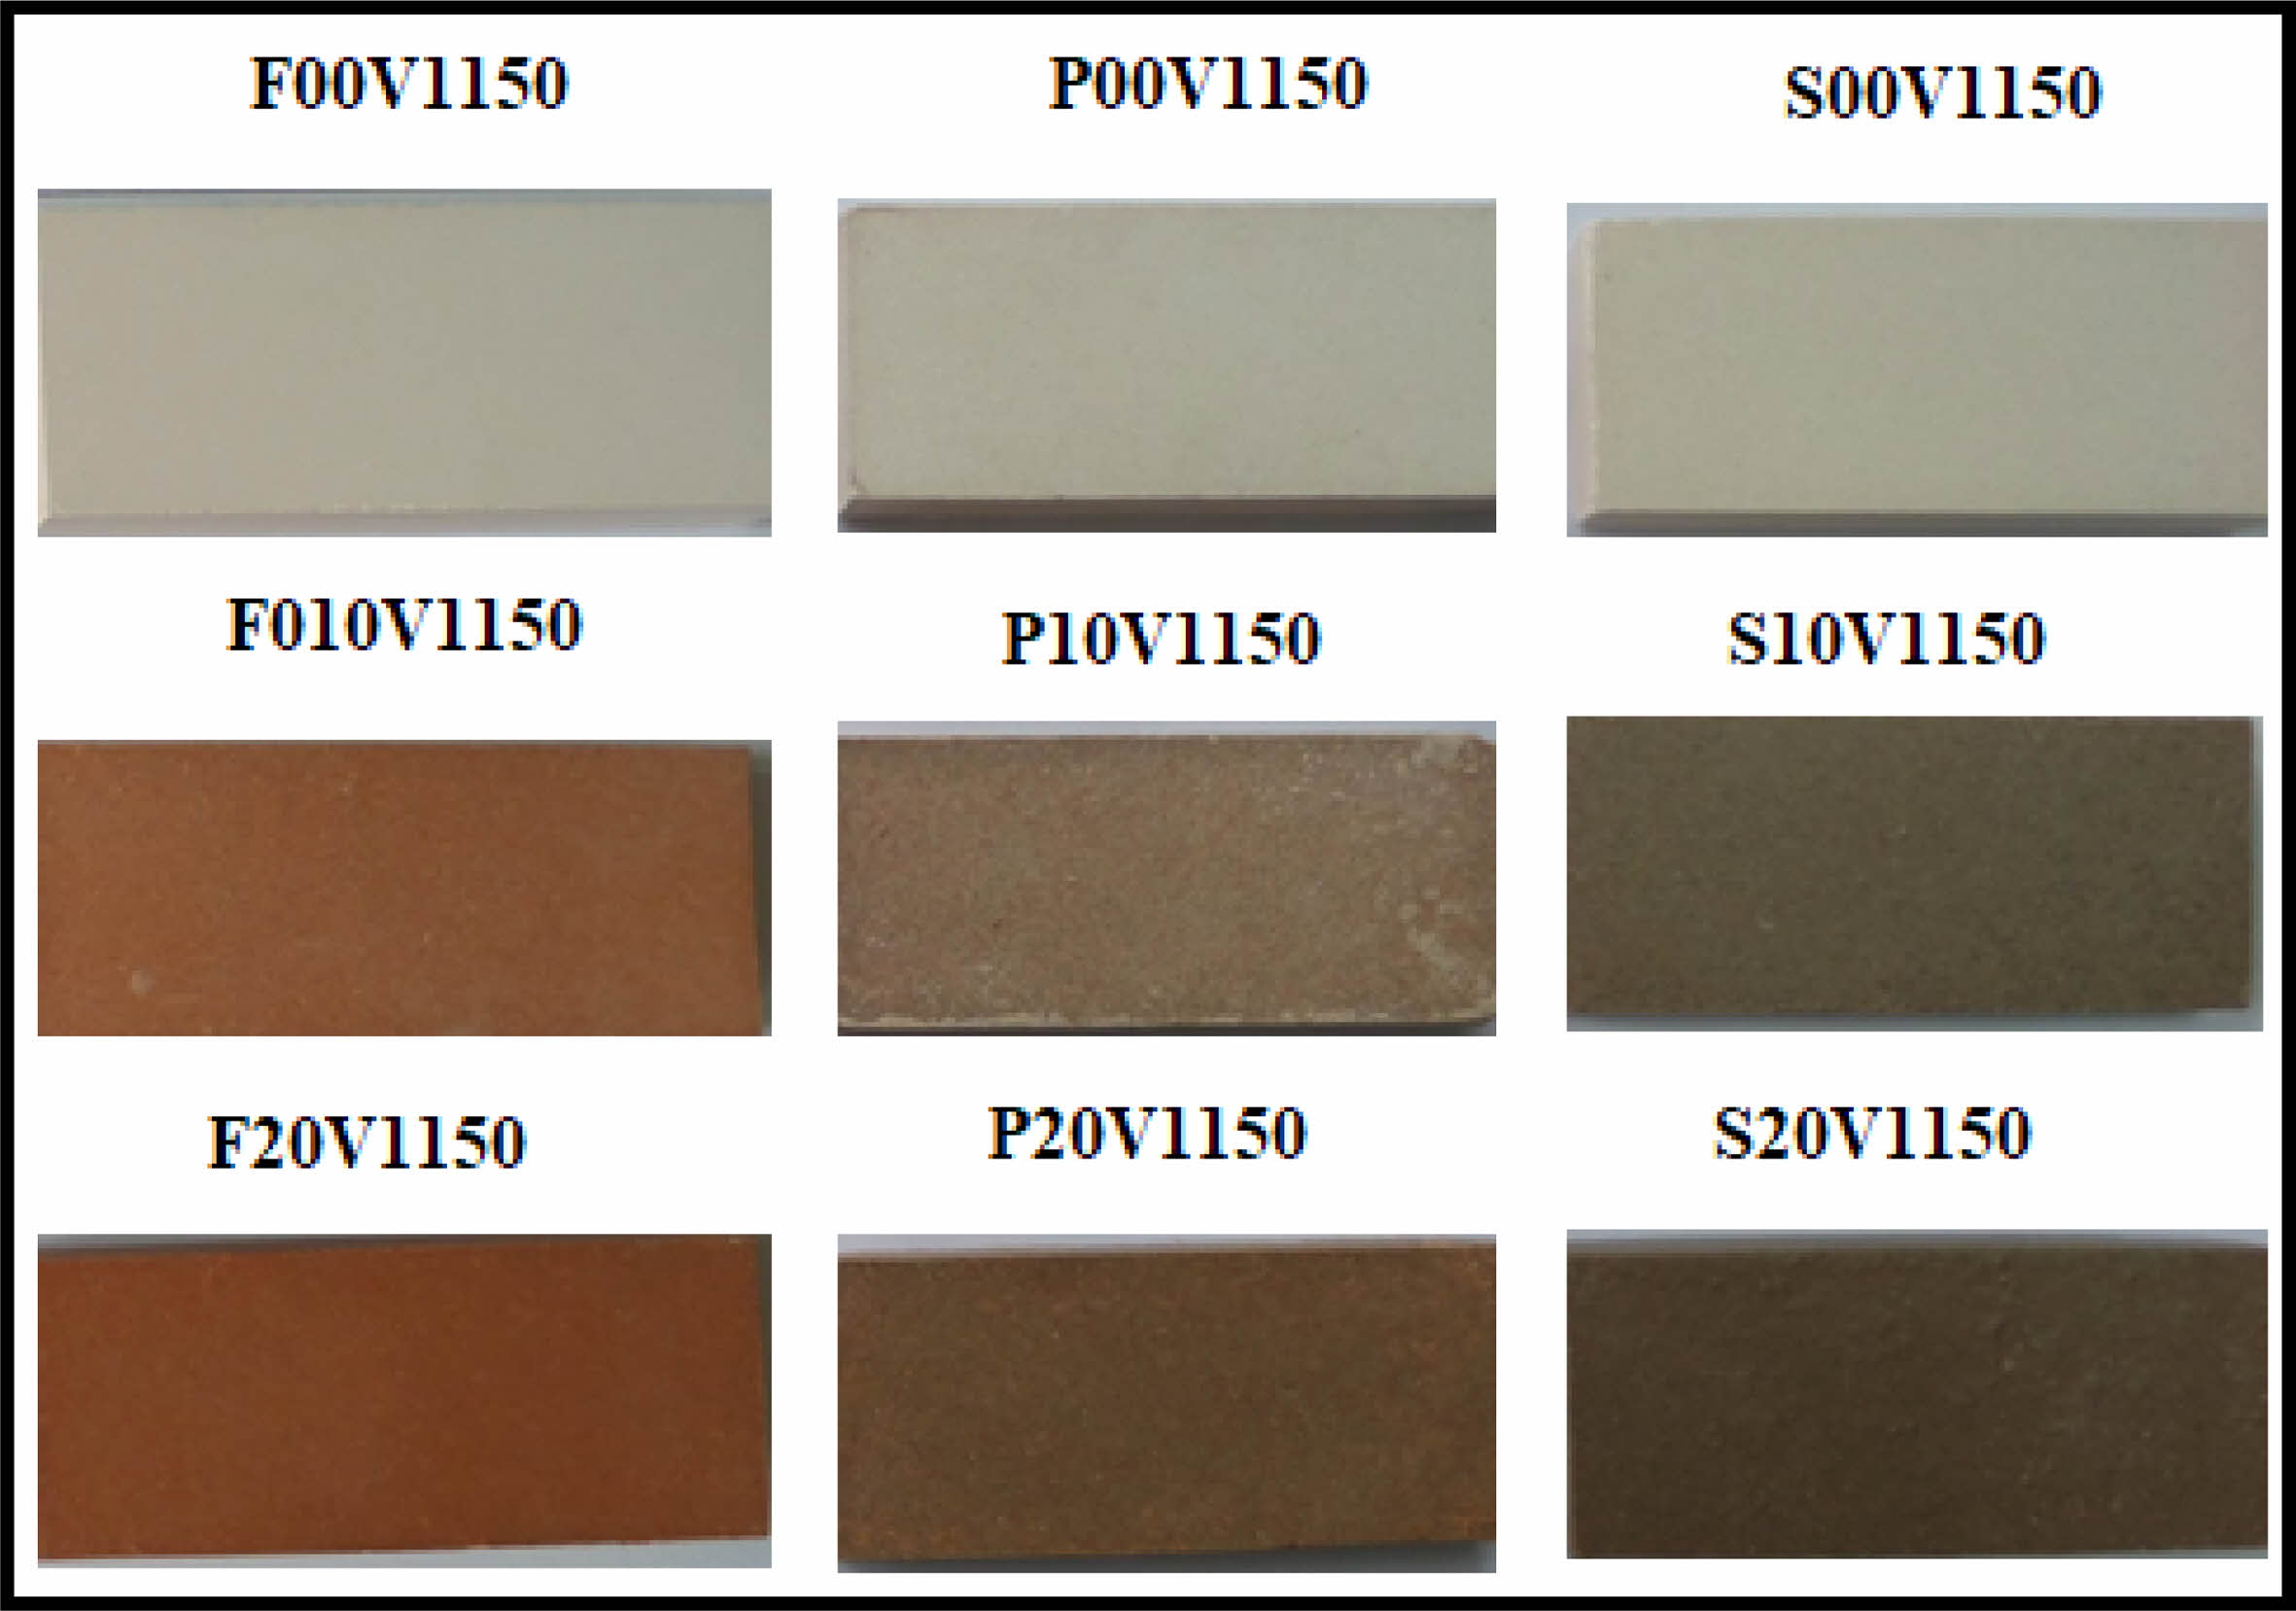
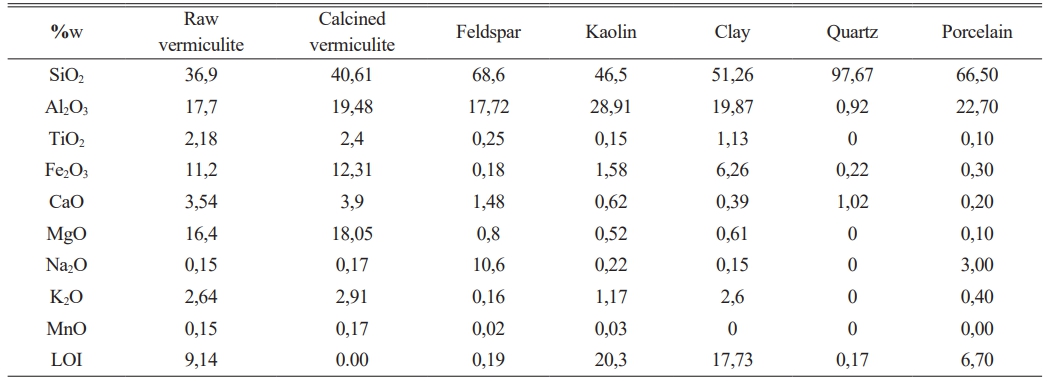
This study utilized various materials including calcined vermiculite, quartz, clay, kaolin, feldspar, and porcelain powder as ceramic raw materials. Through chemical analysis, a suitable composition was formulated for the production of floor tiles, porcelain, and sanitary ware commonly used in the ceramic industry. Raw vermiculite sourced from the Organic Mining region in Sivas, Turkey, underwent calcination at 1050°C for 1 hour in an electric furnace. Floor tile and sanitary ware compositions were prepared using recipes developed at the Ceramic Laboratory of Sivas Cumhuriyet University’s Department of Metallurgical and Materials Engineering, based on the ternary equilibrium diagram of kaolin-feldspar-quartz. Porcelain bodies were sourced from Refsan, Turkey. XRF analysis results for calcined and raw vermiculite, as well as ceramic powders, are presented in Table 1. Additionally, Fig. 1 depicts images of floor tiles, porcelain, and sanitary ware produced both with and without vermiculite additives, fired at 1150°C.
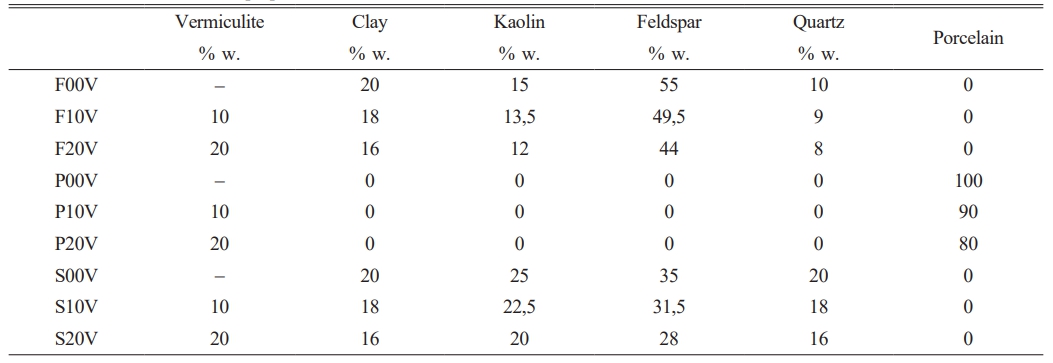
All mixtures were wet-mixed in alumina ball mills at the specified ratios detailed in Table 2, with a rotation speed of 60 rpm maintained for 24 hours. Calcined vermiculite was incorporated into floor tile (F), porcelain (P), and sanitary ware (S) bodies at concentrations of 0%, 10%, and 20% by weight to formulate the body compositions. Samples were labelled according to a specific coding system, such as F20V1150, where F represents Floor Tile, 20V denotes 20% vermiculite addition, and 1150 indicates a firing temperature of 1150°C. This coding system is outlined in Table 2. After homogenization in alumina ball mills for 24 hours at 60 rpm, the mixtures underwent drying in an oven and were then shaped into dimensions of 10×30×70 mm under a pressure of 100 MPa via uniaxial dry pressing. Subsequently, the prepared pressed samples were fired at temperatures of 1050°C, 1100°C, and 1150°C for a duration of 1 hour. Microstructure analysis (SEM), phase analysis (XRD), mechanical testing (hardness, 3-point bending), and evaluation of physical properties (% shrinkage, water absorption, porosity, and density) were conducted on the ceramic bodies of floor tiles, porcelain, and sanitary ware.
The sintered samples underwent % shrinkage measurement using a digital caliper, while density, porosity, and water absorption tests were conducted based on Archimedes’ principle. For the 3-point bending strength tests, a mechanical tester with a load sensitivity of 1 N and a capacity of 5 kN was utilized, with five measurements taken for each sample and averaged for strength values. Following a sanding process with 400, 800, 1200, and 2000 grid sandpapers, samples were polished on a velvet base using a 1 µm diamond solution for hardness testing. Hardness values were determined using a Vickers hardness tester with a square pyramid diamond tip under loads of 1 kg and 2 kg, with five measurements taken and averaged. X-ray analysis was performed in the range of 4⁰ to 70⁰ 2-theta using a Panalytical X’Pert Powder X-ray diffraction (XRD) Analyzer, and phase analysis was conducted using the Pananalytical X’Pert High Score program. Additionally, scanning electron microscopy (SEM) and energy dispersive spectrum (EDX) analysis were carried out using a Mira3XMU FE-SEM (Tescan, Czech Republic). The collected data were presented through graphs and tables, accompanied by relevant interpretations and discussions [18, 19, 21, 47, 48].
The Pearson correlation coefficient was employed for correlation analyses, and subsequently, a t-test was conducted to assess whether the correlation coefficient significantly deviated from zero. The significance of the correlation was determined by calculating a p-value based on the t-distribution table.
|
Fig. 1 Floor tile, porcelain and sanitary ware samples without additives, with 10% and 20% vermiculite added, fired at 1150℃. |
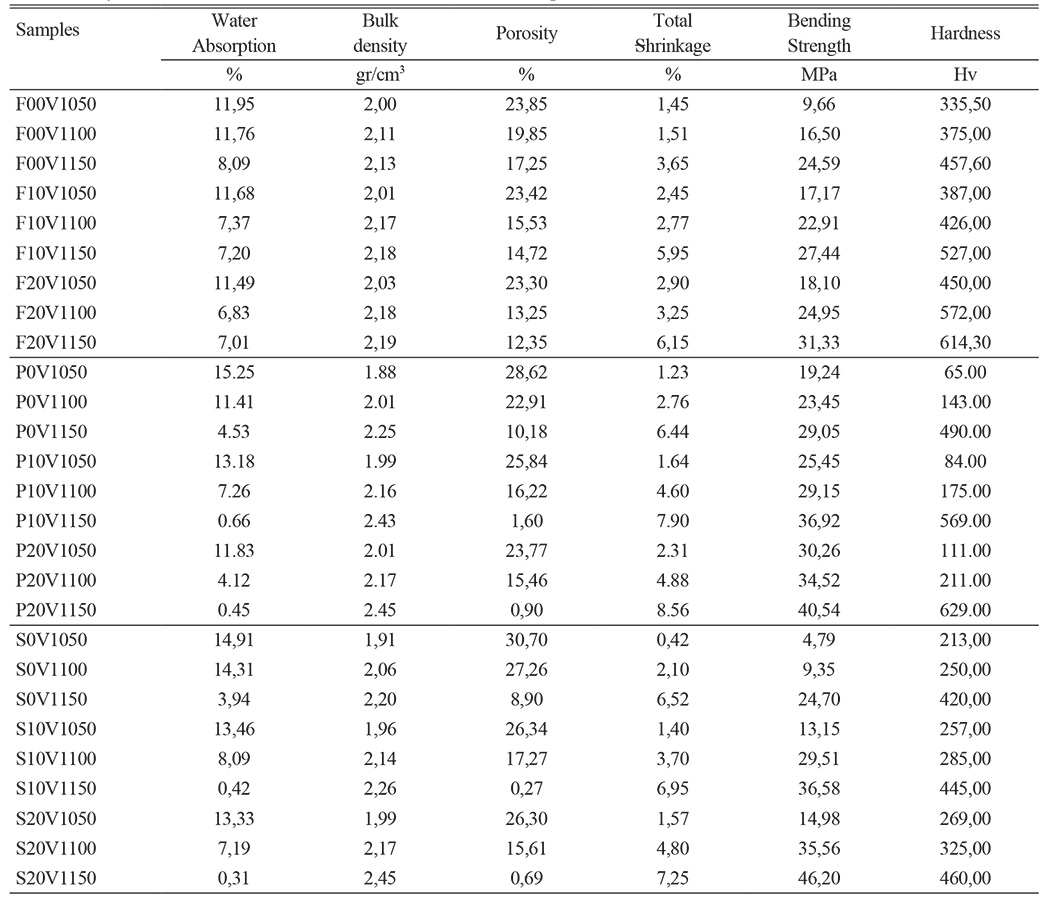
Table 3 presents the outcomes of physical and mechanical assessments, including water absorption, bulk density, porosity, and shrinkage. It was observed that as the sintering temperature increased, there was a rise in bulk density, shrinkage, and bending strength values, while porosity and water absorption values decreased. These trends were consistent across samples with vermiculite additions as well.
Referring to Table 3, it was observed that both the addition of vermiculite and the increase in sintering temperature resulted in an augmentation of % shrinkage in the ceramic bodies. For instance, in F00V1050 samples, the average shrinkage was recorded as 1.45%, while in F00V1150 samples, it increased to 3.65%. Similarly, in F20V1050 samples, the mean shrinkage was 2.90%, whereas in F20V1150 samples, it escalated to 6.15%. Analogously, in P0V1050 samples, the average shrinkage was 1.23%, which surged to 6.44% in P0V1150 samples. Likewise, the mean shrinkage of P20V1050 samples was 2.31%, whereas it rose to 8.56% in P20V1150 samples. Moreover, in S00V1050 samples, the average shrinkage was 0.42%, while in S00V1150 samples, it reached 6.52%. Similarly, the mean shrinkage of S20V1050 samples was 1.57%, which increased to 7.25% in S20V1150 samples.
Table 3 displays the water absorption, bulk density, and porosity characteristics of the ceramic bodies, respectively. As the sintering temperature and vermiculite content increased in the ceramic samples, there was a noticeable decrease in water absorption and porosity rates, accompanied by an increase in bulk density in the sintered samples. For instance, in F00V1050 samples, the average water absorption was recorded at 11.95%, with a porosity of 23.85% and a density of 2.00 g/cm3, while in F00V1150 samples, these values decreased to 8.09% for water absorption, 17.25% for porosity, and increased to 2.13 g/cm3 for density. Similarly, in vermiculite-doped compositions such as F20V1050 samples, the average water absorption was 11.49%, with a porosity of 23.30% and a density of 2.03 g/cm3, while in F20V1150 samples, these values decreased to 7.01% for water absorption, 12.35% for porosity, and increased to 2.19 g/cm3 for density. This trend was also observed in P0V1050 samples, where the average water absorption was 15.25%, porosity was 28.62%, and density was 1.88 g/ cm3, contrasting with P0V1150 samples with values of 4.53% for water absorption, 10.18% for porosity, and 2.25 g/cm3 for density. Furthermore, in vermiculite-doped compositions like P20V1050 samples, the average water absorption was 11.83%, with a porosity of 23.77% and a density of 2.01 g/cm3, whereas in P20V1150 samples, these values decreased to 0.45% for water absorption, 0.90% for porosity, and increased to 2.45 g/cm3 for density. Similar trends were observed in S00V1050 samples, S00V1150 samples, S20V1050 samples, and S20V1150 samples.
According to Table 3, an increase in both the vermiculite content and sintering temperature of the ceramic samples correlates with an increase in their 3-point bending strength. For instance, in F00V1050 samples, the average bending strength was 9.66 MPa, whereas in F00V1150 samples, it increased to 24.59 MPa. Similarly, in vermiculite-doped compositions like F20V1050 samples, the average bending strength was 18.10 MPa, and in F20V1150 samples, it further rose to 31.33 MPa. Analogously, in P0V1050 samples, the average bending strength was 17.52 MPa, while in P0V1150 samples, it reached 24.70 MPa. Likewise, in vermiculite-doped compositions such as P20V1050 samples, the average bending strength was 30.26 MPa, and in P20V1150 samples, it increased to 40.54 MPa. Furthermore, in S00V1050 samples, the average bending strength was 4.79 MPa, whereas in S00V1150 samples, it reached 24.70 MPa. Similarly, in vermiculite-doped compositions like S20V1050 samples, the average bending strength was 14.98 MPa, and in S20V1150 samples, it surged to 46.20 MPa.
According to Table 3, an increase in both the vermiculite content and sintering temperature of the ceramic samples corresponds to an increase in their hardness. For instance, in F00V1050 samples, the mean hardness was 335.50 Hv, whereas in F00V1150 samples, it rose to 457.60 Hv. Similarly, in F20V1050 samples, the average hardness was 450.00 Hv, and in F20V1150 samples, it further increased to 614.30 Hv. Analogously, in P0V1050 samples, the mean hardness was 65 Hv, while in P0V1150 samples, it reached 490 Hv. Likewise, in P20V1050 samples, the average hardness was 111 Hv, and in P20V1150 samples, it surged to 629 Hv. Furthermore, in S00V1050 samples, the mean hardness was 213 Hv, whereas in S00V1150 samples, it reached 420 Hv. Similarly, in S20V1050 samples, the average hardness was 269 Hv, and in S20V1150 samples, it increased to 460 Hv.
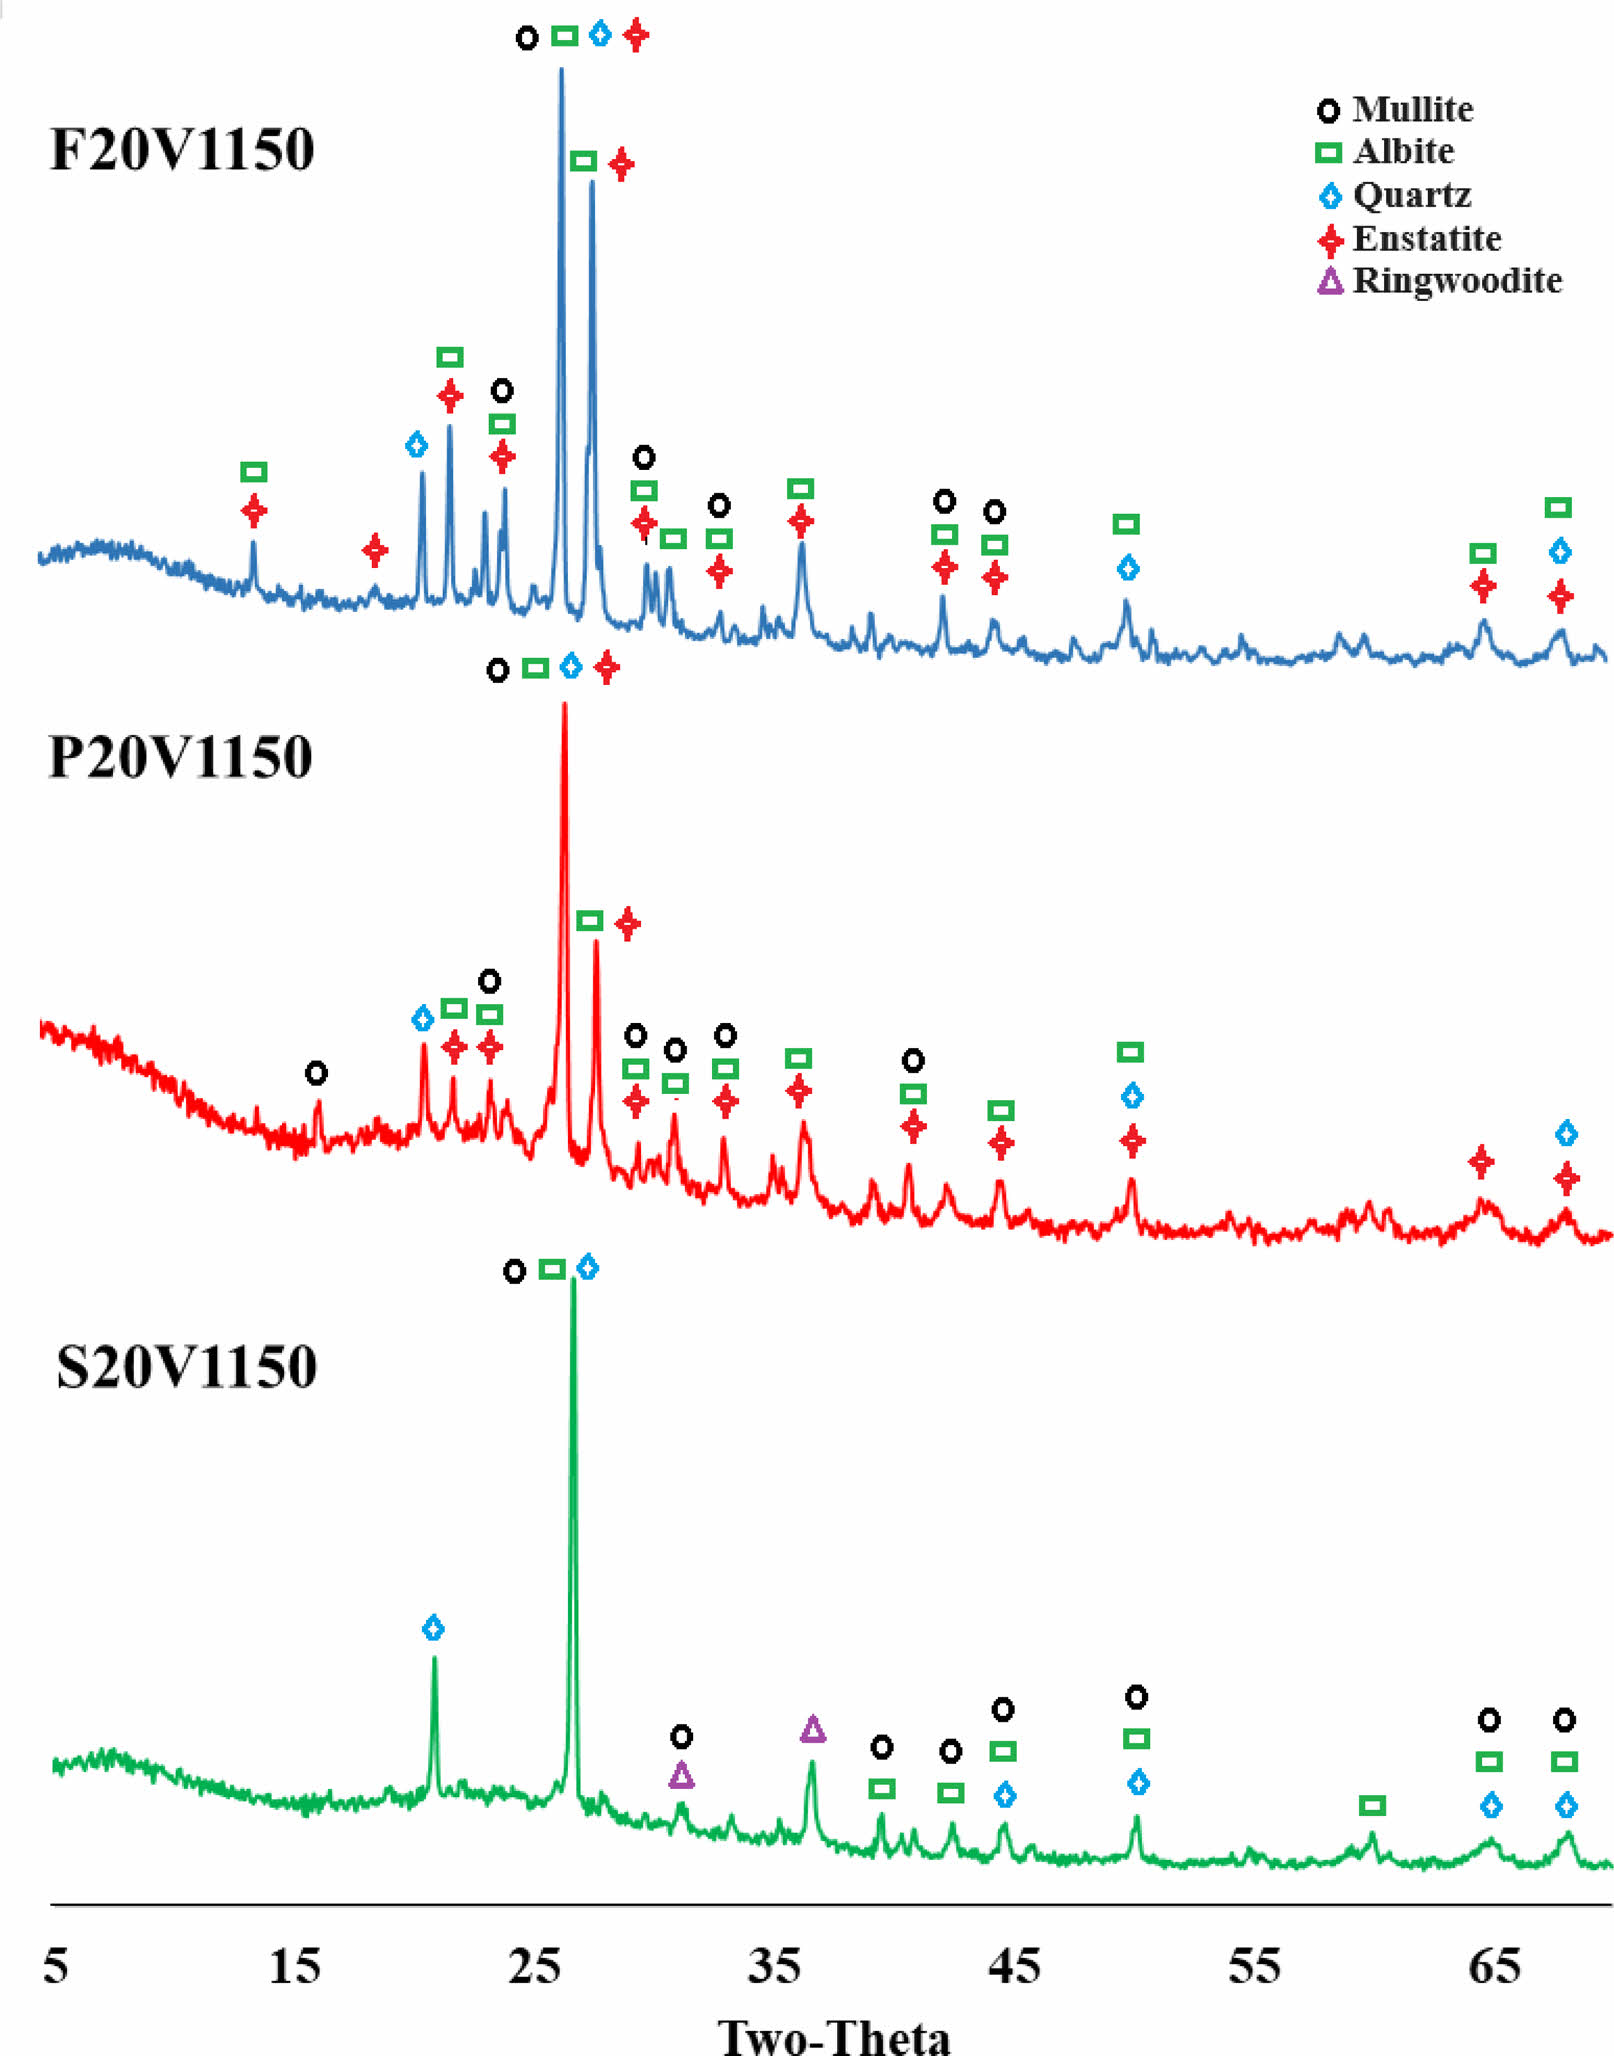
Figure 2 shows the XRD patterns of ceramic samples containing 20% vermiculite additive, sintered at 1150°C. In the samples labelled F20V1150 and P20V1150, phases of mullite, albite, quartz, and enstatite were identified. The presence of enstatite peaks can be attributed to the inclusion of vermiculite mineral. It is known that the formation of the enstatite phase within vermiculite mineral occurs at temperatures exceeding 1000℃. Additionally, in the sample coded S20V1150, phases of mullite, albite, quartz, and ringwoodite were detected. The crystallization of the ringwoodite phase, which is a magnesium silicate, is believed to be triggered by the presence of alkalis and iron oxide infiltrating the glassy structure and subsequently crystallizing as magnesium silicate [49-51].
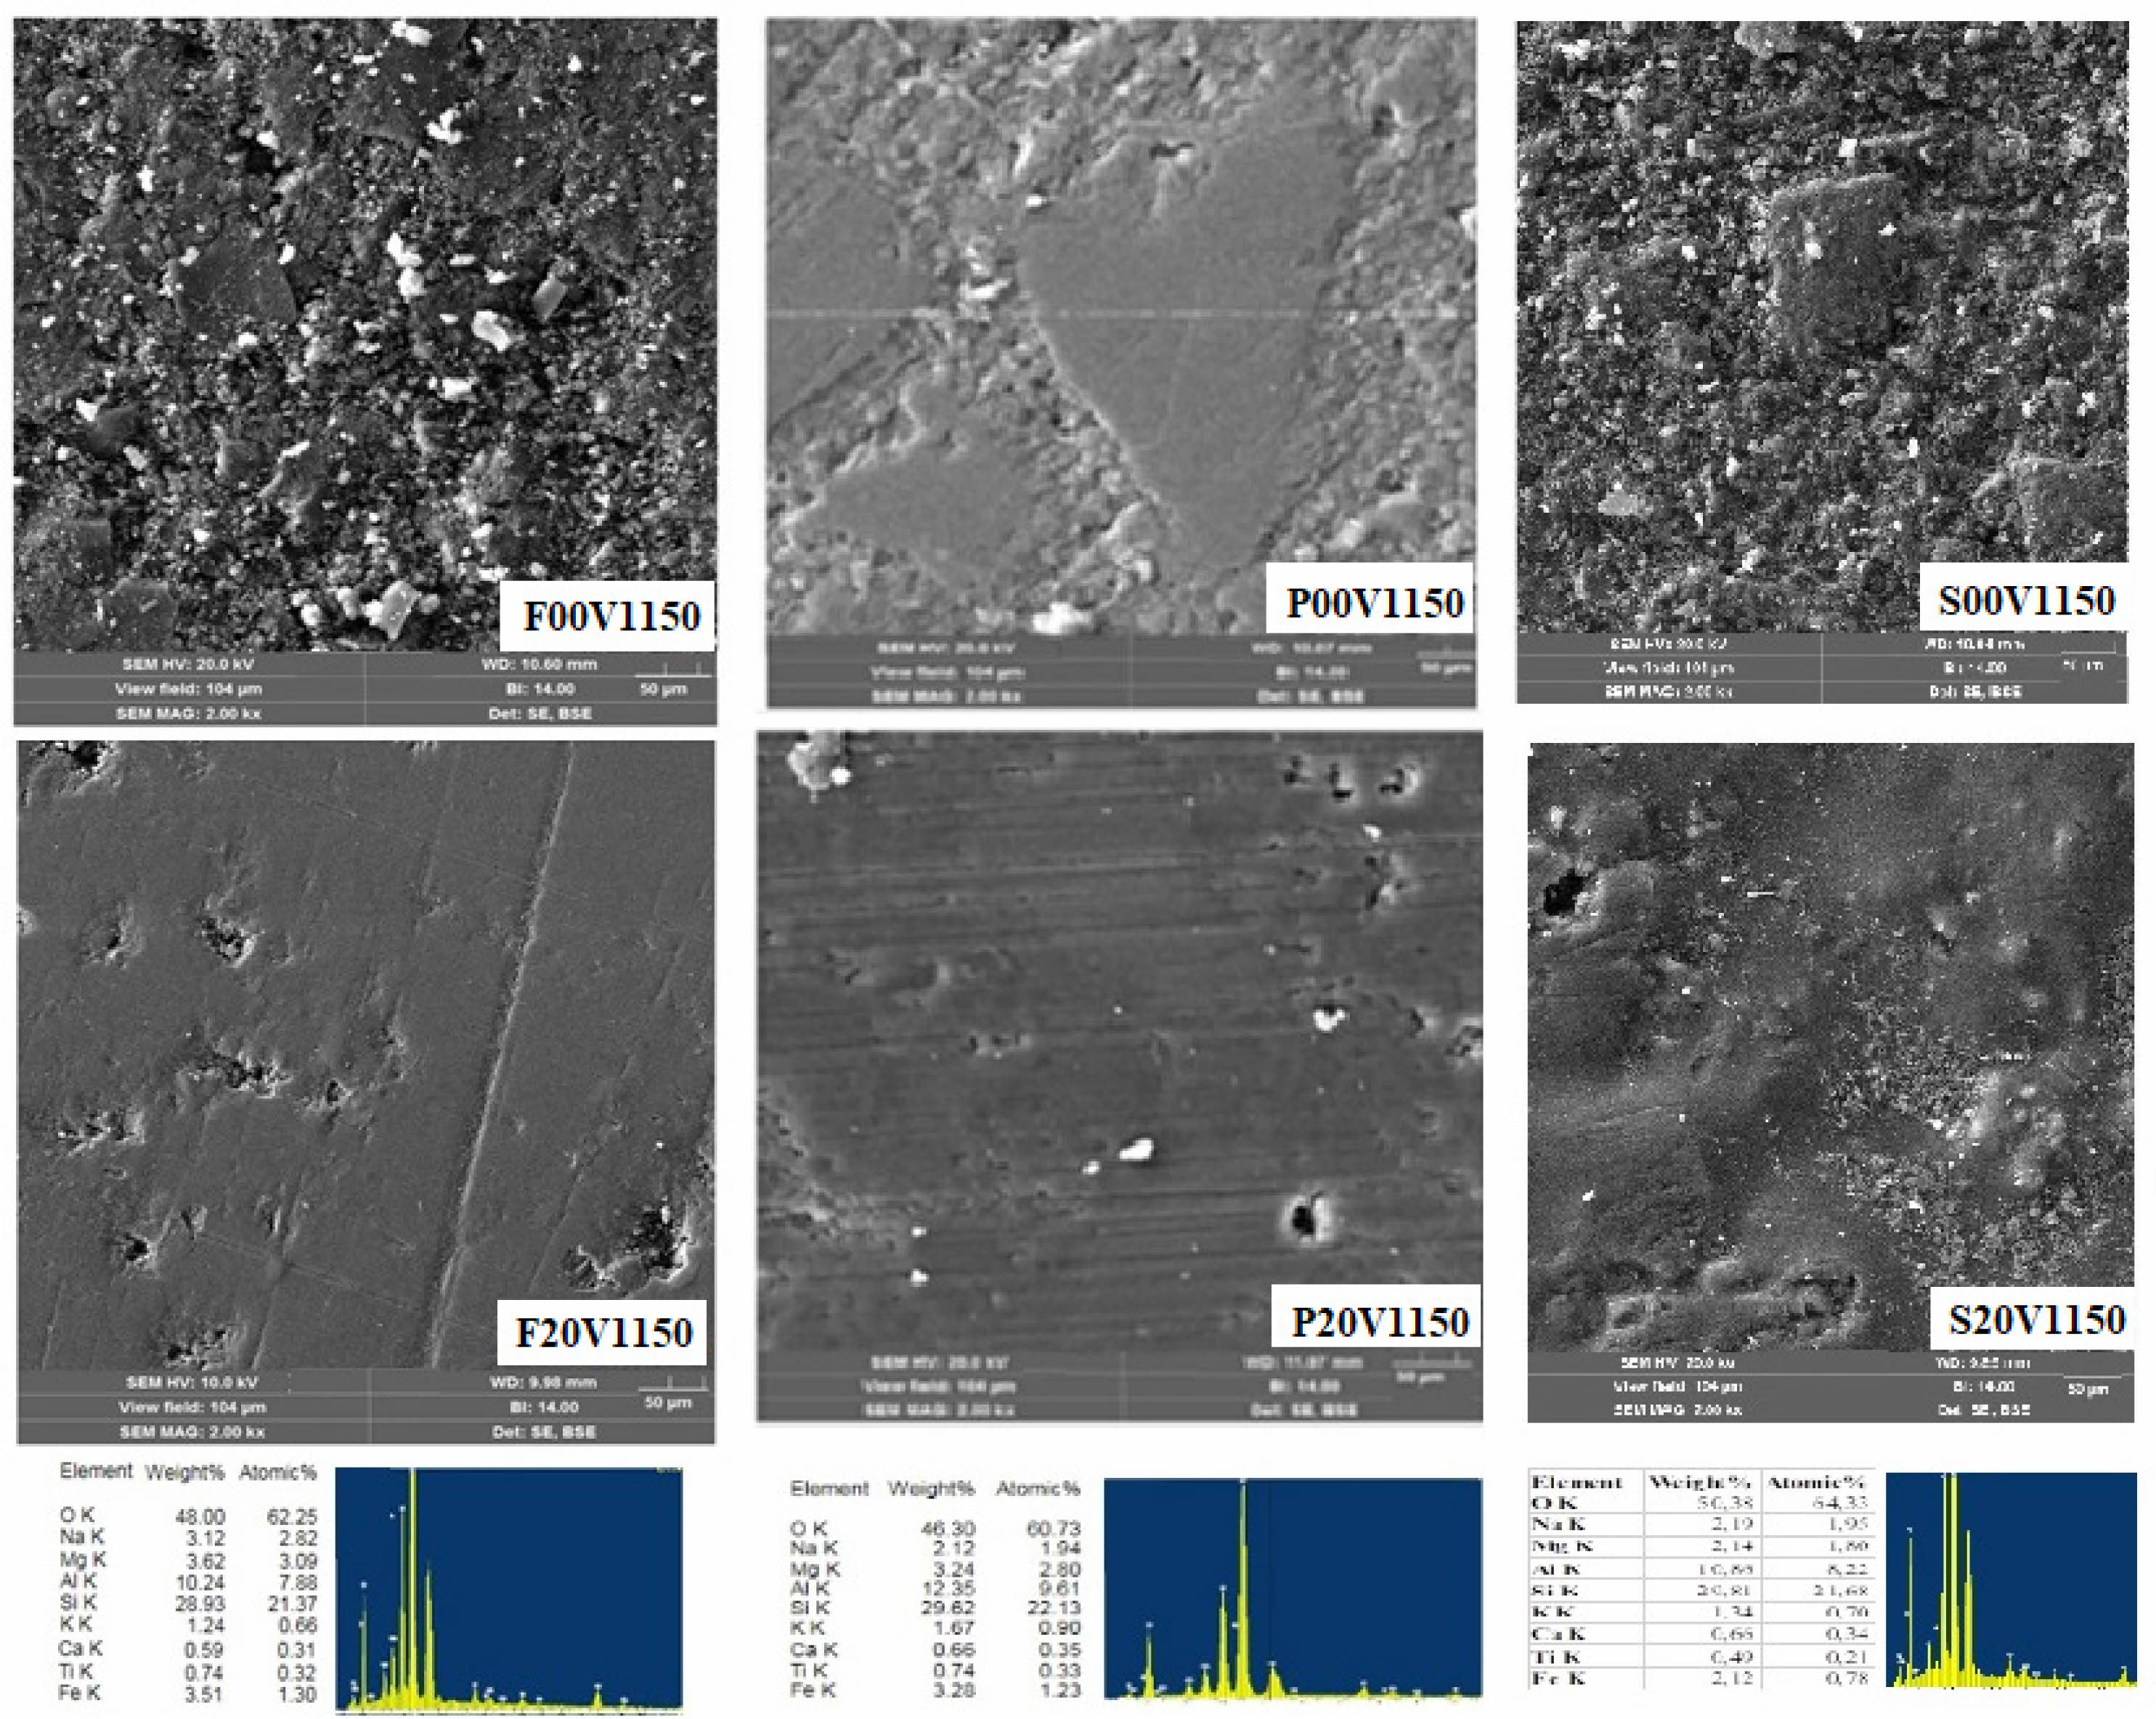
Figure 3 shows the SEM microstructure photographs and EDX analyses of %20 vermiculite additive ceramic samples sintered at 1150°C.
Pearson Correlation coefficient, t-test and p value
The objective of this research is to assess the correlations between the bending strength and porosity characteristics in ceramic bodies containing vermiculite additives. The correlation coefficient serves to quantify the degree of association between two quantitative variables, whether positive or negative. Given that our dataset comprises continuous variables, we will employ the Pearson correlation coefficient for analysis. Additionally, we will conduct significance tests to evaluate the robustness of these correlations. Finally, graphical representations will be generated to illustrate the findings.
Correlation examines whether there exists a linear association between two variables, indicating whether changes in one variable correspond with changes in another. The correlation coefficient quantifies this relationship, yielding a value between -1 and 1 through a specific formula. Negative coefficients denote an inverse relationship, while positive coefficients indicate a direct relationship. A perfect correlation occurs when the coefficient is either 1 or -1. Conversely, as the coefficient approaches 0, the strength of the relationship between the variables diminishes.
The Pearson correlation coefficient holds significant statistical relevance as it assesses the connection between two variables. Its aim is to establish a linear trend between the data points of these variables, portraying their relationship. The calculation of this relationship, conducted through Equation (1), can yield either a positive or negative value. A negative result indicates an inverse correlation between the variables, while a positive result signifies a direct correlation. Additionally, the results can indicate the strength of the linear relationship, such as strong positive correlation, strong negative correlation, moderate positive correlation, and so forth.
Pearson correlation coefficient (r):

N = number of point pairs
Σxy = sum of products of paired scores
Σx = sum of x scores
Σy = sum of y scores
Σx2 = sum of squared x scores
Σy2 = sum of squares of y scores
Whether the Pearson correlation coefficient is significantly different from zero based on the sample surveyed can be checked using a t-test. Here, r is the correlation coefficient and n is the sample size.

To ascertain the significance and validity of the Pearson correlation coefficient, a t-test is conducted based on the examined sample. This test determines whether the coefficient significantly differs from zero. Subsequently, a p-value is derived from the computed test statistic t. If the obtained p-value falls below the designated significance level, typically set at 5%, the null hypothesis is refuted; otherwise, it is retained.
In the context of a t-test, the conventional threshold for significance is typically set at p = 0.05. Essentially, the p-value represents the likelihood of observing a mean difference purely by chance, assuming there is no true disparity within the population. When the p-value obtained from a t-test is below 0.05, the result is deemed statistically significant. Conversely, if the p-value exceeds 0.05, the finding is considered insignificant. The p-value is derived from the t distribution table and is calculated as 2 times the probability of obtaining a value greater than the observed t statistic, where T follows a t distribution with degrees of freedom equal to n – 2.
The first step in conducting a scientific study (to test the accuracy of a hypothesis) is to create the set of hypotheses to be tested. This set of hypotheses has two components. The first is known as the Control or Null hypothesis (H0). This hypothesis always states that there is no difference between groups. The hypothesis that includes all other situations that the null hypothesis does not include is called Alternative or Opposite hypothesis (H1). Hypotheses can be expressed verbally or with symbols. In this study, the hypothesis was expressed verbally. Let’s plan a research with the idea that for the same material group, materials with more porosity may have lower bending strength than materials with less porosity. The set of hypotheses to be created in such a research is as follows;
-H0 (Control or Null hypothesis): For the same material group, bending strength values are equal in ceramic materials containing more porosity and ceramic materials containing less porosity or no porosity.
-H1 (Alternative or Opposite hypothesis): For the same material group, the bending strength of ceramic materials containing more porosity is lower than ceramic materials containing less porosity or no porosity.
In this correlation test, porosity-dependent bending strength test results obtained from the tests of floor tile, porcelain and sanitary ware samples described above were used. Pearson Correlation method was used as the method.
In the analysis of the difference between the strengths of ceramic materials with more porosity and ceramic materials with less porosity or no porosity, the p˂0.001 value is below the cut-off point of 0.05. Therefore, we can reject the H0 hypothesis, which states that there is no difference or equal.
In general, when the porosity and bending strength relationship results we obtained from the average of the experimental data of tiles, porcelain and sanitary ware are evaluated, the strength value decreases as the amount of porosity increases. According to these results, the H0 (null hypothesis) hypothesis, which states that the bending strength values are equal in ceramic materials containing more porosity and ceramic materials containing less porosity or no porosity for the same material group, is rejected.
In this case, the alternative or opposite hypothesis becomes important. We can say that the H1 (alternative or opposite hypothesis) hypothesis, that the bending strength of ceramic materials containing more porosity for the same material group is lower than ceramic materials containing less porosity or no porosity, supports the conclusion that the amount of porosity affects the bending strength.
Temperature increase has an effect directly proportional to the bending strength values of the ceramic materials produced and inversely proportional to the porosity values. This situation is also seen with the % vermiculite contribution. But the effect of temperature increase is greater. When we evaluated the correlation results, the correlation of temperature increase with bending strength and porosity was calculated to be higher than the % vermiculite increase (Table 4).
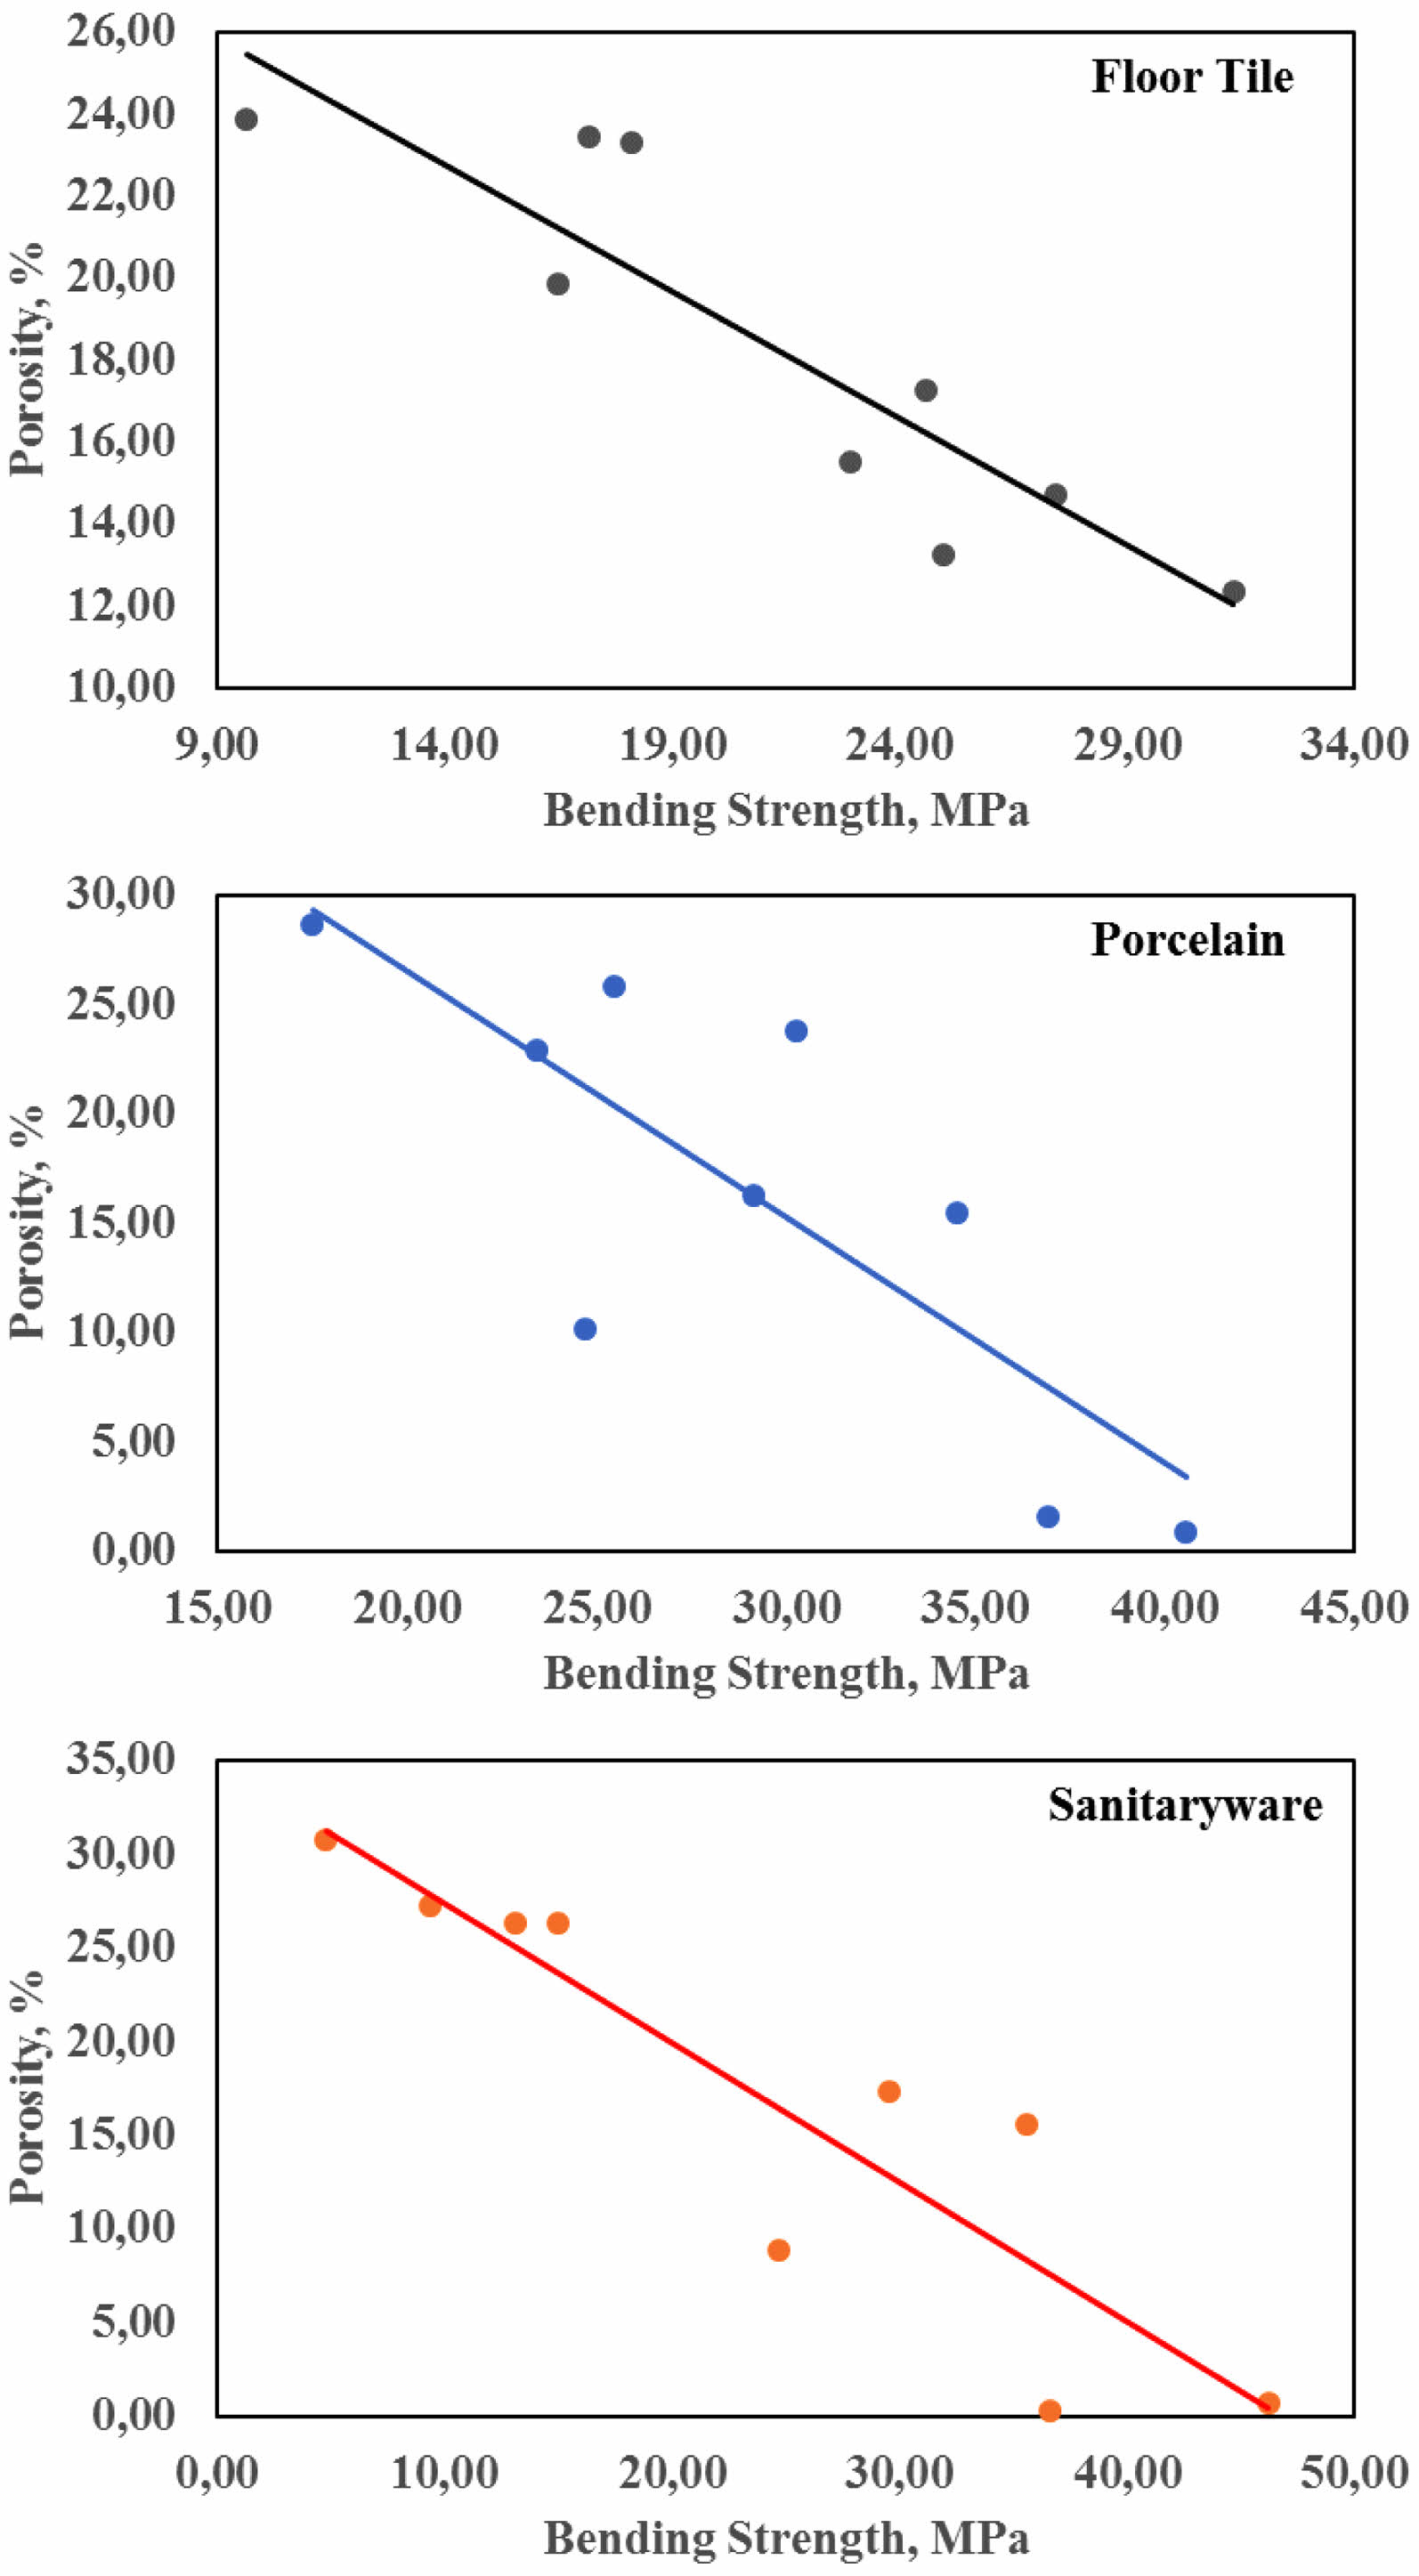
Later, correlation studies were conducted in which all data were evaluated together. A correlation coefficient of -0.898 was determined for floor tiles, -0.875 for porcelain, and -0.907 for sanitary ware (see Fig. 4). The negative slope indicates that as one variable increases, the other variable decreases, illustrating a negative linear relationship. This suggests that changes in one variable are inversely related to changes in the other variable.
When the correlation coefficient (r) exceeds 0.5 or falls below -0.5, it indicates that the data points closely align with the best-fit line, indicating a strong negative correlation. In this study, a strong negative correlation of -0.898, -0.875, and -0.907 was observed between the bending strength and porosity properties of vermiculite-enhanced floor tiles, porcelain, and sanitary ware ceramics, respectively. The calculated t-test values were -5.384, -4.781, and -5.692. Based on the t distribution table, the p-value was determined to be less than 0.001 for all three ceramic materials (refer to Table 5). Consequently, it has been established that there exists a robust negative association between 3-point bending strength and porosity in vermiculite-augmented ceramics.
|
Fig. 2 XRD patterns of %20 vermiculite additive ceramic samples sintered at 1150°C. |
|
Fig. 3 SEM-EDS images of non-additive samples and %20 vermiculite additive samples fired at 1150°C. |
|
Fig. 4 Bending strength-porosity correlation graphs of Floor tiles, Porcelain and Sanitary ware. |
In this investigation, the incorporation of vermiculite in the production of floor tiles, porcelain, and sanitary ware was examined, yielding favourable outcomes.
○ The findings demonstrated an escalation in bulk density, shrinkage, and bending strength values as the sintering temperature increased. Conversely, porosity and water absorption values declined with the elevation of sintering temperature, a trend also observed in vermiculite-added samples.
○ Additionally, the colour of sintered samples intensified from light to dark with higher levels of vermiculite and sintering temperatures.
○ Furthermore, the micro hardness values exhibited enhancement with the elevation of sintering temperature and the inclusion of vermiculite.
○ Phase analysis revealed the presence of mullite, albite, quartz, and enstatite in floor tile and porcelain samples, while mullite, albite, quartz, and ringwoodite phases were identified in sanitary ware samples.
○ The correlation of temperature increase with bending strength and porosity was calculated to be higher than the % vermiculite increase.
○ When all data were evaluated, a strong negative correlation of -0.898, -0.875 and -0.907 was observed between the flexural strength and porosity properties of vermiculite-infused floor tiles, porcelain and sanitary ware ceramics, respectively.
○ The calculated t-test values were -5.384, -4.781, and -5.692, with the corresponding p-values found to be less than 0.001 for all ceramic materials.
○ Consequently, it was established that a robust negative relationship exists between 3-point bending strength and porosity in vermiculite-added ceramics.
The authors declare that they have no known competing financial interests or personal relationships that could have appeared to influence the work reported in this paper.
- 1. S.A. Suvorov and V.V. Skurikhin, Refrac. Indust. Ceram. 44[3] (2003) 186-193.
-

- 2. A. Anitha, V.G. Kalpana, and P. Muthupriya, J. Ceram. Process. Res. 24[1] (2023) 182-189.
-

- 3. A.M. Rashad, Const. Build. Mater. 125 (2016) 53-62.
-

- 4. U. Önen, E. Ercenk, and Ş. Yılmaz, Acta Phys. Pol. A 131 (2017) 168-170.
-

- 5. V. Spirina and M. Flerova, Refractories 16[3] (1975) 201-203.
-

- 6. S. Suvorov and V. Skurikhin, Refrac. Indust. Ceram. 43[11] (2002) 383-389.
-

- 7. C.N. Silva Jr, P.M. Pimentel, R.M.P.B. Oliveira, D.M.A. Melo, and J.E.C., Silva, J. Ceram. Process. Res. 15[5] (2014) 360-365.
-

- 8. C. Effting, S. Güths, and O.E. Alarcon, Mater. Research, 10[3] (2007) 301-307.
-

- 9. N.T. Selli, J. Ceram. Process. Res. 21[6] (2020) 632-639.
-

- 10. W.M. Carty and U. Serapati, J. Am. Ceram. Soc. 81[1] (1998) 3-20.
-

- 11. K.N. Maiti, C.S. Prasad, K.C. Singh, and A.K. Gupta, Trans. Ind. Ceram. Soc. 50[1] (1991) 18-22.
-

- 12. I. Tatar, N. Ediz, and A. Aydn, J. Ceram. Process. Res. 16[1] (2015) 81-88.
-

- 13. A. Tunali, J. Ceram. Process. Res. 15[4] (2014) 225-230.
-

- 14. S.F. Djenabou, F.C. Gentry, and P.D. Ndjigui, J. Ceram. Process. Res. 23[2] (2022) 113-120.
-

- 15. W.M. Carty and U. Senapati, J. Amer. Ceram. Soc. 81[1] (1998) 3-20.
-

- 16. Y. Iqbal and W.E. J. Lee, Amer. Ceram. Soc. 82[12] (1999) 3584-3590.
-

- 17. W.D. Kingery, H.K. Bowen, and D.R. Uhlmann, in ‘‘Introduction to Ceramics’’ (Wiley PubliS., 1976).
-

- 18. F.H. Norton, in ‘‘Fine Ceramics: Technology and Applications’’ (Krieger Publis. 1978)
- 19. T. Boyraz and A. Akkus, J. Ceram. Process. Res. 22[2] (2021) 226-231.
-

- 20. A. Akkus and T. Boyraz, J. Ceram. Process. Res. 20[1] (2019) 54-58.
-

- 21. O. Turkmen, A. Kucuk, and S. Akpinar, Ceram. Inter. 41[4] (2015) 5505-5512.
-

- 22. M. Saclı, U. Onen, and T. Boyraz, Acta Phys. Polon. A. 127[4] (2015) 1133-1135.
-

- 23. S.Y.R. Lopez, J.S. Rodriguez, and S.S. Sueyoshi, J. Ceram. Process. Res. 12[3] (2011) 228-232.
-

- 24. J. Martin-Marquez, A.G. De la Torre, M.A.C. Aranda, J.M. Rincon, and M. Romero, J. Am. Ceram. Soc. 92[1] (2009) 229-234.
-

- 25. H. Yildizay, J. Ceram. Process. Res. 24[2] (2023) 237-241.
-

- 26. Z.B. Ozturk, J. Ceram. Process. Res. 17[6] (2016) 555-559.
-

- 27. Ç. Koca, N. Karakus, N. Toplan, and H.Ö. Toplan, J. Ceram. Process. Res. 13[6] (2012) 693-698.
-

- 28. F.A. Firat, E. Ercenk, and S. Yilmaz, J. Ceram. Process. Res. 13[6] (2012) 756-761.
-

- 29. S. Wanga, X. Qib, J. Hua, and X. Tiana, J. Ceram. Process. Res. 16[3] (2015) 361-365.
-

- 30. D. Gouvêa, T.T. Kaneko, H. Kahn, E. de Souza Conceição, J.L. Antoniassi, Ceram. Inter. 41[1] (2015) 487-496.
-

- 31. S.G.D. Iya, M.Z. Noh, S.N. Ab Razak, N. Sharip, and N.A.A. Kutty, Inter. J. Nanoelectronics Mater. 12[2] (2019).
-

- 32. M. Tarhan and B. Tarhan, T. Aydin, Ceram. Inter. 42[15] (2016) 17110-17115.
-

- 33. Z. Xian, L. Zeng, X. Cheng, and H. Wang, J. Ther. Analy. Calor. 122[2] (2015) 997-1004.
-

- 34. A. Shui, X. Xi, Y. Wang, and X. Cheng, Ceram. Inter. 37[5] (2011) 1557-1562.
-

- 35. B. Ngayakamo and S. Park, Sci. of Sinte. 51[2] (2019).
-

- 36. S.Y.R. López and J.S. Rodríguez, J. Ceram. Process. Res. 16[1] (2015) 162-168.
-

- 37. S.Y.R. López, J.S. Rodríguez, and S.S. Sueyoshic, J. Ceram. Process. Res. 14[4] (2013) 492-497.
-

- 38. A. İssi, N.D. Coşkun, V. Tiryaki, and V. Uz, J. Aust. Ceram. Soc. 53[1] (2017) 157-162.
-

- 39. F. Knies, K. Schrantz, C. Aneziris, L. Gauckler, and T. Graule, J. Ceram. Sci. Tech. 7[1] (2016) 53-64.
-

- 40. S. Kurama and H. Sari, J. Aust. Ceram. Soc. 55[3] (2019) 623-632.
-

- 41. E. Martini, A. Pavese, D. Tabacchi, D. Fortuna, and A. Fortuna, Cerâmica 67 (2021) 39-47.
-

- 42. K. Sasipriya, R. Suriyaprabha, P. Prabu, and V. Rajendran, Mater. Research 16[4] (2013) 824-830.
-

- 43. B. Tarhan, M. Tarhan, and T. Aydin, Ceram. Inter. 43[3] (2017) 3107-3112.
-

- 44. D.H. Prasada, J. Leea, H.W. Lee, B.K. Kim, and J.S. Park, J. Ceram. Process. Res. 11[5] (2010) 523-526.
-

- 45. J.H. Lee and Y.J. Kim, J. Ceram. Process. Res. 10[1] (2009) 81-84.
-

- 46. K.H. Park and D.W. Shin, J. Ceram. Process. Res. 3[3] (2002) 153-158.
- 47. E. Çitak and T. Boyraz, Acta Phys. Pol. A 125[2] (2014) 465-468.
-

- 48. U. Önen and T. Boyraz, Acta Phys. Pol. A 125[2] (2014) 488-490.
-

- 49. M. Romero, J.M. Márquez, and J.M. Rincón, J. Eur. Ceram. Soc. 26[9] (2006) 1647-1652,
-

- 50. J. Poyato, L.A.P. Maqueda, M.J. De Haro, J.L.P. Rodriguez, J. Šubrt, and V. Balek, J. Ther. Analy. Calor. 67[1] (2002) 73-82.
-

- 51. H. Celik, J. Ceram. Process. Res. 12[4] (2011) 483-487.
-

 This Article
-
2024; 25(4): 624-632
Published on Aug 31, 2024
- 10.36410/jcpr.2024.25.4.624
- Received on Apr 1, 2024
- Revised on Jun 10, 2024
- Accepted on Jul 5, 2024
 Services
- Abstract
introduction
experimental procedure
results and discussion
conclusion
- Conflict of Interest
- References
- Full Text PDF
Shared
 Correspondence to
- Umut Önen
-
Mersin University, Metallurgical and Materials Engineering, Mersin, Türkiye
Tel : 0 324 361 00 33 / 17004 (Dekanlık) - 17511(Bölüm) - E-mail: tahsinboyraz@cumhuriyet.edu.tr




 Copyright 2019 International Orgranization for Ceramic Processing. All rights reserved.