- Modified preparation of gangue-loess-based inorganic ceramic membrane and its oil-water separation performance test
Yu Zoua, Hui Zhanb, Yani Guob,*, Zhi Tongb, Shuangke Cuib, Miaoyu Lib, Weixing Chenb, Han Wangb, Xiaoyu Yangb, Jiaqing Wangb and Zhigang Wangb
aShaanxi Control Technology Industry Research Institute Co., LTD, Xi’an 710000, China
bSchool of Environmental and Chemical Engineering, Xi’an Polytechnic University, Xi’an 710000, ChinaThis article is an open access article distributed under the terms of the Creative Commons Attribution Non-Commercial License (http://creativecommons.org/licenses/by-nc/4.0) which permits unrestricted non-commercial use, distribution, and reproduction in any medium, provided the original work is properly cited.
Purpose: Ceramic membranes are recognized for their high mechanical strength and satisfactory acid/alkaline resistance. The innovation of this paper is the preparation of ceramic membrane carriers using cost-effective raw materials gangue and loess as well as oak powder (pore forming agent) and carboxymethyl cellulose (CMC) (binder). These materials are processed through extrusion molding and solid particle sintering to create the supports. In addition, with tetraethyl orthosilicate (TEOS) as the precursor, SiO2 thin film was prepared via the sol–gel method, and the support and thin film were modified via the dip coating method to obtain the modified hydrophobic composite ceramic film. In this study, the oil removal rate of the best ceramic membrane reached 94.1%, the oil–water flux was 1091.3 L/(m2·h·MPa), and the membrane flux recovery rate was greater than 98%, which provided ideas for the resource utilization of industrial waste and the application of a ceramic membrane in the field of water treatment.
Keywords: Ceramic membrane support, SiO2 films, Membrane modification, Performance research.
Membrane separation technology can enable efficient molecular separation of materials, which is crucial in water treatment technology [1, 2]. Compared with traditional membranes, ceramic membranes have superior physicochemical properties, higher filtration accuracy and larger specific surface area [3-7]. Currently, most of the common ceramic membranes on the market are prepared from alumina [8]. While their performance is excellent, the high preparation cost limits their development [9, 10].
To reduce the preparation costs of ceramic membrane supports while ensuring performance, researchers are beginning to focus on solid waste feedstocks and mineral resources [11, 12]. Coal gangue, a significant by-product of the coal mining industry, poses serious land threats [13]. The heavy metal ions contained in gangue materials cause serious pollution to surface water as well as groundwater [14-18]. However, the main components of coal gangue are alumina and silica, and it is crucial in traditional ceramic membrane support preparation. Moreover, its main crystalline phase is quartz, which is a low-cost potential source of silica, with higher silica content than other solid wastes and industrial by-products like fly ash and kaolin clay [19]. Loess is a natural mineral resource that not only has high silica content but also possesses a bonding effect. The phenomenon of coalescence occurs when loess is exposed to water, and it produces a burnout phenomenon during sintering, which promotes the generation of apertures in the ceramic membrane support [20]. Tong [21] used loess as the main raw material to prepare a ceramic membrane with a flexural strength of 42.24 MPa, pure water flux of 8323.73 L/(m2·h·MPa), and an average pore throat radius of 5.15 μm.
Currently, the application of ceramic membranes is limited in terms of pore size control. To address this, researchers modify the existing ceramic membrane supports by depositing porous materials on the surface to meet further application requirements [22]. Shi [23] utilized SiO2-modified SiC ceramic membranes to achieve a high retention rate for 20 nm fluorescent monodispersed polystyrene (PS) microspheres; the resulting SiC/SiO2 composite membranes had a water permeability of 77 L·m−2·h−1·bar−1, improved resistance to protein contamination, and increased acid stability.
This study aimed to carry out the preparation of low-cost gangue-based ceramic membrane supports and to broaden the application of gangue-based ceramic membranes by hydrophobically modifying them using SiO2 films. The combination of SiO2 films with ceramic supports proved to be effective, notably improving screening performance. In this study, our ceramic membranes showed better treatment capacity and stable performance for simulated oily wastewater, which can facilitate their broader application in various industrial processes.
Materials
Coal gangue (D50 = 3.2 μm) was obtained from the Shaanxi Hancheng Power Plant, China. The main crystalline phases included the quartz phase (PDF#-850795, SiO2), dolomite (PDF#-701869, CaMg(CO3)2), and lepidolite (PDF#-221156, Mg3[(OH)4Si2O5]); loess (D50 = 3.23 μm) was retrieved from the Luochuan National Geopark, China. The main crystalline phase included the quartz phase (PDF#-850795, SiO2), sodalite(PDF#-350559, NaAlCO3(OH)2), and hydrated calcium alumina (PDF#-020083, Ca3Al2O6-H2O). Oak(300 mesh) powder was supplied by Henan Kewitt Environmental Protection Technology Co., Ltd. (Henan, China). Carboxymethyl cellulose (CMC, AR) was supplied by Tianjin Beilian Fine Chemicals Development Co., Ltd. (Tianjin, China). Tetraethyl orthosilicate (TEOS) was supplied by Tianjin Damao Chemical Reagent Factory (Tianjin, China).
Methyltriethoxysilane (MTES, 8%) was supplied by Shanghai McLean Biochemical Technology Co. (Shanghai, China); ethyl alcohol (C2H5OH) and aqueous ammonia (NH3·H2O) by Tianjin Damao Chemical Reagent Factory (China); and N, N-dimethyl formamide (DMF, AR) was supplied by Tianjin Komeo Chemical Reagent Co. (Tianjin, China).
Preparation of Samples
Preparation of Ceramic Membrane Support
The coal gangue and loess (8:2 (wt%)) were mixed evenly and then deionized water was added. Oak powder was then incorporated in varying amounts: 0 wt% (C0), 5 wt% (C5), 10 wt% (C10), and 15 wt% (C15). Then, the binder, carboxymethyl cellulose (CMC, 3 wt%), was added, and the mixture was stirred continuously until there were no particles in the solution. The solution without particles was placed in a water bath and stirred at 100°C while being heated until the water content in the solution evaporated to 15%. Following this, the mud was removed from the bath and kept at a constant temperature for 24 h to age, enhancing its toughness and stability. The aged mud was extruded under a vacuum to form a tubular ceramic membrane support embryo, measuring 15 mm in diameter, 3 mm in wall thickness, and 250 mm in length. The embryo of the support was dried under a constant temperature and placed into a muffle furnace for sintering in the temperature range of 30-1125℃ to obtain the finished ceramic membrane support.
Preparation of SiO2 SOL
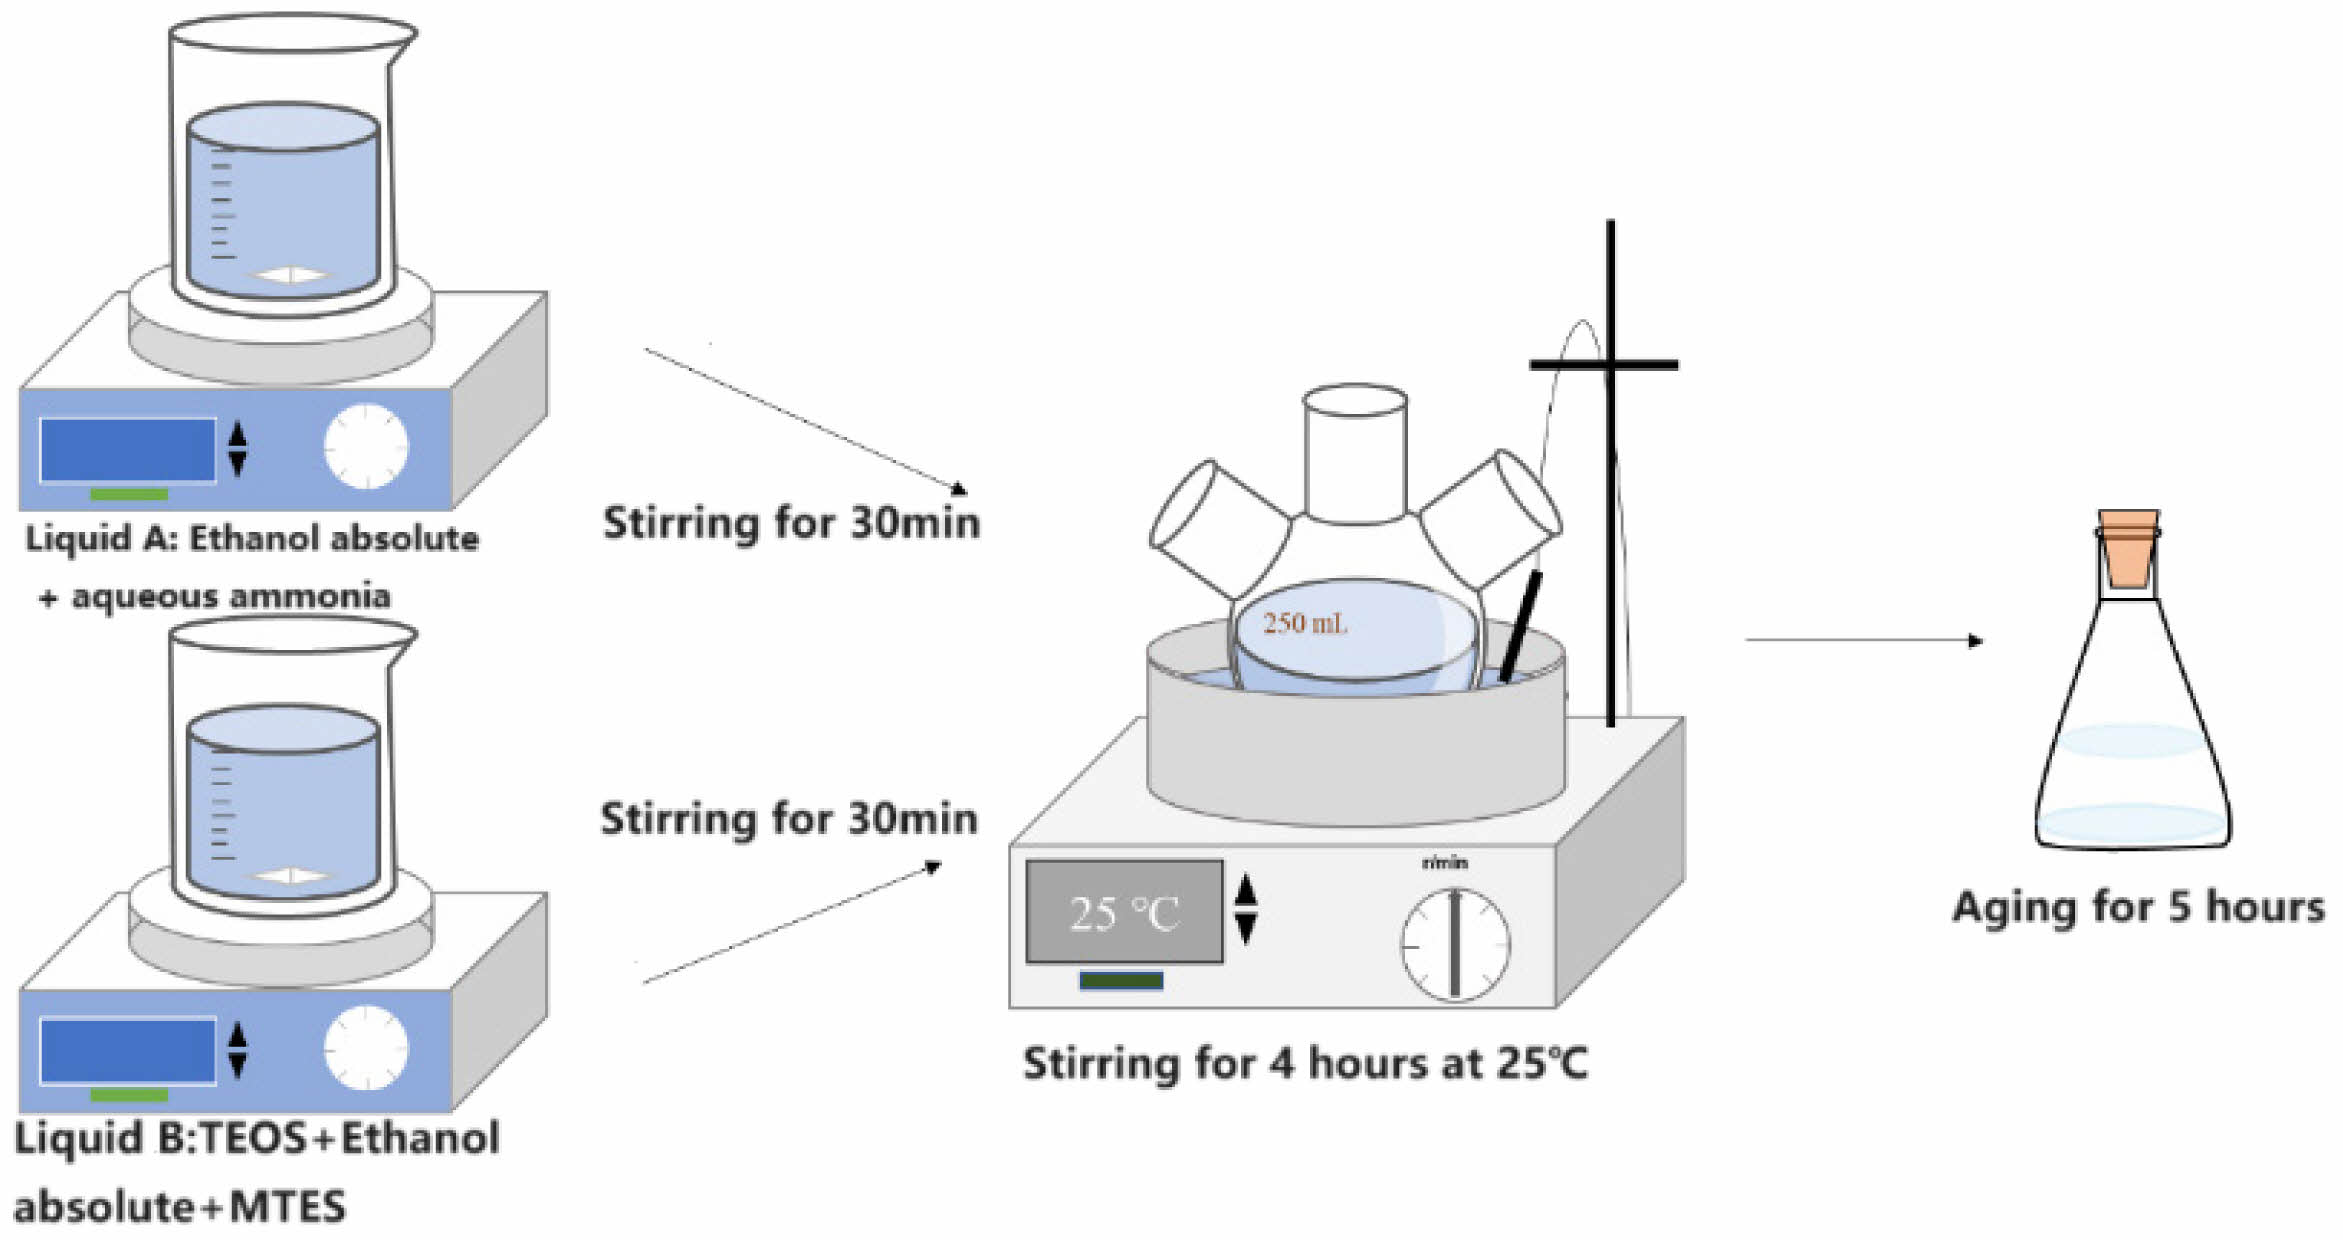
Figure 1 shows the actual preparation process of sol coating liquid and the molecular conversion process of substances during the reaction. The formation process of silica nano colloids: The TEOS molecule contains four ethoxy groups (-OC2H5) hydrolyzed to generate Si-OH, which condense with each other to form siloxane bonds (Si-O-Si). First, ammonia and anhydrous ethanol were added to a three-necked flask and sealed, called A. Second, TEOS, MTES, and anhydrous ethanol were added to a three-necked flask and sealed, called B. Both A and B were stirred for 30 min each. B was then slowly poured into A, and the mixture was stirred at a set temperature for 4 h (400 rpm) to produce SiO2 sol. The mixture was left to age for 5 days before use.
In this study, 10 mL of TEOS and 5 mL of ammonia were used to investigate the effects of varying MTES volumes (0 mL, 2 mL, 4 mL, and 6 mL) on the properties of the films. To minimize film cracking of the film layers and control the evaporation rate, 30 wt% DMF was added to the SiO2 sol.
Preparation of Ceramic Membrane
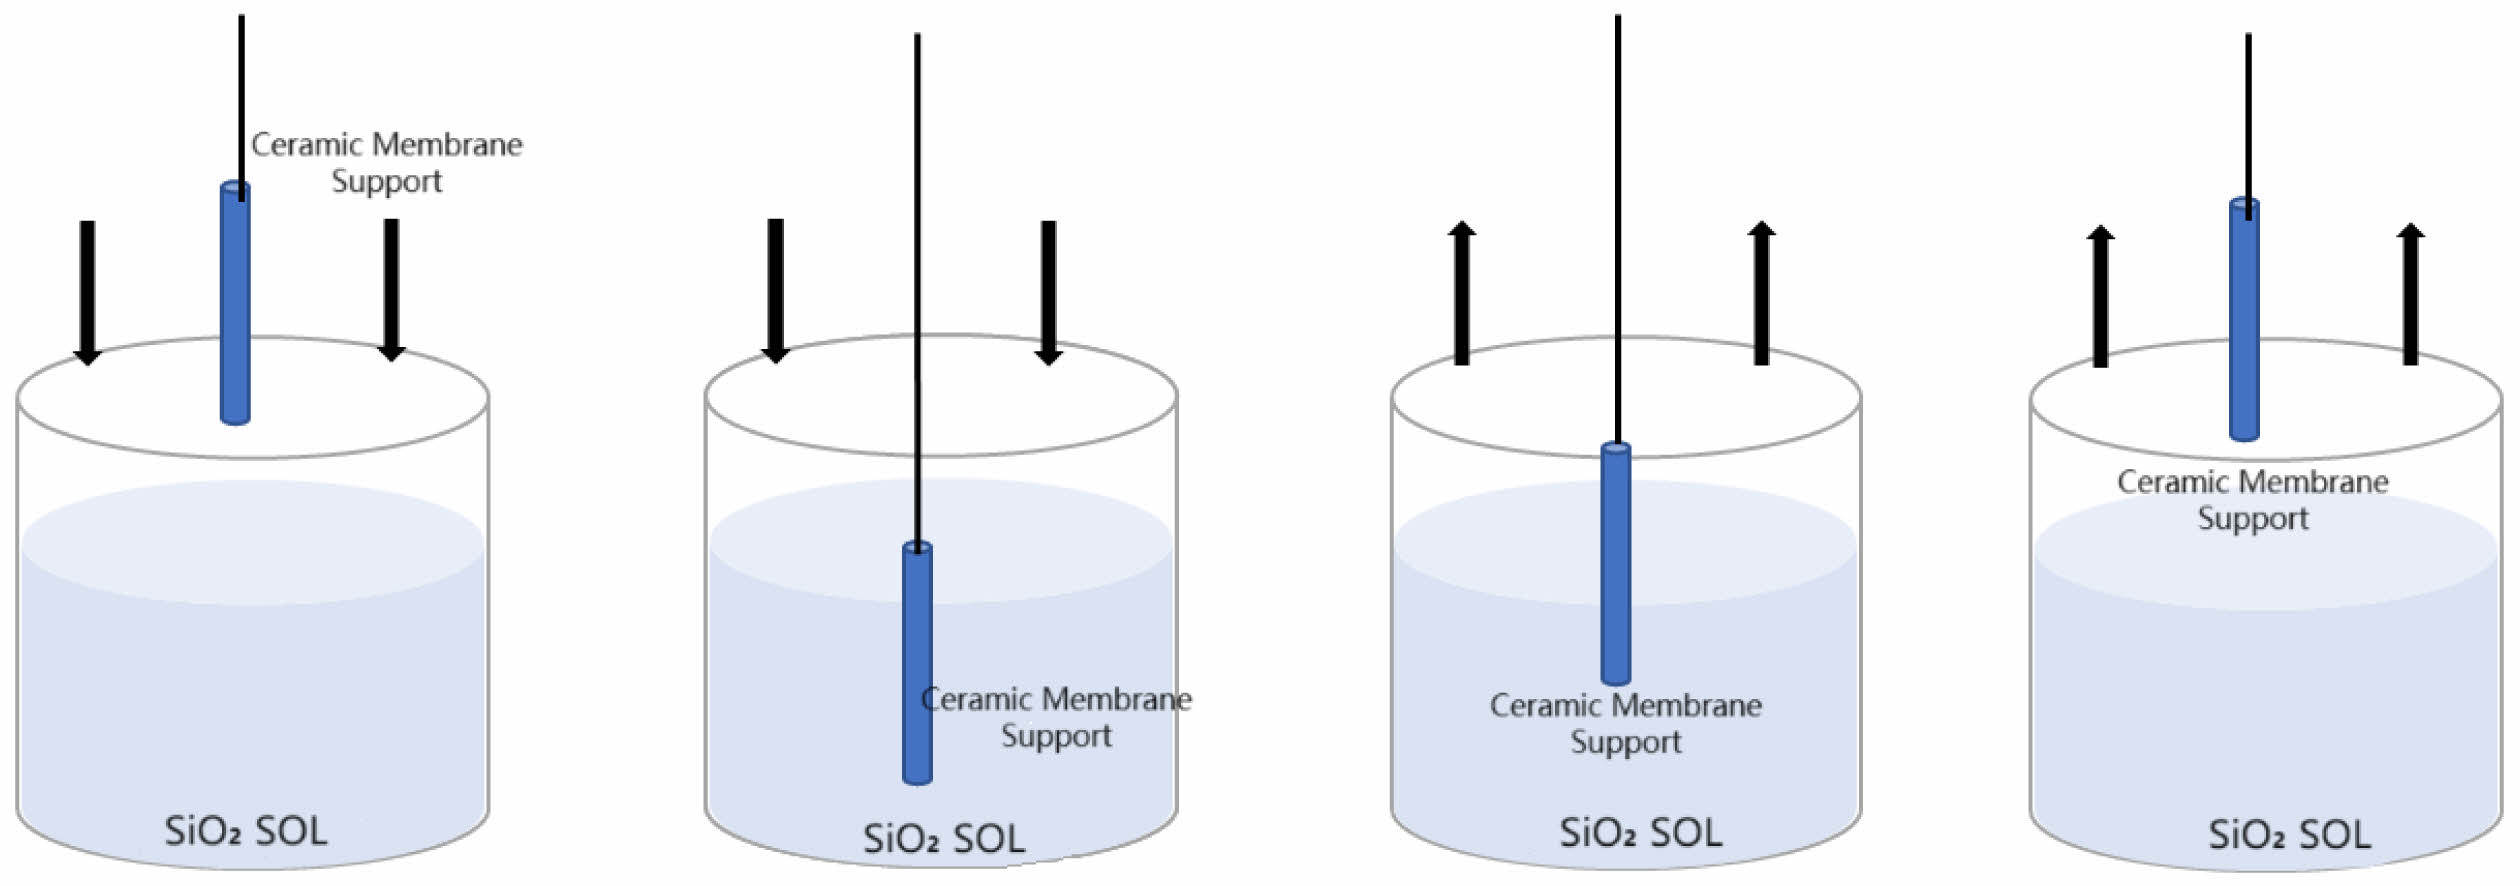
To ensure the stability and safety of the impregnating and lifting machine, the support must be securely fixed under the overhanging beam of machine to prevent dislodgement. The machine was then operated at specified impregnation times, descent rates, and lifting rates to achieve a uniform and stable membrane (1). The worktable was cleaned to prevent the contamination of the sol and support with surface dust. (2) Parameterization was performed to set the impregnation time, impregnation rate, and lifting rate. (3) The pre-treated and dried support was fixed to the cantilever of the machine to prevent the support from moving during film application and to ensure the uniformity of the film. (4) The upper and lower limits of the machine were adjusted according to the length of the support, and the measuring cylinder containing the SiO2 sol was placed on the table, with the measuring cylinder aligned with the centerline of the support. The upper and lower limits of the instrument were adjusted to prevent the machine from squeezing the measuring cylinder due to the inappropriate height in the process of film coating. (5) The program was initiated once prepared, and the stability of the coating equipment was maintained throughout the operation to prevent uneven coating. The preparation process is shown in Fig. 2. The direction of the arrow is the movement direction of the support fixed to the coating meter.
Characterization of Ceramic Membranes
(1) The crystal phase composition of the support body was measured with a D/MAX-2400 X-ray diffractometer, produced by Rigaku Co. (Tokyo, Japan), Ltd. (2) The micro-morphology of the support body, SiO2 film layer, and the complete composite ceramic film after coating were observed with a Q45 scanning electron microscope (SEM), produced by the FEI Company (Portland, USA). (3) Analysis of functional groups and chemical bonds in the SiO2 thin film layer was measured with a Nicolet 5700 Fourier exchange infrared spectrometer, produced by the Thermo Electron Company (Boston, USA). (4) The contact angle was measured with the JC-2000D1 contact angle measuring instrument, produced by Shanghai Metallographic Environmental Technology Co.(Shanghai, China), Ltd., 1 μL; repeat operation 2 times. (5) The pore size of the support body was measured by the AutoPore 122 IV 9500 mercury injection instrument, manufactured by Michael Instruments, (Atlanta, USA). (6) The bending strength was measured by the CMT5105 universal testing machine, produced by Shenzhen Xinsanji 123 Material Testing Co.(Shenzhen, China), Ltd. (7) The surface roughness of the SiO2 film layer was measured with a Dimension Icon atomic force microscope, produced by the Bruker Company, (Saarbrucken, Germany).
(8) The pure water flux of a ceramic membrane is a key performance and operational indicator. At 25°C and 0.1 MPa, the difference between the values on the balance before and after the experiment was recorded, and it was used to calculate the pure water flux or oil–water flux as follows:

where J is the filtrate flux, L/(m2·h·MPa); V is the total amount of liquid measured at a pressure of 0.1 MPa, L; A is the effective filtration area, m2; T is the filtration time, h.
(9) The concentration of oily wastewater was determined by measuring the absorbance of the treated oily wastewater at 272 nm using a UV–vis spectrophotometer. The oil removal rate (R) was calculated according to the following equation:

where Cf and CP are the oil concentrations in the feed and filtrate, mg/L, respectively.
(10) The corrosion resistance of the ceramic membrane support was evaluated in harsh acidic and alkaline solutions. The support was immersed in sulfuric acid (pH = 1) and sodium hydroxide (pH = 13) solutions for one week, ultrasonically cleaned, and dried at a temperature of 100°C. The difference in the dry weight of the support before and after treatment was used to calculate the corrosion resistance with the following equation:

where Wi and Wf correspond to the dry weight, g, of the support before and after acid or alkali treatment, respectively.
|
Fig. 1 Schematic diagram of nano-silica sol preparation |
|
Fig. 2 Diagram of ceramic membrane preparation. |
Performance Analysis of the Support
Physical Property Analysis
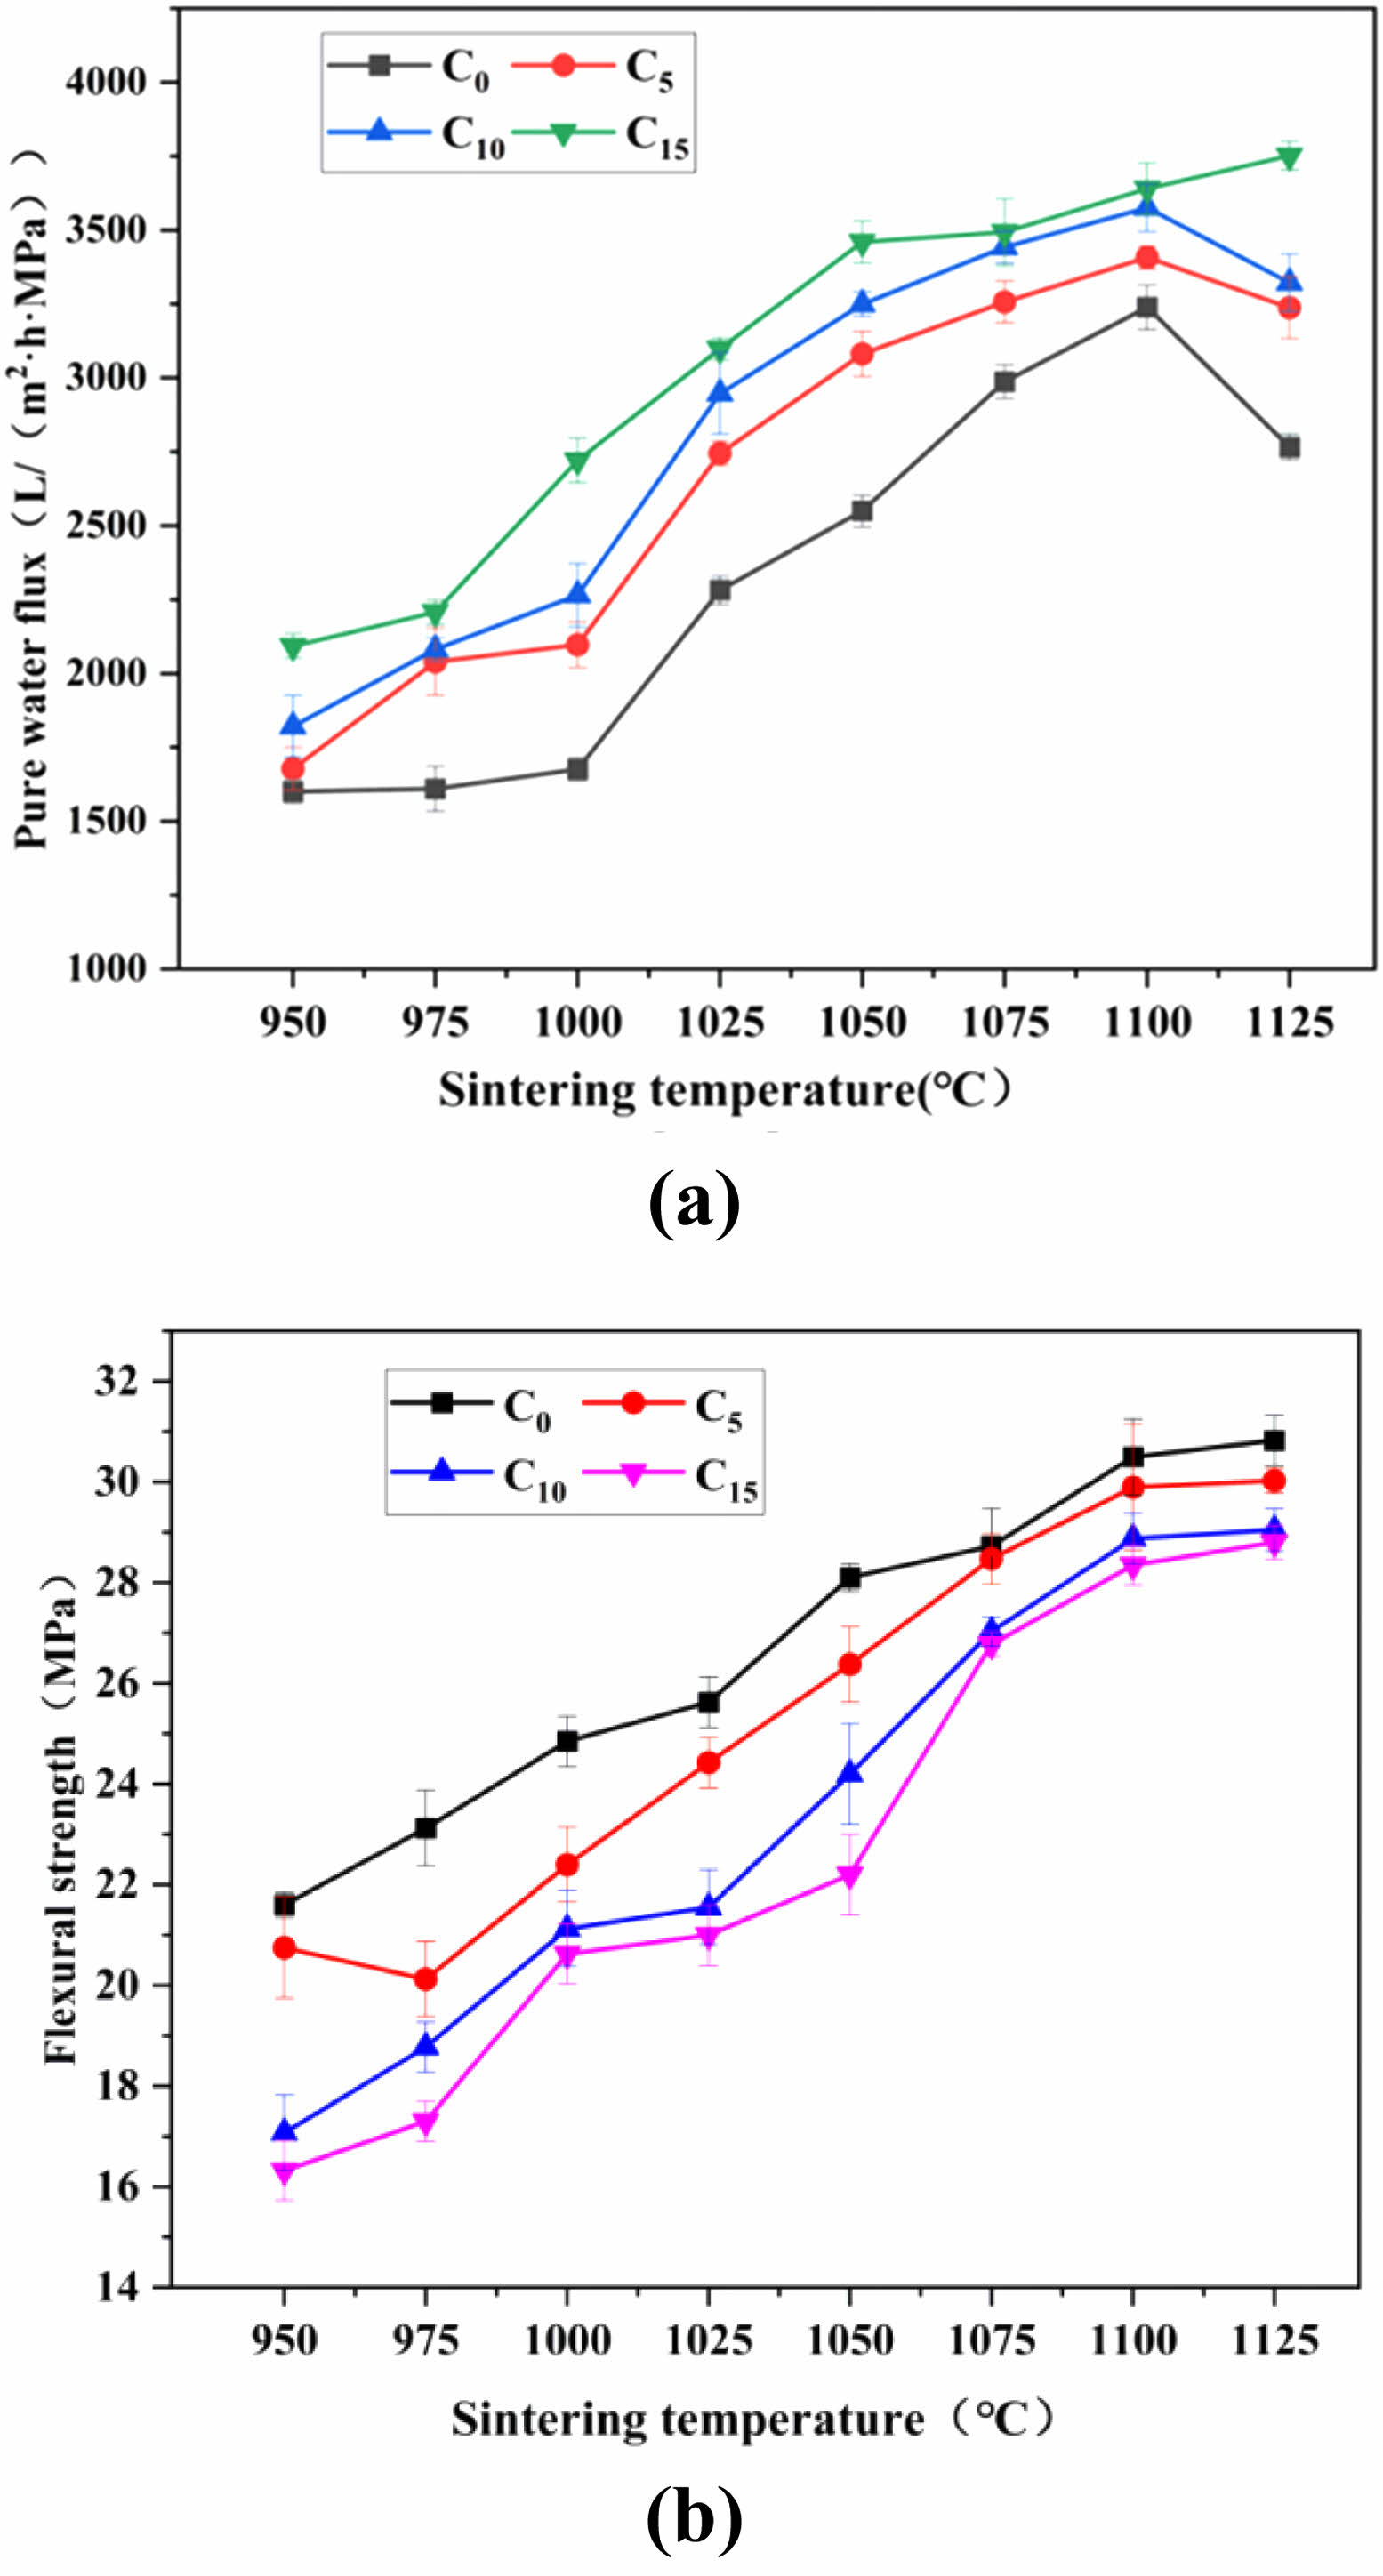
In this study, we explored the properties of the raw materials used in preparing ceramic membrane supports (Supporting Section S1). Fig. 3a,b illustrate the effects of the pore-forming agent and sint ering temperature on the pure water flux and flexural strength of the ceramic membrane supports, respectively. From Fig. 3, it can be intuitively observed that when the content of the pore-forming agent is kept constant, the pure water flux of the ceramic membrane supports showed a trend of increasing and then decreasing with the increase in the sintering temperature, whereas the flexural strength consistently increases. When the sintering temperature is constant, the pure water flux increases, and the flexural strength decreases with increasing pore-forming agent content. The reasons for this change are variations in the way that the raw material and additive particles are connected, as well as due to the changes in the grains themselves. In the process of this transformation, the grains gradually mature with the increasing sintering temperature and a stable pore structure is continuously formed. However, the spaces newly a added. Confirm occupied by the pore-forming agent particles in the raw embryo of the ceramic membrane support increase continuously with the increasing content of the pore-forming agent. During the sintering process, the resulting burnout phenomenon becomes more and more serious with the increasing content of the pore-forming agent. When the sintering temperature exceeds 1100°C, the pure water flux and flexural strength are reduced to different degrees. This is due to the continuous growth of the grains under the action of high temperatures and the transformation of the connections between the raw material particles into densification. Combining the trends of the pure water flux and flexural strength of the ceramic membrane supports after being affected by the pore-forming agent and sintering temperature, it is concluded that the best performance is achieved when the content of the pore-forming agent is 10 wt%. As the sintering temperature rises from 950°C to 1125°C, the pure water flux of the ceramic membrane support increases from 1821.7 L/(m2·h·MPa) to 3576.7 L/(m2·h·MPa) and then decreases to 3322.1 L/(m2·h·MPa), and the flexural strength increases from 17.1 MPa to 29.1 MPa.
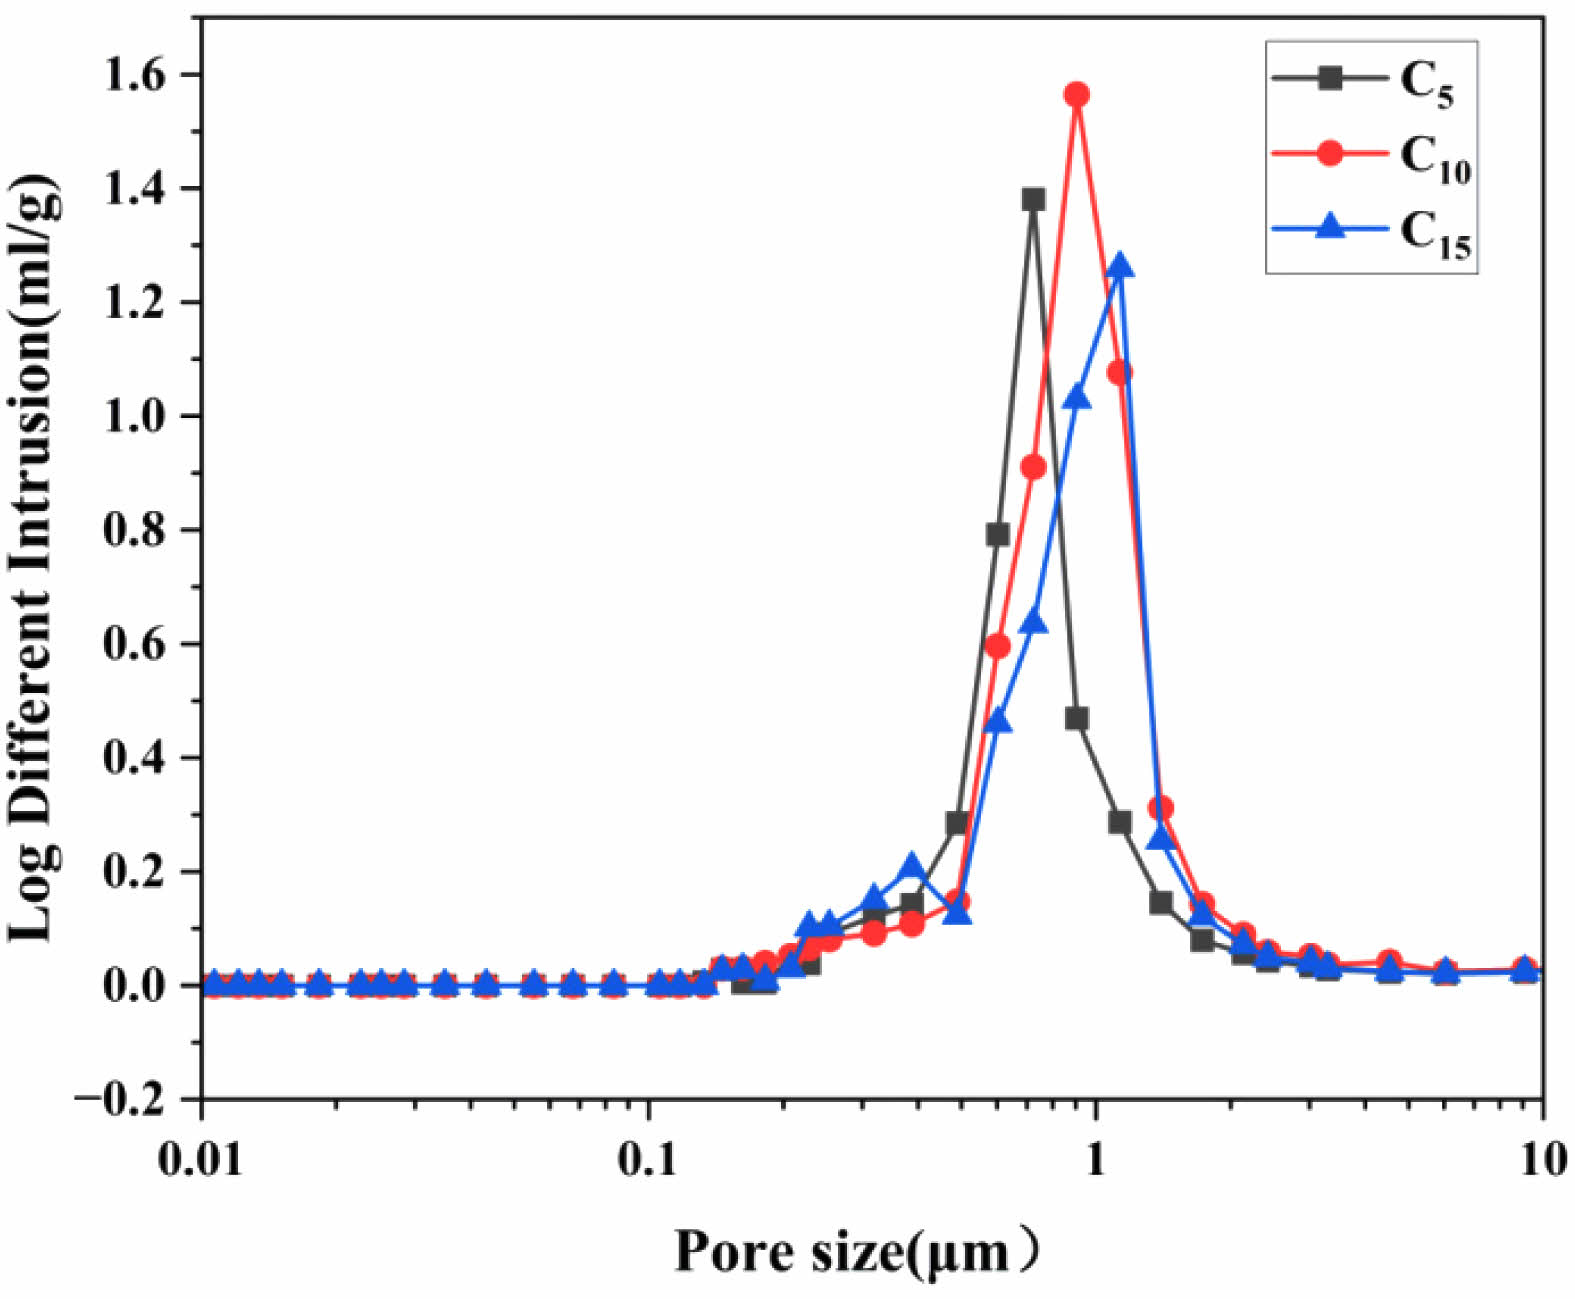
Figure 4 shows the pore size distribution curves of the ceramic membrane supports when the content of the pore-forming agent was 5 wt% (C5), 10 wt% (C10), and 15 wt% (C15) at a sintering temperature of 1100°C. When the amount of the pore-forming agent added was 5 wt%, the median pore size of the support was 0.98 μm, the average pore size was 0.87 μm, and the porosity was 50.2%. When the amount of the pore-forming agent added was 10 wt%, the median pore size of the support was 1.04 μm, the average pore size was 0.69 μm, and the porosity was 55.5%. When the amount of the pore-forming agent added was 15 wt%, the median pore diameter of the support was 1.17 μm, the average pore diameter was 0.98 μm, and the porosity was 56.8%. Assessing the physicochemical properties of the supports, the pore size distribution was more concentrated and the performance was optimal when the amount of the pore-forming agent added was 10 wt%.
Crystal Phase Analysis
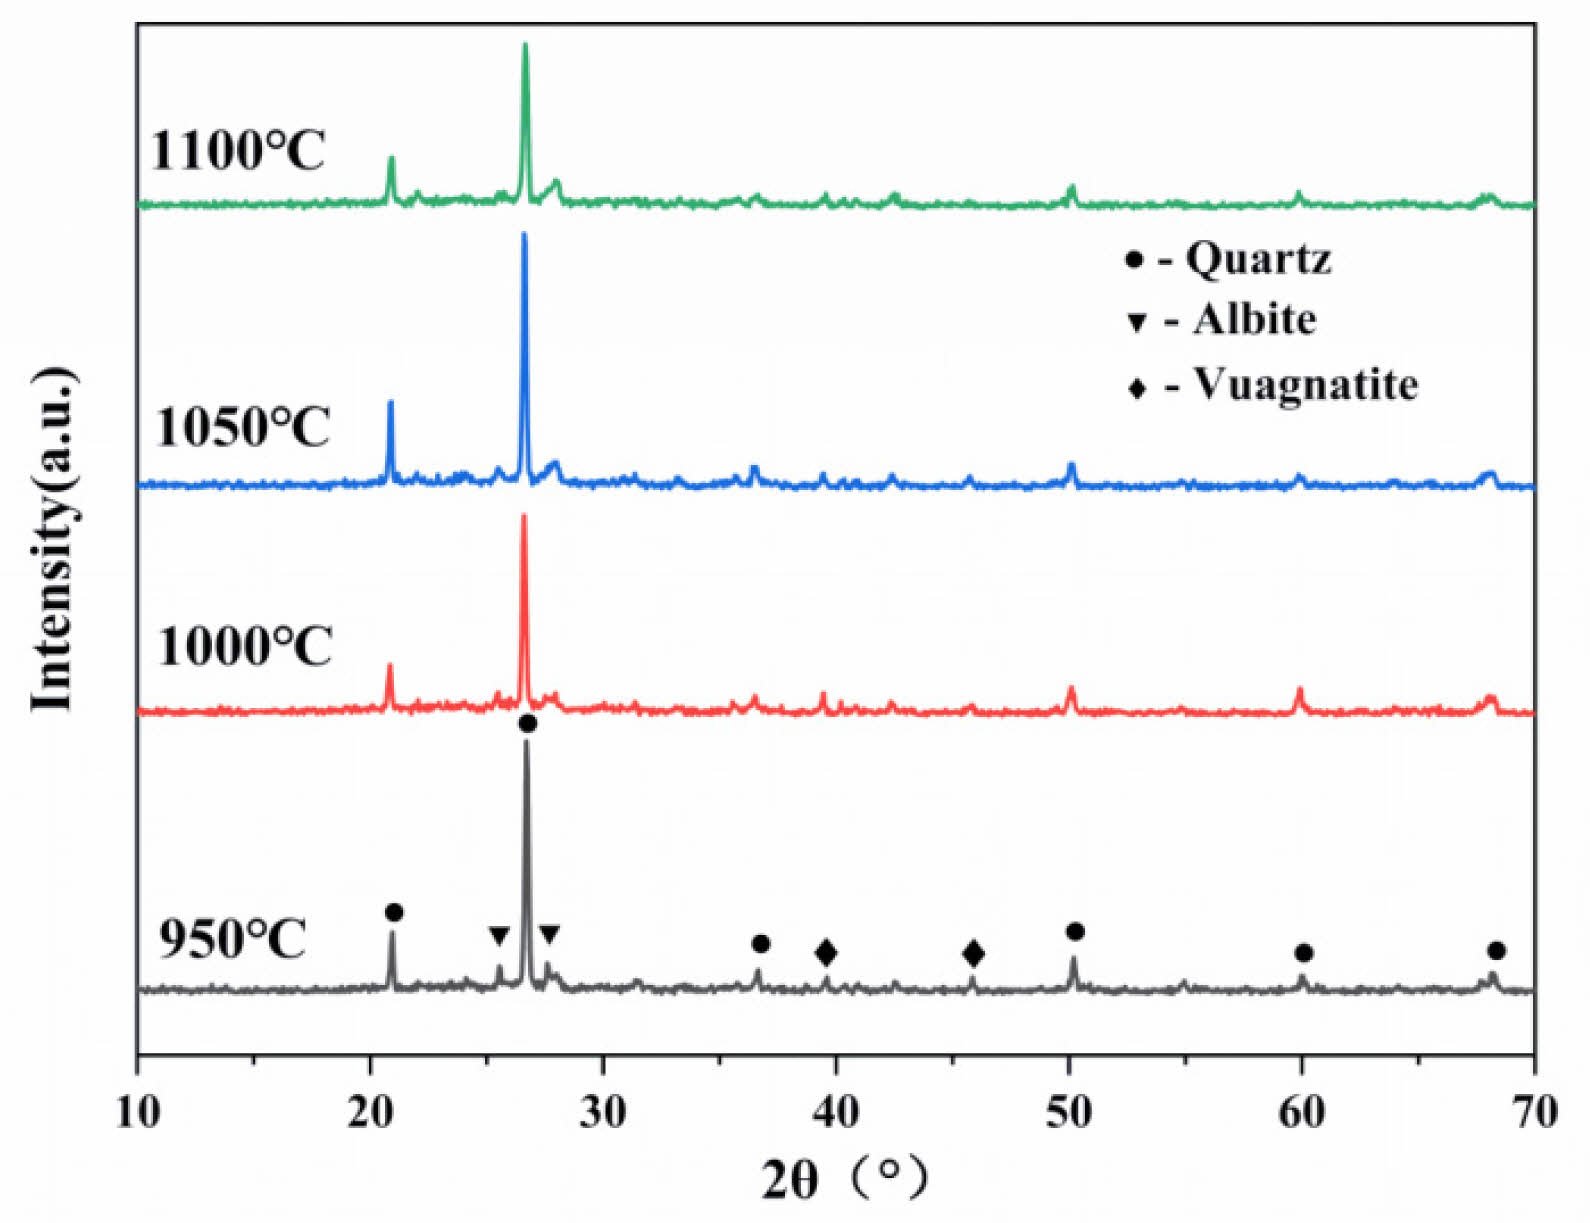
Figure 5 illustrates the changes in the crystalline phase composition of the ceramic membrane supports with the change in sintering temperature at a pore-forming agent content of 10 wt%. As depicted in Fig. 5, the main crystalline phases are quartz (SiO2, PDF # 85-8053), albite (Na(Si3Al)O8, PDF # 10-0393), and vuagnatite (CaAl[SiO4](OH), PDF # 29-0298). The quartz phase diffraction peaks increase and then decrease with the increasing sintering temperature. This is due to the fact that the SiO2 and Al2O3 contained in the raw materials produce the aluminum silicate quartz phase via a crystallization reaction at high temperatures. As the temperature increases, the pore-forming agent enhances the contact area between the raw material particles during the sintering process, thus promoting the growth of internal grains. Densification occurs when the sintering temperature is increased to the range of 1050°C~1100°C (due to the intergranular connection of the liquid phase), and the quartz phase diffraction peaks are reduced, hindering the growth of grains. High-temperature conditions facilitate the formation of a dense liquid phase from feldspar, forming eutectic crystals, which promotes sintering and thus improves the flexural strength [24].
Chemical Property Analysis
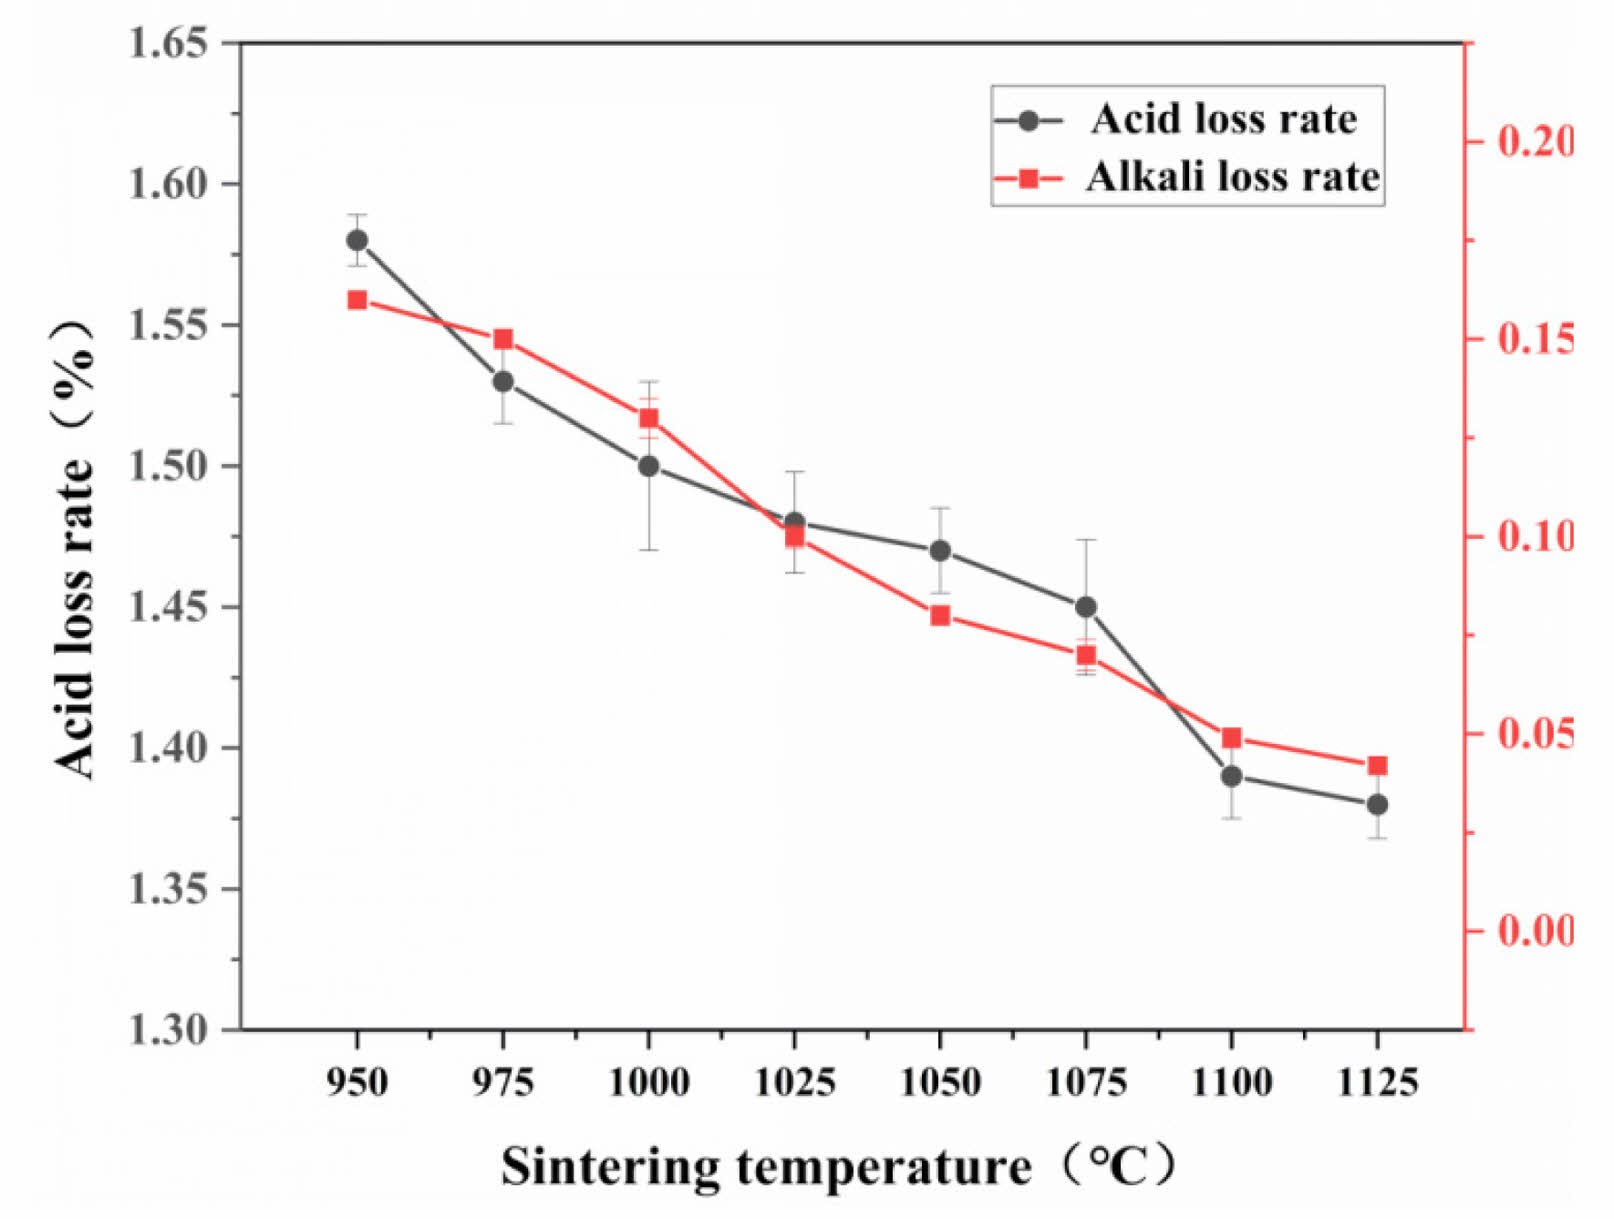
In this study, optimal performance of the supports is observed with a pore-forming agent content of 10 wt%. Fig. 6 displays the variation in chemical properties of the supports at different sintering temperatures for this specific pore-forming agent concentration. As the sintering temperature increases, the acid and alkali corrosion rates of the supports decrease. Notably, the alkali corrosion rate of the ceramic membrane supports is lower than the acid corrosion rate. This is attributed to the primary chemical composition of the raw materials being SiO2, with quartz as the main crystalline phase in the prepared supports. Quartz reacts more readily with H ions than with OH ions, leading to a higher acid corrosion rate under identical preparation conditions [25, 26].
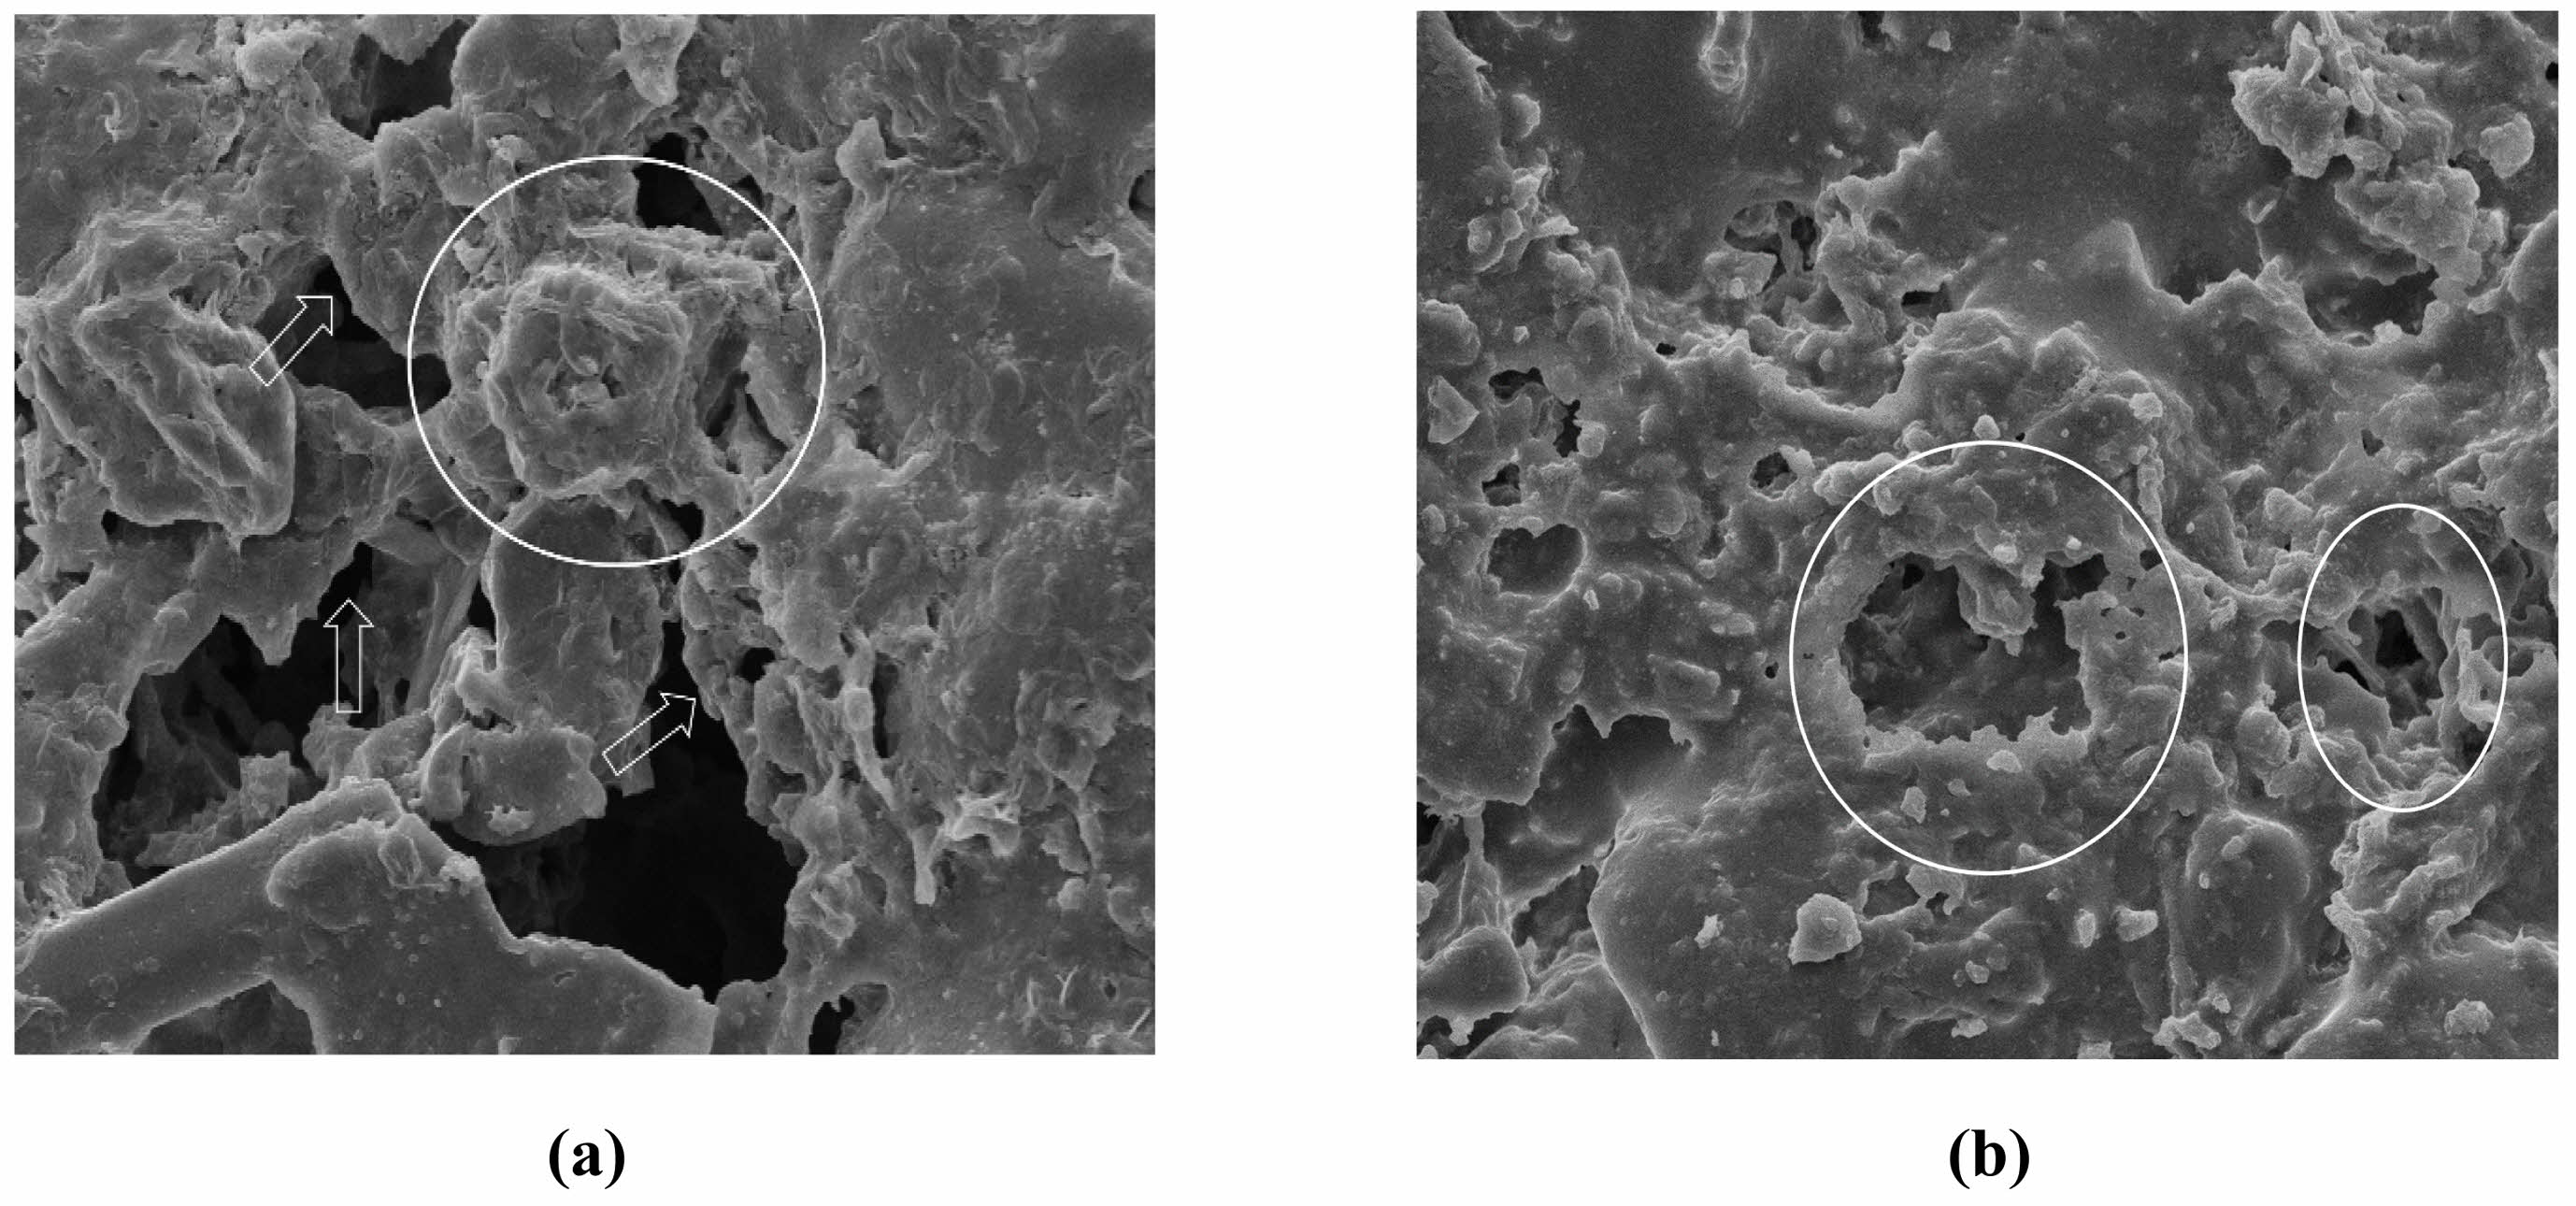
Figure 7 shows the microscopic morphology of the ceramic membrane supports prepared under the condition of 10 wt% of the pore-forming agent and a sintering temperature of 1100°C, following immersion in acid (H2SO4, pH = 1) and alkali (NaOH, pH = 13) solutions. This study found that the acid and alkali erosion rates of the supports are low. The microscopic morphology of the supports soaked in the strong acid solution changed significantly, and the edge of the pore structure became smoother after reacting with the strong acid solution due to its lower structural stability than the densified liquid phase region. The support affected by the strong alkali solution showed a slight corrosion phenomenon in some areas, but the change was not obvious. The microscopic morphology of the ceramic membrane supports was affected more by the acid solution than the alkali solution. In other words, the alkali resistance of the ceramic membrane support was better than its acid resistance.
Microscopic Morphology
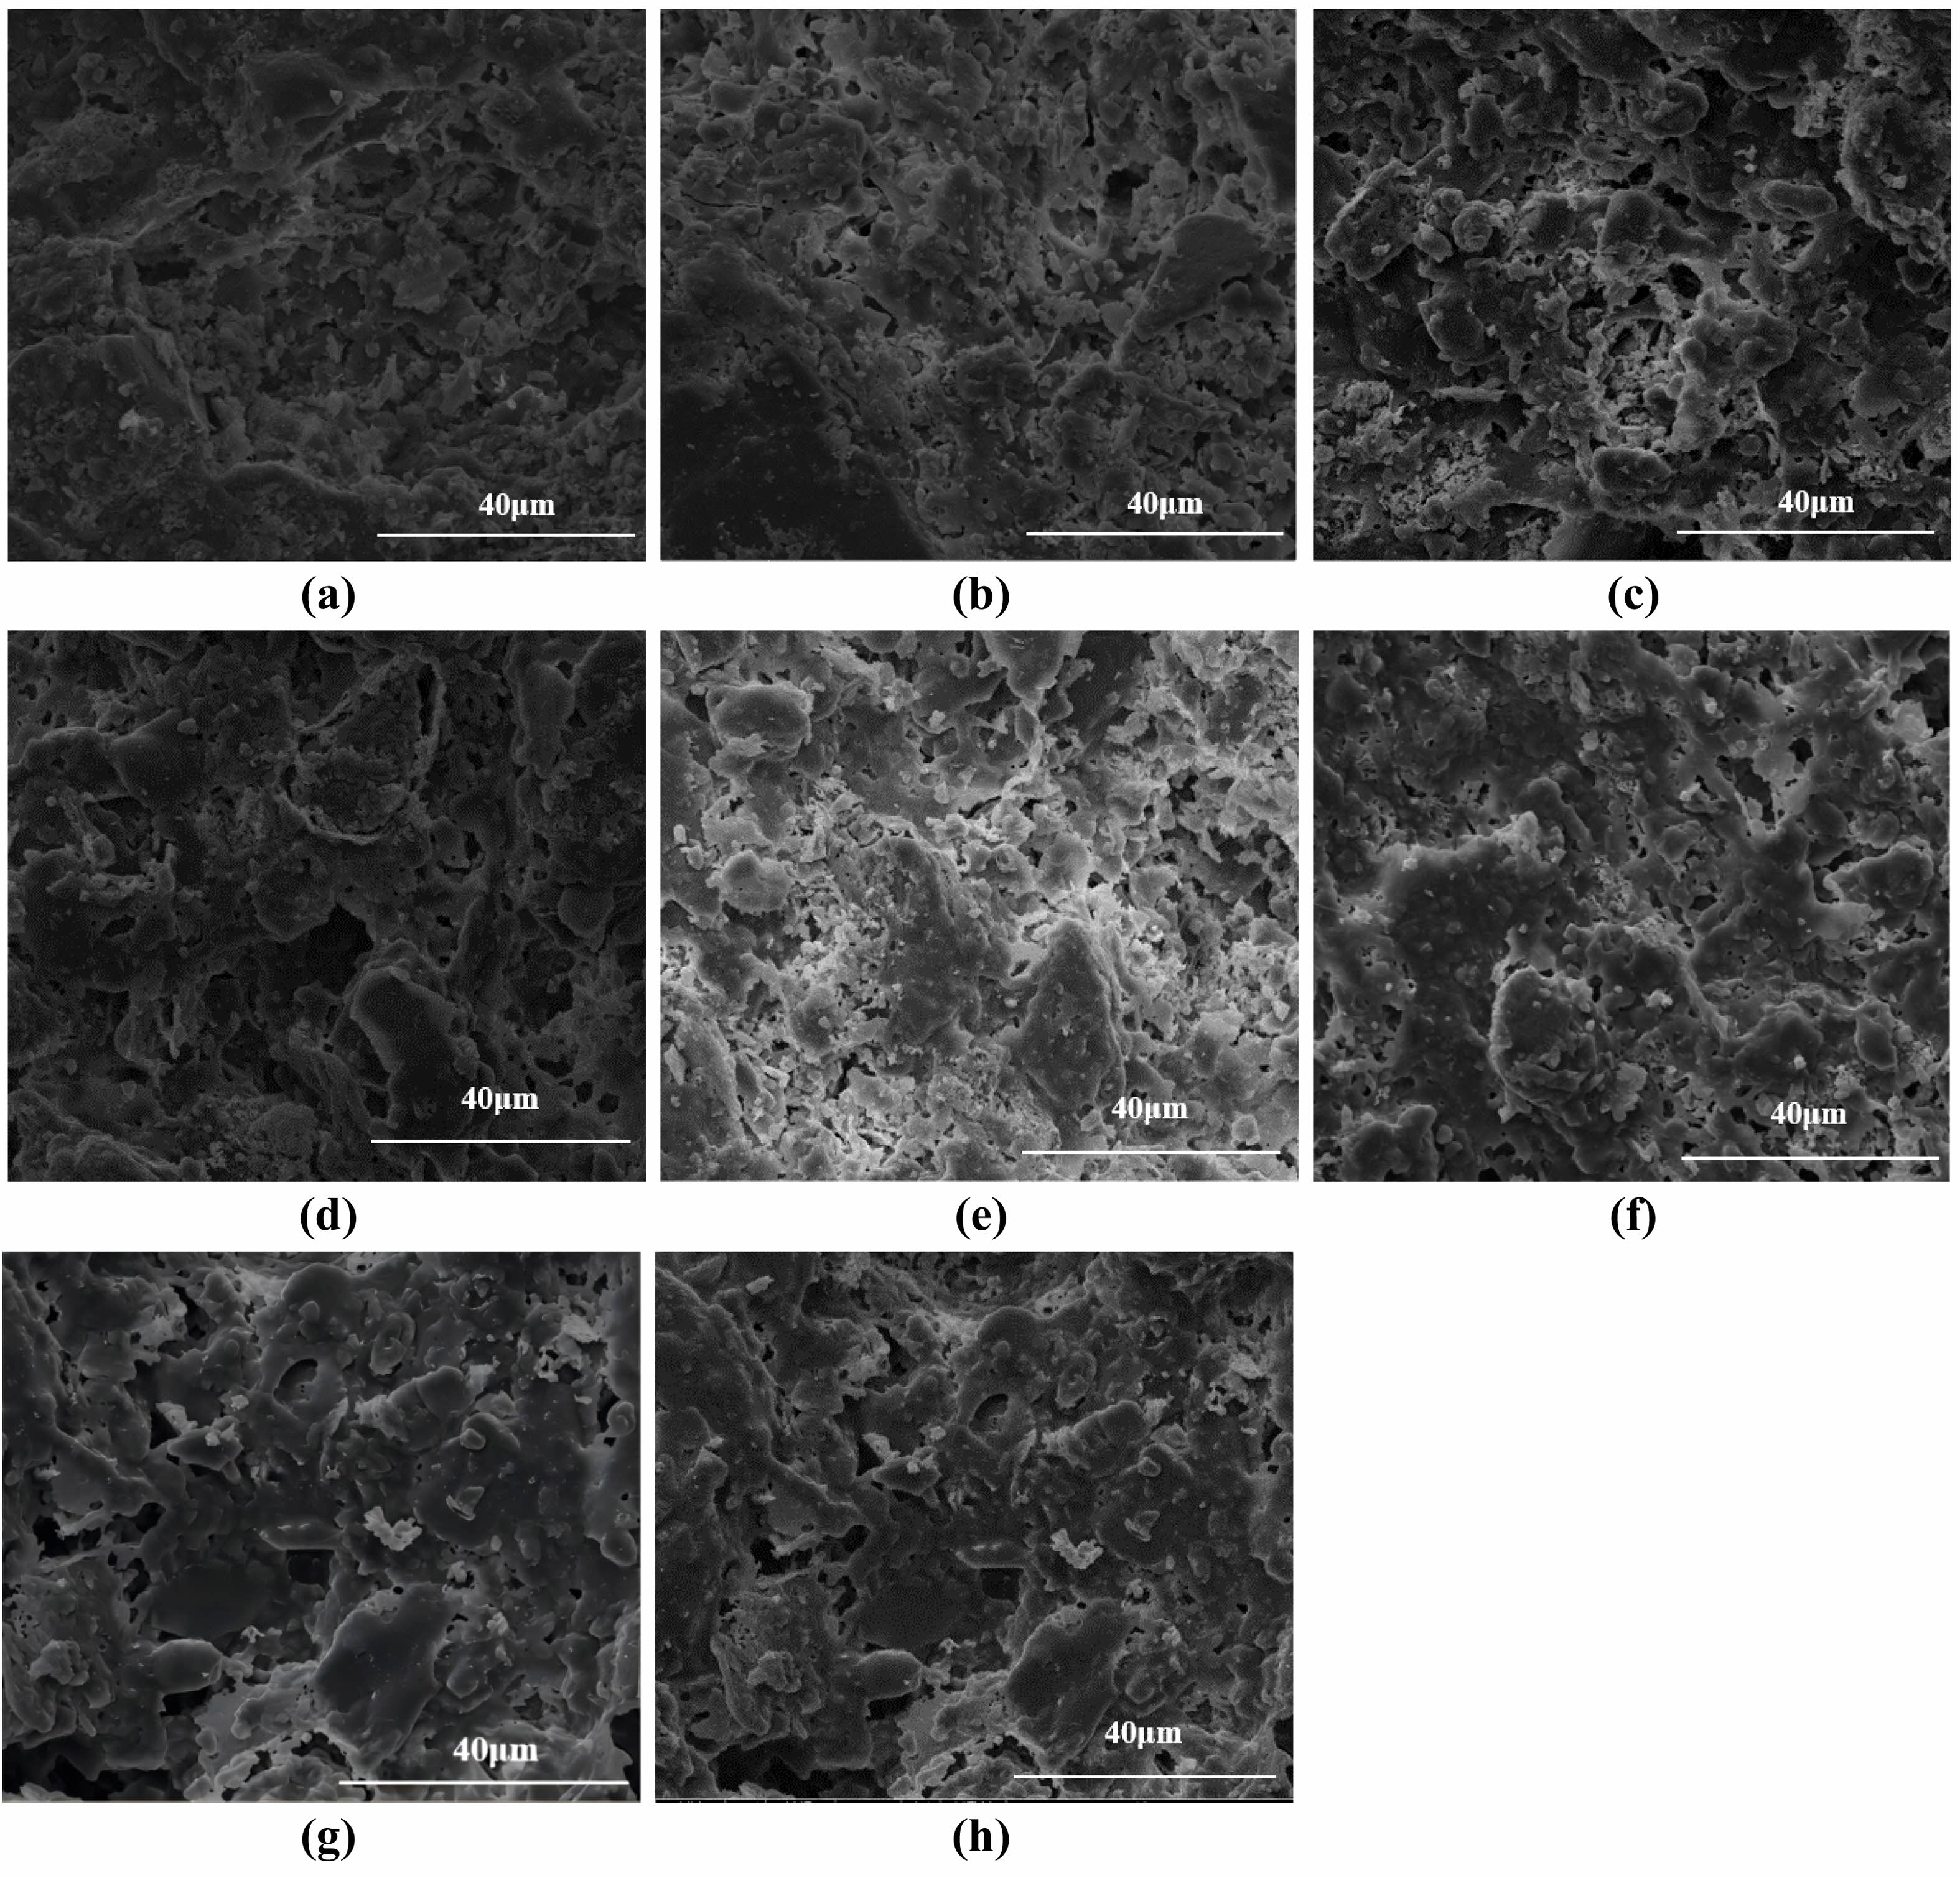
Figure 8 shows the effect of different sintering temperatures on the microscopic morphology of the ceramic membrane support when the pore-forming agent content is 10 wt%. When the sintering temperature is 950°C, the connections between the particles inside the support are characterized by particle stacking, with only some neck connections, and the densification liquid phase state is less evident. At 1000°C, there was a reduction in particle accumulation and an increase in the number of neck connections. As the pore-forming agent produces the phenomenon of burning loss in the process of sintering, which promotes the growth of grains and generates the pore structure, the Van der Waals force between the raw material particles changes, and the flexural strength gradually increases. At a sintering temperature of 1075°C, particle accumulation completely disappears, and neck connections and liquid phase densification coexist, the temperature reaches 1100°C, the interior of the support almost becomes densified, and a stable pore structure is generated. The physicochemical properties of the support improved progressively with the increase in temperature.
Property Analysis of SiO2 Films
FTIR Analysis of SiO2 Films
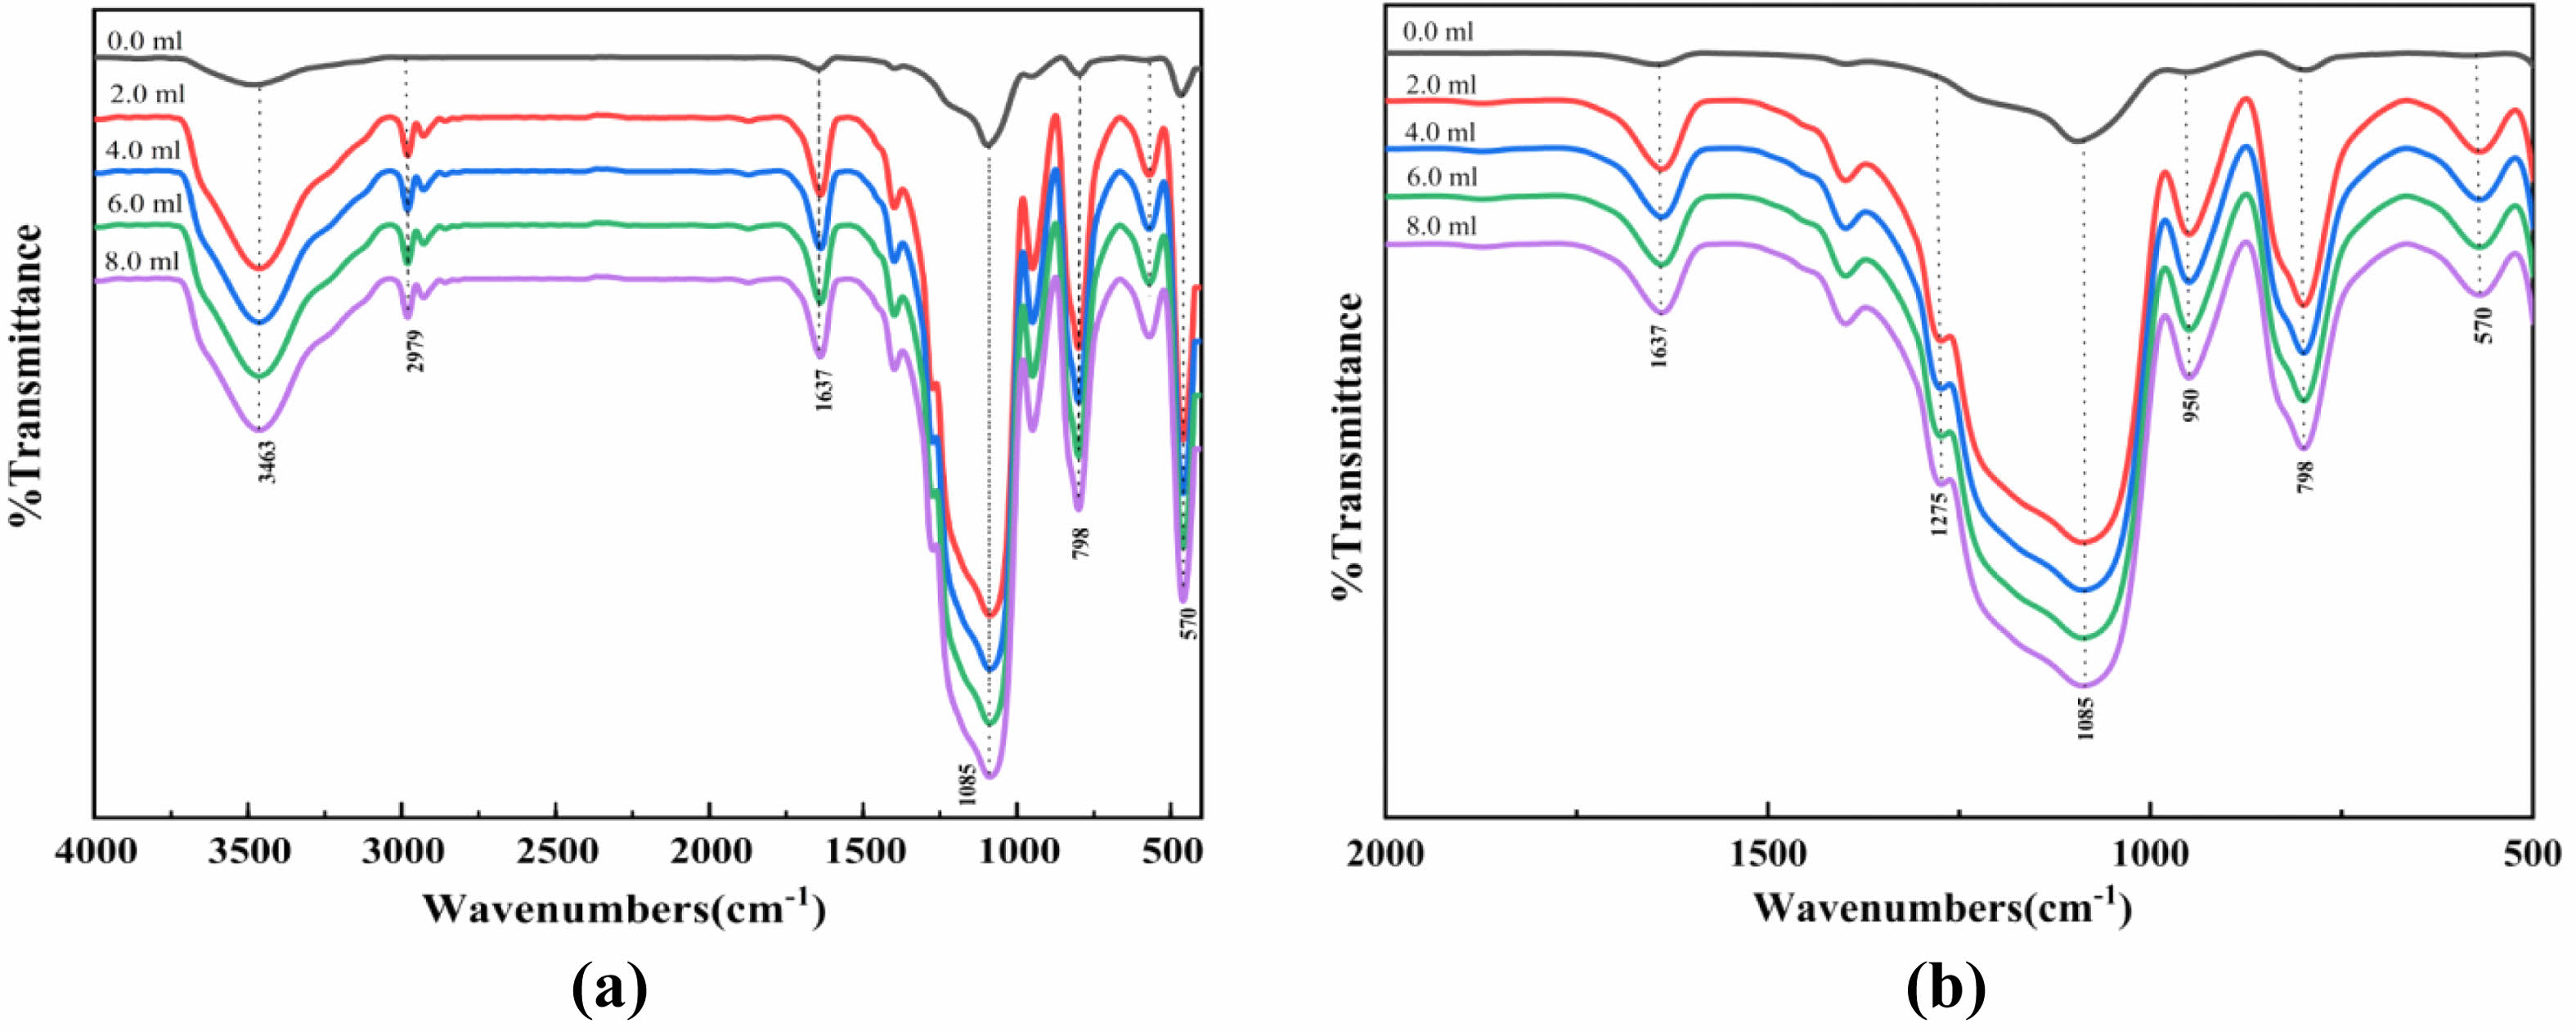
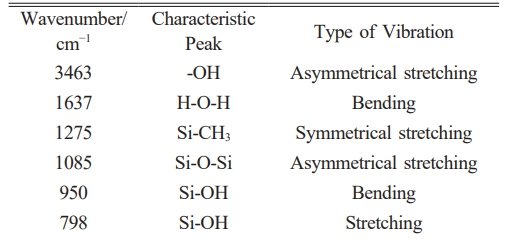
Figure 9 shows the FTIR performance analysis of MTES addition in silica films. With the increase of MTES addition, the intensities of the characteristic peaks of Si-O-Si, -methyl, and Si-CH3 increase accordingly, while the intensity of the characteristic peaks of Si-OH decreases gradually. During the modification of SiO2, a large number of spherical silica nanoparticles were generated, and MTES could introduce the hydrophobic group Si-CH3, consume a large amount of Si-OH, and promote the transition from hydrophilicity to hydrophobicity [27].
Microscopic Morphology of SiO2 Films
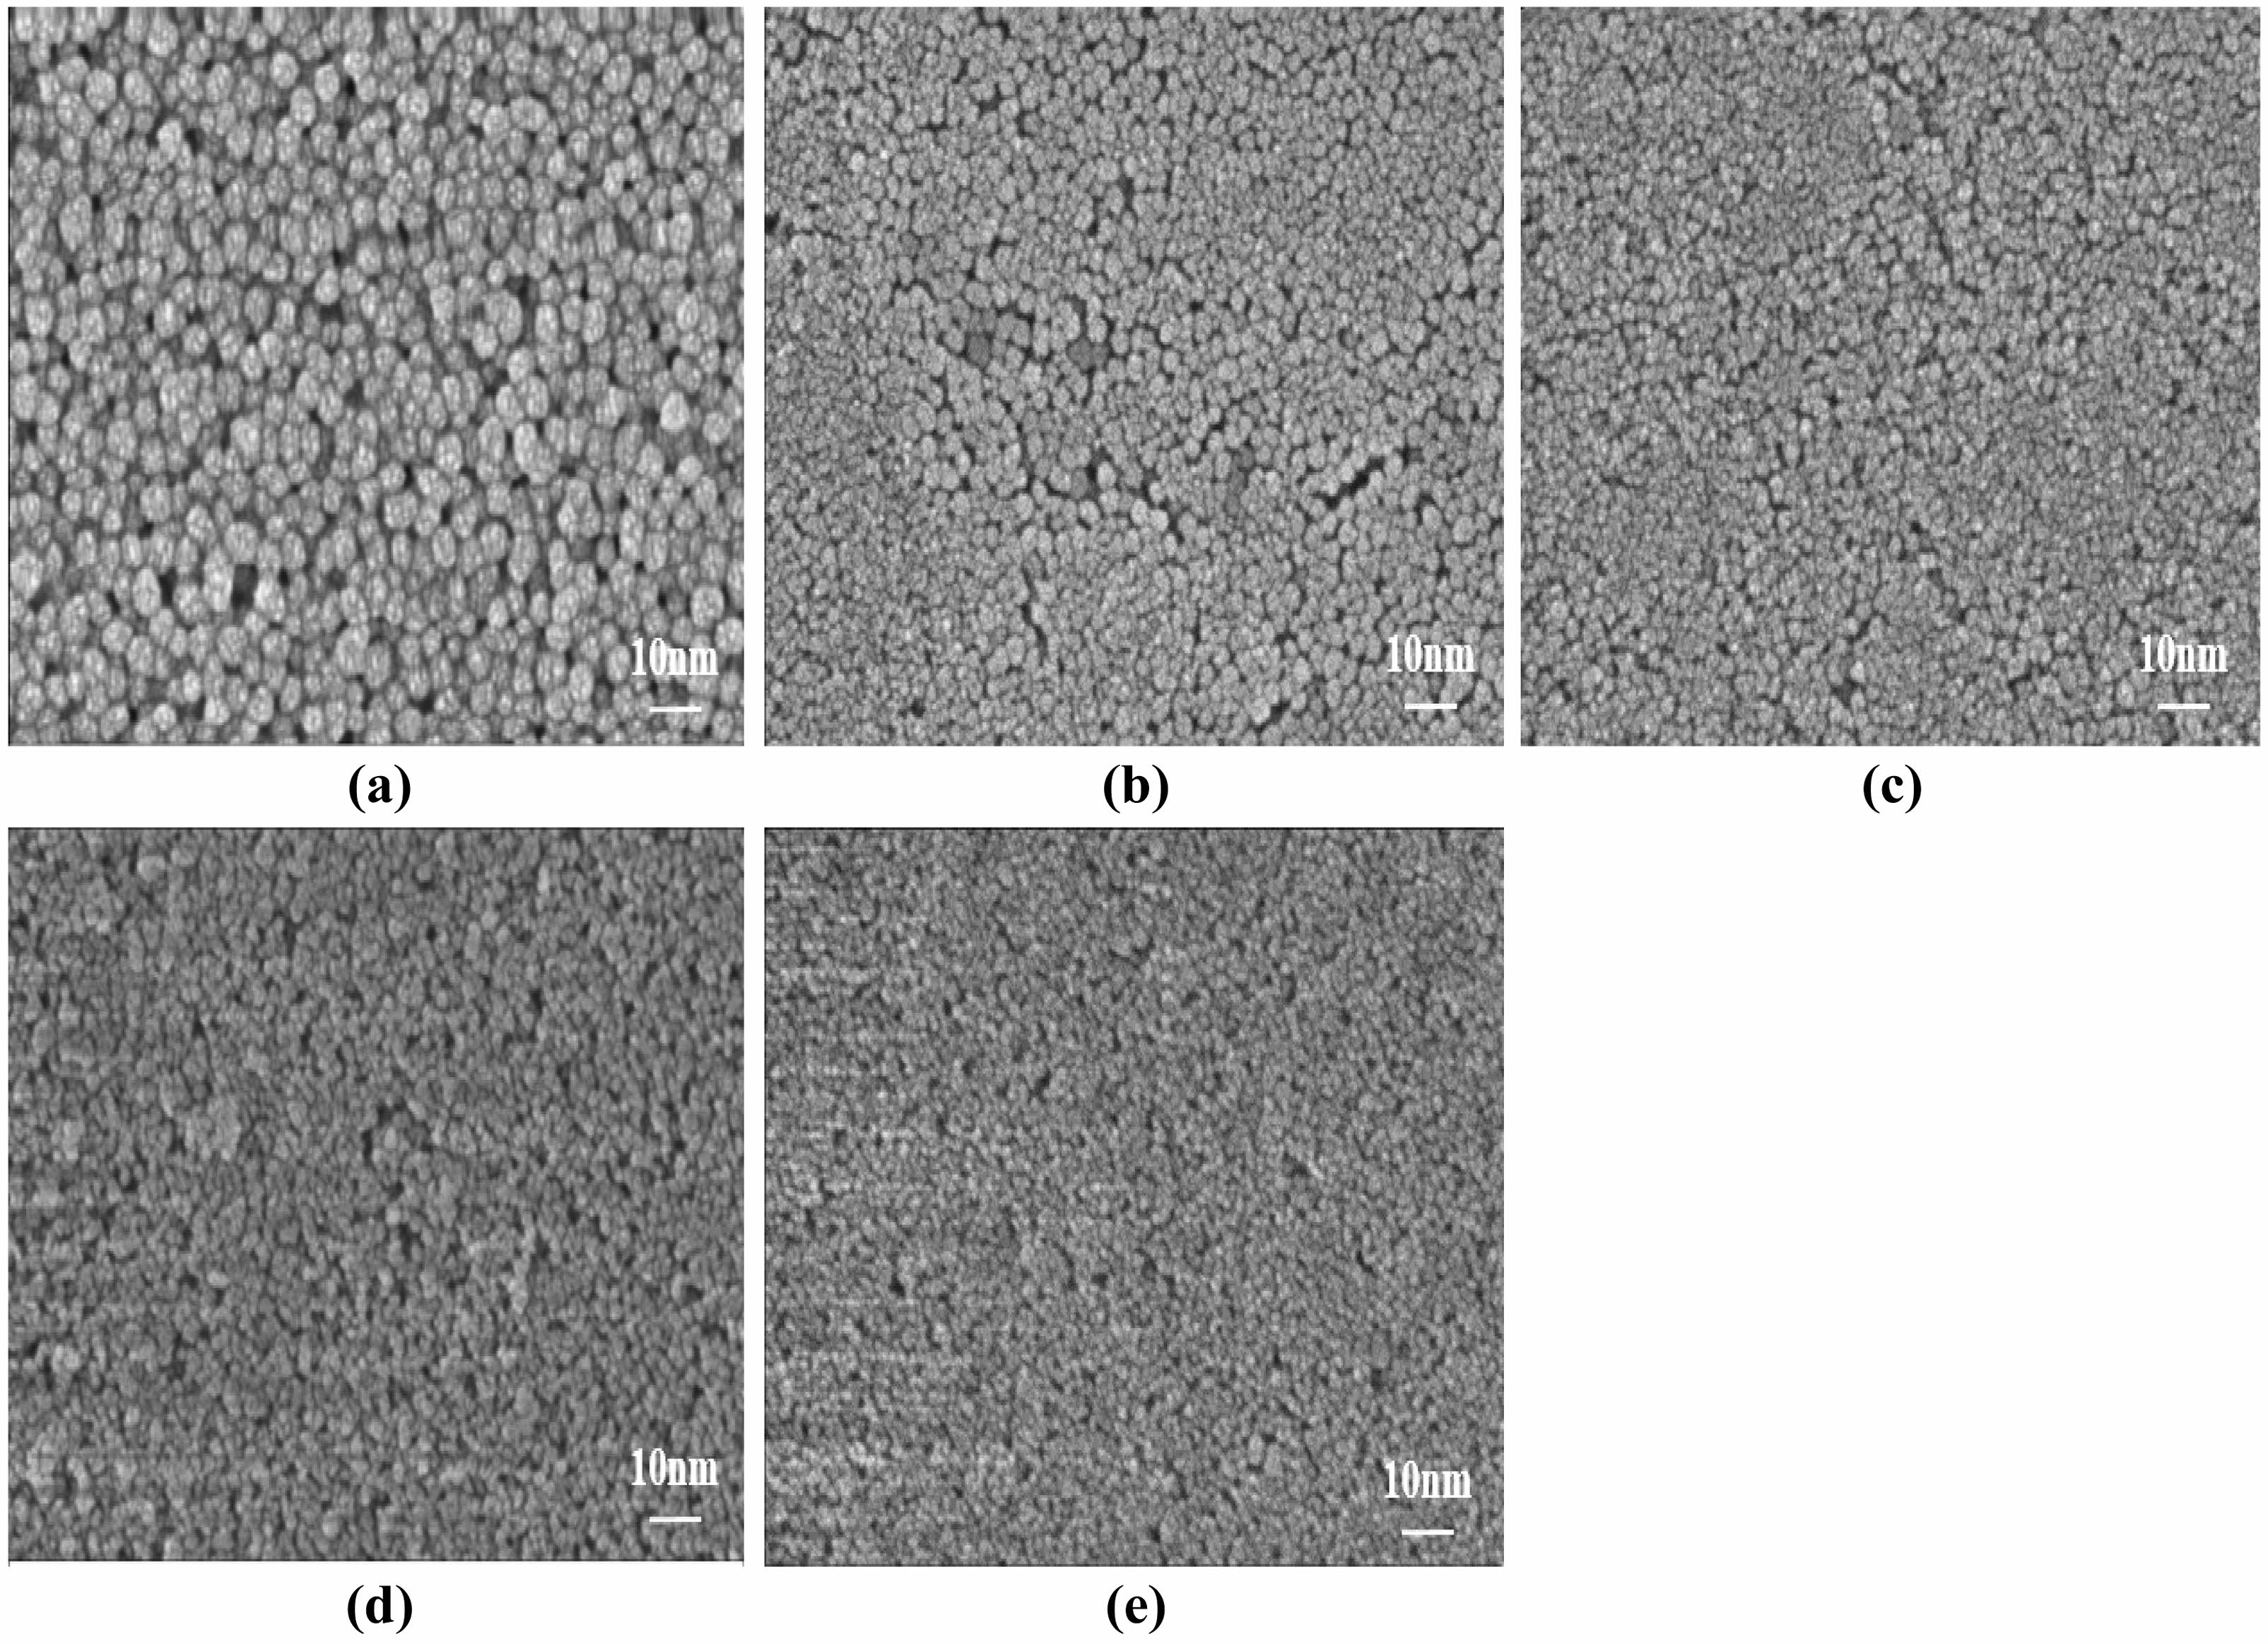
Figure 10 illustrates the impact of MTES addition on the microscopic morphology of the SiO2 films. With the increase in the addition of MTES, the surfaces of the modified SiO2 films gradually became dense and the SiO2 particle size tended to decrease. The surface particle size distribution was consistent, with no significant variation observed. The films were all formed by flat SiO2 particles and contained a small number of cracks. In the preparation of SiO2 sols using ammonia as a catalyst, in the hydrolytic condensation of TEOS, and the hydrolysis reaction of MTES, Si-OH was present on the surfaces of SiO2 particles generated by TEOS, which condensed with the (CH3)3-Si-OH generated by the hydrolysis of MTES. When the Si-OH underwent the condensation reaction, the surfaces of the SiO2 particles were completely encapsulated so that the size of the particles no longer increased. However, the continual addition of MTES increases the presence of (CH3)3-Si-OH, resulting in a rapid condensation reaction, causing the nano-SiO2 particles to be wrapped by -Si(CH3)3 groups at a relatively early age and unable to continue growing [28].
Contact Angle of SiO2 Films
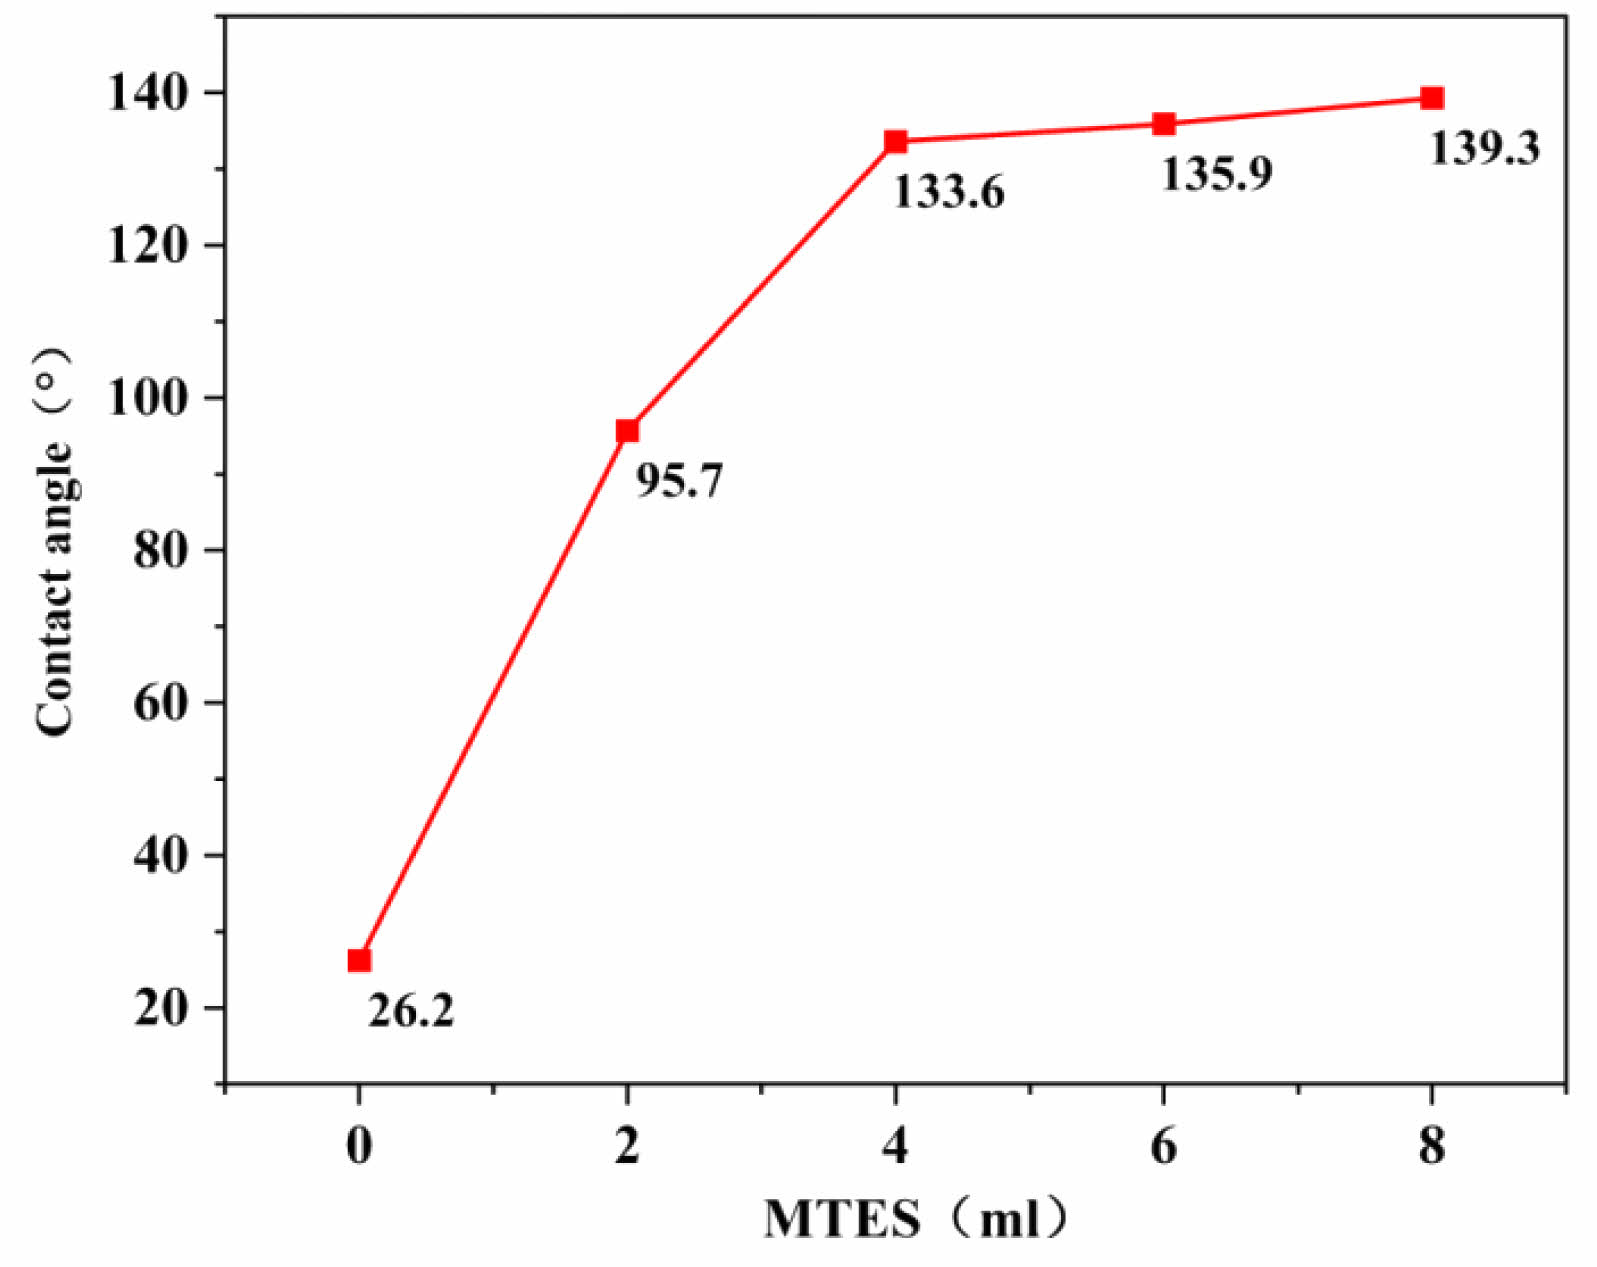
Figure 11 depicts the relationship between MTES addition and the contact angles of the SiO2 films. It can be seen that as the MTES amount increased, the contact angle of the film increased. The contact angle escalated from 26.22° to 139.3° when the amount of MTES added was increased from 0 mL to 8 mL. It can be seen that the properties of SiO2 sol gradually changed from hydrophilic to hydrophobic with the increasing amount of MTES addition. Modified ceramic membranes are more effective for oil–water separation. The rate of increase in the contact angle was faster when a small amount of MTES was added, while the contact angle increased less significantly when the amount added was more than 4 mL. Overall, the addition of MTES improved the contact angle of the films and optimized the hydrophobicity of the film. However, there was only a small increase in the contact angle of the films when too much MTES was added. Notably, after increasing MTES from 6 mL to 8 mL, the contact angle was almost unchanged, and the membranes with an 8 mL MTES addition were not investigated in the subsequent tests.
Roughness of SiO2 Films
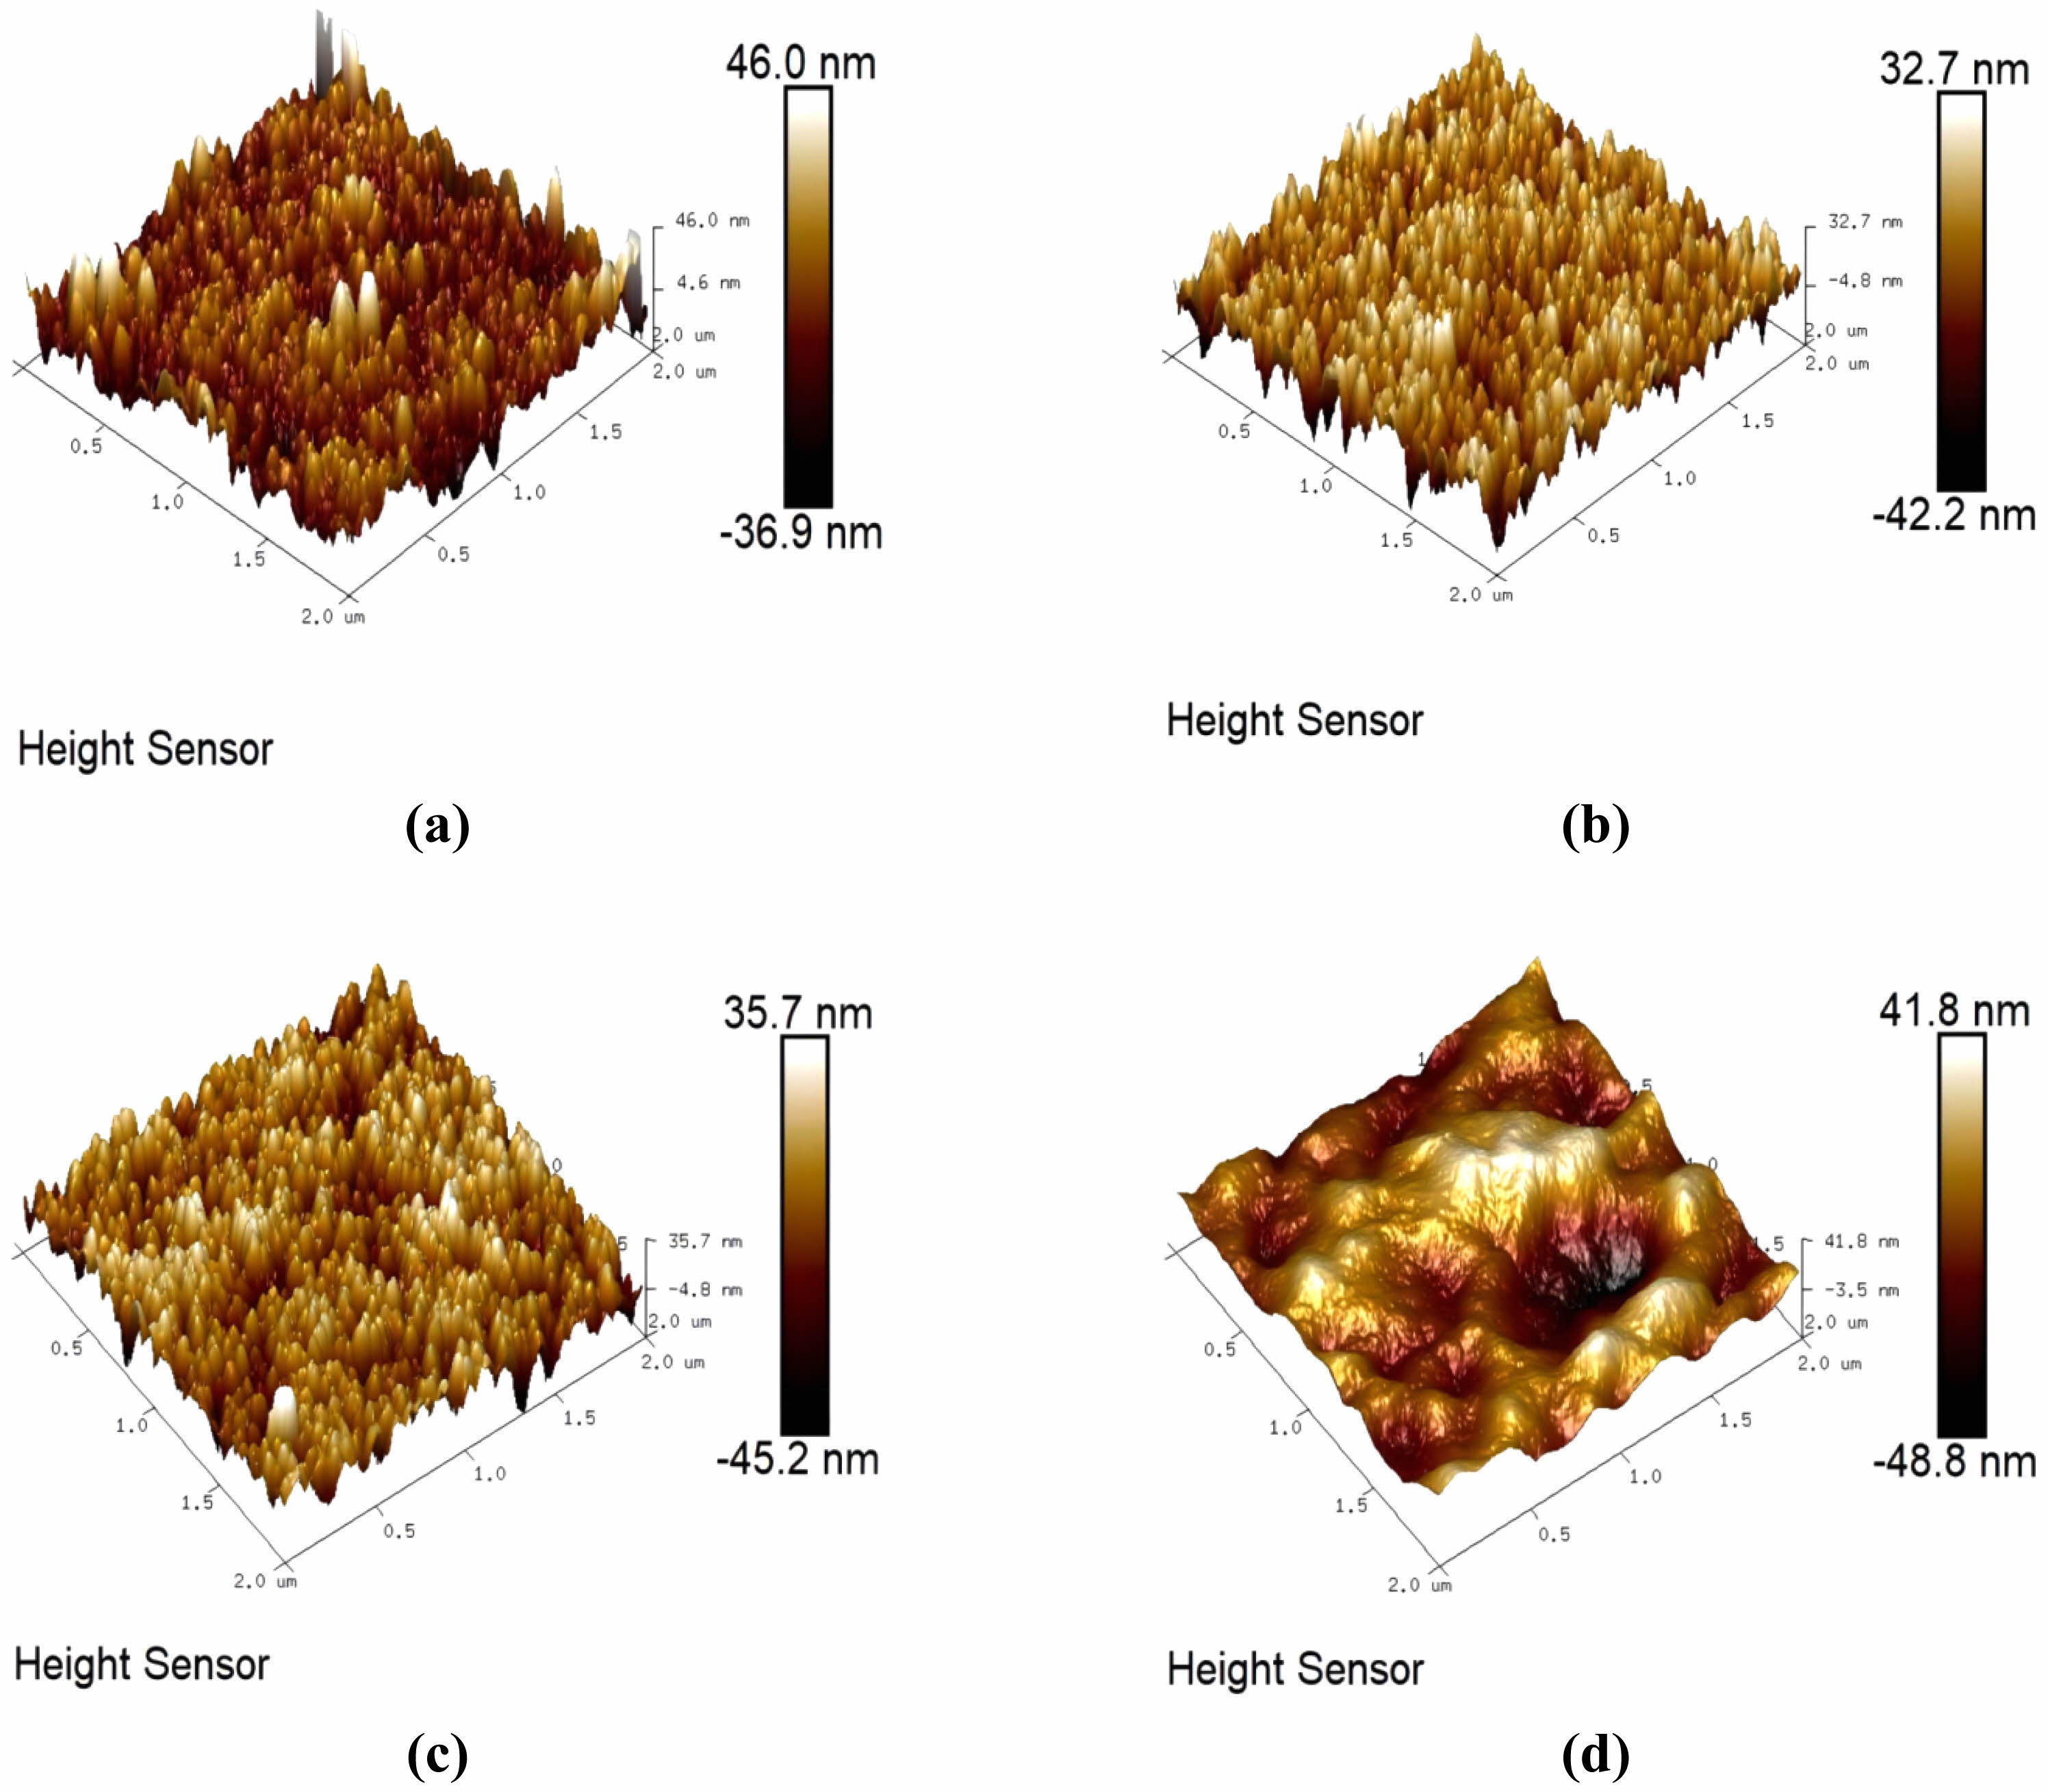
Figure 12 shows the 3D morphology of the SiO2 films under different MTES addition conditions. Table 2 enumerates the surface roughness values of the films with different MTES concentrations. As the MTES amount increased, the surface roughness of the films increased slightly, and the Rq of the films was between 10 and 13 nm. In this process, the orderly arrangement of nano SiO2 particles makes the film flatter. The results are the same as those shown in Fig. 9.
The SiO2 Films’ Modification of the Ceramic Membrane Support
Effect of the Number of Coating Times on the Properties of Ceramic Membranes
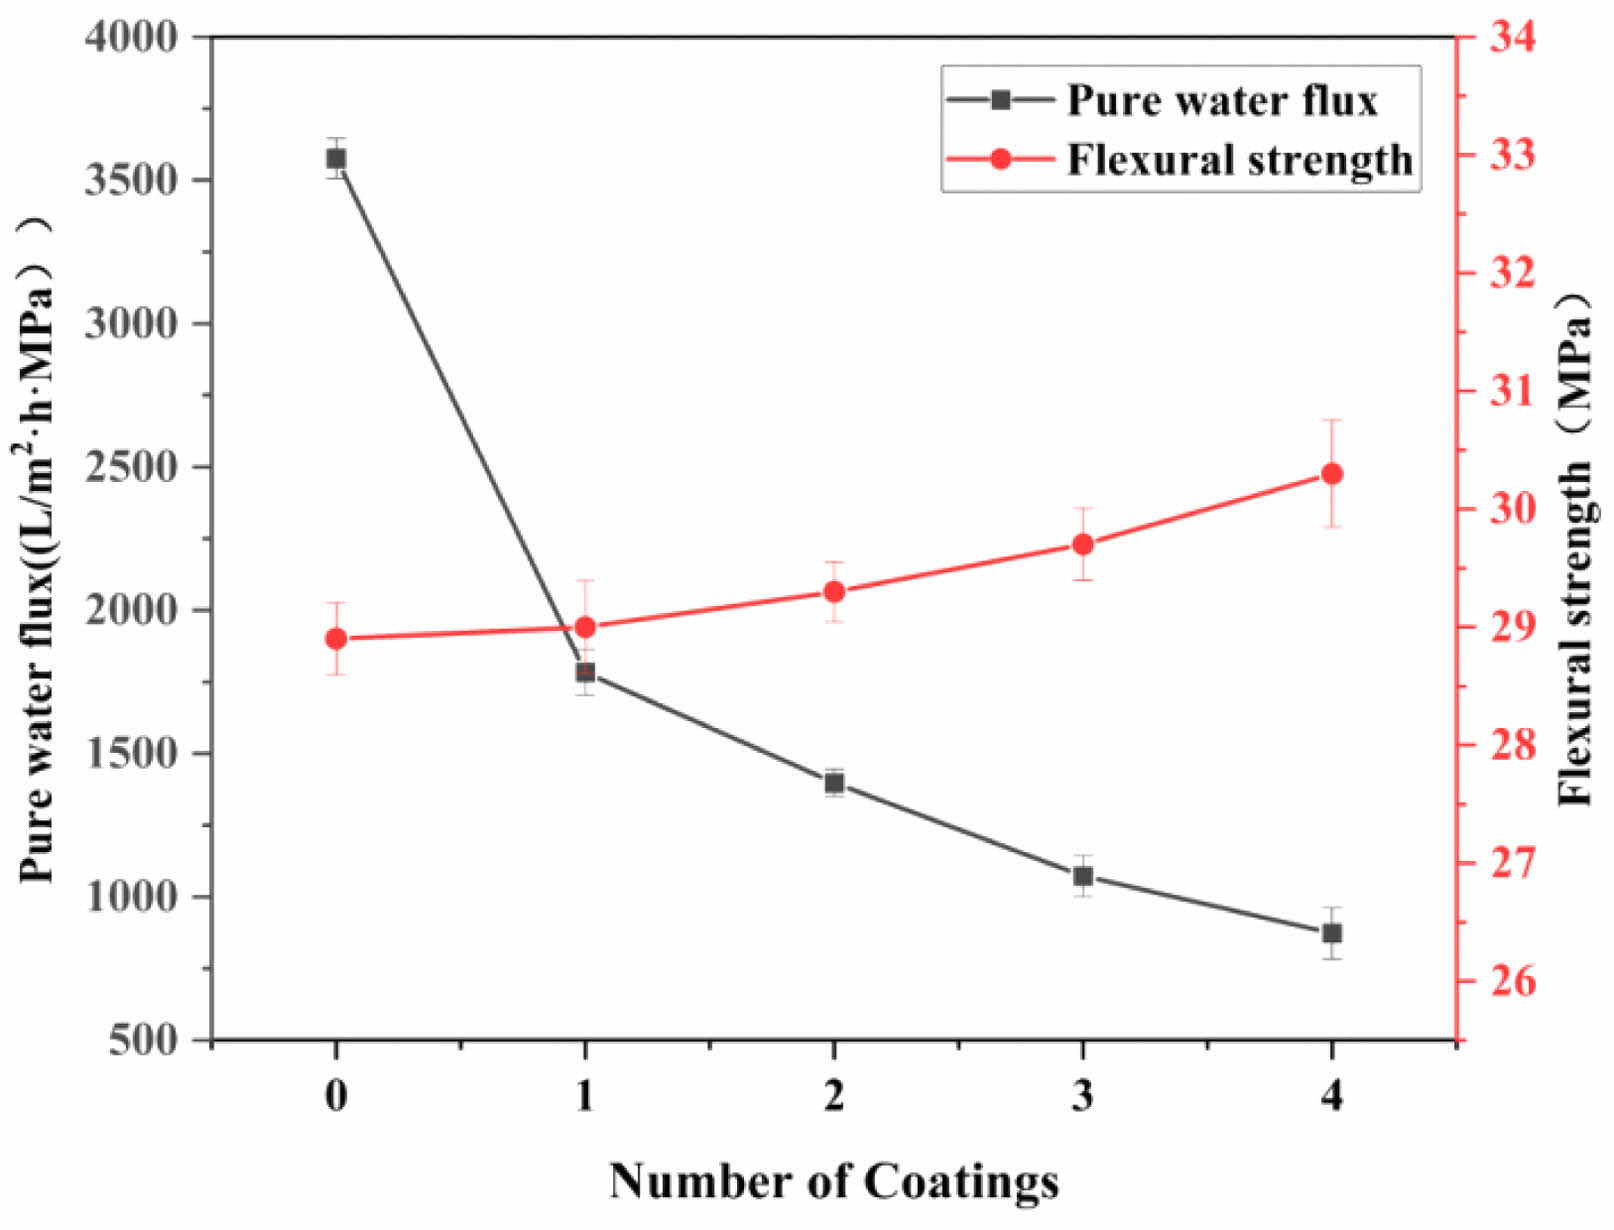
The fabrication of ceramic membranes using the impregnation dip-coating method often requires multiple coatings to achieve a uniform and complete membrane layer, as single coatings typically fail to cover all defects [29]. This approach aims to create an ideal membrane layer to enhance separation accuracy. If the film is too thick, this will affect the flux of filtrates and reduce its filtration effect. Fig. 13 shows the effect of the coating number on the ceramic film properties. In this study, the film thickness was controlled, and the integrity of the film layer was improved by impregnation for 20 s with lifting–coating–drying, followed by repeated coating. The results showed that the pure water flux of the ceramic membrane experienced a decreasing trend with the increase in the number of coating times, while the flexural strength did not change noticeably. After four steps of coating, the pure water flux of the ceramic membrane decreased to 872.6 L/(m2·h·MPa), which was 75.6% lower than that before coating. In summary, while multiple coatings improve membrane surface integrity, they also increase layer thickness and reduce flux. Therefore, the optimal coating was chosen to be two coats.
Microscopic Morphology of Ceramic Membranes
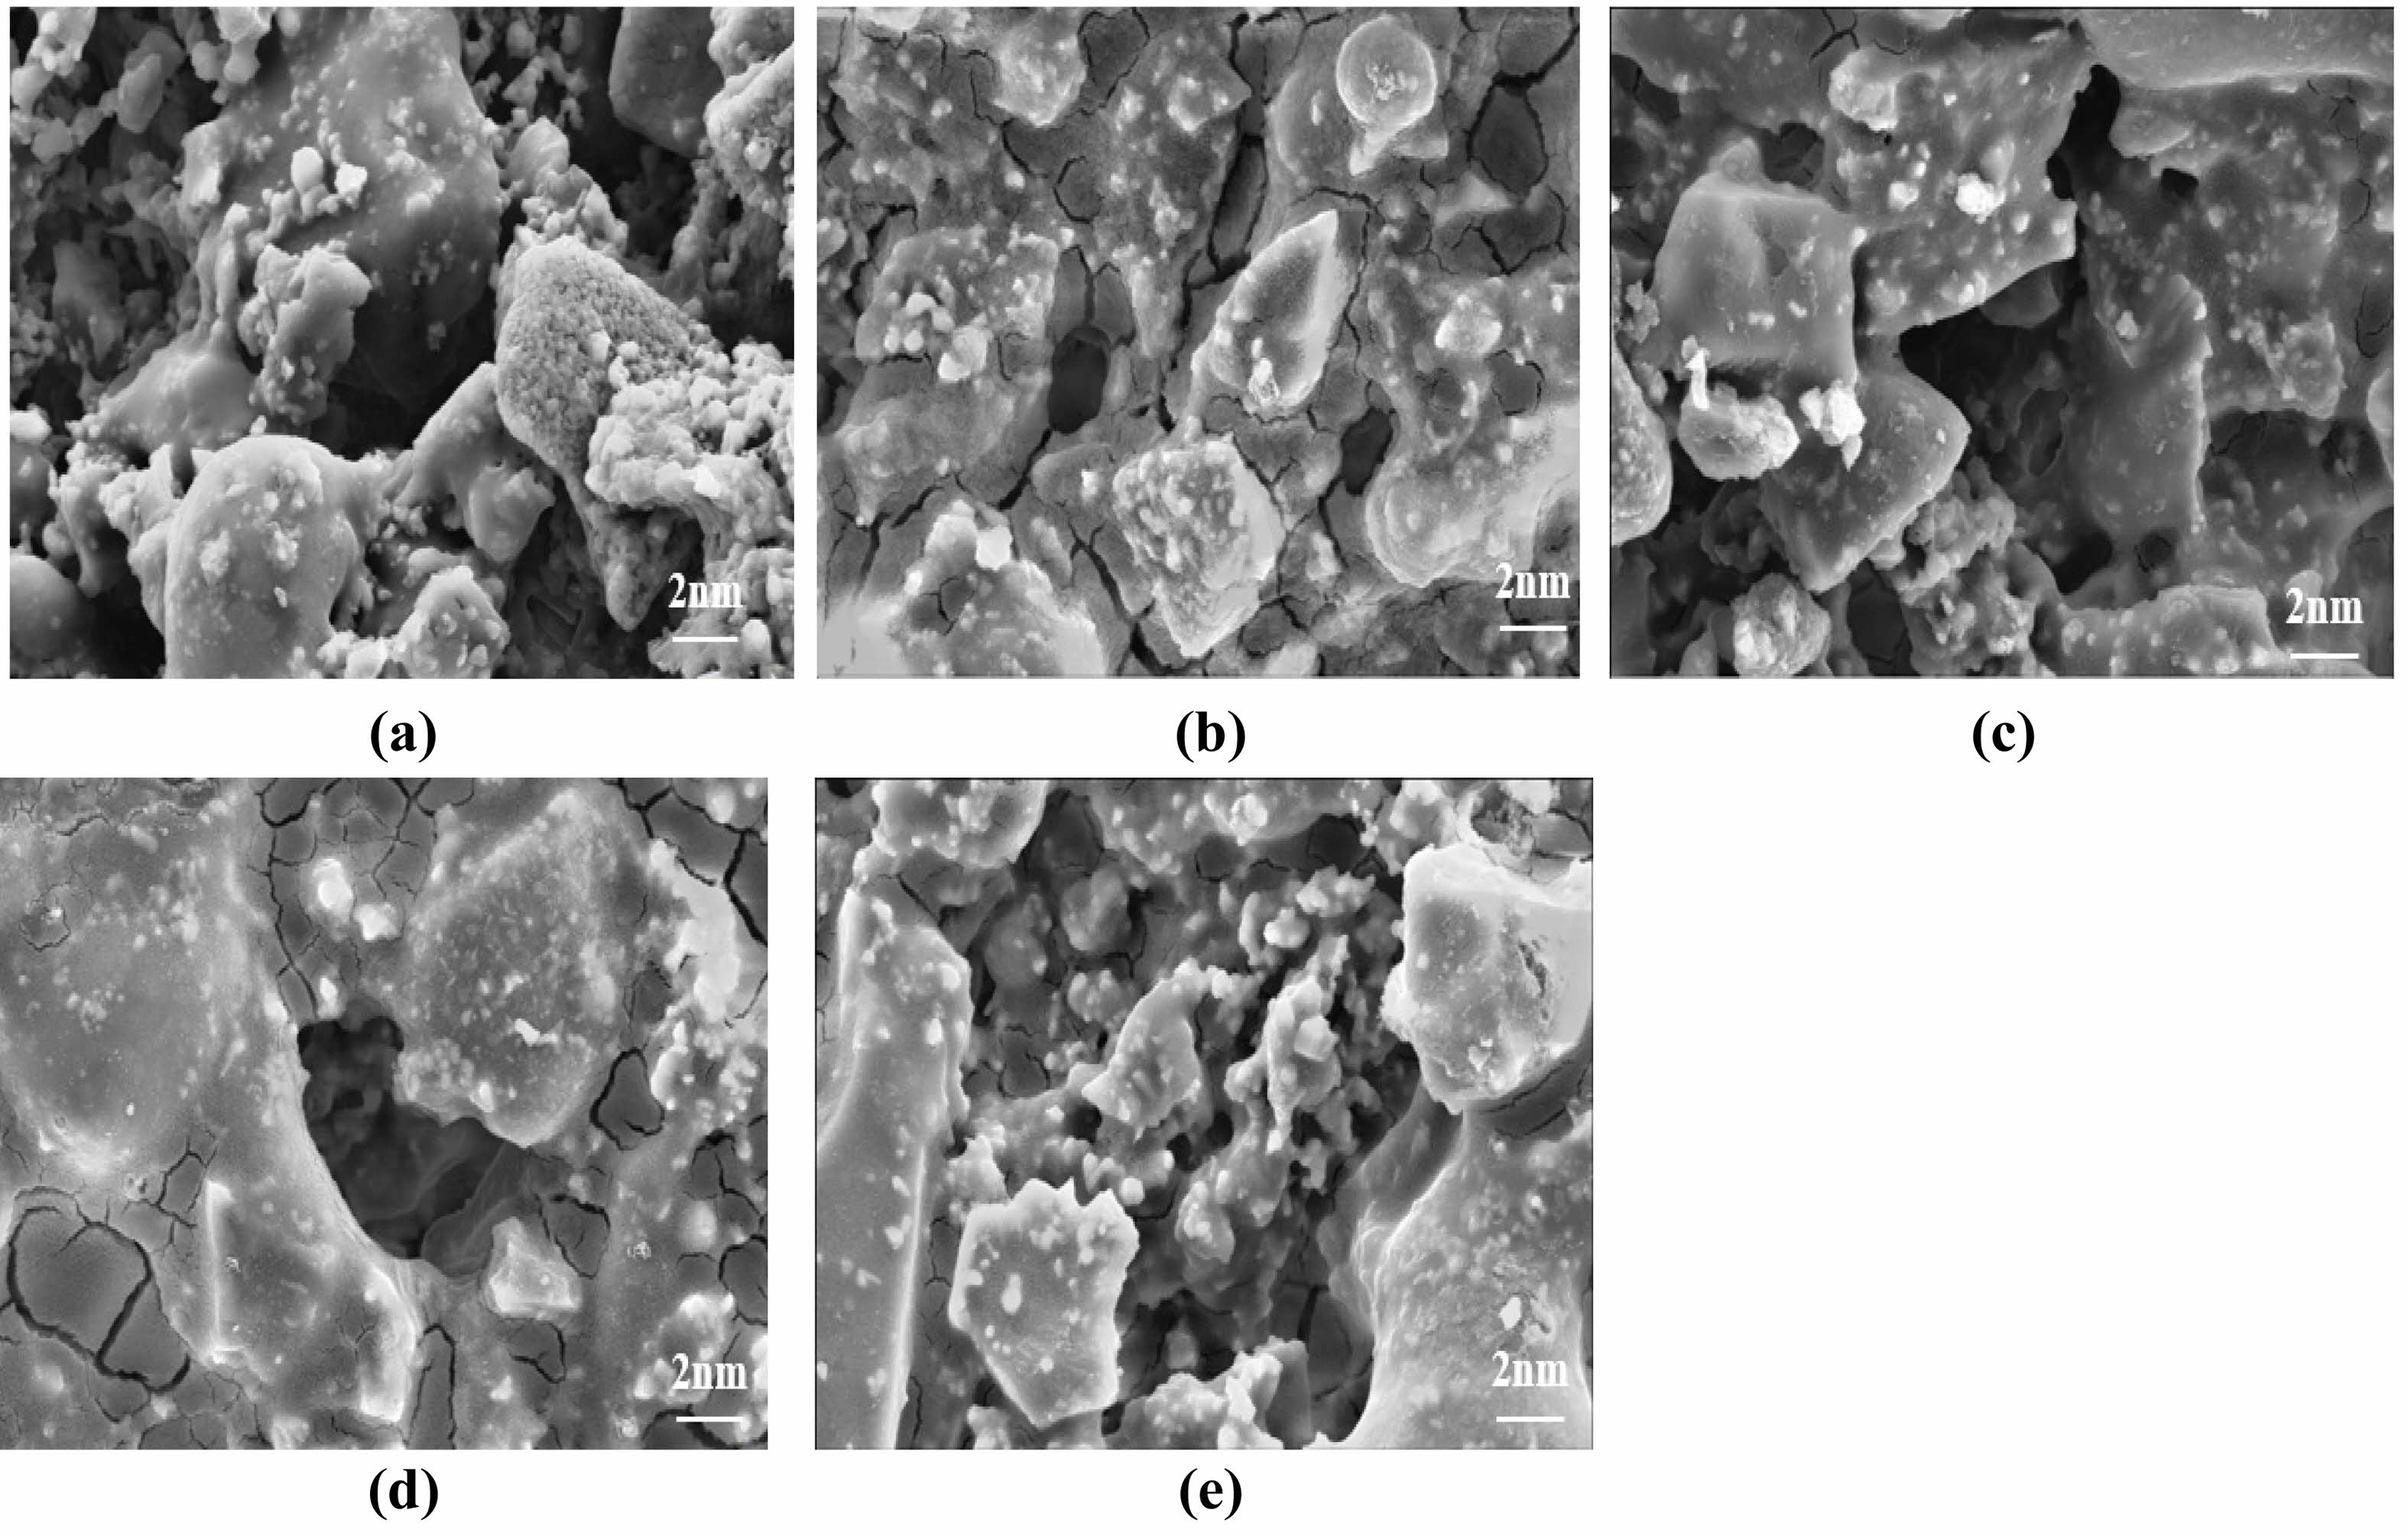
Previous studies have shown that films gradually increased as the number of coats increased [30]. Fig. 14 shows the influence of the coating number on the micromorphology of the ceramic film. Membrane integrity is best achieved when the number of coats reaches two. Additional coatings beyond this point often result in film cracking and peeling of the film layer due to excessive thickness. With a single coating, nano-SiO2 particles began to form on the support surface, but their distribution was noticeably uneven. After increasing the coating number to two, the number of SiO2 nanoparticles on the surface of the support increased significantly. However, it was observed that the distribution of the particles was not homogeneous and there were some areas around the formed holes that were not covered by the silica nanoparticles. In this case, the absence of -OH bonds on the holes of the support reduced the reaction between the -OH bonds in the sol–gel solution and the -OH on the substrate [31]. The effect of coating number on the support demonstrated that homogeneity of nano-SiO2 particles can be achieved through layering [32].
Effect of Calcination Temperature on the Properties of Ceramic Membranes
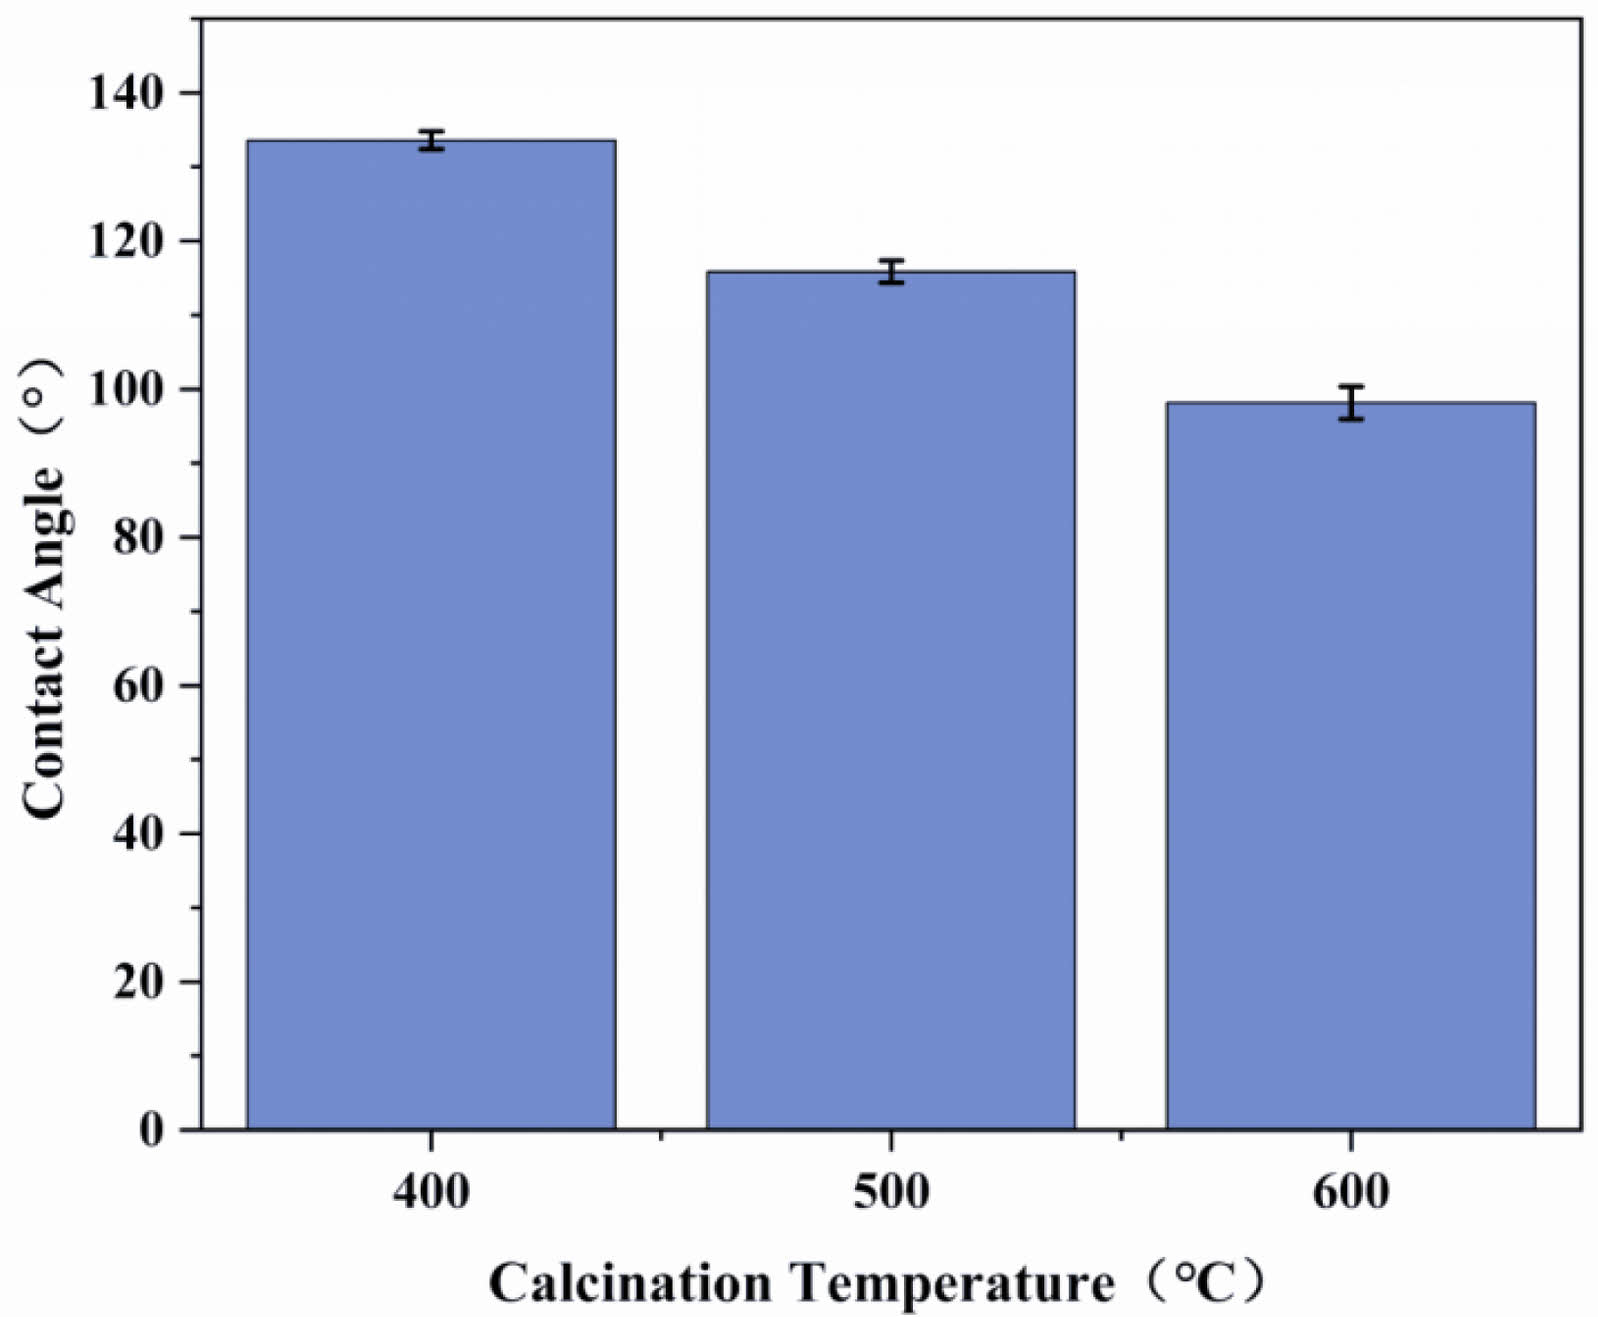
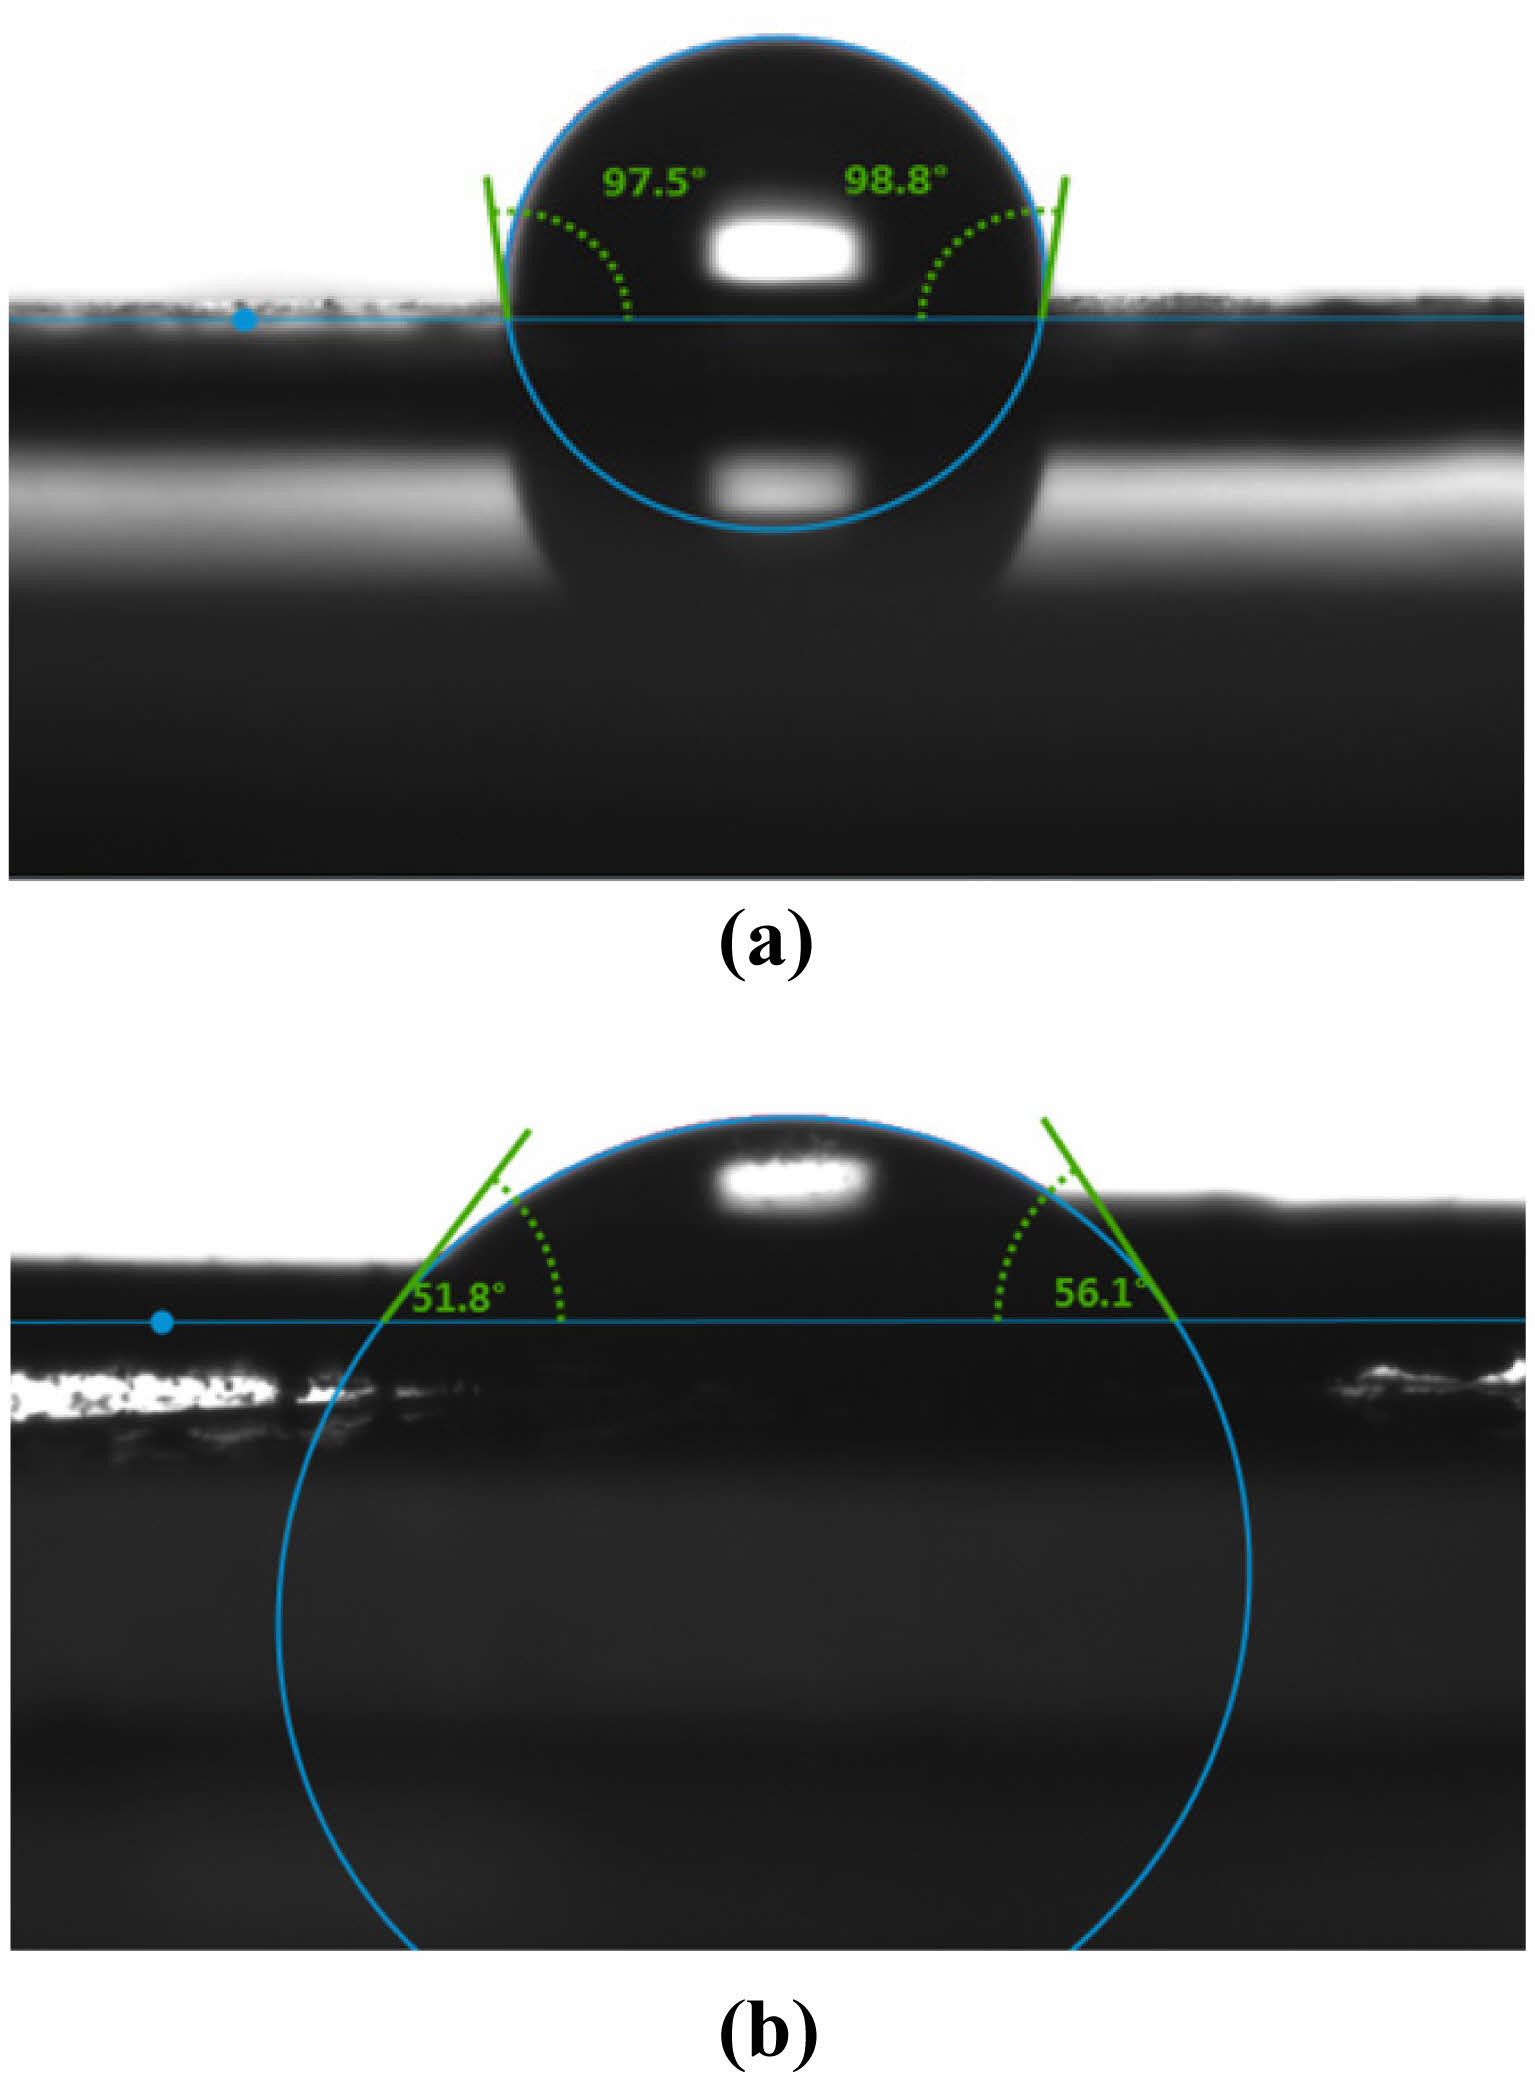
To investigate the effect of the calcination temperature on the wettability of the composite film’s surface, an experiment was carried out to measure the contact angle of the ceramic films prepared under the conditions of two coating times and calcination temperatures of 400, 500, and 600°C, as shown in Fig. 15. The results show a gradual decrease in contact angle from 133.6° at 400°C to 98.15° at 600°C. Moreover, when the contact angle test was performed on the ceramic membrane calcined at 600°C, it could be observed that the water droplets did not remain stationary but started to penetrate the support after 10 s, as shown in Fig. 16. According to Darmawan A. et al. [33], the methyl groups in the silica sol start to oxidize at 500°C, leading to reduced hydrophobicity. The silica layer starts to lose its hydrophobicity above 550°C due to the oxidation of methyl and other organic groups.
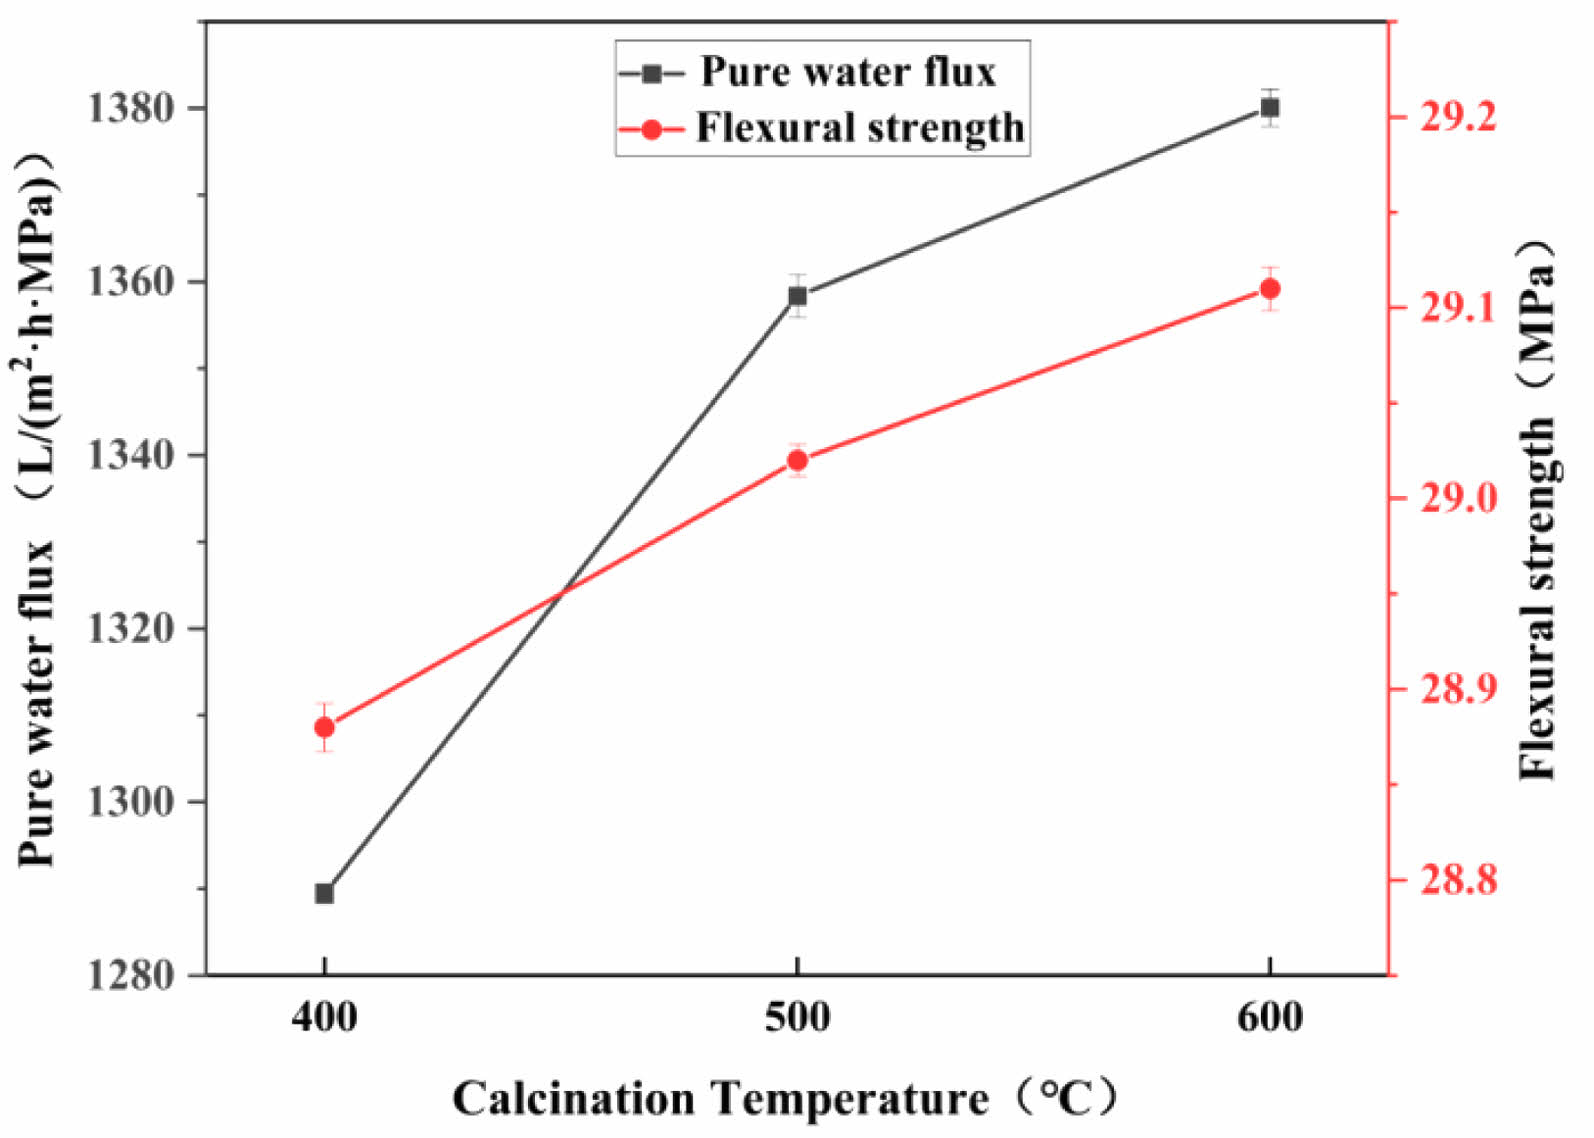
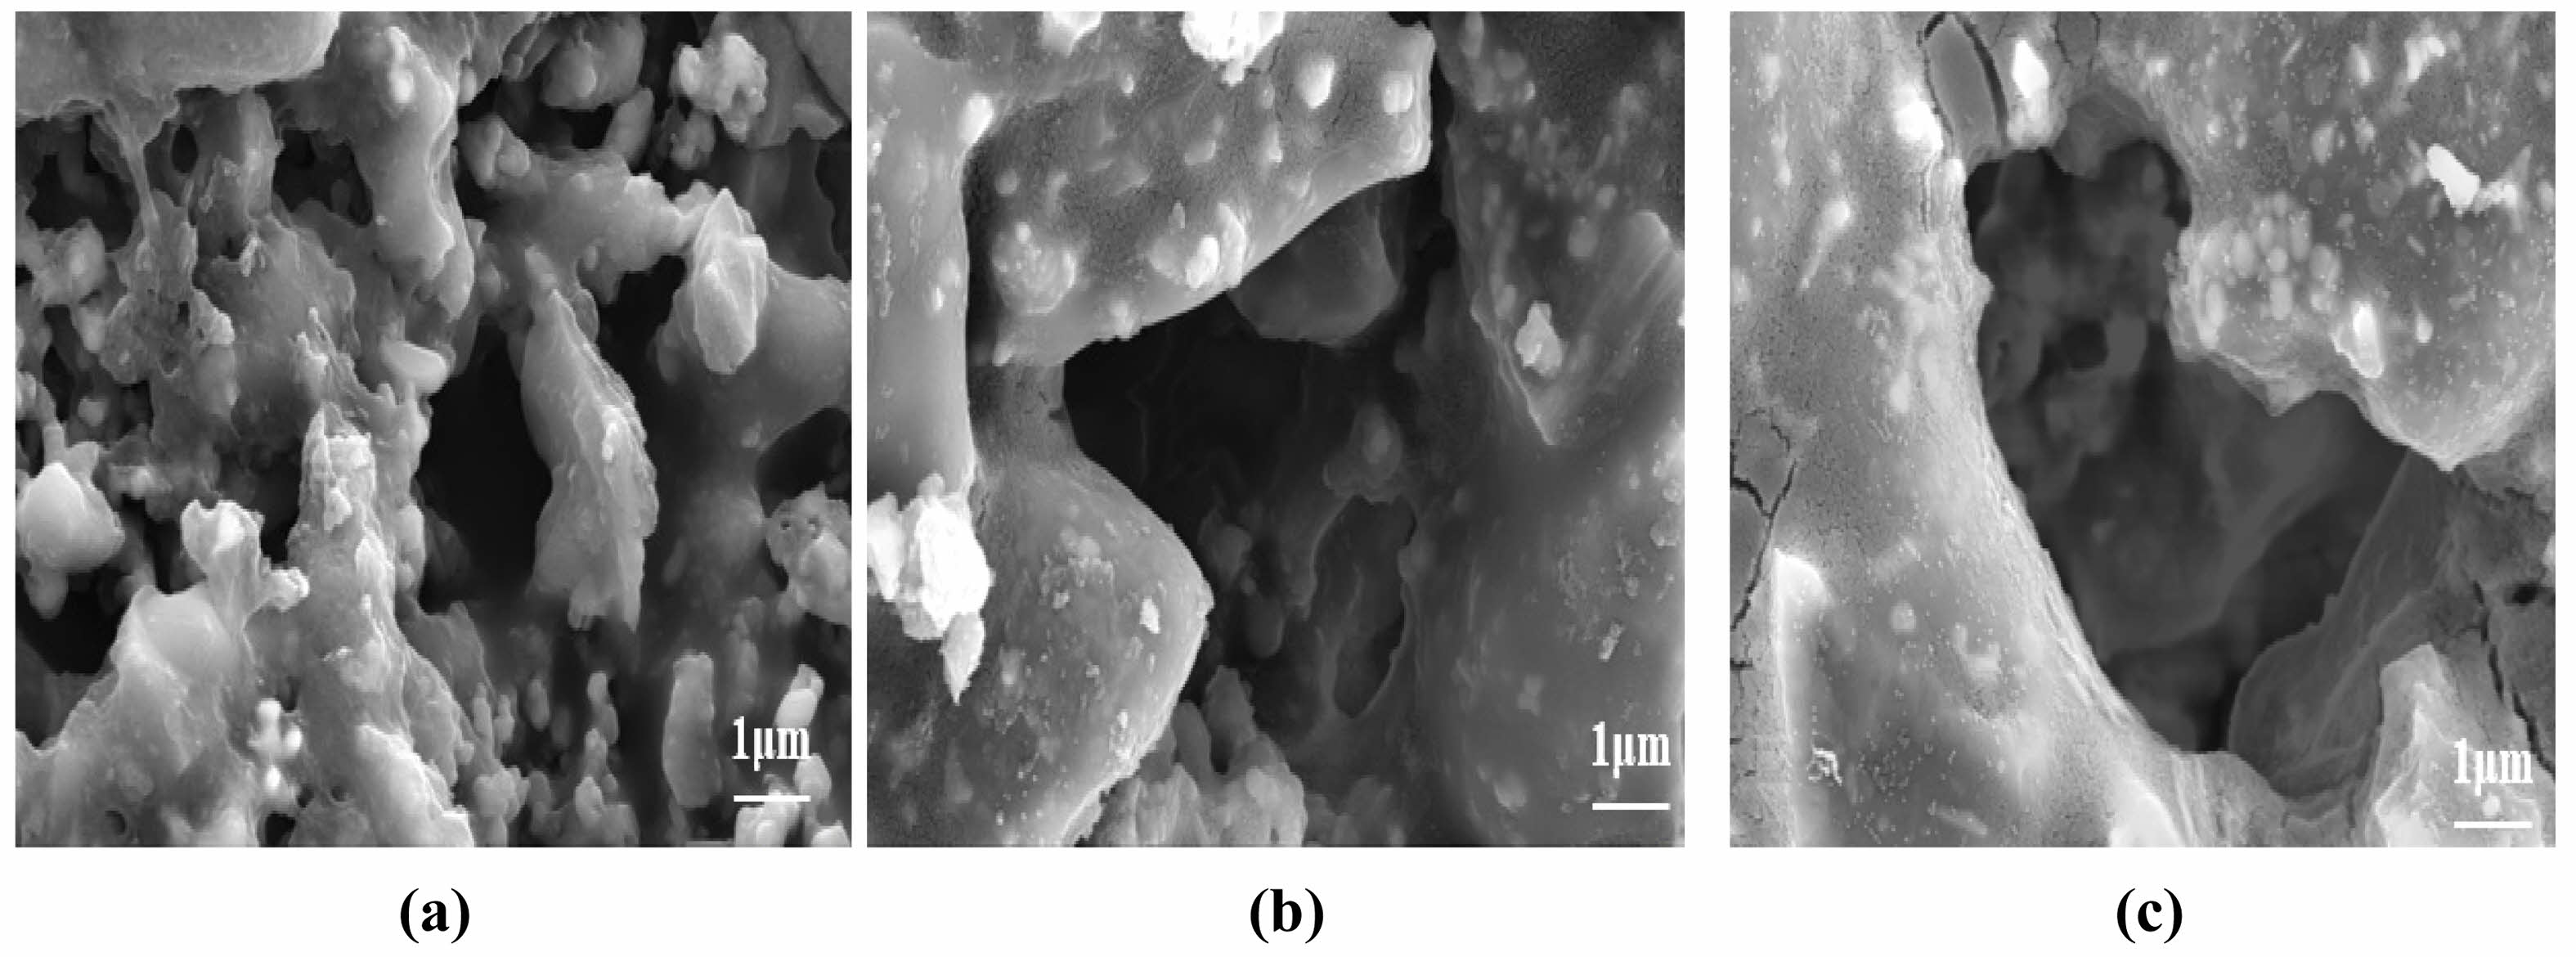
Figure 17 shows the effect of different calcination temperatures on the pure water flux and flexural strength of the ceramic membranes. It can be seen that the pure water flux increases with the increase in the calcination temperature, and the pure water fluxes at 400, 500, and 600°C calcination are 1289.43, 1358.36, and 1380.10 L/(m2·h·MPa), respectively; this trend is related to the distribution of the nano-SiO2 particles on the surface of the support. As shown in Fig. 18, the SiO2 particles on the membrane surface under calcination at 400°C are more uniformly distributed, so the pure water flux is the lowest. Moreover, when the nano-silica particles on the surface of the membrane layer begin to decompose, the pure water flux decreases, while flexural strength remains largely unaffected by calcination temperature. With increasing temperature, the decomposition of methyl groups on the membrane surface leads to the formation of cracks.
Performance of SiO2-Modified Ceramic Membranes
Effect of the Number of Coatings on the Performance of Ceramic Membranes
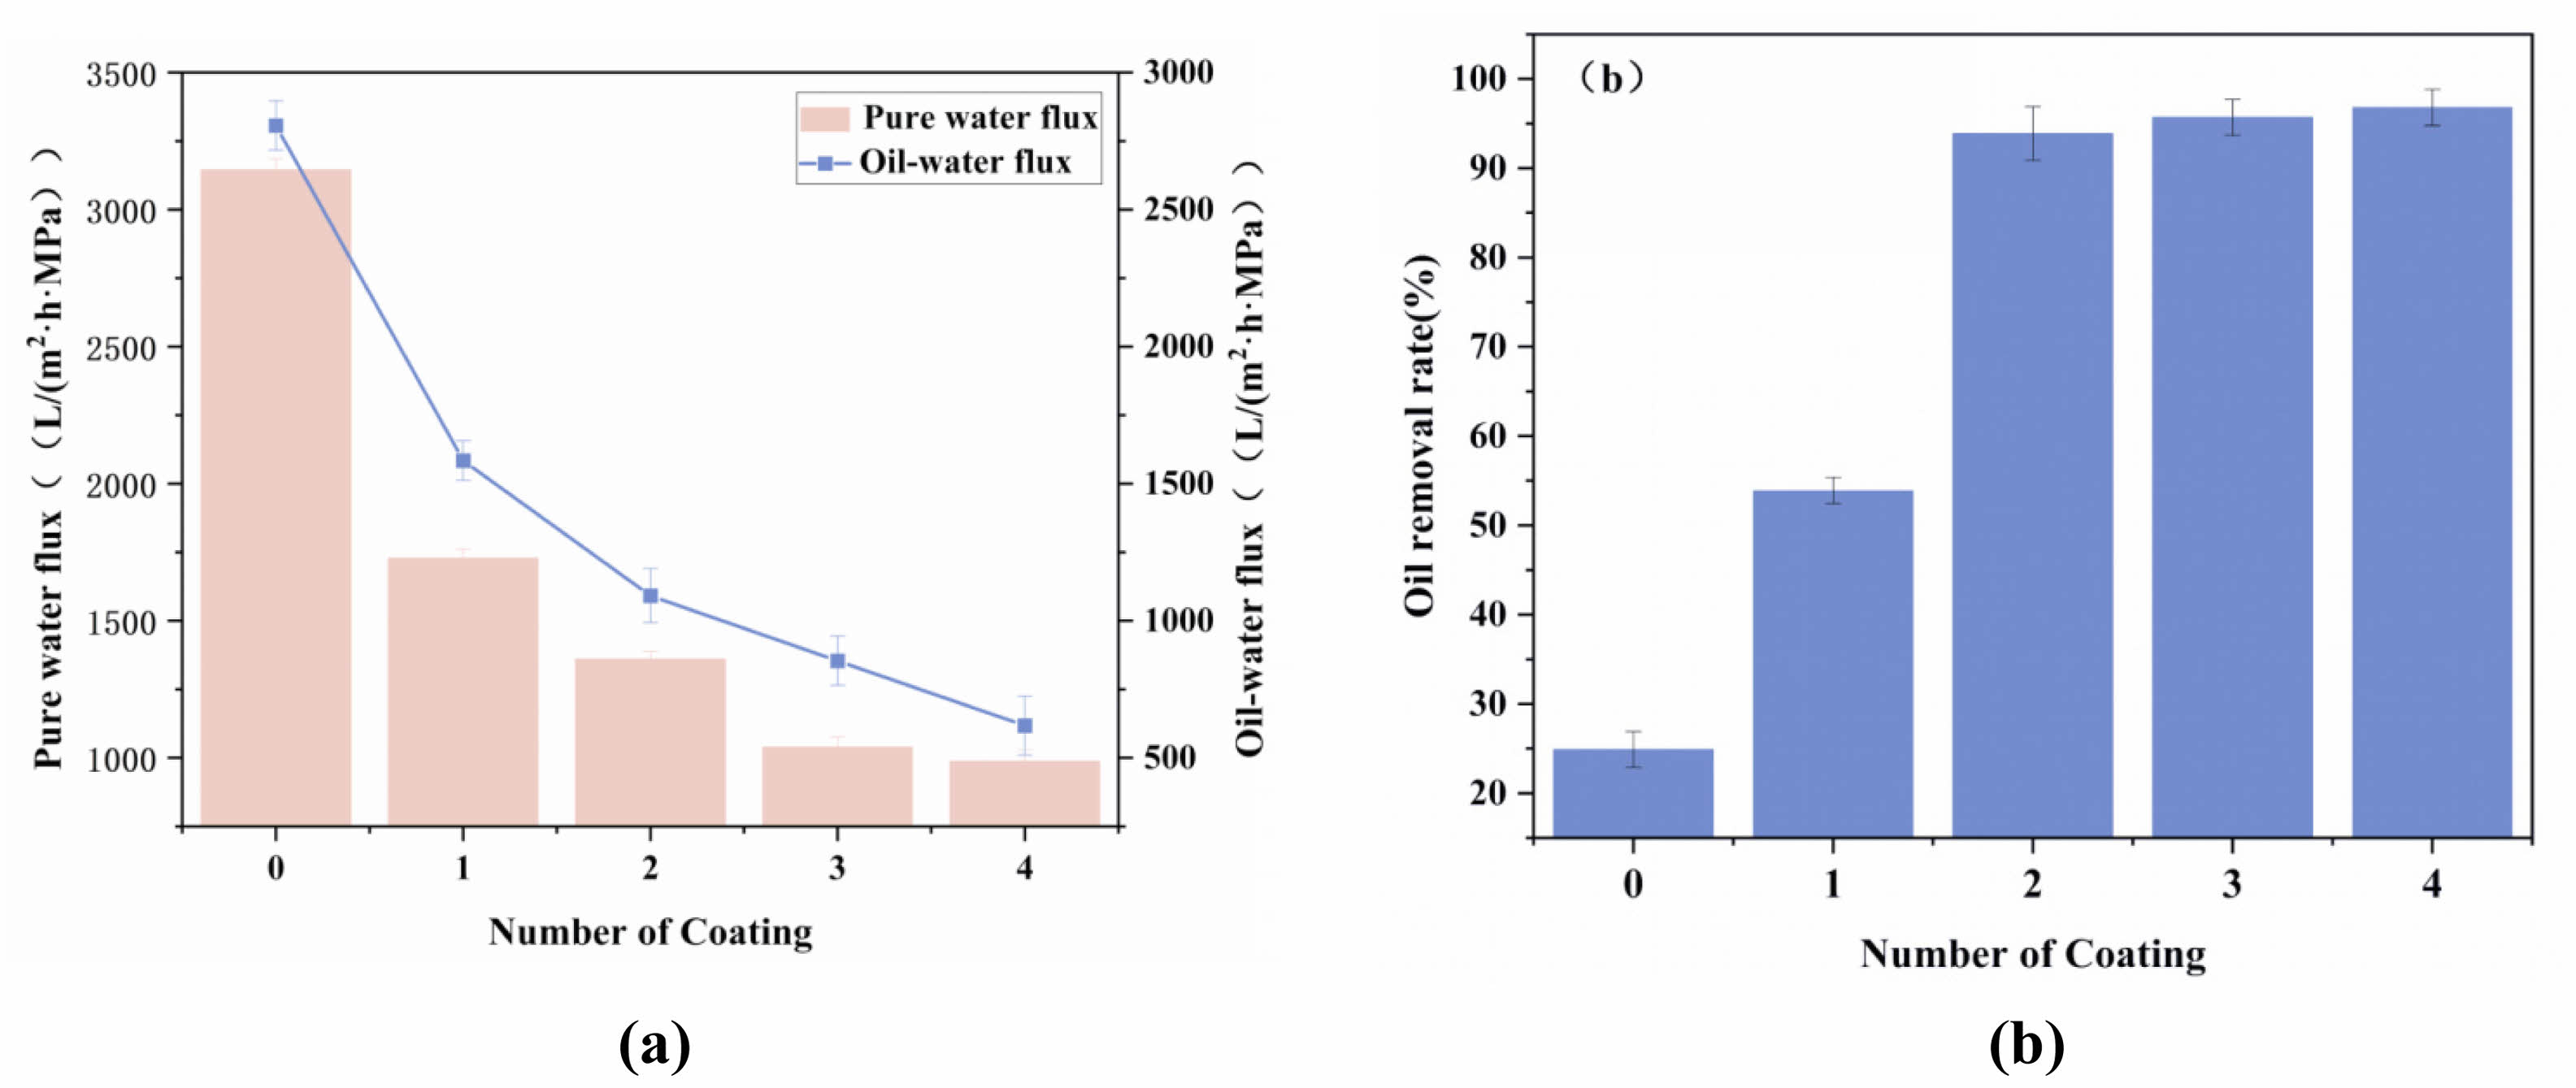
In this study, the ceramic membrane support underwent ultrasonic cleaning prior to modification with SiO2 membranes, aiming to ensure the integrity and homogeneity of the membrane layer. Moreover, the specific surface area of the SiO2 membrane was investigated (Fig. S4). The hydrophobic behavior was further evaluated at different numbers of coatings to obtain the oil–water flux and oil removal rate. Additionally, the original support’s impact on oil separation was examined for comparison. Fig. 19 shows the effect of the number of coatings on the performance of the ceramic membranes. With the increase in the number of coatings, both the pure water flux and oil–water flux decreased, and the oil removal increased first and then stabilized. Conversely, coated supports displayed a decreasing trend in oil–water flux, with values of 1728.7, 1360.9, 1040.1, and 988.1 L/(m2·h·MPa) for one, two, three, and four coatings, respectively. When the number of coatings was increased to two, the oil removal rate increased rapidly from 54.2% to 94.1%, and it increased slightly to approximately 1% when the number of coatings was three and four, which was due to the fact that the film layer was already formed completely, and continuing to increase the number of coatings would only result in a decrease in the flux.
Effect of Emulsion Concentration on the Performance of Ceramic Membranes
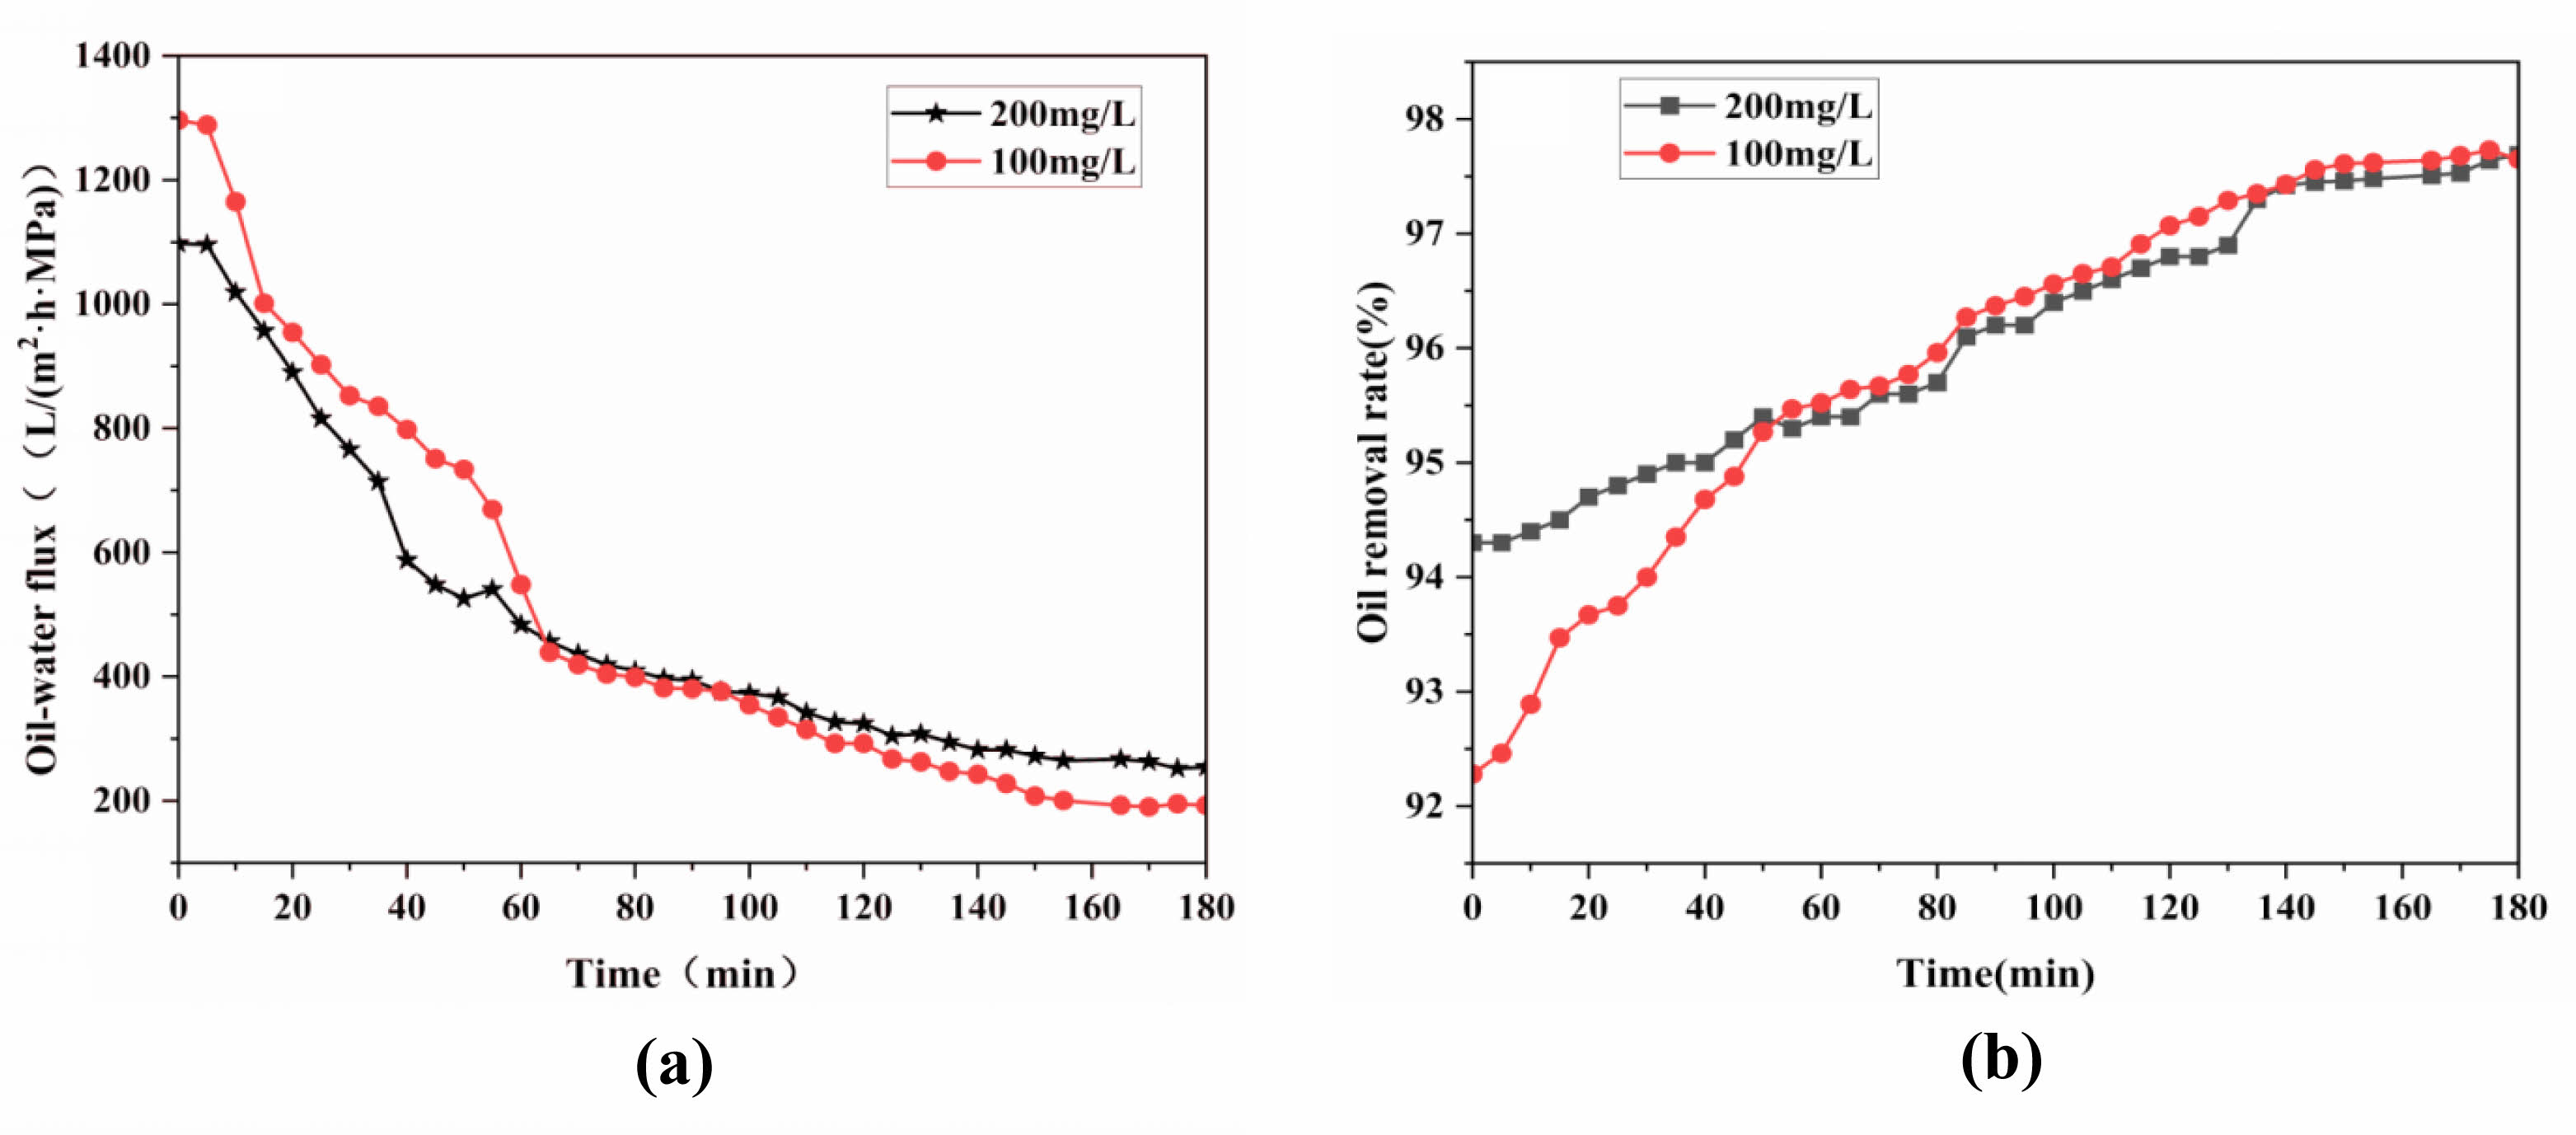
Figure 20 investigates the impact of emulsion properties on the performance of ceramic membranes at 25°C, with filtration pressures set at 0.1 MPa and emulsion concentrations of 100 mg/L and 200 mg/L. From Fig. 20a, it can be seen that the fluxes of ceramic membranes with different concentrations of emulsions all showed a decreasing trend with time; they decreased sharply from 0 to 60 min and then showed a slow decreasing trend after 60 min. Fig. 20b reveals that the oil removal rates initially increase rapidly and then slowly decline over time. This trend is attributed to the reduced average particle size in diluted emulsions. Therefore, the oil removal rate of the ceramic membrane in the initial stage decreases with the decrease in the emulsion concentration; with the increase in time, the oil removal rate of the ceramic membrane for different concentrations of emulsions gradually tends to stabilize and become consistent.
Regeneration of Ceramic Membranes and Performance Comparison
According to Hermia’s model, the modified membrane is somewhat hydrophobic, and the formation of the filter cake layer is the main contamination mechanism. Fig. 21 is a schematic diagram of the ceramic membrane scaling mechanism. Continuous deposition of oil droplets forms the cake layer, and a dynamic balance between cake layer formation and fluid flushing stabilizes the flux.
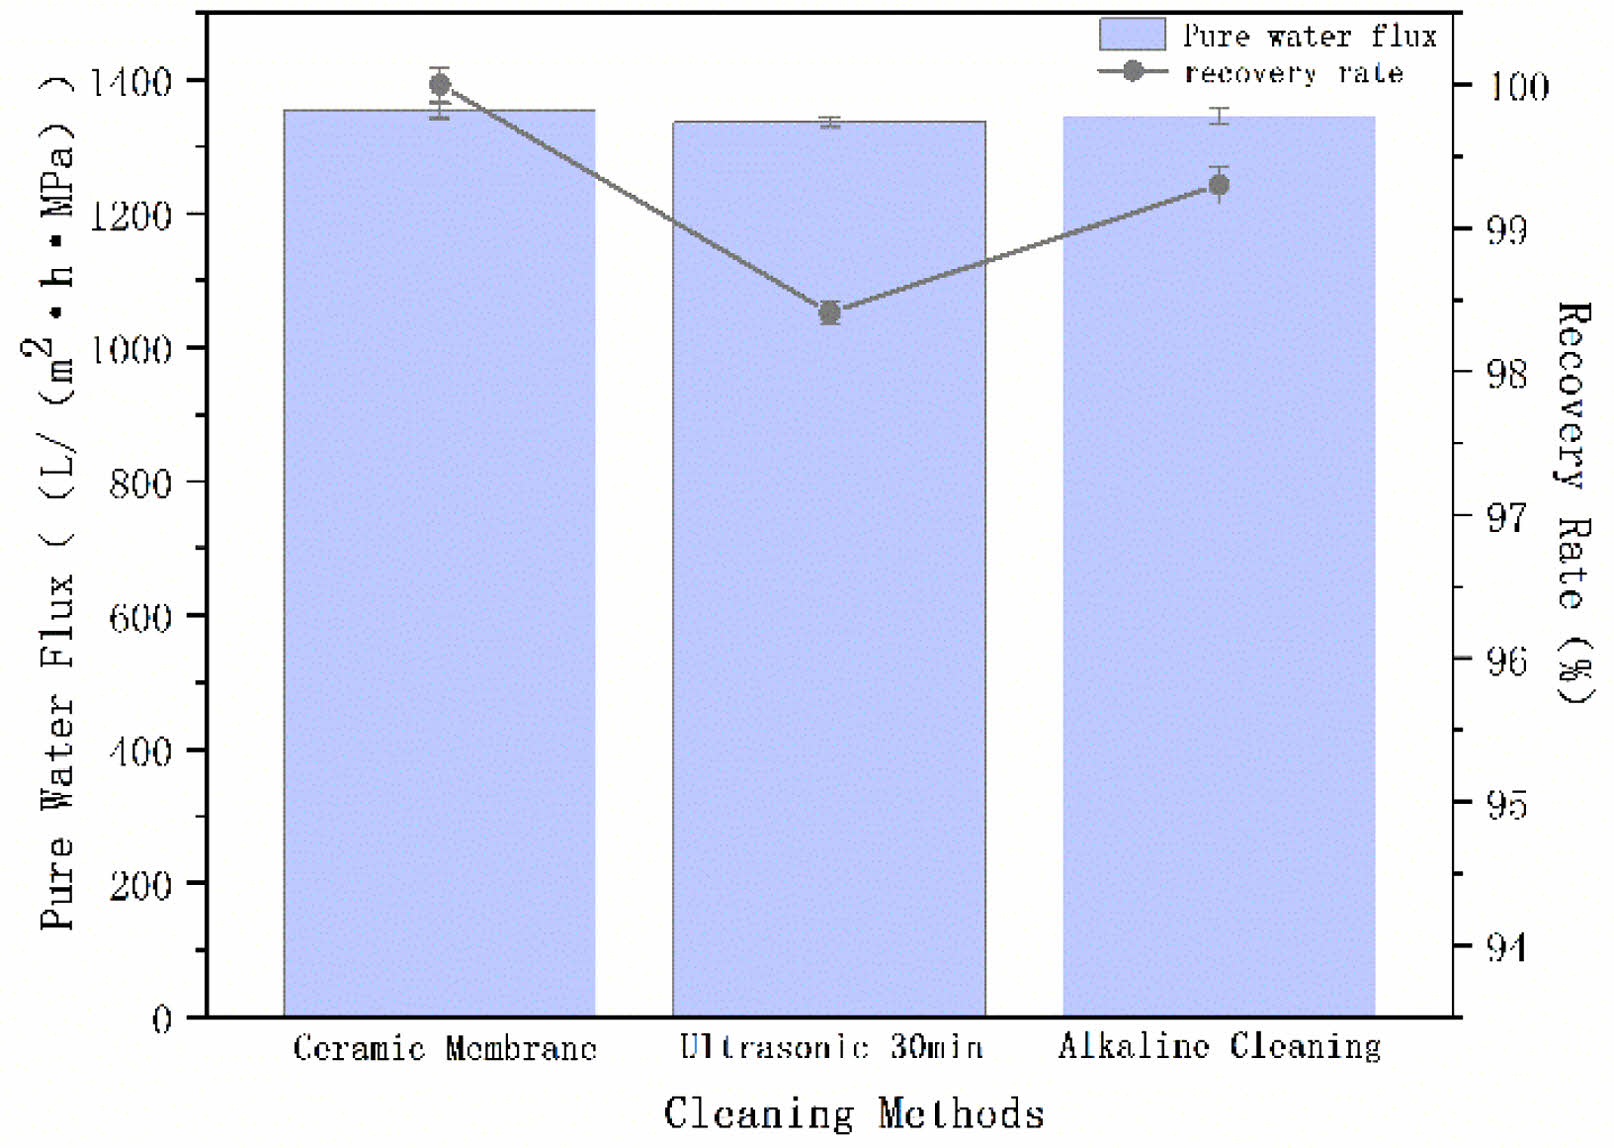
The fouled ceramic membranes were cleaned by ultrasonication for 30 min and alkaline cleaning (soaking with 0.2 mol/L NaOH for 20 min and then rinsing with distilled water). The pure water flux test was performed on the cleaned membrane, and the pure water flux and membrane flux recovery rate are shown in Fig. 22. It can be seen that the pure water flux of the ceramic membrane after ultrasonic cleaning and alkaline cleaning decreased slightly—but the change was not significant—and the recovery rate of the membrane flux for both of them was more than 98%, which indicates the strong regenerative ability of the membrane.
In this study, ceramic membranes were prepared by researching gangue-based inorganic ceramic membrane supports with the dip-coating method in combination with SiO2 membranes. Table 3 shows the comparison of the performance of ceramic membranes in this study with that of the ceramic membranes in other studies. Table 1
|
Fig. 3 Effect of sintering temperature and pore-forming content on the properties of ceramic membrane supports: (a) pure water flux, (b) flexural strength. |
|
Fig. 4 Pore size distribution curve of ceramic membrane support. |
|
Fig. 5 Crystalline phase composition of the support. |
|
Fig. 6 Acid and alkali loss rates of the ceramic membrane supports. |
|
Fig. 7 Microscopic morphology of supports: (a) acid corrosion, (b) alkali corrosion. |
|
Fig. 8 Microscopic morphology of supports: (a) 950°C, (b) 975°C, (c) 1000°C, (d) 1025°C, (e) 1050°C, (f) 1075°C, (g) 1100°C, (h) 1125°C. |
|
Fig. 9 Effect of MTES addition on FTIR of SiO2 films: (a) Effect of MTES addition on FTIR of SiO2 films, (b) Local magnification of the effect of MTES addition on FTIR of SiO2 films. |
|
Fig. 10 Effect of MTES addition on the microscopic morphology of SiO2 films: (a) 0 mL, (b) 2 mL, (c) 4 mL, (d) 6 mL, (e) 8 mL. |
|
Fig. 11 Effect of MTES addition on the contact angle of SiO2 films. |
|
Fig. 12 Effect of MTES addition on the 3D morphology of SiO2 films: (a) 0 mL, (b) 2 mL, (c) 4 mL, (d) 6 mL. |
|
Fig. 13 Effect of coating number on ceramic membrane properties |
|
Fig. 14 Effect of the number of coating films on the microscopic morphology of the ceramic membranes: (a) 0 times, (b) 1 time, (c) 2 times, (d) 3 times, (e) 4 times. |
|
Fig. 15 Effect of calcination temperature on the contact angle of ceramic membranes. |
|
Fig. 16 Contact angles of films at 600°C: (a) t = 5 s, (b) t = 10 s. |
|
Fig. 17 Effect of calcination temperature on the properties of ceramic membranes. |
|
Fig. 18 Microscopic morphology of ceramic membrane at different calcination temperatures: (a) 400°C, (b) 500°C, (c) 600°C |
|
Fig. 19 Effect of the number of coatings on the properties of ceramic membranes: (a) Water/oil–water flux, (b) Oil removal rate |
|
Fig. 20 Effect of emulsion concentration on the performance of ceramic membranes: (a) Membrane flux, (b) Oil removal rate. |

|
Fig. 21 Schematic diagram of ceramic membrane fouling mechanism |
|
Fig. 22 Changes in membrane flux with different cleaning methods |
|
Table 3 Comparison of oil wastewater treatment performance of ceramic membranes. |

To enhance the filtration efficiency of ceramic membranes and reduce manufacturing costs for broader applications, this experiment utilized cost-effective raw materials, gangue, and loess to prepare a ceramic membrane support. The SiO2 membrane was fabricated using the sol–gel method. The ceramic membrane support was modified with the impregnation and lifting method to obtain ceramic membranes with certain treatment effects for oily wastewater. The results of the experiments showed that the ceramic membrane support had the best performance when the pore-forming agent content was 10 wt% and the sintering temperature was 1125°C. For SiO2 films, the best performance occurred with an MTES addition of 4 mL, two coatings, and a calcination temperature of 400°C, resulting in an oil removal rate of 94.1%. Our method is convenient and effective and can be useful for the research of ceramic membranes.
The authors thank Hou Kang for his help with writing this paper and the experimental support we received from the Shaanxi Modern Design and Research Institute.
Figure S1: XRD of raw materials; Figure S2: Particle size of raw materials; Figure S3: Thermal behavior of raw materials; Figure S4: The pore size distribution of SiO2 films (a) without modifier and (b) with 4 mL methyltriethoxysilane (MTES); Table S1: Chemical composition of raw materials (%).
Data are contained within the article and supplementary materials.
The authors declare that there are no conflicts of interest pertinent to the current research paper.
This research was funded by the Shaanxi Province Key Research and Development Plan Projects (2020ZDLNY06-09), Shaanxi Province Key Research and Development Plan Projects (2020GY-325), Shaanxi Province Key Research and Development Plan Projects (S2020-YF-YBSF-0507), and Special Scientific Research Plan Project of Shaanxi Provincial Education Department (22JK0393).
There is no code availability.
Conceptualization, H.Z., Y.G., Z.T., S.C., W.C., H.W., Z.W., and M.L.; methodology, H.Z., W.C., H.W., and M.L.; software, H.Z., Y.G., X.Y., J.W., and M.L.; validation, Z.T., S.C., and Z.W.; formal analysis, Y.G.; investigation, H.Z.; resources, Z.T.; data curation, H.W.; writing—original draft preparation, H.Z. and M.L.; writing—review and editing, H.Z. and M.L.; visualization, H.Z.; supervision, Z.T.; project administration, Z.T.; funding acquisition, Z.T. and X.Y. All authors have read and agreed to the published version of the manuscript.
- 1. C. Li, W. Sun, Z. Lu, X. Ao, and S. Li, Water Res. 175 (2020) 115674 .
-

- 2. R. Umapriya, S.M. Vidyavathy, G. Arthanareeswaran, and T.J. Rohan, J. Ceram. Process. Res. 21[3] (2020) 309.
-

- 3. Y. Bao, T.-T. Lim, R. Wang, R.D. Webster, and X. Hu, Chem. Eng. J. 343 (2018) 737.
-

- 4. Y. Bao, W. J. Lee, T.-T. Lim, R. Wang, and X. Hu, Appl. Catal. B 254 (2019) 37.
-

- 5. K. Huang, B. Wang, S. Guo, and K. Li, Angew. Chem. Int. Ed. 57[42] (2018) 13892.
-

- 6. K. Shima, Y. Funato, N. Sato, Y. Fukushima, T. Momose, and Y. Shimogaki, ACS Appl. Mater. Interfaces 12[45] (2020) 51016.
-

- 7. P. Wu, Y. Xu, Z. Huang, and J. Zhang, J. Ceram. Process. Res. 16[1] (2023) 102-106.
-

- 8. N.M.A. Omar, M.H.D. Othman, Z.S. Tai, T.A. Kurniawan, M.H. Puteh, J. Jaafar, M.A. Rahman, A.F. Ismail, N. Rajamohan, H. Abdullah, and K.Y. Wong, J. Water Process Eng. 62 (2024) 105399.
-

- 9. S. Khemakhem, A. Larbot, and R. Ben Amar, Ceram. Int. 35[1] (2009) 55.
-

- 10. K.S. Kumaar, P. Kulanthaivel, S. Sathiskumar, and N. Muralimohan, J. Ceram. Process. Res. 23[6] (2022) 892.
-

- 11. R.K. Singh, T.A.V. Tirth, A. Algahtani, and I. Mahdi, J. Ceram. Process. Res. 24[3] (2023) 525.
-

- 12. A. Samadi, L. Gao, L. Kong, Y. Orooji, and S. Zhao, Resour Conserv Recycl. 185 (2022) 106497.
-

- 13. F. Liu, M.Z. Xie, G.Q. Yu, C.Y. Ke, and H.L. Zhao, ACS Sustain. Chem. Eng. 9[30] (2021) 10318-10325.
-

- 14. Z. Liu, M.L. Xiao, and J.B. Coal Chem. Ind. 42[10] (2019) 110-113.
- 15. S. Gao, G. Zhao, L. Guo, L. Zhou, and K. Yuan, Constr. Build. Mater. 268 (2021) 121212.
-

- 16. J. Deng, B. Li, Y. Xiao, L. Ma, C.-P. Wang, B. Lai-wang, and C.-M. Shu, Appl. Therm. Eng. 116 (2017) 244.
-

- 17. H. Li, L. Kong, J. Bai, Z. Bai, Z. Guo, and W. Li, Chin. J. Chem. Eng. 35 (2021) 239.
-

- 18. J.D.N. Pone, K.A.A. Hein, G.B. Stracher, H.J. Annegarn, R.B. Finkleman, D.R. Blake, J.K. McCormack, and P. Schroeder, Int. J. Coal Geol. 72[2] (2007) 124.
-

- 19. X.Y. Gu, G.G. Xu, C. Wang, Y.H. Gao, and P.J. Zhao, Shandong Univ. Sci. Technol. (Nat. Sci. Ed.) 42[2] (2023) 70-77.
- 20. Z. Tong, J.X. Zhang, X.J. Sun, B.W. Yang, and K.P. Huang, Mater. Rev. 34[12] (2020) 12050-12056.
- 21. Z. Tong, L. Liu, X. Yang, D. Li, L. Guo, and J. Zhang, Mater. Res. Express 9[3] (2022) 035507.
-

- 22. M.L. Chen, S.G.J. Heijman, and L.C. Rietveld. Membr. 11[11] (2021) 888.
-

- 23. S. Shi, K. Jian, M. Fang, J. Guo, P. Rao, and G. Li, Membranes 13[9] (2023) 756.
-

- 24. B. Li, L. Guo, Z. Tong, Y.N. Guo, and K. P. Huang, Acta Ceram. Sin. 42[5] (2021) 774-780.
- 25. Z. Tong, K.P. Huang, B.W. Yang, and J.X. Zhang, Mater. Rev. 35[6] (2021) 6.
- 26. Q. Gu, M. Kotobuki, C.H. Kirk, M. He, G.J.H. Lim, T.C.A. Ng, L. Zhang, H.Y. Ng, and J. Wang, ACS Appl. Mater. Interfaces 13[24] (2021) 29199.
-

- 27. N. Joshi and R.K. Pujala, Appl. 84 (2020) 109-132.
- 28. Y. Wang, L. Nie, and J. Liu, Chem. Phys. Lett. 747 (2020) 137331.4.
-

- 29. C.Y. Wu, J.J. Huang, X.G. Li, J.H. Wu, B. Hou, and J. Harbin Inst. Technol. 53[7] (2021) 1-19.
- 30. L. Chen, Y. Huang, and Y.L. Yu, Mater. Her. 36[11] (2022) 81-88.
- 31. S.O. Lawal, Y. Takahashi, H. Nagasawa, T. Tsuru, and M. Kanezashi, J. Sol-Gel Sci. Technol. 104[3] (2022) 566.
-

- 32. Y. Cui, M. Ding, T. Sui, W. Zheng, G. Qiao, S. Yan, and X. Liu, Tribol. Int. 142 (2020) 105978.
-

- 33. A. Darmawan, R. Utari, R.E. Saputra, Suhartana, and Y. Astuti, Iop Conf. Ser.: Mater. Sci. Eng. 299 (2018) 012041.
-

- 34. L. Chen, Funct. Mater. 51[12] (2020) 12204–12208.
- 35. W.G. Fu, H.R. Feng, Y.W. Liu, B. Fu, and Y.W. Zhao, J. Tianjin Polytech. Univ. 41[5] (2022) 14-20.
- 36. Y.M. Li, S.B. Xie, Z.G. Chen, and J.G. Zhou, Funct. Mater. 50[8] (2019) 8116-8122.
 This Article
-
2024; 25(4): 543-556
Published on Aug 31, 2024
- 10.36410/jcpr.2024.25.4.543
- Received on Apr 16, 2024
- Revised on May 29, 2024
- Accepted on Jun 5, 2024
 Services
- Abstract
introduction
materials and methods
results
conclusions
- Acknowledgements
- Supplementary
- Data availability statement
- Conflict of Interest
- Funding
- Code Availability
- Author Contributions
- References
- Full Text PDF
Shared
 Correspondence to
- Yani Guo
-
School of Environmental and Chemical Engineering, Xi’an Polytechnic University, Xi’an 710000, China
Tel : +86 13186086167 - E-mail: 19940706@xpu.edu.cn



 Copyright 2019 International Orgranization for Ceramic Processing. All rights reserved.