- Si3N4 ceramic ball surface quality prediction modeling and its influence mechanism analysis
Jian Sun, Zhonghao Tian, Junran Huang, Jinmei Yao*, Lu Wang and Yang Zhang
School of Mechanical Engineering, Shenyang Jianzhu University, Shenyang 110168, China
This article is an open access article distributed under the terms of the Creative Commons Attribution Non-Commercial License (http://creativecommons.org/licenses/by-nc/4.0) which permits unrestricted non-commercial use, distribution, and reproduction in any medium, provided the original work is properly cited.
To establish a prediction model for the surface quality of silicon nitride ceramic balls under the conical grinding method, and to analyze the influence mechanism of different working conditions on the surface quality under this grinding method. A simulation prediction model of the grinding quality of the surface of silicon nitride ceramic balls was established based on MATLAB, through which the three-dimensional morphology and roughness of the surface of silicon nitride ceramic balls were simulated and analyzed. With the increase in abrasive particle size, the abrasive concentration decreases, the surface roughness of the processed silicon nitride ceramic ball increases accordingly, the number of scratches produced by the abrasive particles on the surface of the ceramic ball after scratching and rolling and its peak/valley difference rises accordingly, and the proportion of surface defects such as bumps, craters, and directional scratches per unit area of the grind surface layer increases, and the surface quality decreases significantly. This paper plays an important role in the prediction of surface quality of silicon nitride ceramic ball grinding and the formulation of process methods.
Keywords: Silicon nitride ceramic ball, Conical grinding method, Prediction model, Surface topography, Roughness.
Due to the needs of high-end manufacturing industry, the research on all-ceramic bearings is necessary and urgent. Although the current independent production of all-ceramic bearings in China occupies a greater advantage in the number, but in the use of performance and reliability and many other aspects still have a large gap with the international mainstream factories [1-4], which is mainly reflected in the control of the surface quality of ceramic balls [5-10].
Scholars at home and abroad have studied how to narrow the above gap from different angles [11]. Based on the conventional V-groove machining method, Ichikawa S [12] improved the original drive method and proposed an eccentric V-groove machining method, which extends the grinding trajectory envelope to the entire spherical surface; Bo Zhang [13] specifically explored the motion of the abrasive grains on the surface of the sphere on the basis of this grinding method, and found that the trajectory of the sphere under the V-groove grinding method is an equidistant concentric circle, and that the sphere with higher machining accuracy can only be obtained by changing the angle of the sphere relative to the V-groove in the machining; Yuan Julong [14] optimized the traditional V-shaped groove method and proposed the double rotary disk machining method, which not only ensured the high precision of the ball, but also could control the size of the rotation Angle manually. Wu Yuhou [15, 16] through the improvement of V-shaped groove grinding method, creatively proposed a conical groove grinding method, after experimental demonstration, the processing method of the spin angle control between 45 ° to 75 ° processing of ceramic ball spherical body roundness error is minimized, the best machining accuracy, basically reached G3 level accuracy; Taking the chemical reaction of the material as the starting point, Ge Ziqiang [17] revealed the reaction mechanism of silicon nitride and hydrofluoric acid, and improved the processing efficiency of silicon nitride materials. Zhou Zhaozhong [18] established a spherical error correction model based on the spherical error of ceramic balls; Huang Yiyun [19] of Zhejiang University proposed a numerical simulation method for the machined surface topography after grinding, using the surface topography of the sphere as an entry point, which is able to better analyze and evaluate the surface topography of the material.
In summary, the current research results still have much room for improvement in controlling the surface quality of silicon nitride ceramic spheres, and there is a lack of sphere-related research support in surface morphology simulation. In view of the above problems, this paper considers silicon nitride ceramic ball as the main research object, establishes the surface quality prediction model of single ceramic ball sphere based on conical grinding method, optimizes and verifies the prediction model through the experimental results, and realizes the accurate prediction and control of the surface roughness and morphology of the processed sphere.
Distribution model of abrasive grains
The distribution of abrasive grains on the surface of the sphere is an important factor affecting the quality of the ball surface of silicon nitride ceramic balls, and the quantitative criteria for its characterization can generally be viewed as a three-dimensional normal distribution based on a time series. It will be processed by the method of digital sampling. Specifically, it is a point taking operation for the abrasive grains distributed on the surface of the ball in the initial grinding state, and the collected points are discretized as follows [20, 21].
The autocorrelation function for the 3D surface takes the following form:

where E is the mathematical expectation and k and l are the correlation distances in the X and Y directions.
The autocorrelation function of an ergodic stable stochastic process in discrete form is defined as:

Fourier transform the above equation to obtain the power spectral density (PSD)
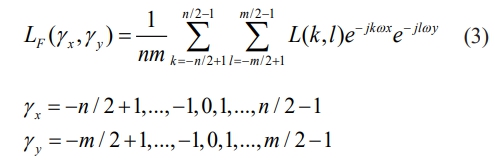
Since the random input signal η(i, j) generated by the action of abrasive grains on the surface of the sphere during the grinding process basically conforms to the normal distribution, the PSD of the input signal is denoted by ηp(γx, γy), then the relationship between ηp(γx, γy) and LF(γx, γy) for a linear system is as follows

In order to generate the desired random surface containing abrasive grains, a real function filter responding to the impact response needs to be designed, so in this paper we consider the use of two-dimensional digital filtering techniques, based on FIR filters, and the input signal is processed by computer simulation filtering. For the variance σ in the above formula, in this paper, it mainly refers to the variance of the height of the abrasive particle on the surface of the ceramic ball, which satisfies L(0,0)=σ2, which satisfies L(0,0)=σ2, and based on the Wiener-Sinchin theorem, it can be known that: Assuming that the random signal η(i, j) is a smooth stochastic process, then the correlation function can be carried out through the FFT transform on the basis of the sequence to get the corresponding power spectral density function as follows.

The above equation is derived as the power spectral function of the input random signal MATLAB. From the previous section, the initial random signal (input random signal) of the abrasive grain distribution conforms to the normal distribution, so its power spectral density function (PSD) should theoretically be constant C. Then the transfer function of the abrasive grain distribution on the surface of the ceramic sphere | H(γx, γy)| is:

The inverse Fourier transform of | H(γx, γy)| yields the filter coefficients h(k, l), which are convolved with the input Gaussian sequence to form the generated surface of the grinding disk:

In summary, the modeling process for the random distribution model of abrasive grains that satisfies the normal distribution condition is shown below:
(1) Specify the autocorrelation function to be generated for the surface, which can be assumed to be exponential or Gaussian, or which can be obtained from the actual measured engineering surface. we generally think of the autocorrelation function as having the following form:

The longitudinal distance β1 and the transverse distance β2 depend on the contact surface area of the ball and the concentration of the grinding fluid.
(2) The input random signal is transformed by FFT and its PSD is obtained.
(3) The corresponding autocovariance σ is introduced to obtain its autocorrelation function.
(4) The power spectral density PSD was obtained by FFT transformation of the autocorrelation function.
(5) The transfer function of wear particle distribution is solved. The transfer function is reversed FFT and convolved with input random signal to generate random surface.
Mathematical modeling of ceramic ball surface morphology
Due to the sphere in the conical groove of the grinding process is more complex, if not simplify the model will lead to the calculation process is too cumbersome, is not conducive to the practical application of engineering, based on this, this paper lists the following prerequisites.
(1) Neglect the effect of vibration generated by the grinding disc driving the abrasive particles during the grinding process on the generation of ceramic ball spheres.
(2) The secondary effect on the surface quality of the material produced when the abrasive grains grind the ceramic ball's sphere is not taken into account.
(3) The abrasive particles are evenly distributed on the surface of the ceramic ball during the grinding process.
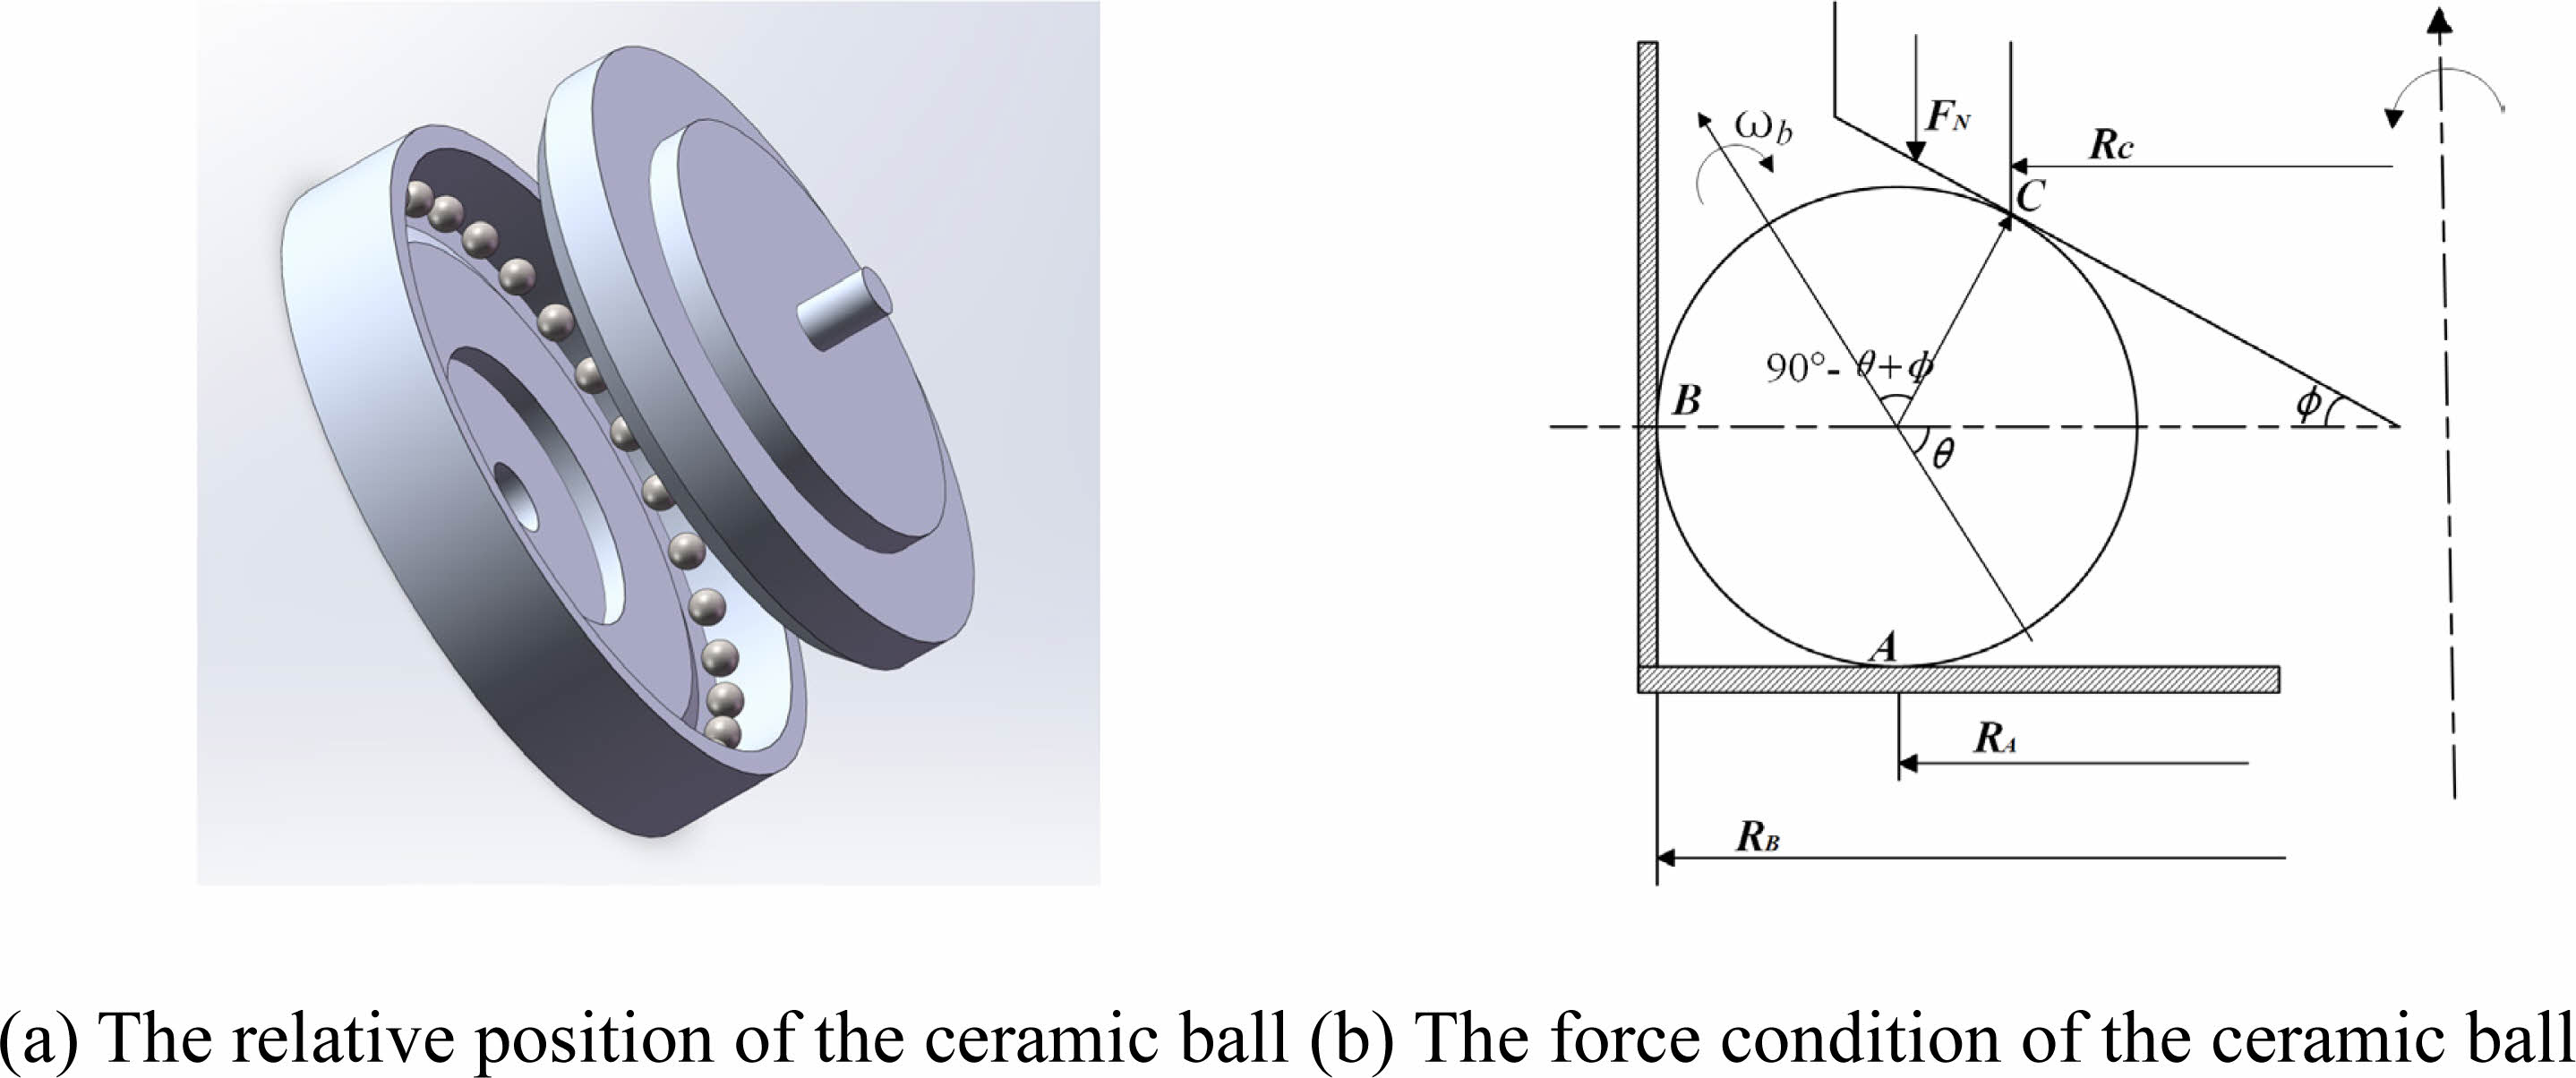
Based on the above conditions, the position of the silicon nitride ceramic ball in the conical disk during grinding, as shown in Fig. 1(a). Establish a simplified form of force analysis diagram of the silicon nitride ceramic ball in the conical slot grinding process, as shown in Fig. 1(b).
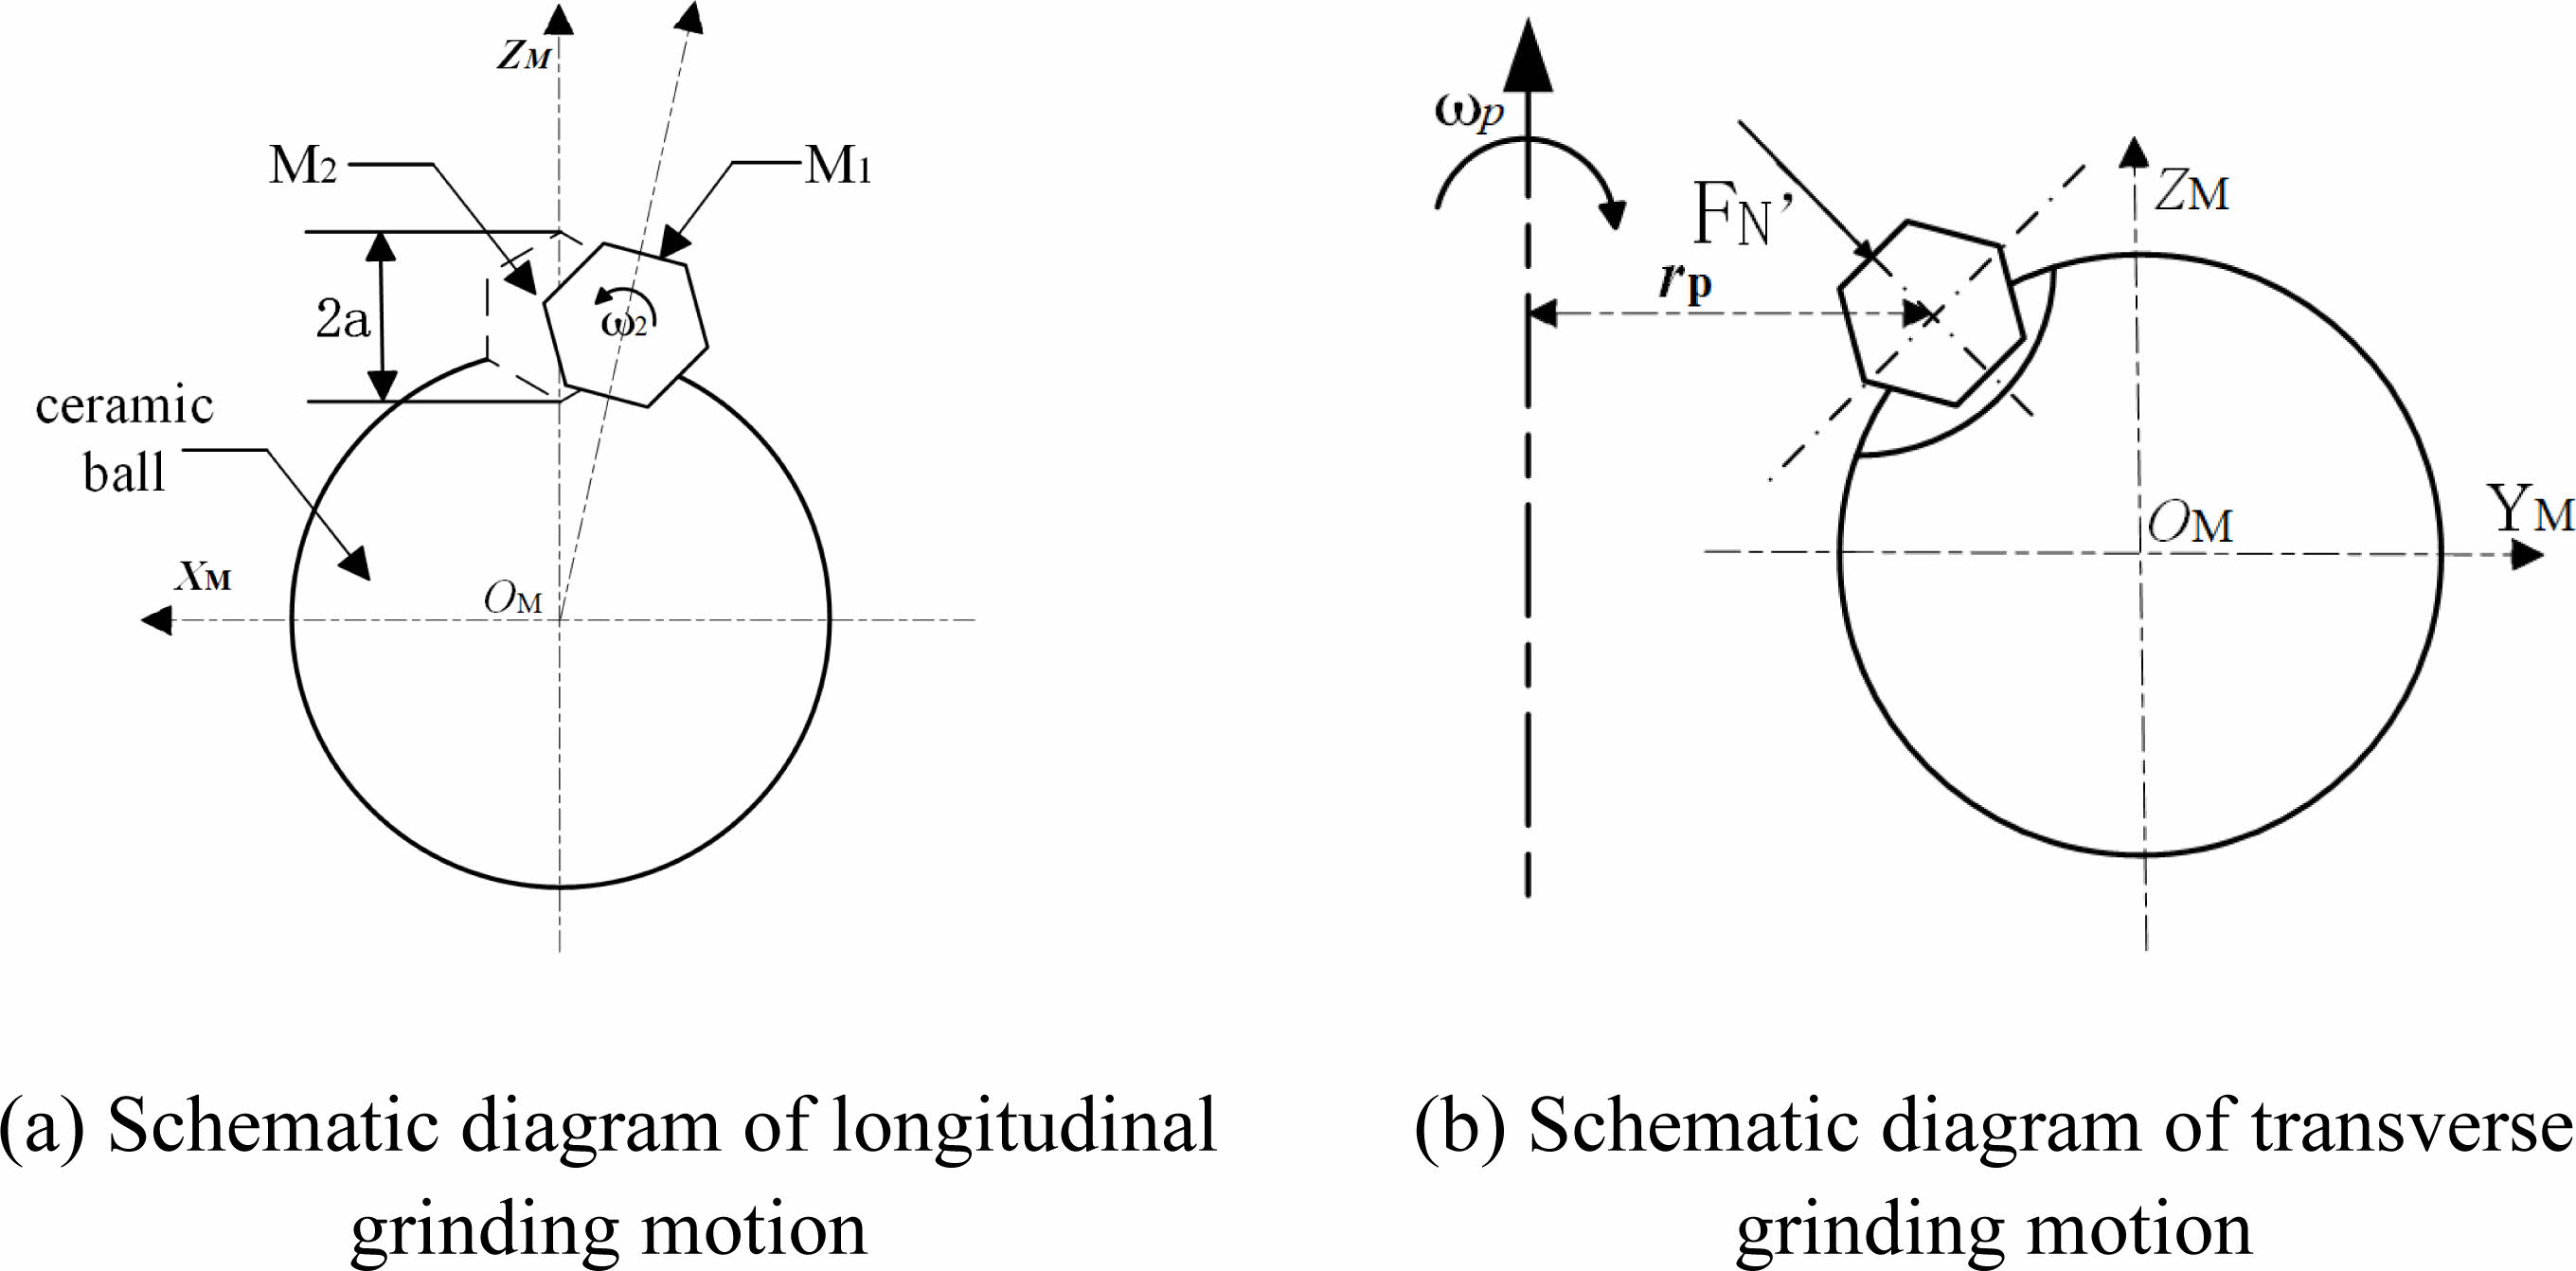
Expanding the above premise, the motion trajectory of the abrasive particles on the surface of the ceramic sphere during the grinding process can be obtained as shown in Fig. 2. In the longitudinal grinding motion shown in Fig. 2(a): the coordinate system [XM OM ZM] is fixed at the center of the ball; the radius of the silicon nitride ball is r; the distance from the center of rotation of the grinding disk to the abrasive grain is rp; the angular velocity of the grinding disk is ωp; the angular velocity of the ball around the spindle of the grinding disc is Ω; the inclination Angle of the grinding disc is φ; and the abrasive grains M1 and M2 of particle size 2a are successively involved in the grinding motion. In the transverse grinding motion shown in Fig. 2(b): The coordinate system is set to [YM OM ZM] and FNʹ is the total load applied to a single abrasive grain.
In summary, the trajectory model of the abrasive grain M1 is shown below [22-26]:

Based on the kinematics theory of the grinding process described above, it is known that the grinding trajectory of the abrasive grain M is:

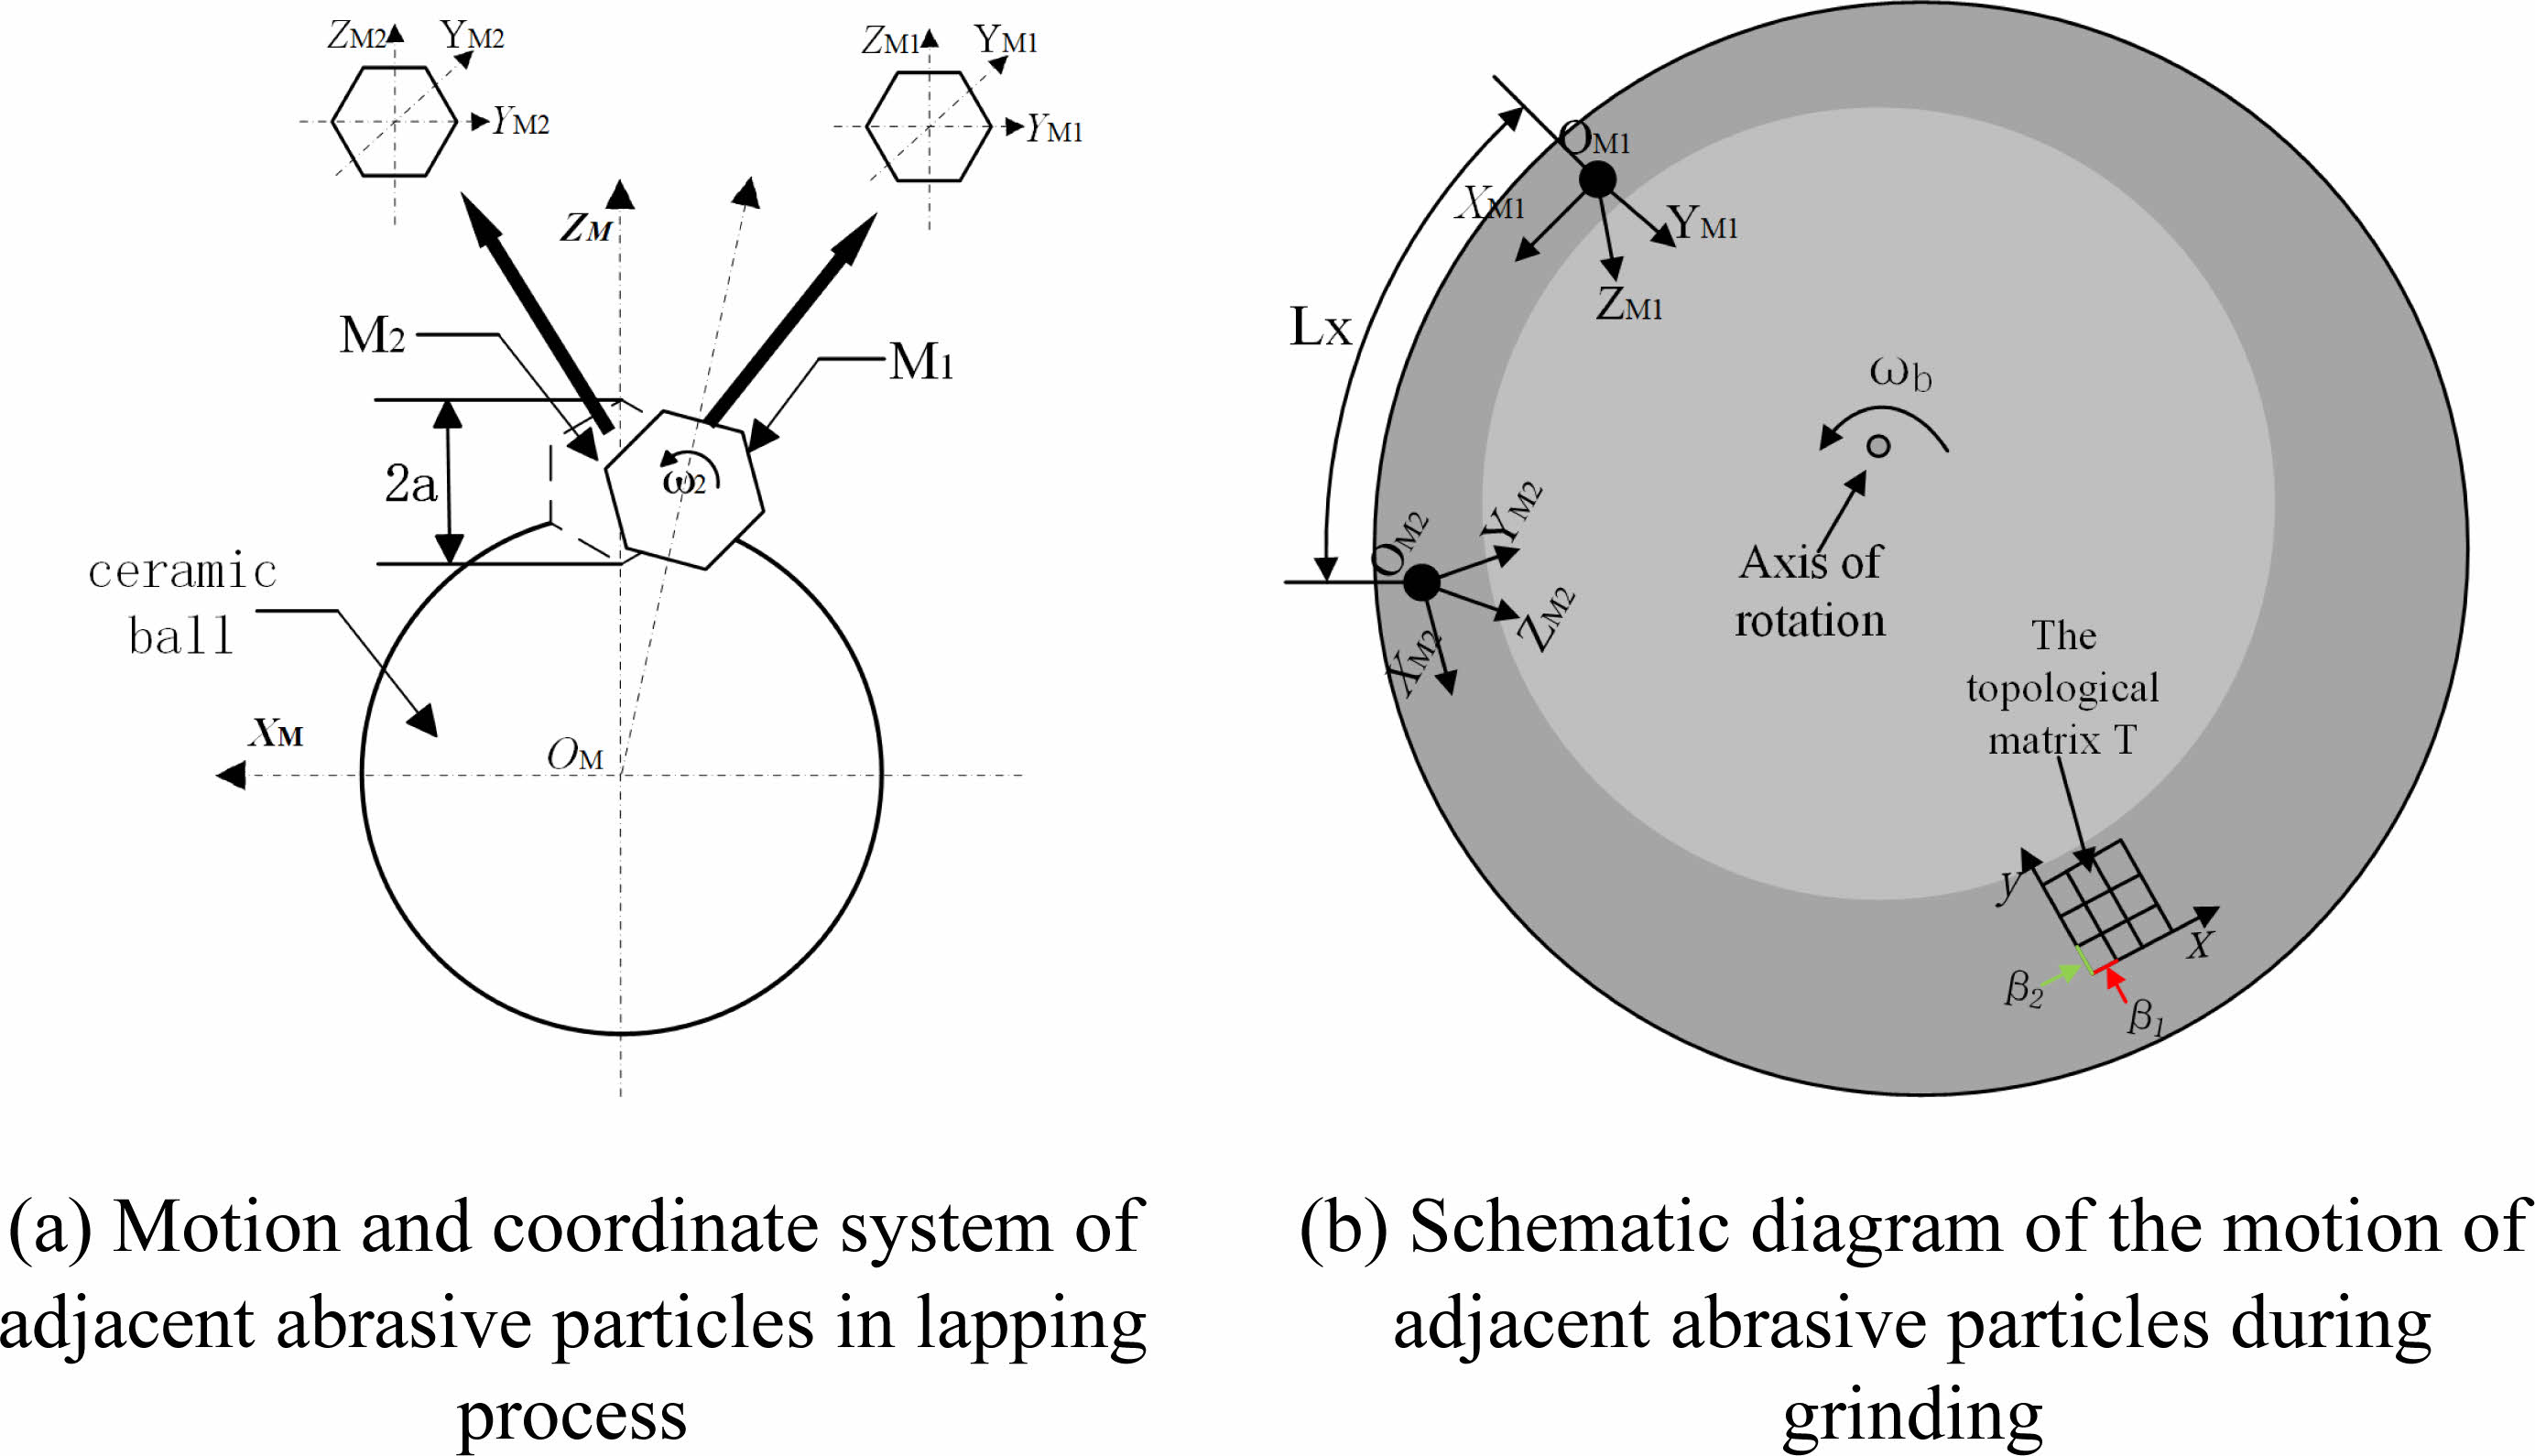
where rp is the radius of the upper grinding disk, Ω is the angular velocity of the ball's revolution, and t denotes the set time required for grinding. As shown in Fig. 3, the grinding action of the abrasive grains on the surface of the ceramic ball sphere is continuous during the grinding process, the grinding area of the former abrasive grain on the surface of the sphere is also the area to be grinded by the latter abrasive grain. Based on this, the grinding trajectories of neighboring abrasive grains need to be included in the analysis, as shown in Fig. 3(a), where the radii of rotation of the previous abrasive grain, M1, and the next abrasive grain, M2, are a1 and a2, respectively, and have their own coordinate systems [OM1 XM1 YM1 ZM1] and [OM2 XM2 YM2 ZM2]. Zooming in on the main features for ease of understanding leads to a schematic diagram of the principle of generating surfaces during the grinding process, as shown in Fig. 3(b).
Therefore, the grinding trajectories m1z and m2z of the abrasive grains M1 and M2 on the surface of the sphere are:

In the above model, m1x, m1z, and m2x, m2z are distributed as coordinate values within the local coordinate system of the abrasive grains M1, M2, and r1p and r2p are each the distance of the abrasive grains M1, M2 to the center of the rotational axis of the abrasive disc. In the process of modeling, it is necessary to convert the local coordinate system formed by each abrasive point. Therefore, the coordinate system of abrasive particle M1 is selected as the global coordinate system, and the grinding trajectory of abrasive particle M2 is transformed once, the local coordinate system [OM2XM2YM2ZM2] can be transformed into [OM1XM1YM1ZM1]. In the process of changing the coordinate system, the distance D between abrasive particle M1 and M2 should be taken into account, where D can be divided into horizontal distance D1 and vertical distance D2.

Bringing in the above equations yields the grinding trajectory of M2 in the global coordinate system [OM1XM1YM1ZM1] as:

In order to make the prediction model developed in this paper better for analog simulation, the topological matrix T is used to represent the abrasive processing morphology of the ceramic ball surface [27, 28]. Each element Ti(tx, ty) of this matrix is expressed as the height of each point on the surface of the sphere relative to the center of the sphere in the global coordinate system [OM1 XM1 YM1 ZM1], and the most protruding point on the surface of the ceramic sphere is taken as the origin of the global coordinate analyzed in this paper, where tx is the spacing along the longitudinal distance of the matrix, and ty is the spacing along the transverse distance of the matrix. For the distribution state of the abrasive grains, the longitudinal and transverse distances of the topological matrix are considered to coincide with the circumferential and axial distances of the convolution output S obtained in the previous section, respectively, as shown in Fig. 3(b) above.
The distance L from the local coordinate origin to the global coordinate origin of any grinding point on the abrasive grain can be simplified as the distance Lx along the x-axis direction and the distance Lz along the z-axis direction;

In the above model, Sd is defined as the depth of incision of the abrasive grains during the grinding process; Smax is defined as the maximum distribution state in S.
It follows that the grinding trajectory of any abrasive grain M(mix, miz) in the global coordinate system [OM1XM1YM1ZM1] during the grinding process is:

Similarly, for any point Ti(tx, ty) on the surface of a ceramic ball, the abrasive trajectory model generated by the action of abrasive particles on its surface is:

In summary, the surface roughness prediction model of silicon nitride ceramic ball can be specifically expressed by the following formula 16:

The grinding trajectories of the abrasive particles are calculated at the interval of the axis distance β2, and the calculated results are input into the topological matrix successively to obtain the three-dimensional topography of the ceramic ball.
|
Fig. 1 Static force analysis diagram of ceramic ball in conical groove. |
|
Fig. 2 Schematic diagram of the movement of abrasive grains on the surface of a sphere |
|
Fig. 3 Diagram of the movement of abrasive particles on the surface of a sphere. |
Design of simulation conditions
Small load has little influence on roughness [29-31], so the influence of small load on roughness is not considered. In this paper, the influence of abrasive particle, grinding liquid concentration and grinding disc speed on roughness and surface morphology is studied. Based on the simulation principle obtained in the previous section and according to the distribution state of abrasive grains, the surface quality of silicon nitride ceramic balls under different grinding parameters was simulated and analyzed. The simulation parameters set are; The average diameter of the ceramic spheres used in the grinding process is 10.32 mm; The abrasive models are W5, W10, W15, W20; The grinding disc speed np is 50 r/min~200 r/min; The concentration Dm of abrasive particles is 10%~40%. The simulation time t is 1000s and the sampling step is 0.001. The relevant simulation parameters are specifically shown in Table 1 below.
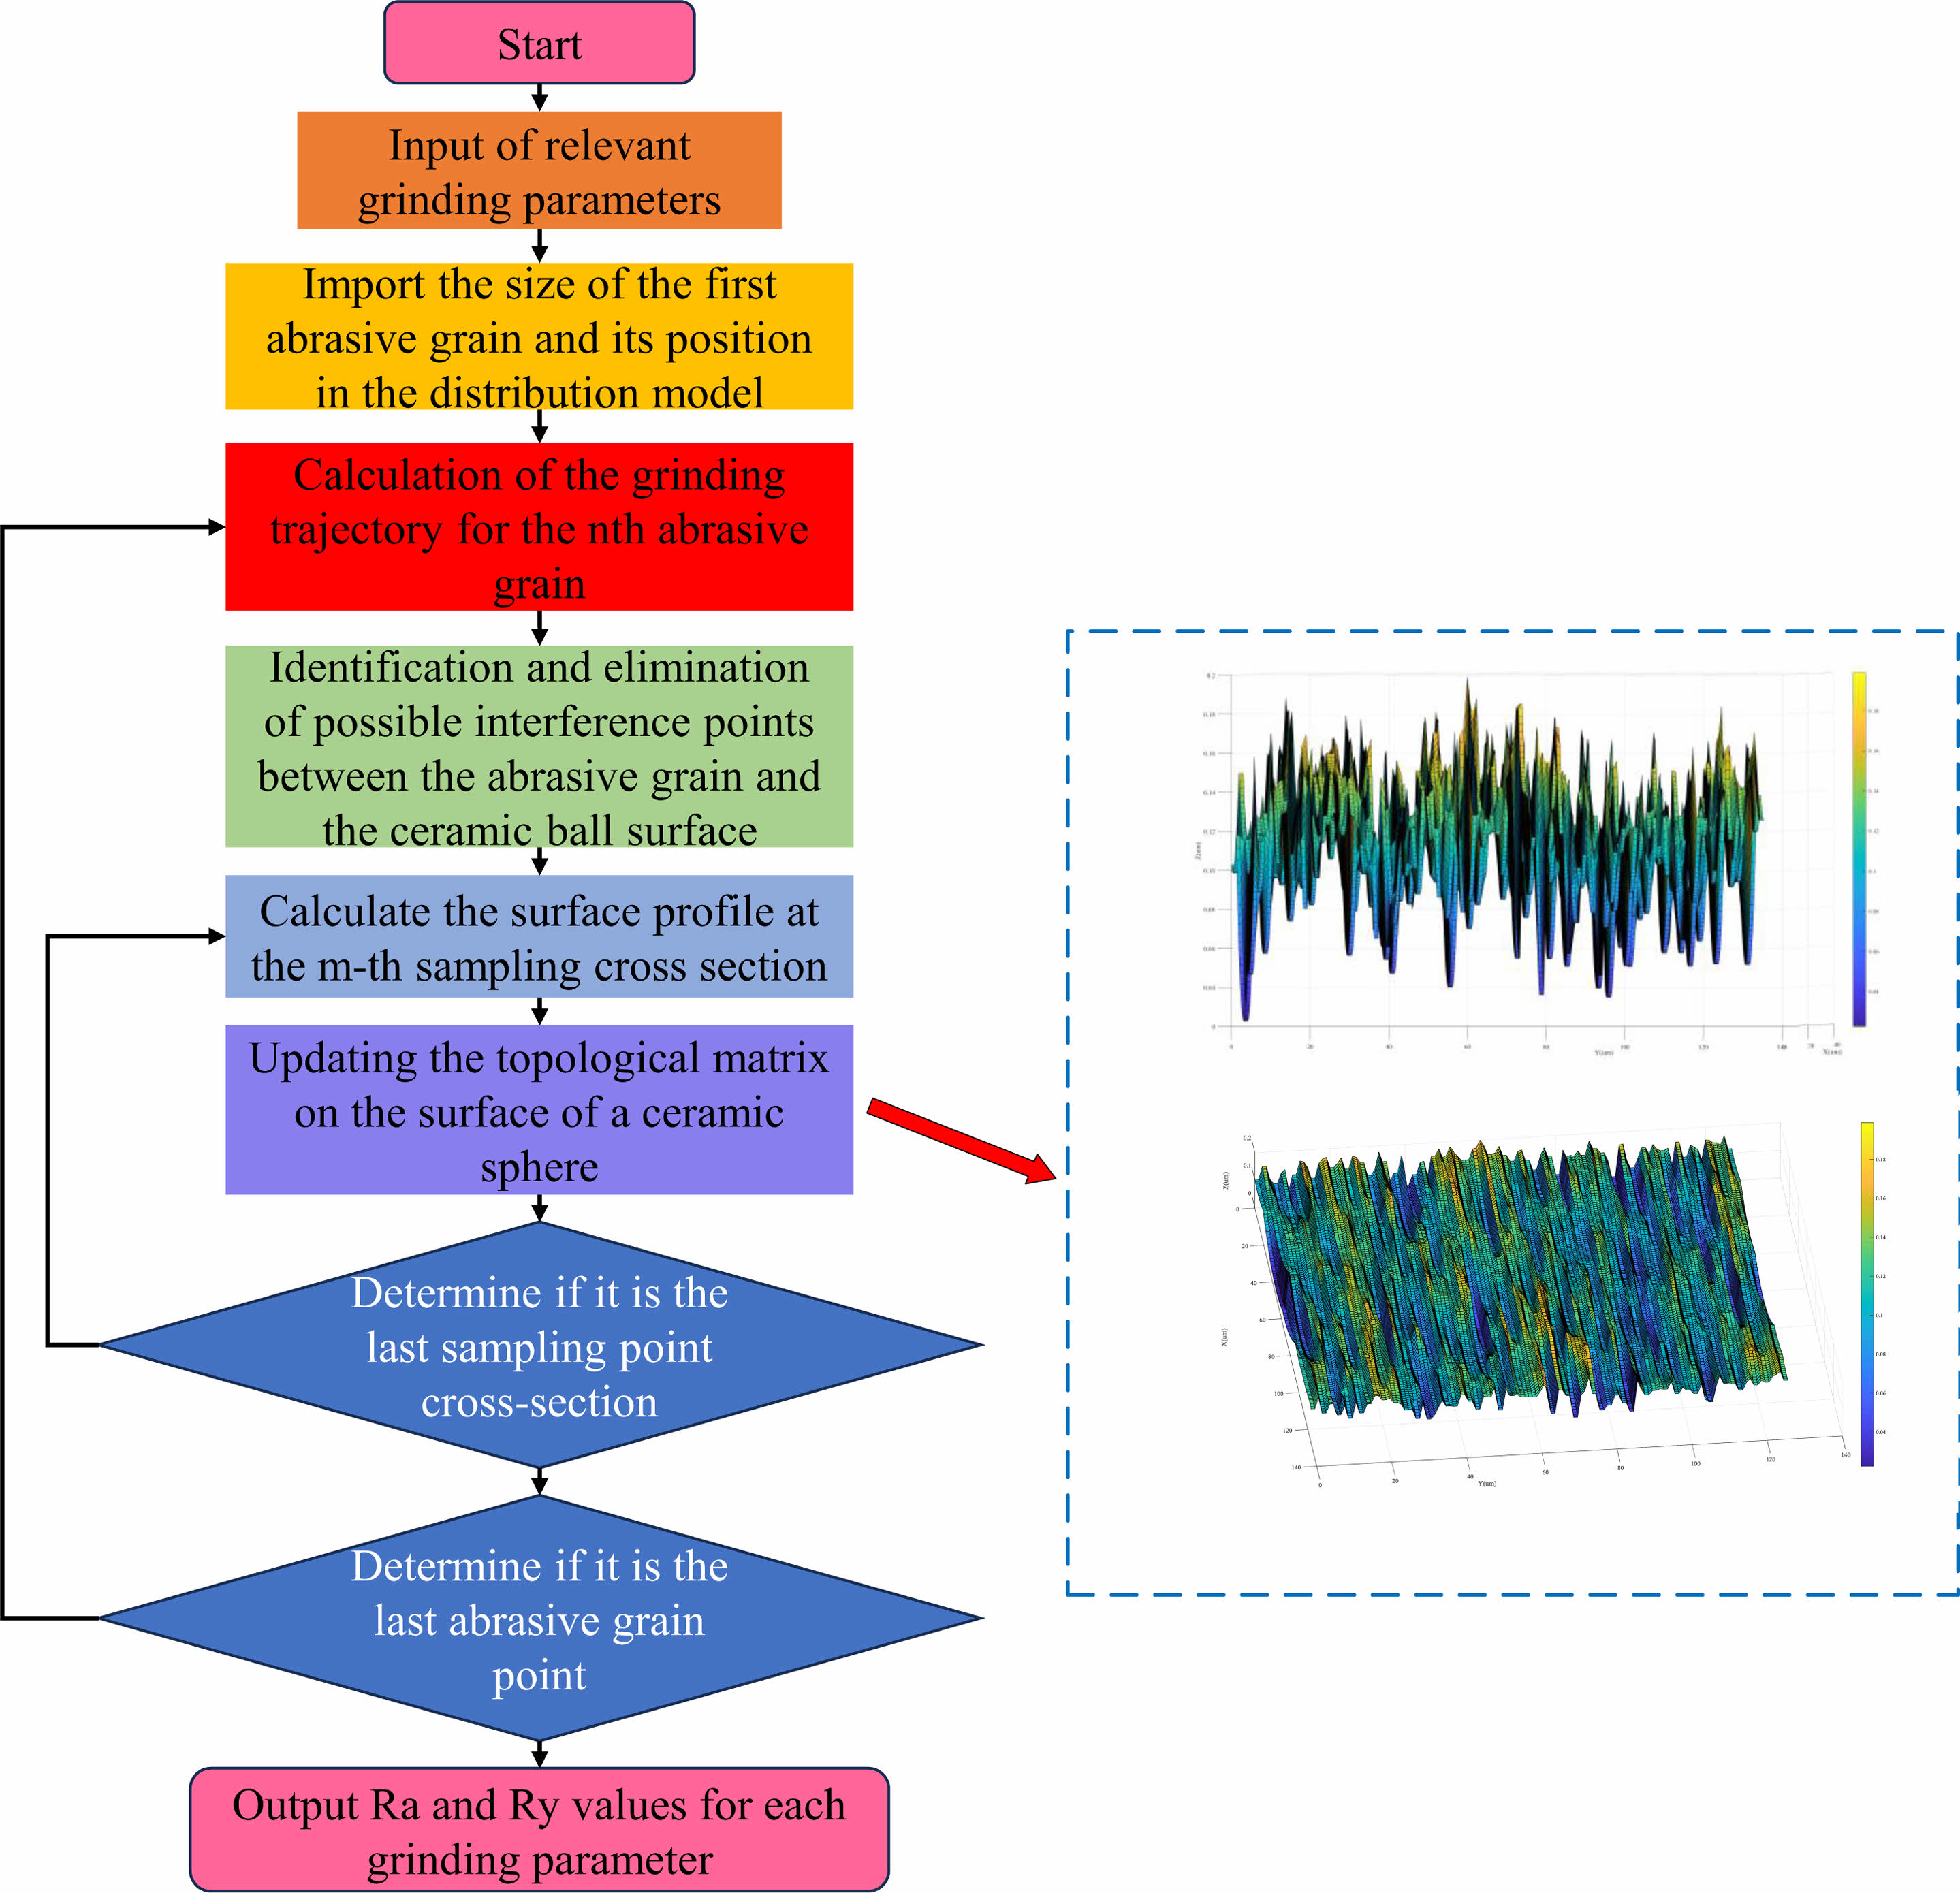
Based on the simulation parameters shown in the above table, the three-dimensional machined surface topography of ceramic spheres under four sets of different grinding parameters is simulated as shown in Figs. 5 to 7. The associated computational flow is shown in Fig. 4.
Simulation results and analysis
Analysis of simulation results under different abrasive grain size conditions
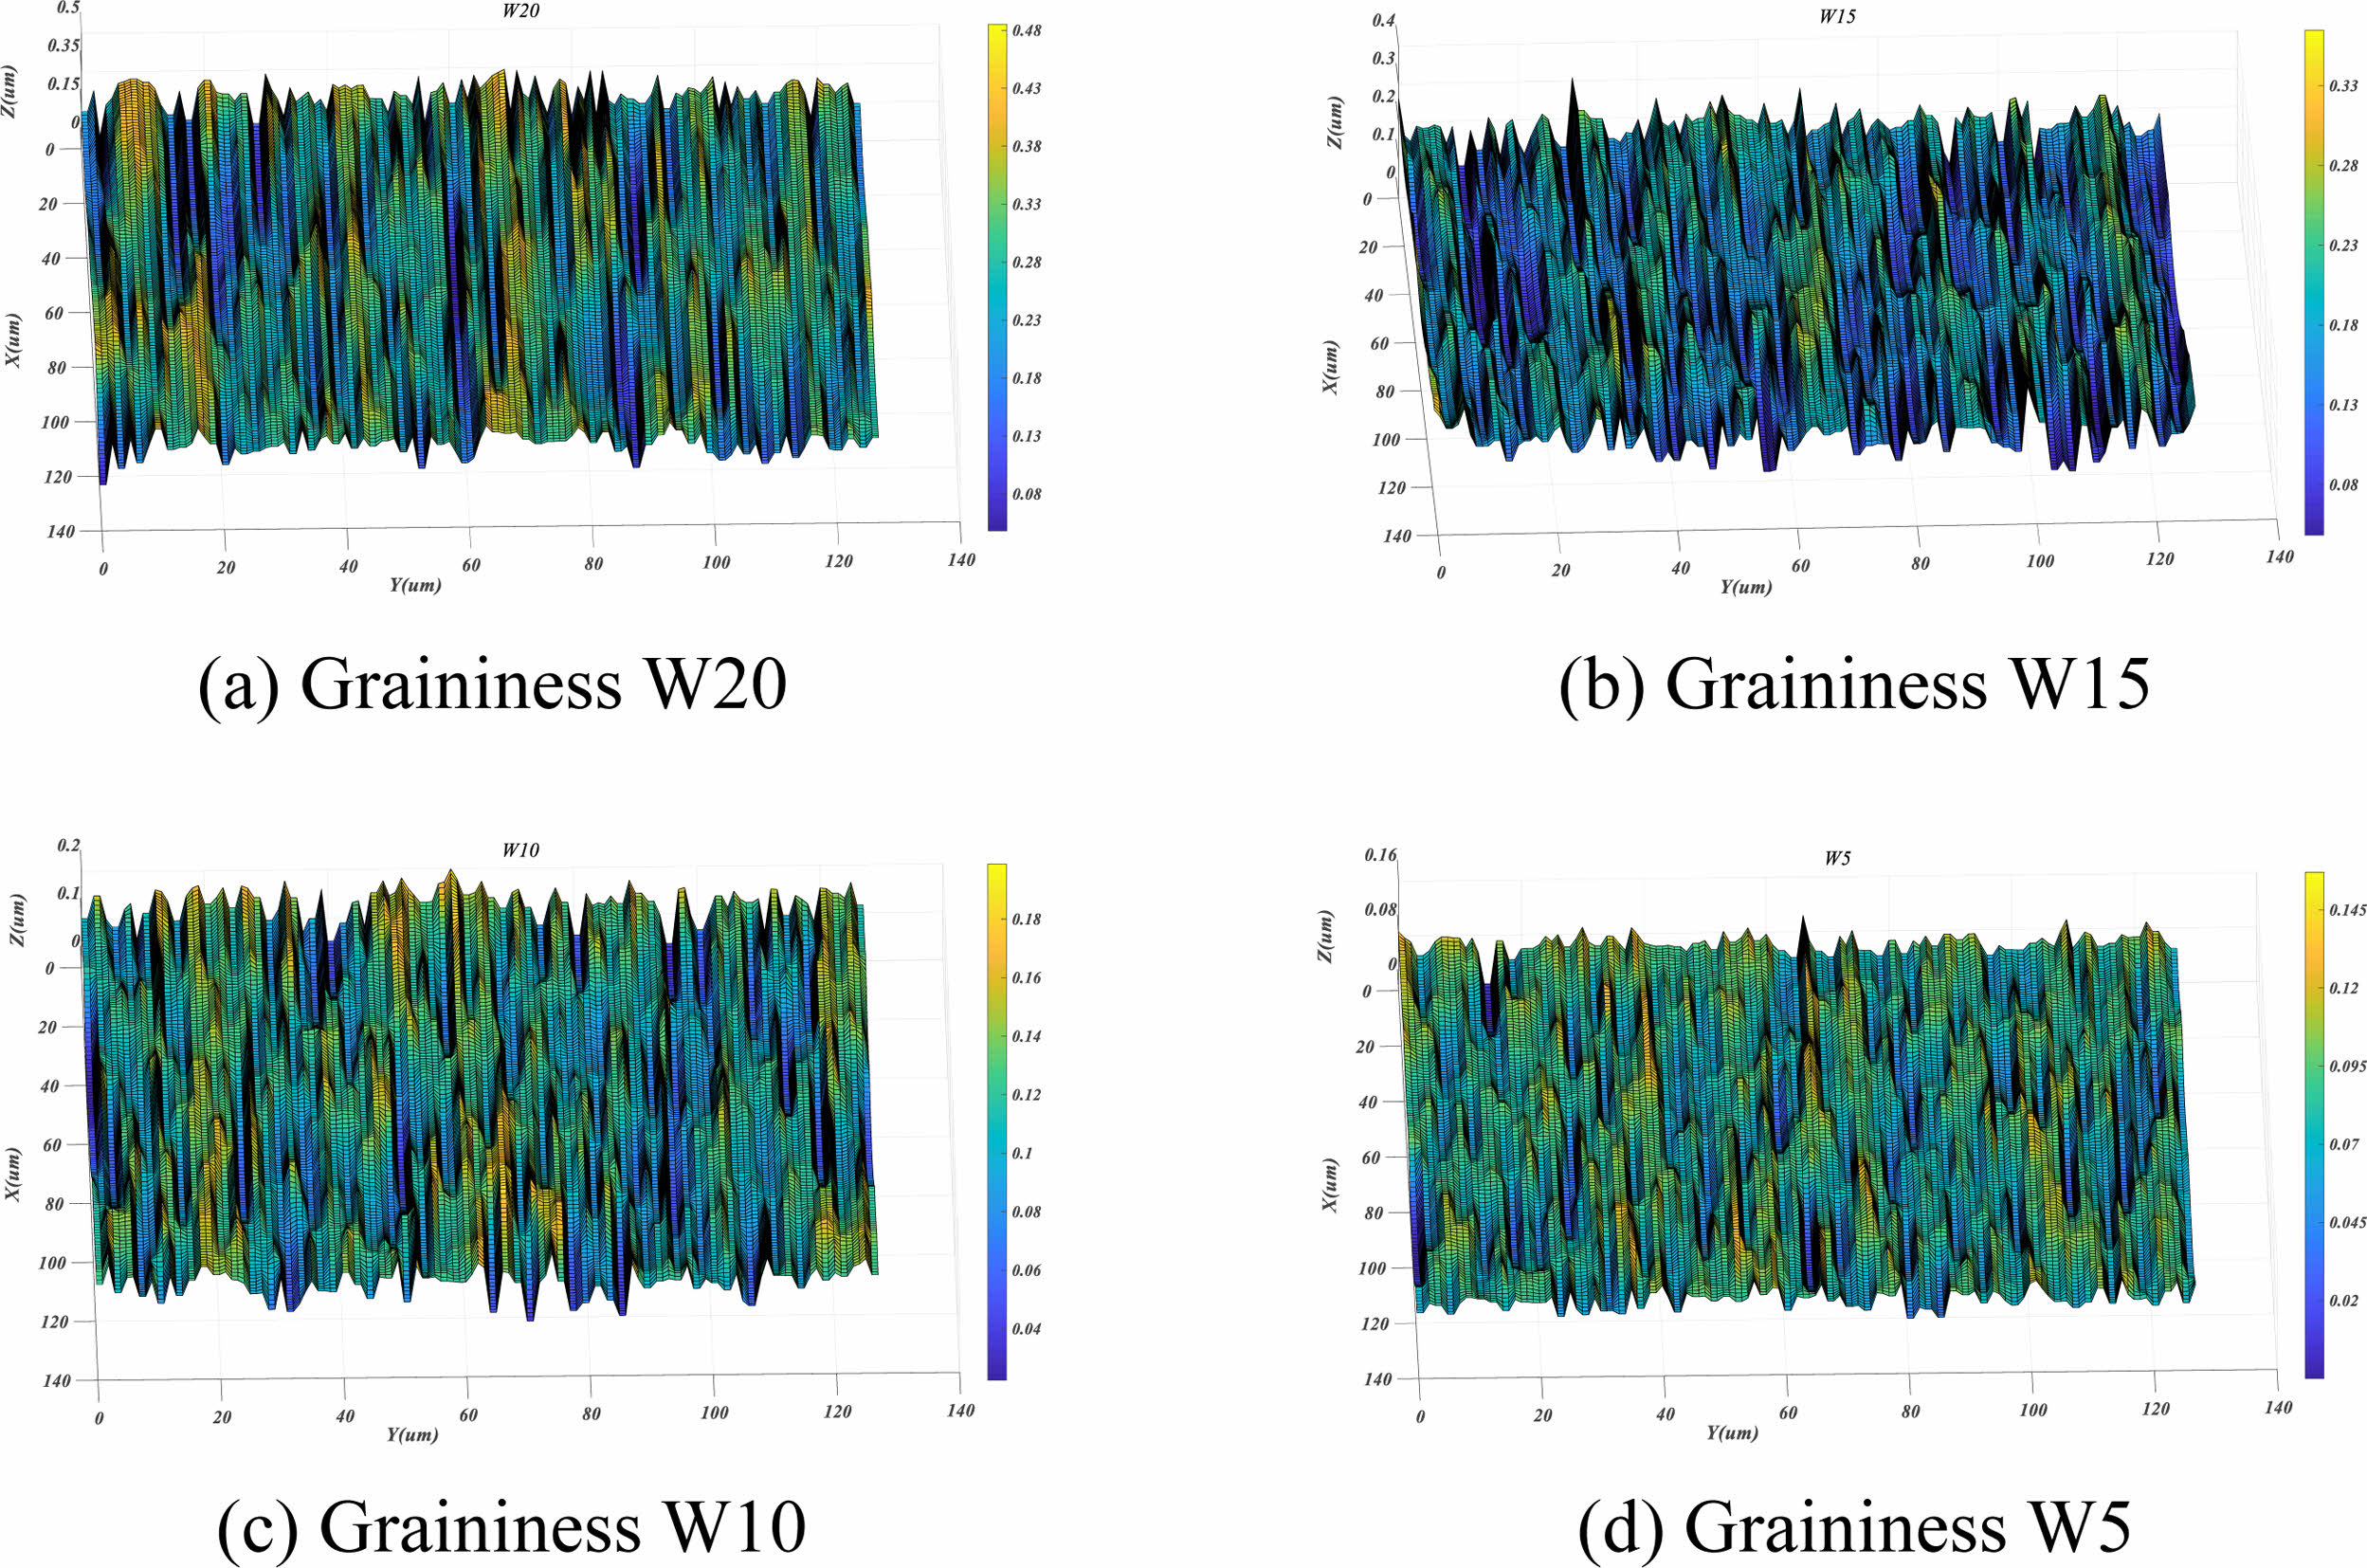
At this time, the conditions are pressure (6.33 N), grinding disc speed (100 r/min), and grinding liquid concentration (25%). As can be seen from Fig. 2.2(a), when the abrasive particle size is W20, the difference between surface scratch peaks and valleys can reach 0.5um, the surface is steep, the number of deep scratches is serious, and the scratches are long, and some pits appear. As can be seen from Fig. 5(b), at this time, the graininess is W15. Although the overall surface Ry value is still high (Ry value is 0.4 um), the surface smoothness is improved, and only some areas of Ry show sudden changes. As can be seen from Fig. 5(c) and Fig. 5(d), Ry value decreased significantly at this time. Although there are still many deep scratches on the surface when the grain size is W10, Ry is small, so the flatness is small. When the particle size is W5, the flatness is further reduced and the number of deep scratches is reduced.
According to the analysis of Fig. 5, under the conditions of constant pressure (6.33 N), grinding disc speed (100 r/min) and grinding liquid concentration (25%), when the graininess gradually decreases from W20 to W5, the contour height of the ball surface decreases, the surface roughness decreases significantly, and the surface quality becomes obviously better.
Analysis of simulation results under different abrasive concentration conditions
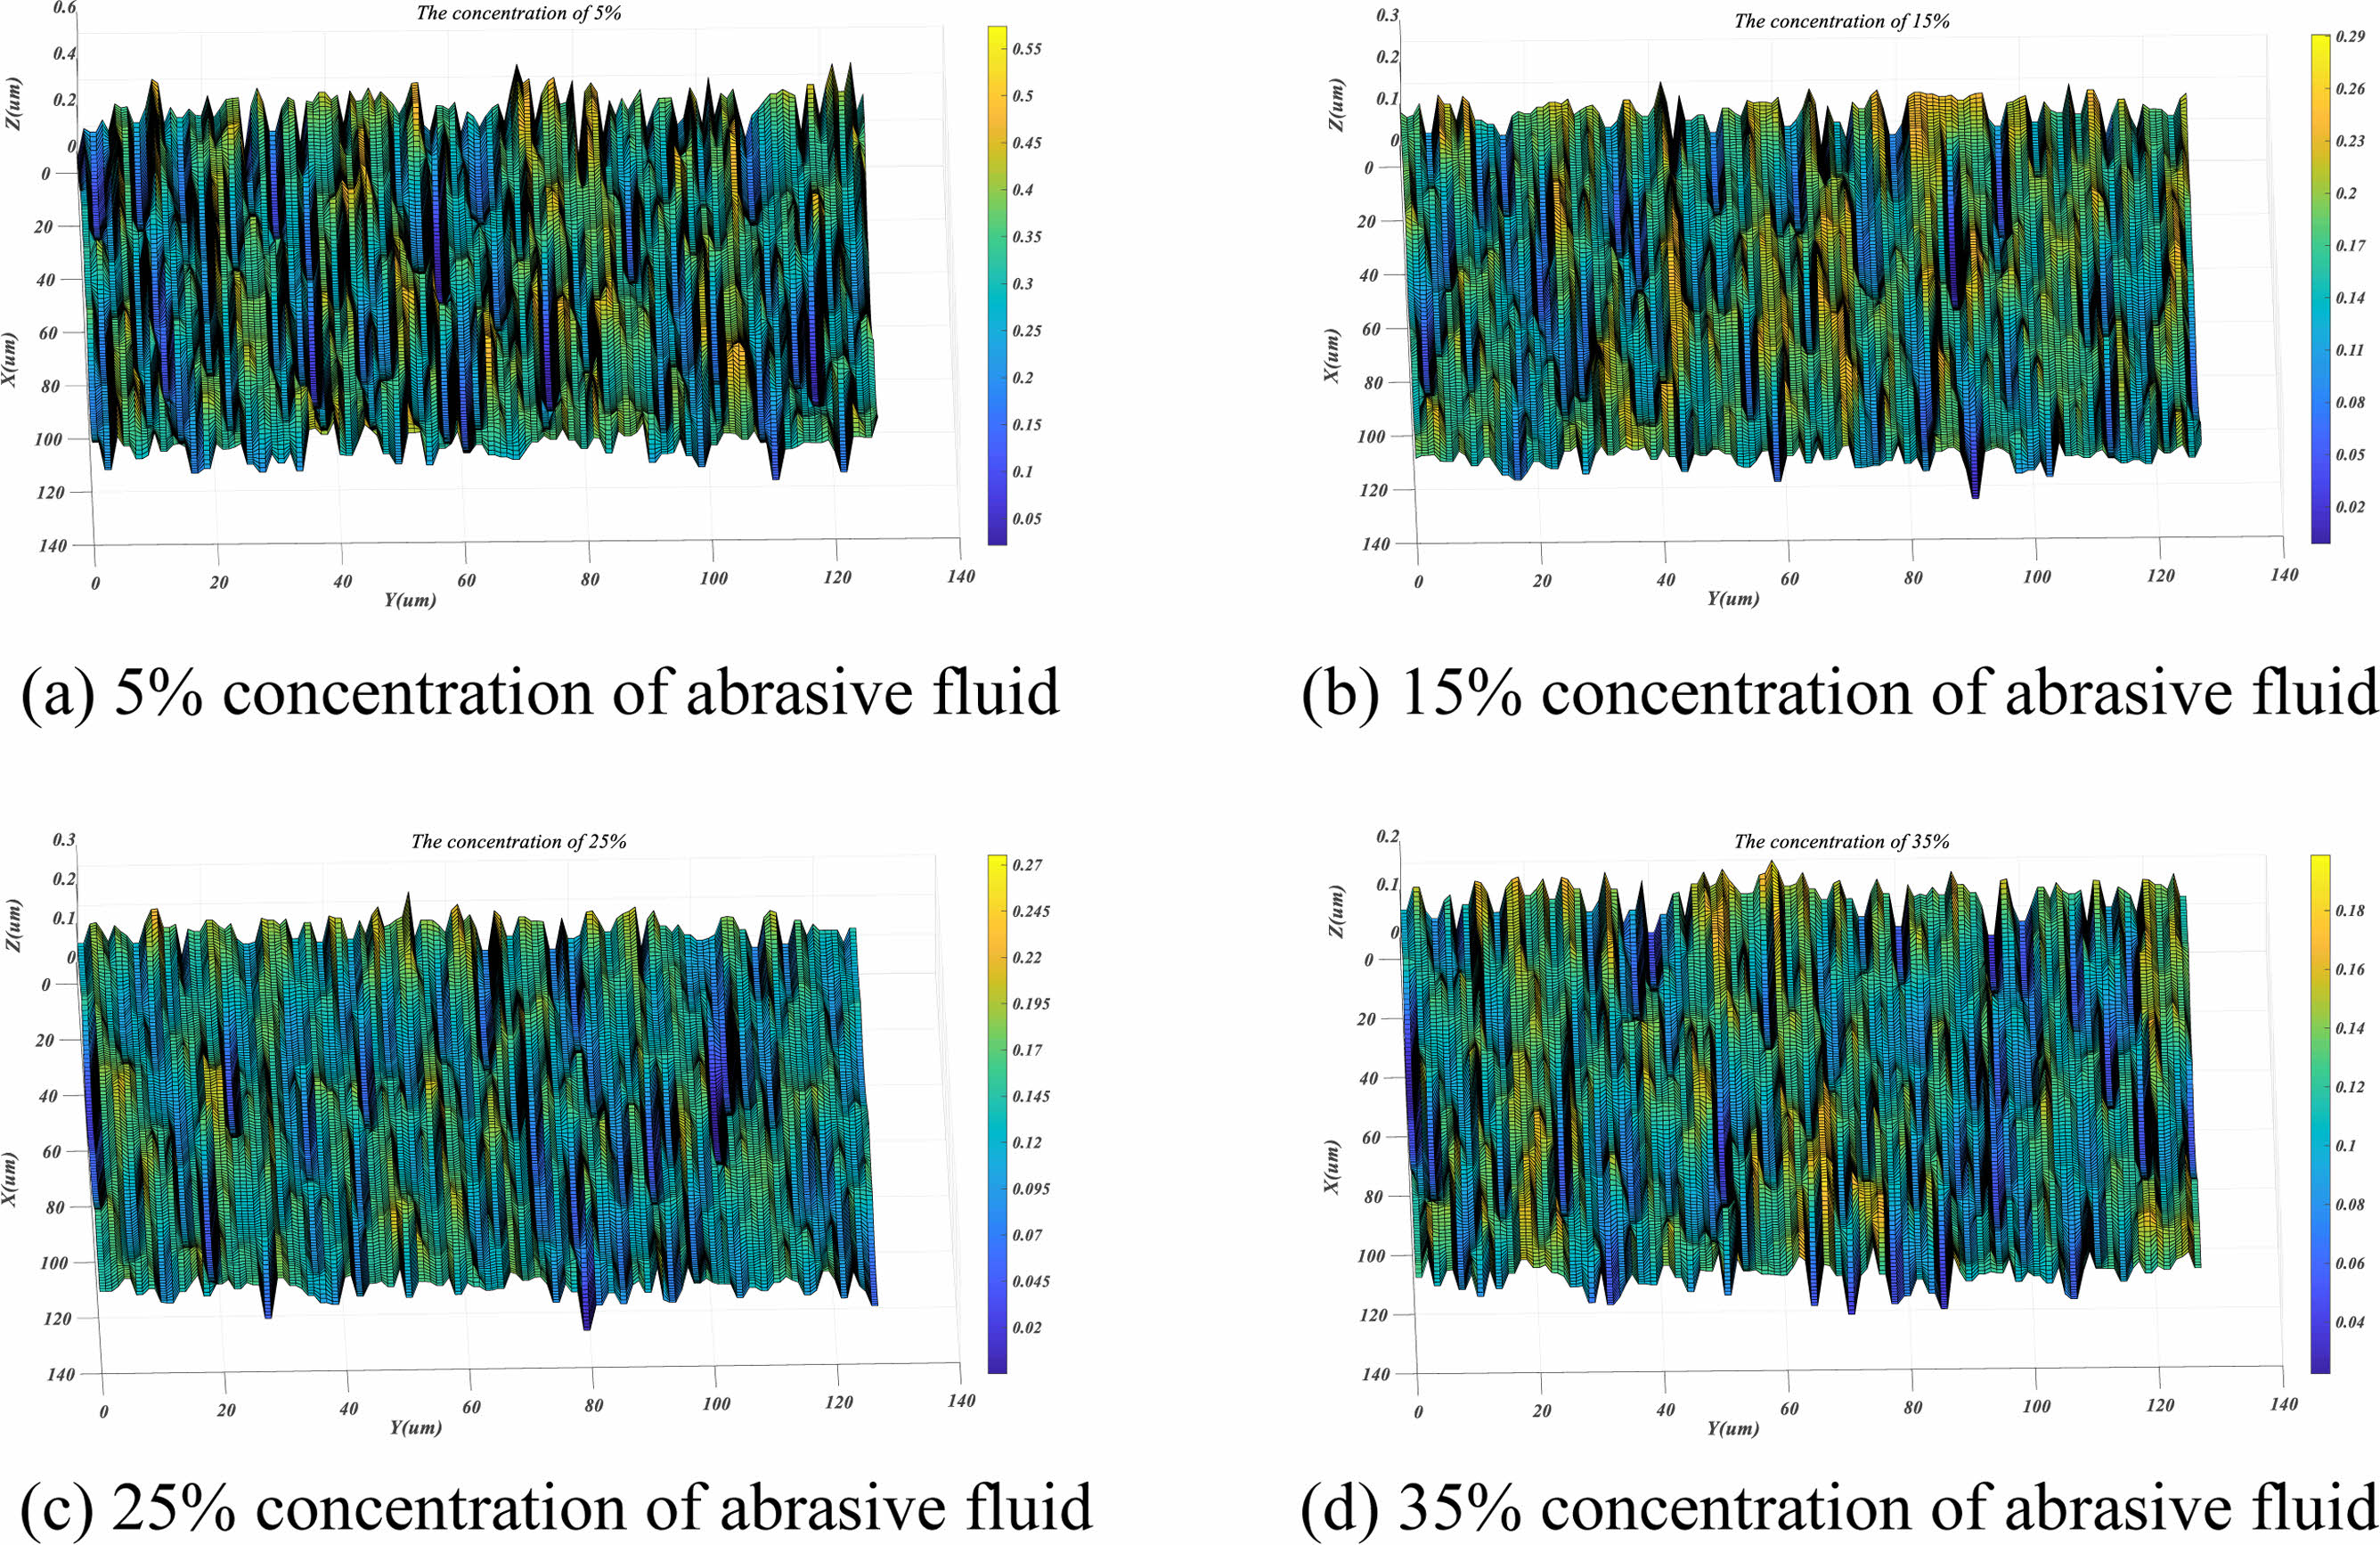
Similarly, set the rotation speed of the grinding disc (100 r/min), the load imposed by the external device (6.33 N), and the particle size (W10) as the initial conditions, gradually increase the concentration of the grinding liquid, and obtain the simulation results of the sphere surface as shown in Fig. 6 below. As can be seen from Fig. 2.3(a), when the concentration is 5%, the abrasive particles are too sparse, and multiple abrasive particles cannot effectively remove the material together, resulting in multiple parallel deep scratches and pits. In Fig. 2.3(b), when the concentration was 15%, the Ry value decreased significantly, indicating that the abrasive particles played a correct grinding role. But there are still deep scratches, the plane is still steep, and the flatness is large. It can be seen from Fig. 6(c) and Fig. 6(d) that the concentration of grinding fluid increases and the Ry value decreases, indicating that the effective abrasive particles increase and the flatness decreases during the simulation grinding process. That is to say, too small concentration of grinding fluid in the grinding process will lead to the change of removal mode, the increase of scratch depth, and the deterioration of surface quality.
Analysis of simulation results under different rotational speeds of abrasive discs
Transform formula (16) to get formula (17). The particle size (W10), particle concentration (25%) and the load applied by the grinding device (6.33 N) are set as constants during the grinding process. At this time, the ratio of the angular velocity ωp of the grinding disc to the angular velocity Ω of the ball rotating around the spindle is a constant. The speed of the grinding disc has a small effect on Lx, so the speed of the grinding disc has an equally small effect on the roughness. From Fig. 7, it can be seen that the change in rotational speed has a small effect on the 3D simulation shape.
|
Fig. 4 Flow chart of simulation calculation. |
|
Fig. 5 Three-dimensional morphology simulation of ceramic ball surface under different particle size conditions. |
|
Fig. 6 Three-dimensional morphology simulation of ceramic ball surface under different concentration of grinding liquid. |

|
Fig. 7 Three-dimensional morphology simulation topography of ceramic ball surface at different grinding disc speeds |
Test equipment and conditions
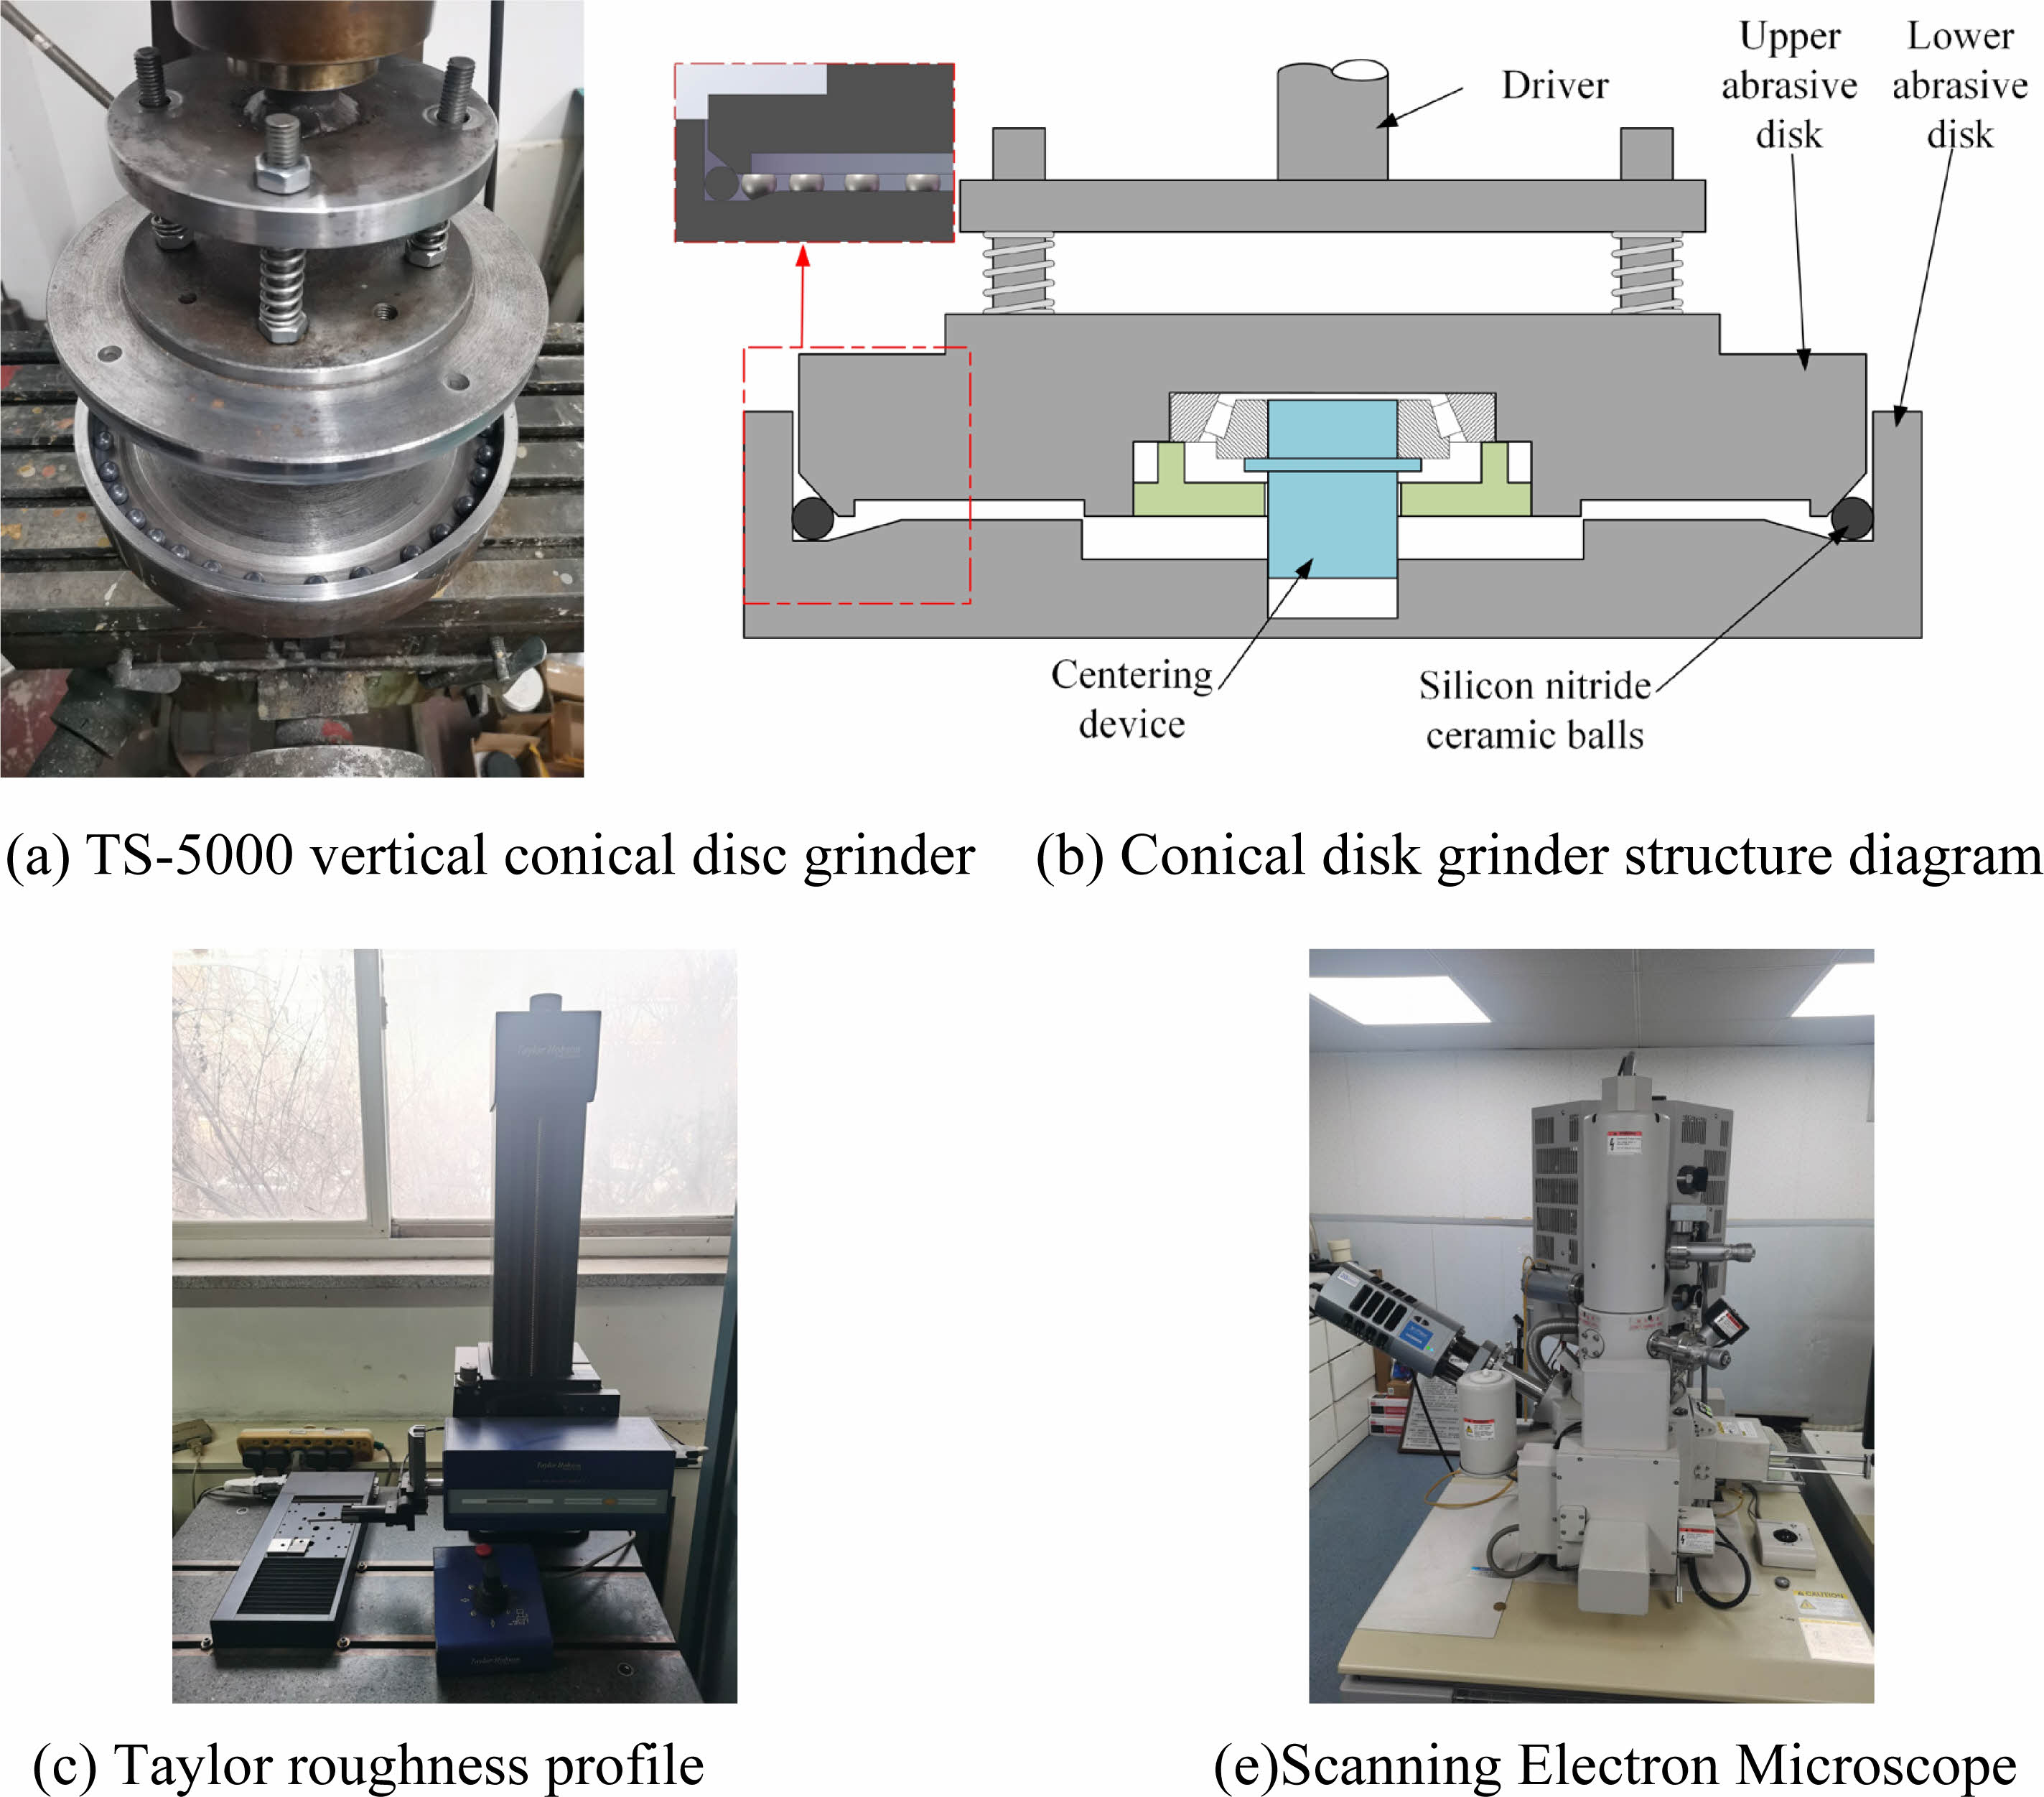
For validation of simulation results. A vertical conical disc grinder, model TS-5000, was used, the structure of which is shown in Figs. 8(a) and 8(b). The grinding disc speed variation range is set to 50 r/min~200 r/min. Roughly ground hot isostatically pressed silicon nitride ceramic balls were selected for the test. The blank balls used in this test had an average diameter of 12 mm. The load applied to a single ceramic ball during the grinding process was set to be 6.33 N. Set the grain size of abrasive particles in the grinding process from W5 to W20. The base liquid of the grinding solution used is water, the abrasive material is diamond, and the concentration of the grinding solution is taken as 5~35%. Each set of tests was initially set to use 36 rough balls, and the duration of each set of tests was 10 h. The surface roughness value of the ceramic ball was measured using a Taylor Roughness Profiler (shown in Fig. 8(c)), which was used to measure six points uniformly distributed on the surface of the ceramic ball, respectively, and the average value was taken as its roughness. The experimentally obtained silicon nitride ceramic spheres were observed and analyzed for their surface morphology by HITACHIS-4800 scanning electron microscope (as shown in Fig. 8(d)).
Design of the experimental program
In view of the fact that the mathematical model proposed above is formed on the basis of ignoring the interaction between each grinding parameter, the single factor experiment method is considered for the verification of the simulation results. Similarly, in order to clearly observe the influence of various factors, the following parameters are set to determine the change trend of each factor at different levels, as shown in Table 2.
Results and Analysis
In order to verify the accuracy of the roughness values Ra and Ry obtained from the simulation results as well as the accuracy of the surface morphology, the corresponding test results are taken out for comparison in this paper, and the specific results are shown in Fig. 9 to Fig. 15 below.
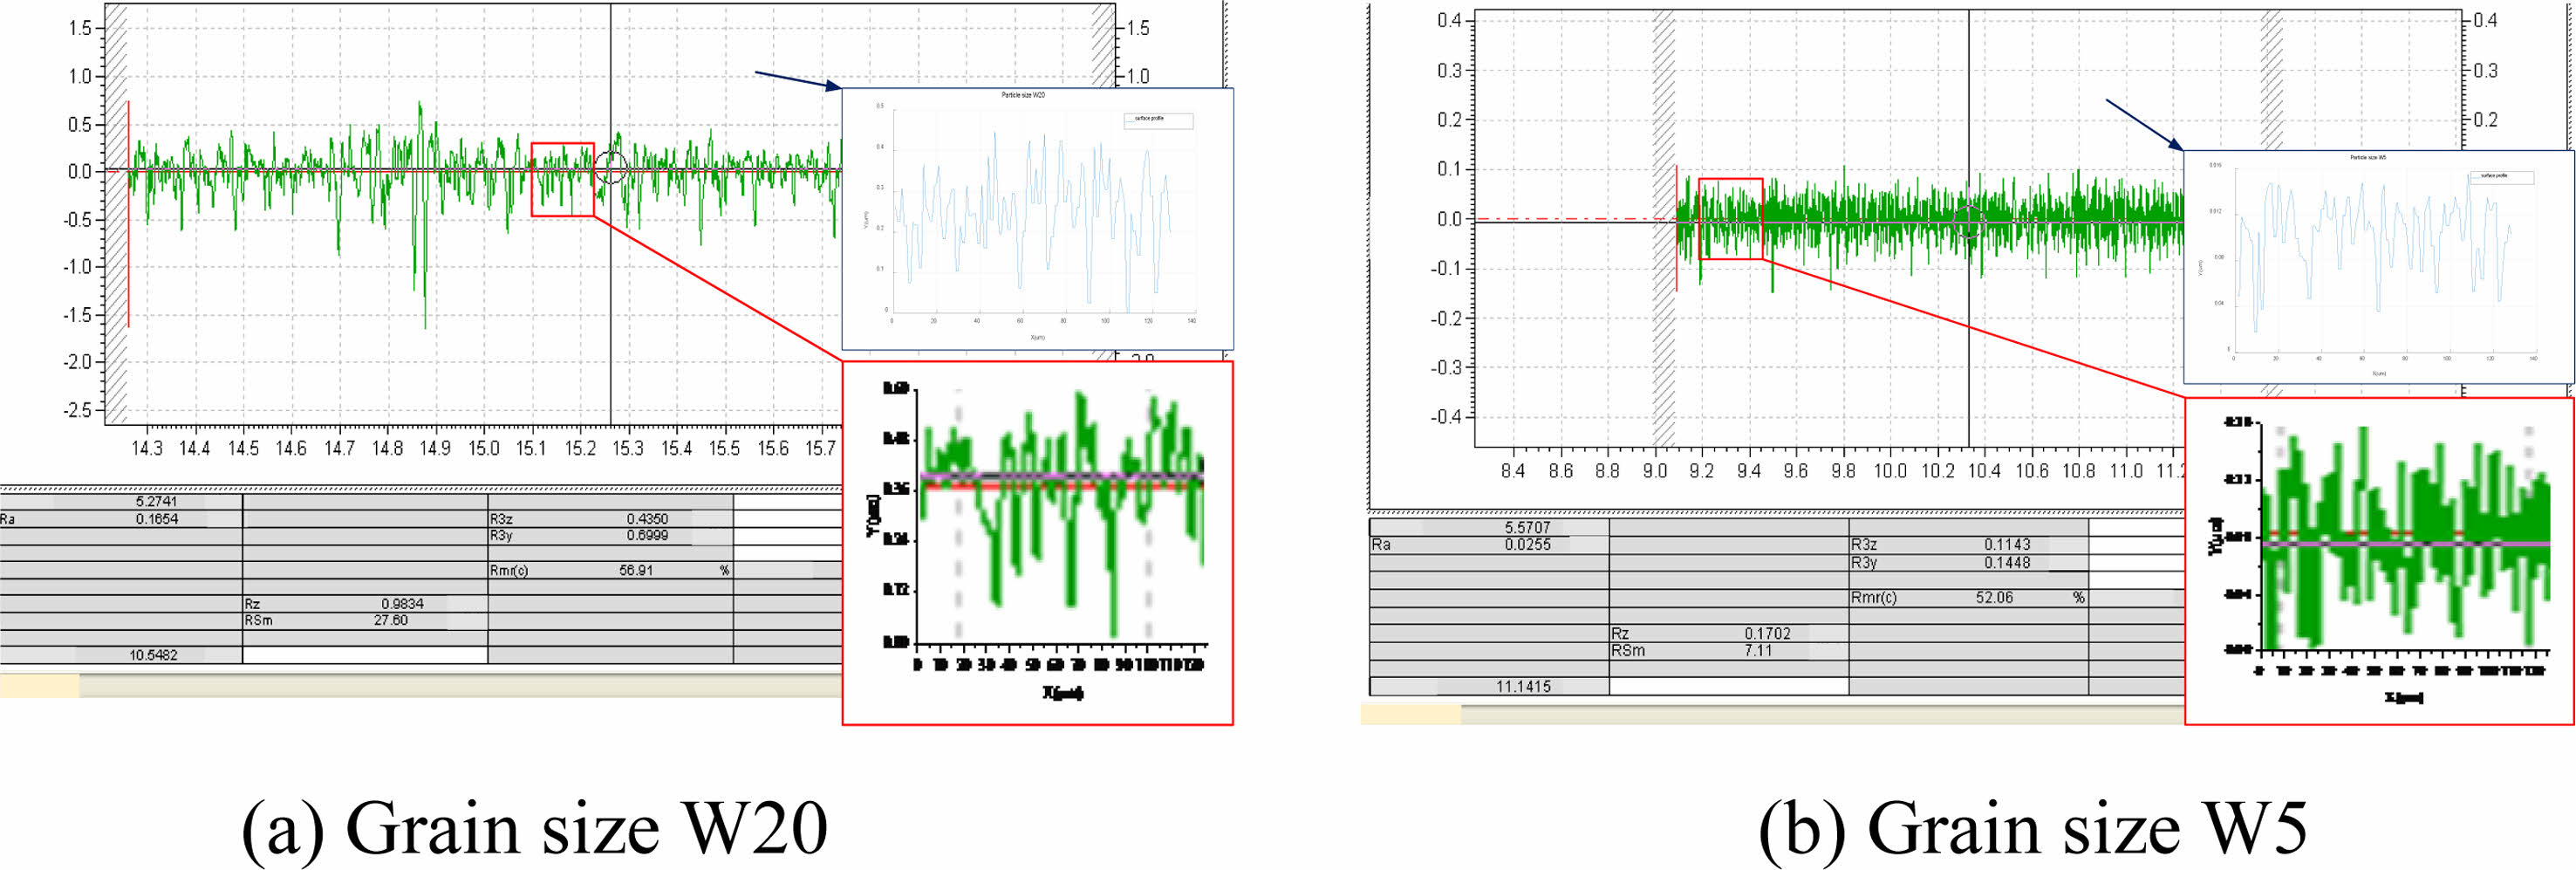
Take any cross section of the simulation model parallel to the YOZ plane of the coordinate system as the simulated surface profile and compare it with the surface of the silicon nitride ceramic sphere measured by the Taylor roughness profiler, as shown in Fig. 9. When the speed is 100 r/min and the concentration is 25%, as the particle size decreases, the difference of the peak/valley of the scratch decreases, and the difference stabilizes within a certain range, making the plane flatter. The simulation can reflect the conclusion accurately.
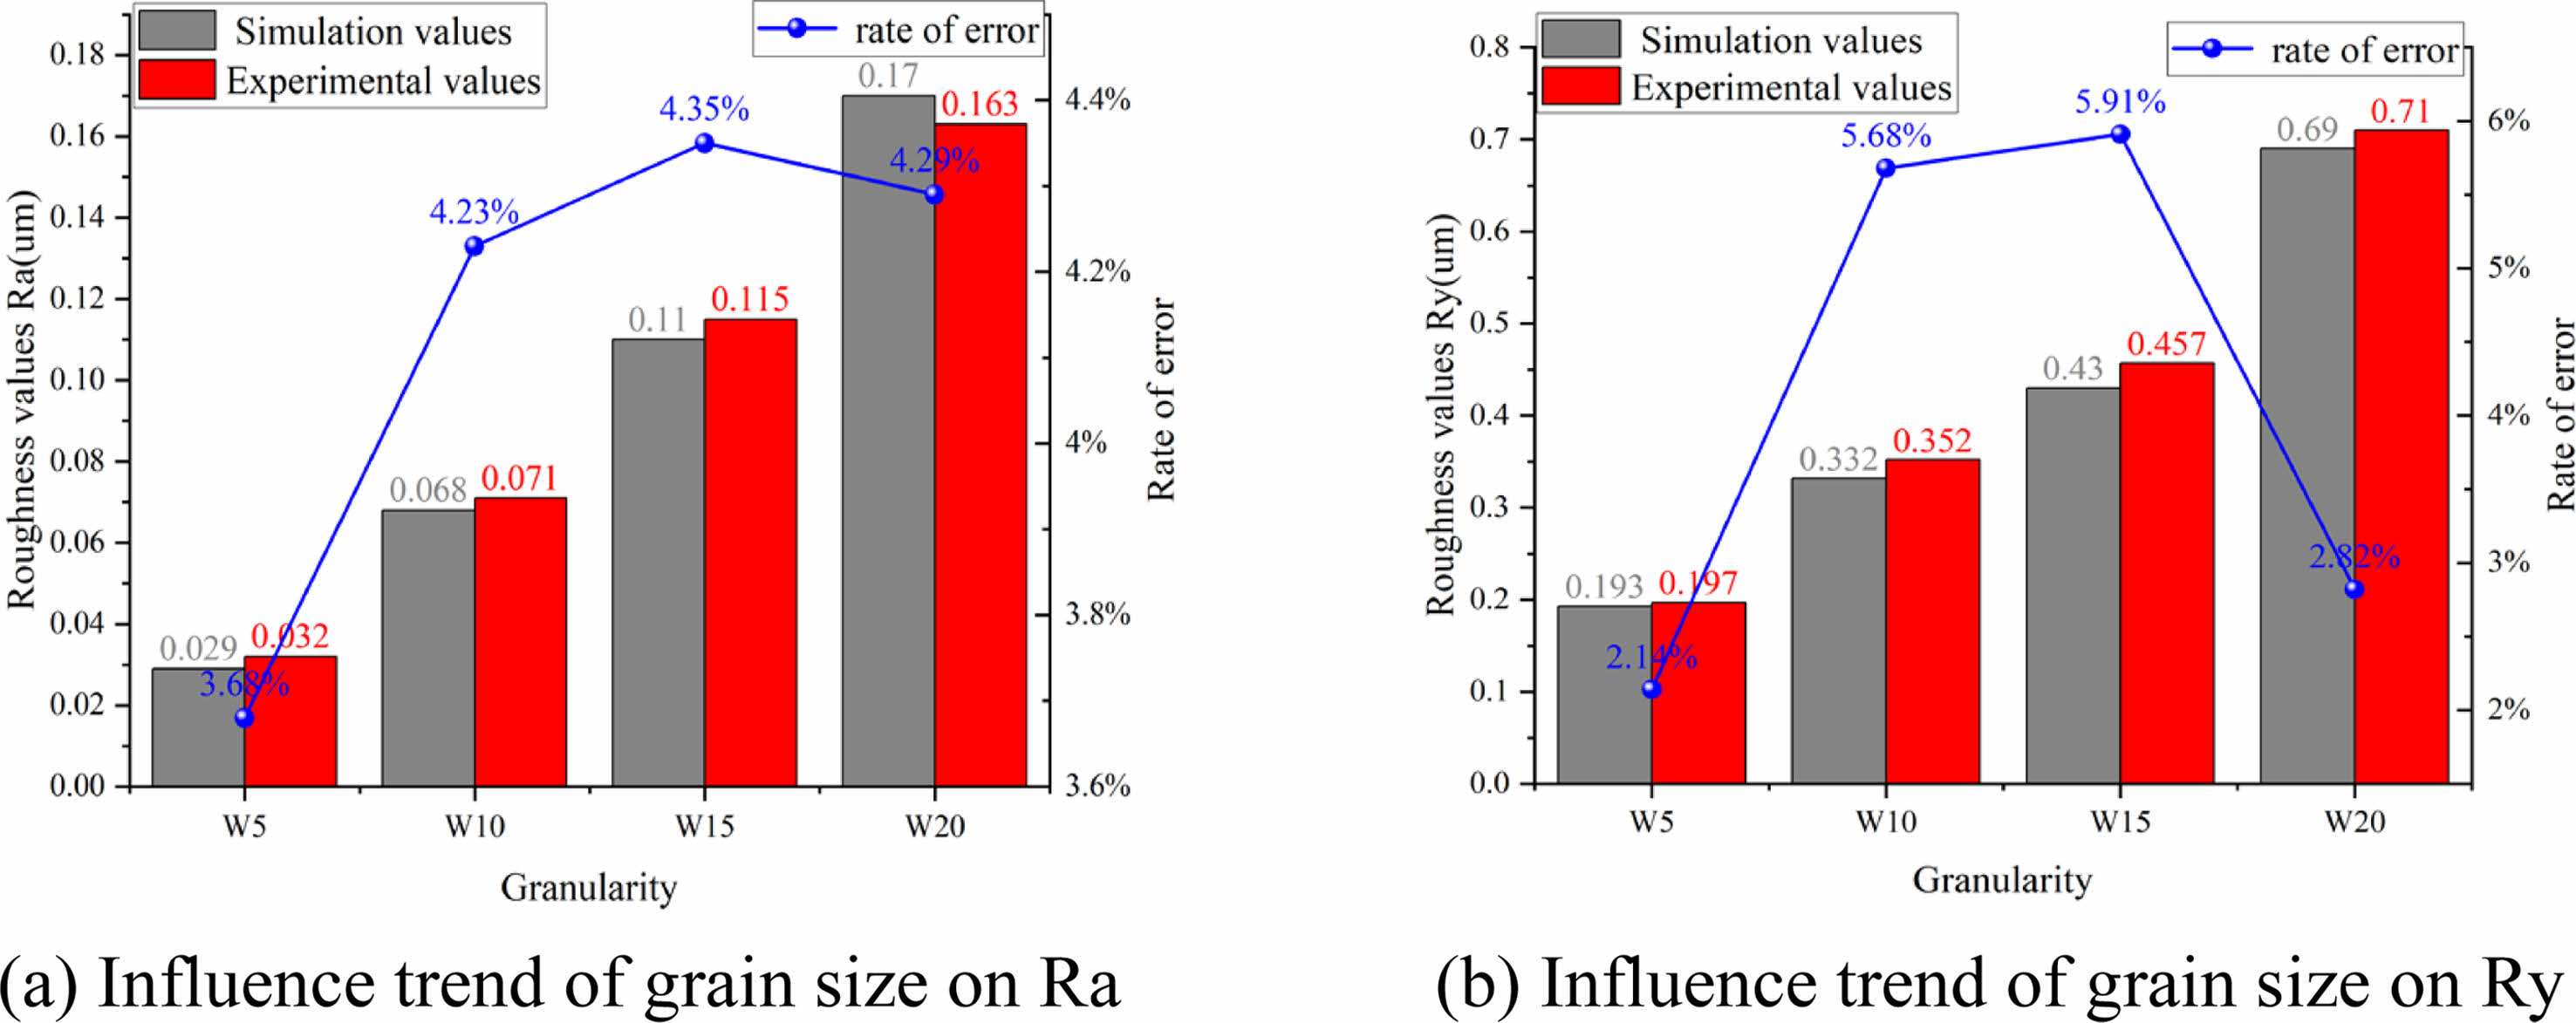
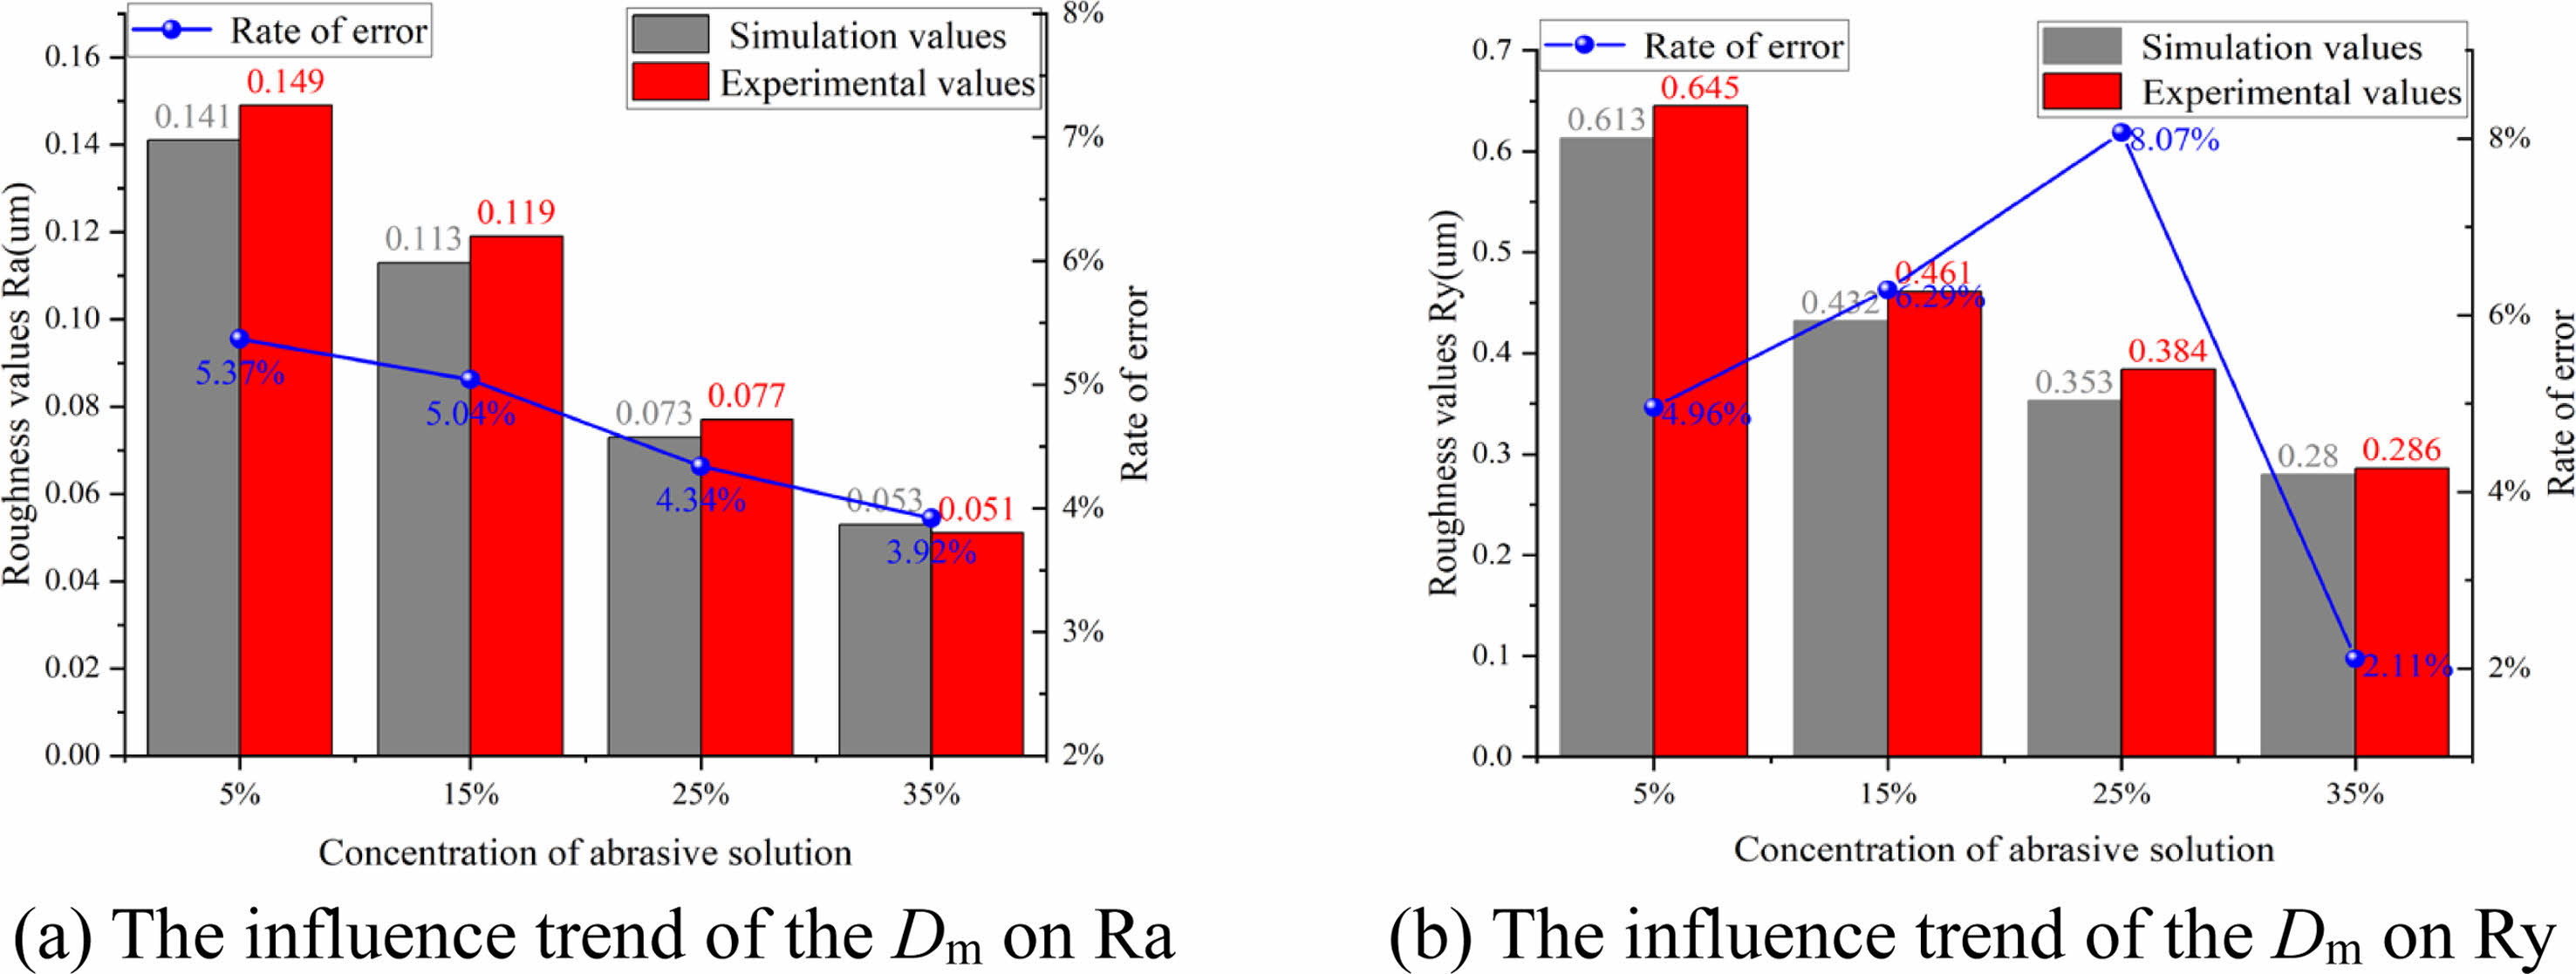
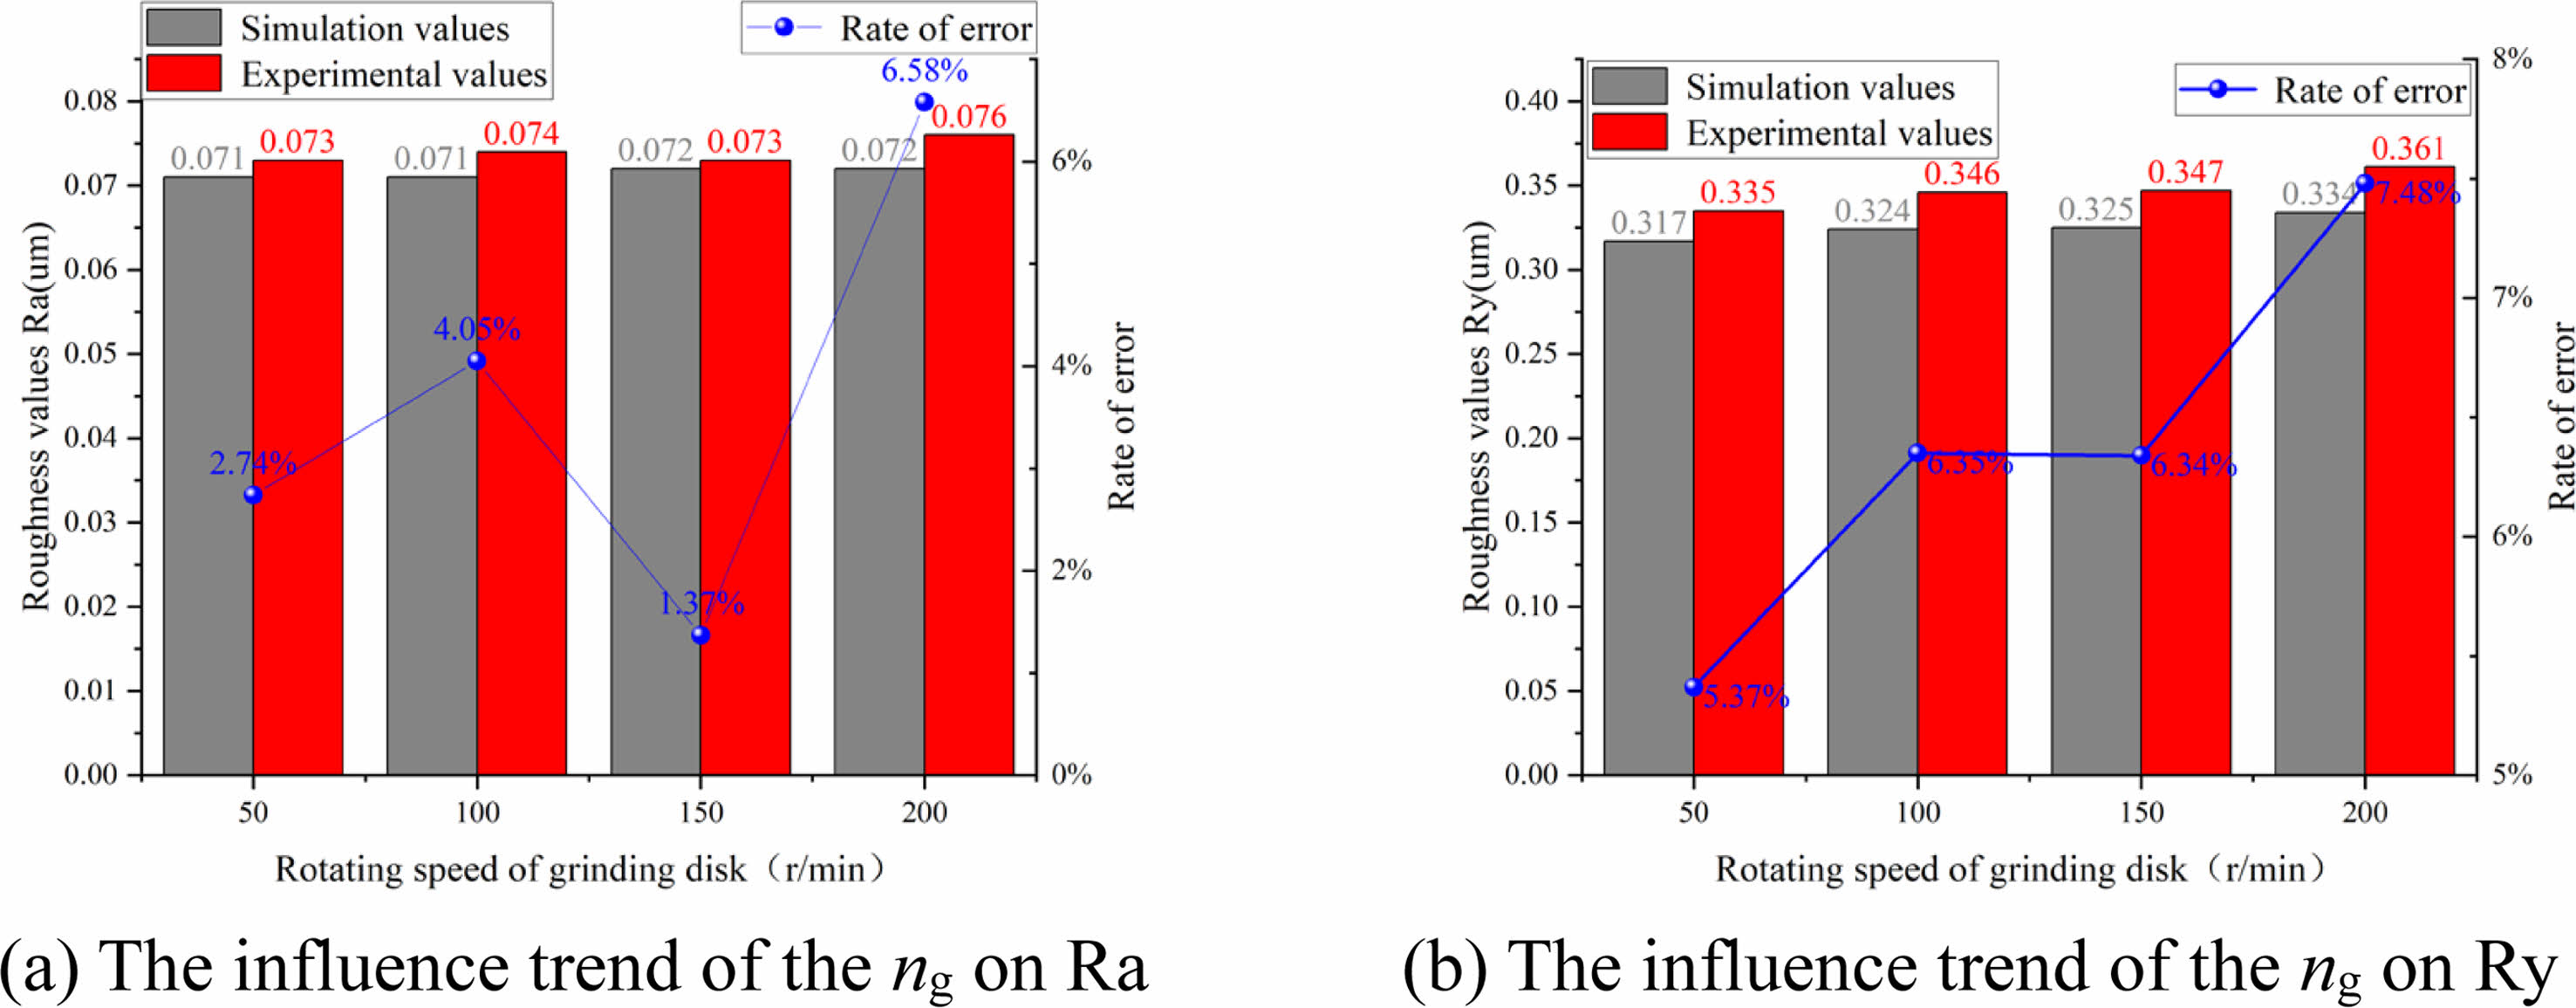
With a fixed value of pressure applied by the grinding device, in Fig. 10, at which time the rotational speed is 100 r/min and the concentration is 25%, it can be seen that the particle size of the abrasive grains plays a dominant role, and the roughness rises sharply as the particle size increases. In Fig. 11, at this time, the particle size is W10, and the rotational speed is 100 r/min. When the concentration occurs to increase, the surface roughness value of the sphere decreases, indicating an increase in the participation of effective abrasive grains, a reduction in the force per unit of abrasive grains, and a more uniform grinding so that its machining accuracy is improved. At the same time the error rate of roughness Ra gradually decreases, reflecting a gradual decrease in the direct grinding of the abrasive disk and the ball, and a more accurate simulation; In Fig. 12, the particle size at this point is W10 and the concentration is 25%. The slight increase in the test value at 200 r/min is due to the fact that during the grinding process, as the rotational speed increases the impact load on the ball increases resulting in a slight increase in the roughness, and at the same time resulting in an increase in the error rate;
For the analysis of surface morphology, the test parameters of each group are the same as Table 2 above.
Analysis of test results under different abrasive grain size conditions
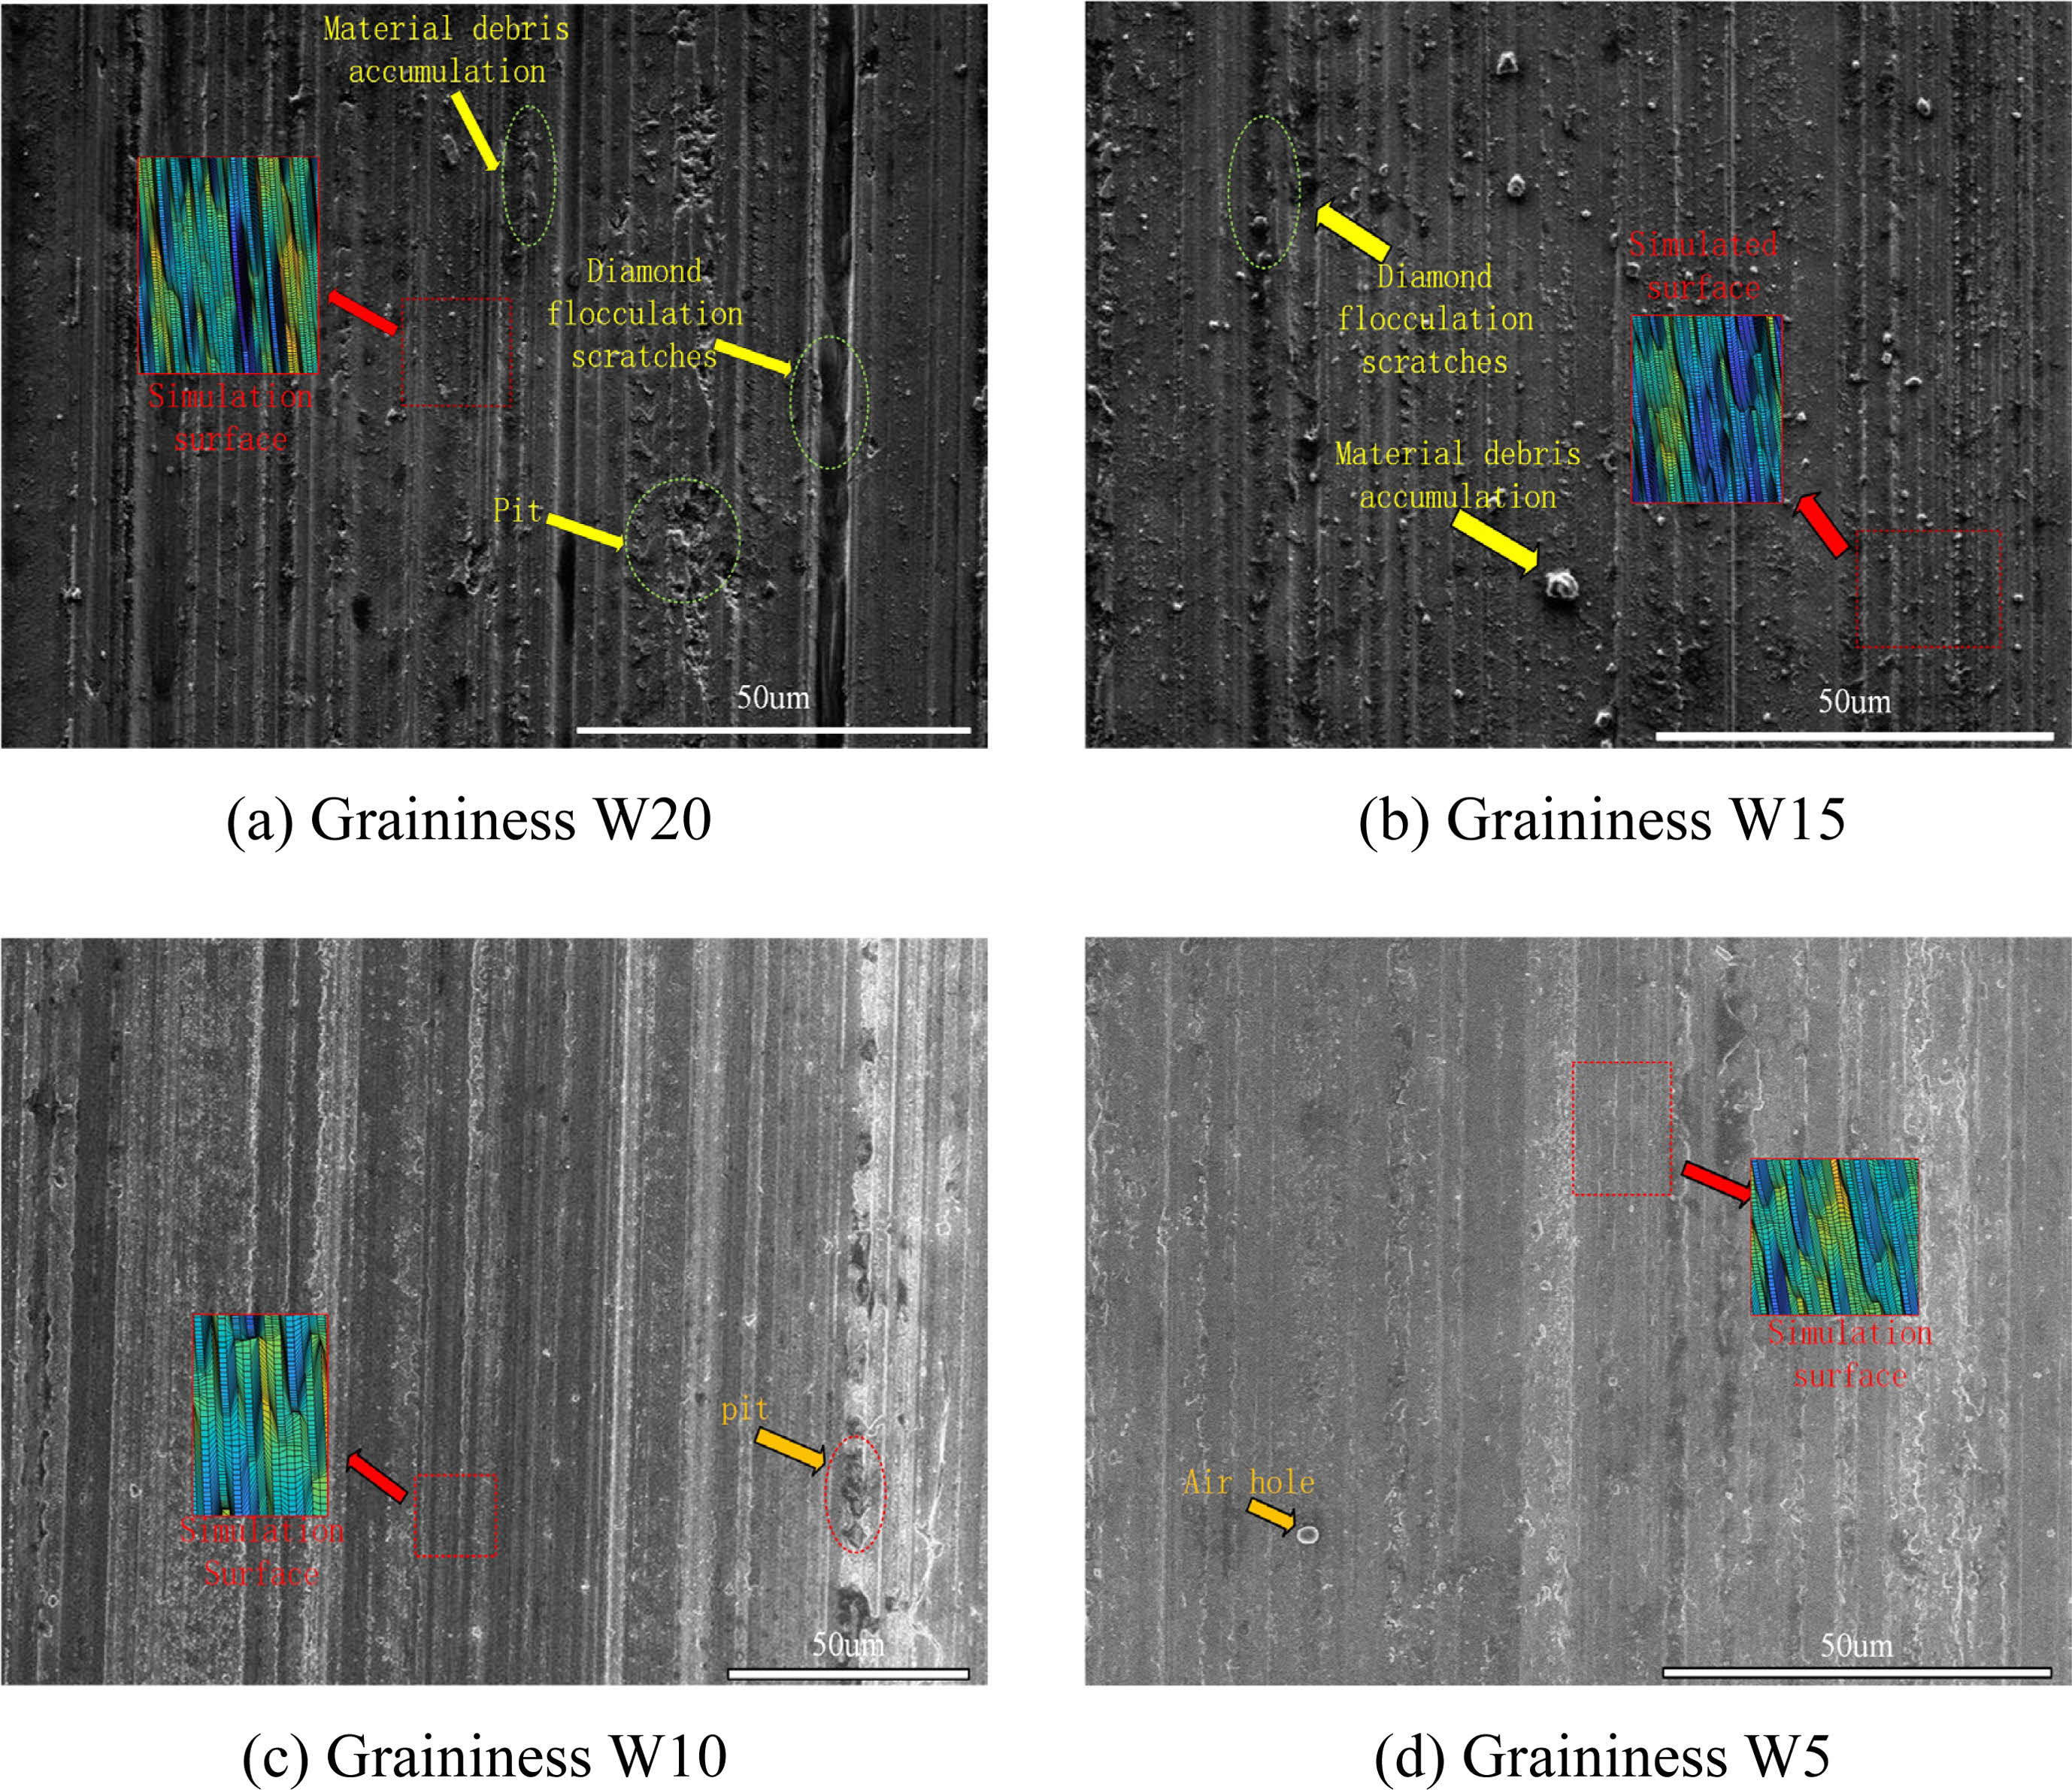
According to Figs. 13(a) and 13(b), when the abrasive particle size is W20 and W15, deep scratches can be obviously observed, and debris accumulation blocks appear at the edge of the scratch and at the scratch. The scratches caused by the flocculation of the abrasive particles cause serious damage to the surface of the sphere. When the particle size is W20, because the particle size is too large, the transverse crack breakage caused by point pressure is obvious. In Fig. 13(c) and Fig. 13(d), most of the adverse phenomena are caused by their own defects (pores) and working environment (impact pits), and the surface is generally good. The simulated surface can reproduce the fine surface of the ball after grinding by different particle sizes of abrasives, such as Figs. 13(a) and 13(b), the wide scratch of the ball surface after the interaction of multiple abrasive particles, and the scratch of the small particle size after the scratch and rolling of the abrasive particles in Figs. 13(c) and 13(d).
Overall analysis shows that particle size mainly affects the difference between peaks and valleys on the surface. Part of the material that should be removed is deposited on the surface of the ceramic ball, and part of the diamond particle flocculation leads to the increase of the single grinding amount, which leads to the increase of the machining surface roughness. With the decrease of particle size, the difference between peak and valley on the surface gradually decreases, and the surface becomes more flat. This is in accordance with the simulation results.
Analysis of test results under different grinding solution concentrations
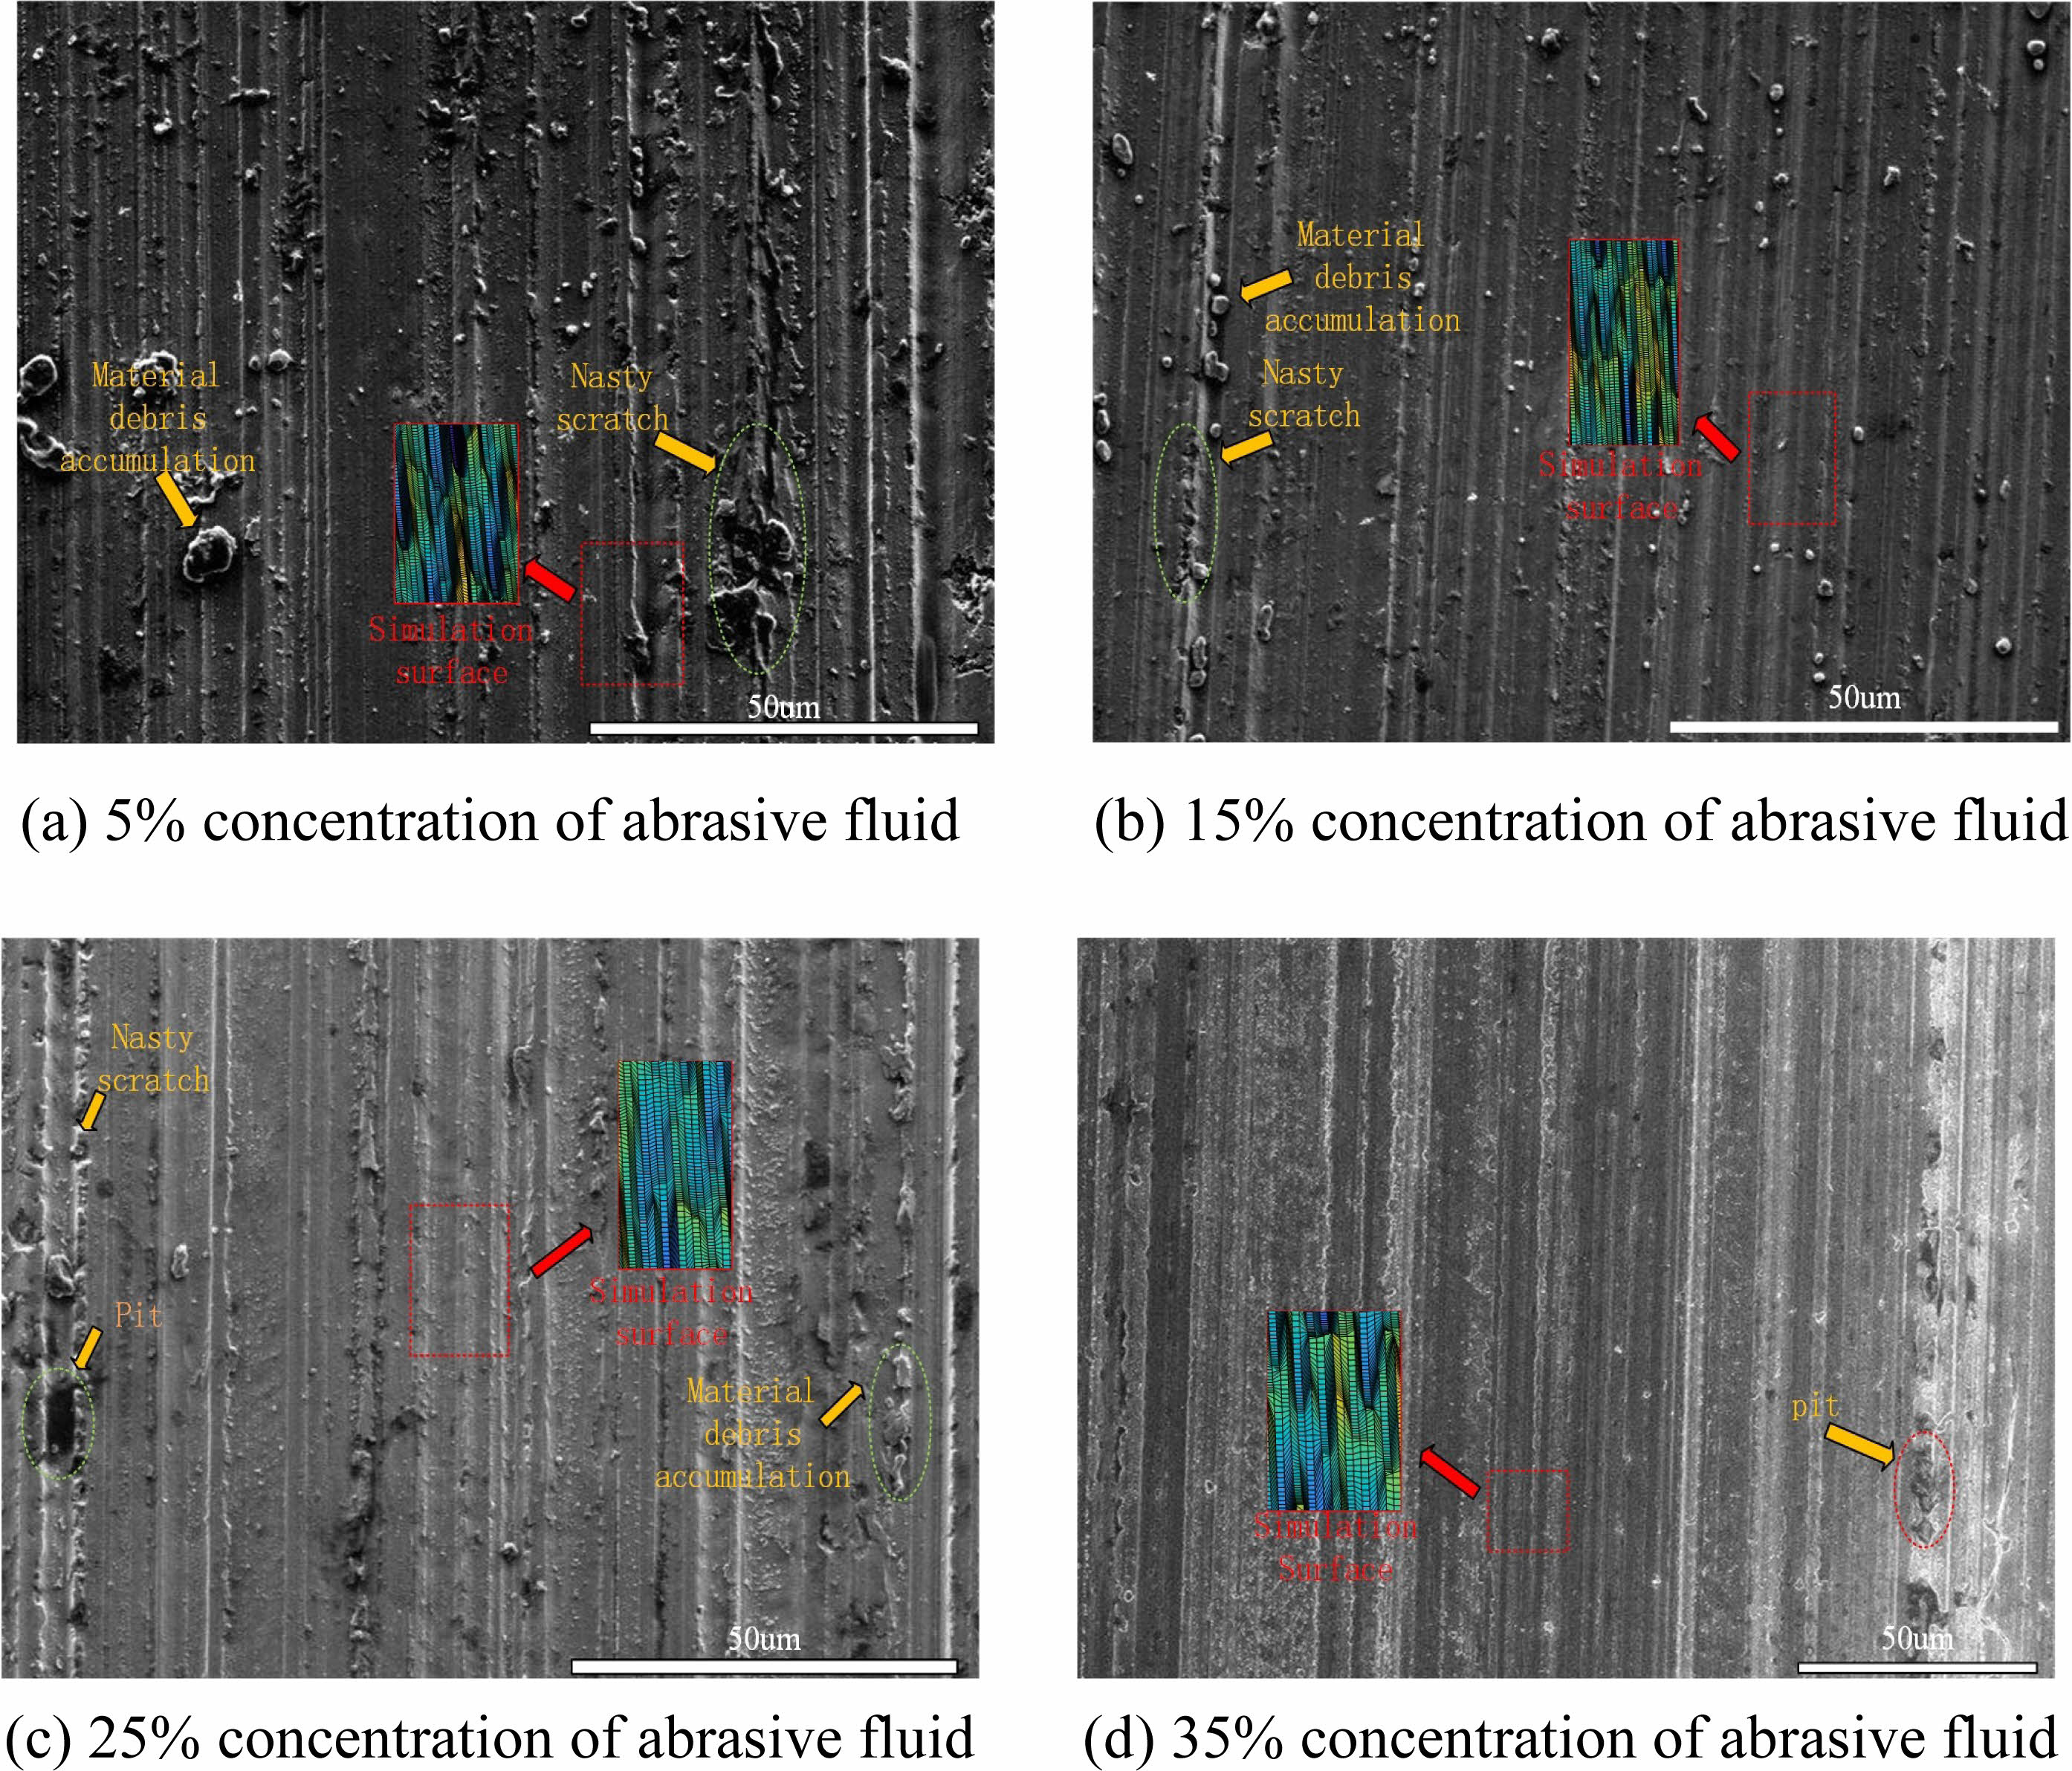
As can be seen from Fig. 14(a), when the concentration is 5%, a large number of materials that should be removed can be seen attached to the surface of the ceramic ball and serious malformed scratches, causing great adverse effects on the surface roughness. This is mainly due to the low concentration resulting in excessive pressure on a single abrasive particle and direct contact between the grinding disc and the ball. In Fig. 14(b), surface defects are significantly reduced when the concentration is 15%. This indicates that the abrasive has played a correct grinding role. As can be seen from Figs. 14(c) and 14(d), as the concentration increases, the bad scratches and surface accumulation materials gradually decrease, and the surface gradually flattens. At this time, the defects of the ball itself and the grinding environment occupy a dominant position in the influence degree. As the concentration of the surface increases, the effective abrasive particles involved in surface grinding also gradually increase, indirectly increasing the number of removal per unit area, thereby helping to remove the surface accumulation material and reduce the roughness. This is consistent with the results of roughness simulation. 3D topography simulation can simulate the curved scratches and parallel scratches caused by abrasive particles under high pressure under low concentration of abrasive fluid, such as Fig. 14(a) and 14(b), and the flat plane under high concentration in Fig. 14(c) and 14(d).
Analysis of test results at different rotational speeds
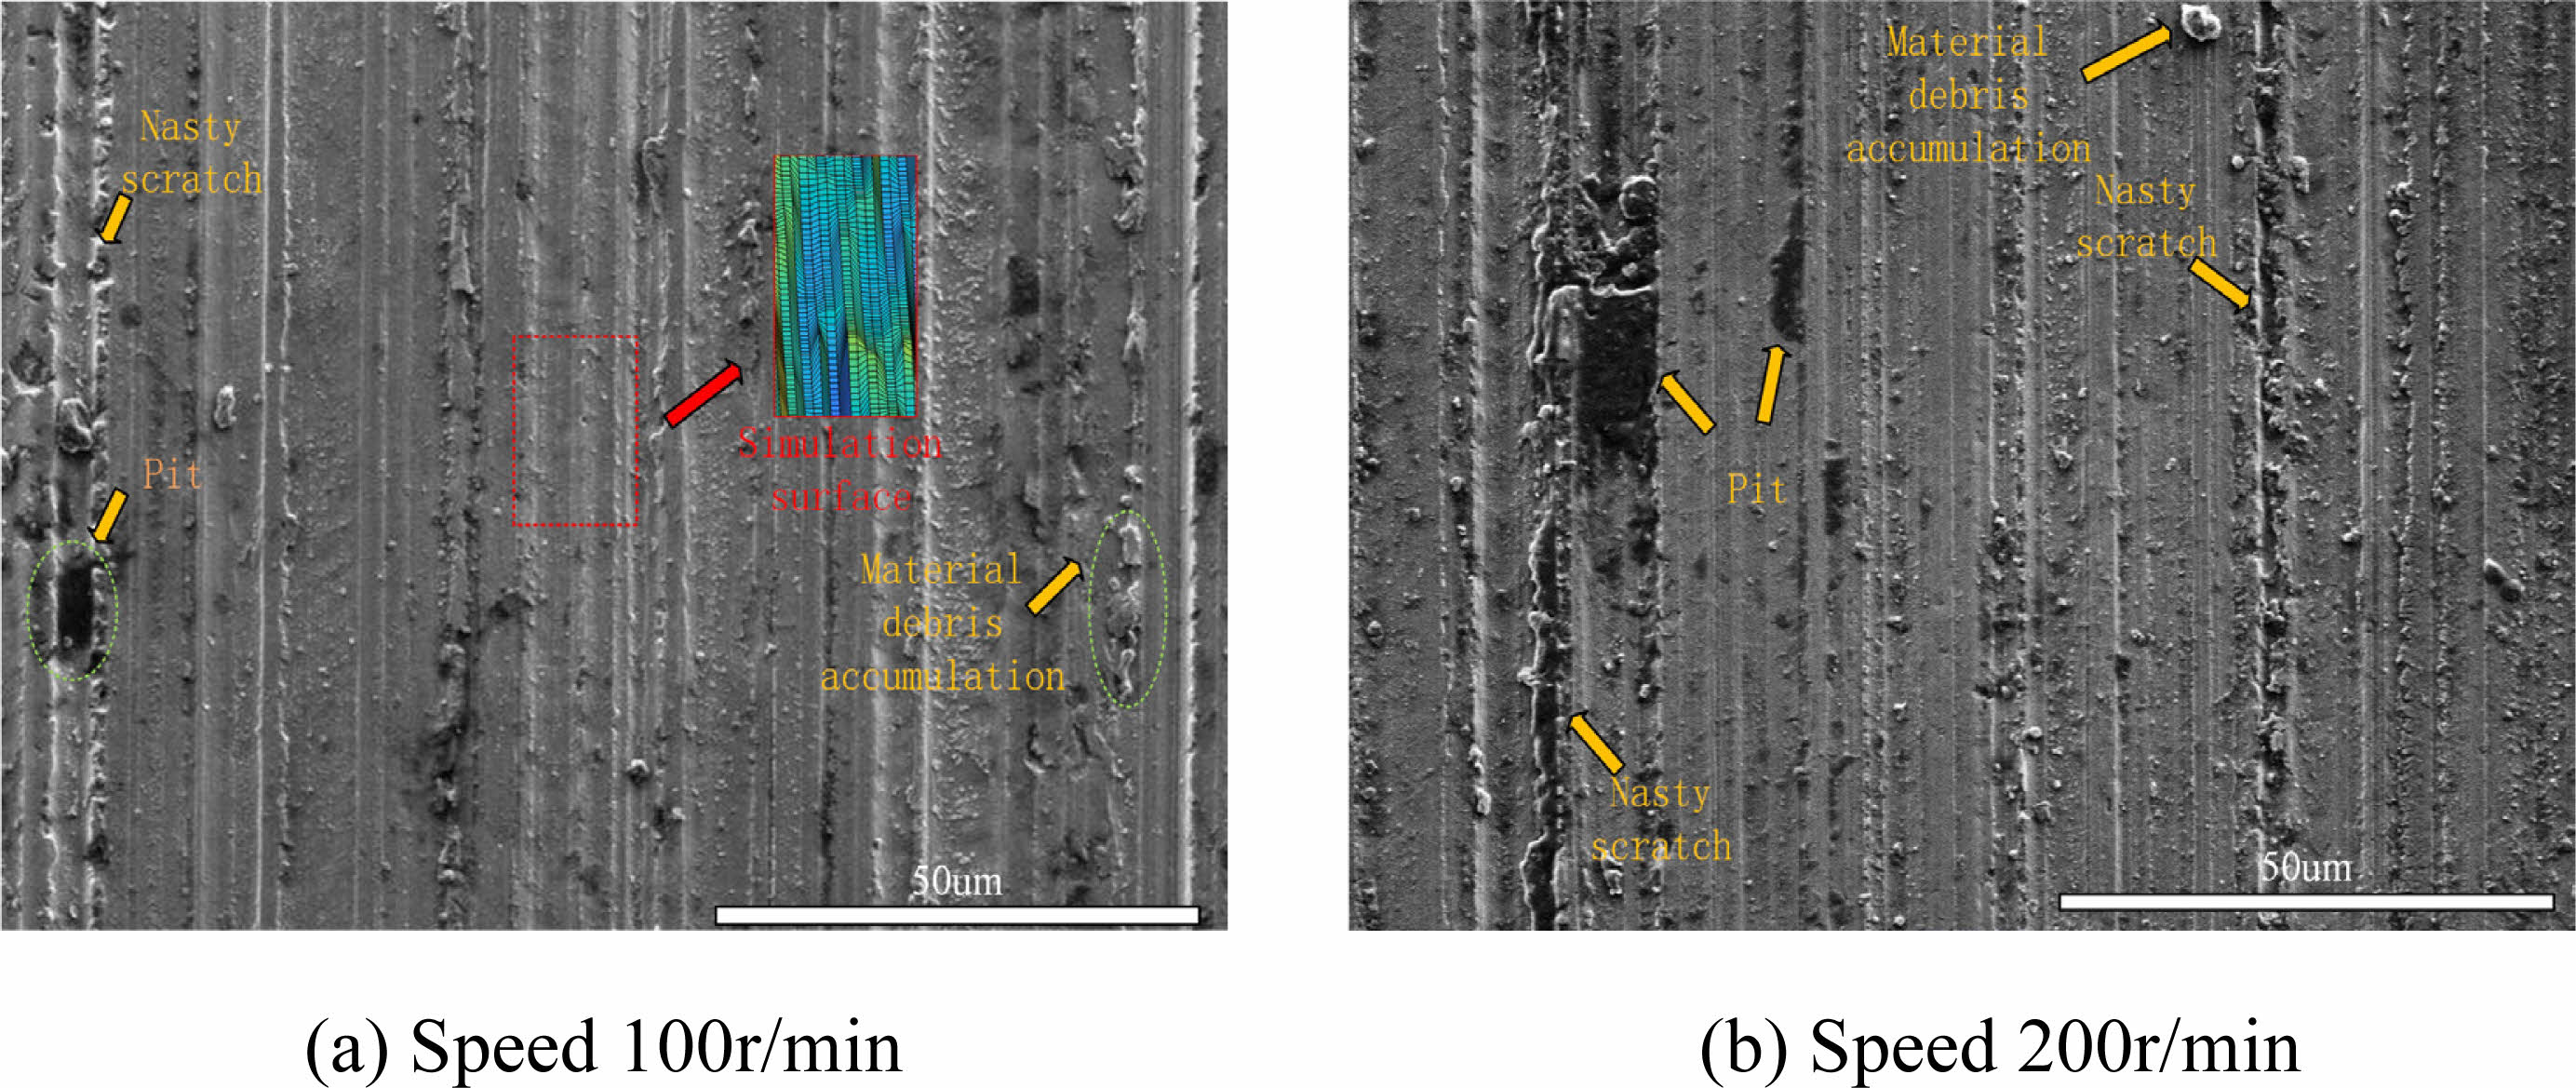
From the test values of roughness Ra and Ry above, it is clear that the rotational speed has little effect on the roughness. Therefore, we analyze the surface morphology at the stable value and the sudden change value, i.e., the surface morphology at 100 r/min and 200 r/min. As can be seen from Fig. 15, when the rotational speed is 100 r/min, there are fewer bad scratches on the surface as well as less accumulation of chip blocks, and the surface is relatively flat. When the speed is 200 r/min, the surface bad scratches as well as debris accumulation is serious and accompanied by a lot of deep pits. The main reason is that when the rotational speed is too fast, the abrasive liquid splashes out of the grinding disk during the grinding process, and at the same time, the abrasive liquid gathers to the edge of the lower disk due to centrifugal force, and the concentration of abrasive liquid in the upper disk decreases, which leads to poor working conditions, increased roughness, and the frequency of poor surface morphology. This is consistent with the simulation results.
In summary, the roughness Ra can more accurately reflect the quality of grinding, while for Ry can only make a qualitative analysis of the quality of grinding. The prediction accuracy of the prediction model established in this paper is 93.32%~98.49% for the surface roughness value Ra; the prediction accuracy is 92.9%~98.17% for the surface roughness value Ry. 3D shape simulation can accurately reflect the main features of the real 3D shape, which can provide guidance for the experiment. The analysis shows that the prediction model established in this paper has high prediction accuracy for roughness evaluation indexes, which verifies the accuracy of its simulation. For the 3D morphology, the simulation can reflect the main features of the real 3D morphology. And the simulated surface is the ideal excellent surface under the corresponding grinding parameters. For processing defects with strong randomness, such as impact pits caused by environmental factors and pores with their own defects cannot be generated.
|
Fig. 8 Main experimental equipment and instruments. |
|
Fig. 9 Comparison of simulation contour and test contour under different particle size. |
|
Fig. 10 Comparison between the actual and predicted values of the roughness index under the condition of particle size change. |
|
Fig. 11 Comparison of the actual value and the predicted value of the roughness index under the condition of changing Dm. |
|
Fig. 12 Comparison between the actual value and the predicted value of the roughness index under the condition of the changing ng. |
|
Fig. 13 Three-dimensional topography of ceramic ball surface under different particle size conditions. |
|
Fig. 14 Three-dimensional topography of ceramic ball surface under different concentrations of lapping fluid. |
|
Fig. 15 Three-dimensional topography of ceramic ball surface at different grinding disc speeds. |
(1) The surface roughness prediction model of silicon nitride ceramic ball established by this paper for the conical disk grinding method has a prediction accuracy of 93.32%~98.49% for the surface roughness value Ra and 92.9%~98.17% for the surface roughness value Ry. The roughness Ra can reflect the grinding quality more accurately, while for Ry only a qualitative analysis of the grinding quality can be made.
(2) The simulation results of the prediction model and the experimental analysis show that: for the surface morphology of the ball, with the increase of the abrasive grain size and the decrease of the concentration of the abrasive solution, the surface roughness of the processed silicon nitride ceramic ball increases accordingly, and the number of scratches produced by abrasive grains on the surface of ceramic ball after scrubbing and rolling and the peak/valley difference between them increase accordingly, and the surface defects such as bumps, craters, and directional scratches per unit area of abrasive surface increase in proportion to the surface quality. Surface defects such as bumps, pits and scratches with strong directionality per unit area of the grinding surface layer increase in proportion, and the surface quality decreases significantly. Speed has little effect on surface quality. 3D topography simulation can accurately restore the surface morphology of silicon nitride ceramics after processing
(3) The principle of this paper is relatively simple and reliable. It can be transplanted to the computer of related industries in the actual industrial environment. It provides guidance for the prediction of surface quality of silicon nitride ceramic ball grinding and the formulation of process methods in the processing process. For the selection of process parameters, when the grinding pressure conditions are certain, in order to ensure that the ball has a good roughness and surface topography, smaller particle size, larger grinding liquid concentration, appropriate speed should be selected.
The authors acknowledge the collective support granted by the National Natural Science Foundation of China (Grant No 52105196), the Education Department of Liaoning Province (Grant No LJKMZ20220936), Young and Middle-aged Innovation Team of Shenyang (Grant No RC210343).
- 1. H. Ohta and S. Satake, J. Tribol. 124[3] (2002) 448-460.
-

- 2. R. Rejith, D. Kesavan, P. Chakravarthy, and S.V.S.N. Murty, Tribol. Int. 181 (2023) 108312.
-

- 3. H.Y. Tam, H.B. Cheng, and Y.W. Wang, J. Mater. Process. Technol. 192 (2007) 276-280.
-

- 4. J. Sun, Z. Zhang, Z.X. Xia, X. Fang, R.Y. Guan, G.X. Zhang, and J.M. Yao, J. Ceram. Process Res. 24[3] (2023) 541-553.
-

- 5. S.H. Ahn and K.W. Nam, J. Ceram. Process. Res. 22[1] (2021) 54-60.
-

- 6. L.T. Wei, Y.H. Yu, and J. Jiao, J. Ceram. Process. Res. 19[2] (2018) 126-129
-

- 7. Y. Lu, J.F. Yang, and J.Q. Gao, J. Ceram. Process. Res. 9[6] (2008) 657-660.
-

- 8. A. Kumar, S. Ghosh, and S. Aravindan, Ceram. Int. 45[14] (2019) 17447-17466.
-

- 9. H.T. Shi and X.T. Bai, Mech. Syst. Signal. Pr. 139 (2020) 106583.
-

- 10. M. Baraheni and S. Amini, Ceram. Int. 45[8] (2019) 10086-10096.
-

- 11. Z.W. Wang, B.H. Lv, J.L. Yuan, and F. Yang, Key Eng. Mater. 416 (2009) 558-562.
-

- 12. S. Ichikawa, H. Ona, I. Yoshimoto, and A. Kobayashi, CIRP Ann. 42[1] (1993) 421-424.
-

- 13. Z. Bo, T. Uematsu, and A. Nakajima, JSME Int. J. 41[3] (1998) 499-505.
-

- 14. J.L. Yuan, W.F. Yao, Q.F. Deng, and B.H. Lv, Appl. Mech. Mater. 37 (2010) 1125-1129.
-

- 15. Y.H. Wu, S.H. Li, and K. Zhang, Key Eng. Mater. 291 (2005) 325-330.
-

- 16. Y.H. Wu, K. Zhang, and H. Sun, Key Eng. Mater. 202 (2001) 185-188.
-

- 17. Z.Q. Ge, S.H. Li, Y.H. Wu, Y. Sha, J. Sun, and J.X. Tian, J. Ceram. Process. Res. 23[5] (2022) 685-693.
-

- 18. Z.Z. Zhou, J.L. Yuan, B.H. Lv, and J.J. Zheng, Adv. Mater. Res. 53 (2008) 147-154.
-

- 19. Y.Y. Huang and X.J. Gu, Lubr. Eng. 15[5] (1990) 4-7.
- 20. Y.X. Hui, Y.C. Wang, and Y. Liu, Surf. Technol. 47[06] (2018) 246-251.
- 21. S.K. Fecske, K. Gkagkas, C. Gachot, and A. Vernes, Tribol. Lett. 68 (2020) 1-15.
-

- 22. K. Zhang, Y.H. Wu, H. Sun, and S.H. Li, Key Eng. Mater. 304 (2006) 364-368.
-

- 23. J. Sun, Y. Wu, P. Zhou, S. Li, L. Zhang, and K. Zhang, Adv. Mech. Eng. 9[6] (2017) 1687814017705596.
-

- 24. H.M. Stanley and T. Kato, J. Tribol. 119[3] (1997) 481-485.
-

- 25. L.V. Shipulin, D.V. Ardashev, and A.A. Dyakonov, Surf. Topogr.: Metrol. Prop. 7[2] (2019) 025007.
-

- 26. Y. Chen, C. Jiang, X. Chen, G. Huang, and Z. Hu, J. Manuf. Process. 107 (2023) 134-143.
-

- 27. W. Wang, Q. Zhang, C. Chu, Z. Zhang, and J.H. Xu, Int. J. Adv. Manuf. Tech. 118[1] (2022) 303-317.
-

- 28. W.H. Zhou, J.Y. Tang, H.F. Chen, C.C. Zhu, and W. Shao, Int. J. Mech. Sci. 144 (2018) 639-653.
-

- 29. S.V. Sokhan', V.V. Voznyy, A.S. Redkin, V.H. Sorochenko, E.M. Zubaniev, and M.P. Hamaniuk, J. Superhard. Mater. 42 (2020) 432-442.
-

- 30. N. Umehara and S. Kalpakjian, CIRP Ann. 43[1] (1994) 185-188.
-

 This Article
-
2024; 25(3): 425-438
Published on Jun 30, 2024
- 10.36410/jcpr.2024.25.3.425
- Received on Apr 2, 2024
- Revised on Apr 19, 2024
- Accepted on Apr 23, 2024
 Services
- Abstract
introduction
establishment of prediction model of sphere surface roughness
simulation and analysis of prediction model of surface roughness and three-dimensional topography of sphere
roughness test verification
conclusion
- Acknowledgements
- References
- Full Text PDF
Shared
 Correspondence to
- Jinmei Yao
-
School of Mechanical Engineering, Shenyang Jianzhu University, Shenyang 110168, China
Tel : +86-188 0982 2007 Fax: 024-24694985 E-mail: jinmeiyao123@163.com - E-mail: jinmeiyao123@163.com


 Copyright 2019 International Orgranization for Ceramic Processing. All rights reserved.