


- Composition design and crack resistance optimization method of red mud based foamed lightweight soil
Ning Zhangb,c, Xingzhang Guoa,c, Yuyan Lia,c, Jian Zhanga,c,* and Tingting Yua,c
aGeotechnical and Structural Engineering Research Center, Shandong University, Jinan, Shandong, 250061, PR China
bShandong Hi-speed Group, Co., Ltd, Jinan, Shandong, 250098, PR China
cSolid Waste Recycling Technology Innovation Center of Shandong Province, Jinan, Shandong, 250098, PR ChinaThis article is an open access article distributed under the terms of the Creative Commons Attribution Non-Commercial License (http://creativecommons.org/licenses/by-nc/4.0) which permits unrestricted non-commercial use, distribution, and reproduction in any medium, provided the original work is properly cited.
Utilizing industrial solid waste as a cementitious material for the production of foamed lightweight soil demonstrates significant potential applications in the field of road engineering. In this paper, red mud based foamed lightweight soil was developed. And the crack resistance of red mud based foamed lightweight soil was evaluated. The findings indicate that the optimum composition for the red mud based cementitious material comprises 60 wt% red mud, 40 wt% slag, and 6 wt% NaOH. The compressive strength could reach 6.02 MPa and the initial setting time was 104 min at 28 d of curing. A composite foaming agent was formulated by selecting a combination of compound alkylamidopropyl betaine and xanthan gum. With a foam agent addition of 5 wt%, the compressive strength of red mud based foamed lightweight soil reached 1.05 MPa at 28 d of curing, the fluidity reached 212 mm. Fiber can effectively inhibit the cracking of red mud based foamed lightweight soil, and 1.5 wt% glass fiber was determined to be the optimal dosage. The results can provide a certain basis for the application of red mud based foamed lightweight soil.
Keywords: Red mud, Foamed lightweight soil, Foaming property, Crack resistance.
The transportation industry of China has entered a period of rapid development, with highway mileage showing a steady growth trend. While the road facilities improve, the frequency of subgrade defects is also increasing. Traditional subgrade fillings are uneven and the degree of compaction is insufficient, which leads to subgrade settlement and cross-section instability deformation. The uneven settlement of the new and old subgrade joints in the subgrade widening area, the bridgehead bumping in the transition section of the rigid and flexible, and other problems have occurred.
Currently, there are numerous methods available for addressing subgrade defects [1, 2]. Foamed lightweight subgrade boasts advantages such as low weight, exceptional strength, excellent fluidity, heightened construction efficiency, and the ability to adjust both density and strength [3-5]. Therefore, foamed lightweight subgrade is considered an effective method to solve subgrade diseases. The foamed lightweight subgrade is a gas-solid porous lightweight material created by incorporating foam into a slurry composed of cement, admixture, additives, aggregate, and water. The mixture is then blended, poured, and subjected to the curing process. Hence, foamed lightweight soil can efficiently alleviate the additional stress on the subgrade, providing a lasting solution to the issue of uneven settlement. Foamed lightweight soil has found extensive applications in the transportation sector, effectively addressing subgrade issues and prolonging the service life of highways [6-8]. The cementitious material of traditional foamed lightweight subgrade is Portland cement. Nevertheless, the raw materials utilized in cement production are non-renewable, and the manufacturing process results in substantial energy consumption and significant carbon emissions, posing challenges to sustainable development [9]. In recent years, scholars have conducted extensive research on the use of solid waste to prepare cementitious materials to prepare foam lightweight roadbed [10-16].
At present, alkali-activated solid waste based cementitious materials have been widely used in the production of foamed lightweight soil. Matalkah et al. [17] found that as the curing temperature increased from 40 °C to 60 °C, the compressive strength of kaolin based foamed lightweight soil increased by 50%. Zhang et al. [18] used 30 wt% slag instead of Class F fly ash to prepare geopolymer foamed lightweight soil. The 28-day compressive strength of specimens can be adjusted within 3~48 MPa by changing the foam content. Yang et al. [19] prepared bentonite based foamed lightweight soil. The results show that bentonite reduces strength shrinkage during curing. Yan et al. [20] mixed gangue powder and foam and prepare gangue based foamed lightweight soil. Liu et al. [21] prepared metakaolin based foamed lightweight soil. The results show that the foamed light soil has the highest adsorption efficiency of Pb, Cd and Ni when pH=7.
Red mud (RM) is a solid waste generated by the aluminum industry, with an annual discharge of approximately 150 million tons in China. The current disposal method primarily involves stockpiling, leading to extensive land occupation, air, soil, and groundwater pollution [22]. Currently, the utilization rate of RM is still low. RM is an alkaline silicate material with potential hydration activity, and silicon-aluminum oxides exist in various forms such as sodalite, calcite, quartz, etc. Hence, numerous scholars have explored the feasibility of producing cementitious materials from RM. Nevin Koshy et al. [23] used RM, coal gangue and fly ash as raw materials to prepare composite geopolymer cementitious materials. Gao et al. [24] prepared a new geopolymer grouting material using RM, ground granulated blast furnace slag and calcium bentonite. The results indicate that the inclusion of calcium bentonite decreases the sample porosity while enhancing compressive strength and erosion resistance.
Therefore, to facilitate the application of RM based foamed lightweight soil (RMFLS) in the highway engineering, this paper conducted the following research: (1) Investigate the influence of various activators on the setting time and compressive strength of RMCM, and ascertain the optimal RM content. (2) Determine the optimal ratio for a compound alkali-resistant foam agent. Explore the impact of foam dosage on the compressive strength of RMFLS, identify the optimal foam dosage, and achieve the preparation of RMFLS. (3) Evaluate the enhancement impact of fiber on crack resistance of RMFLS. This study can serve as a reference for the engineering application of RMFLS.
Raw Materials
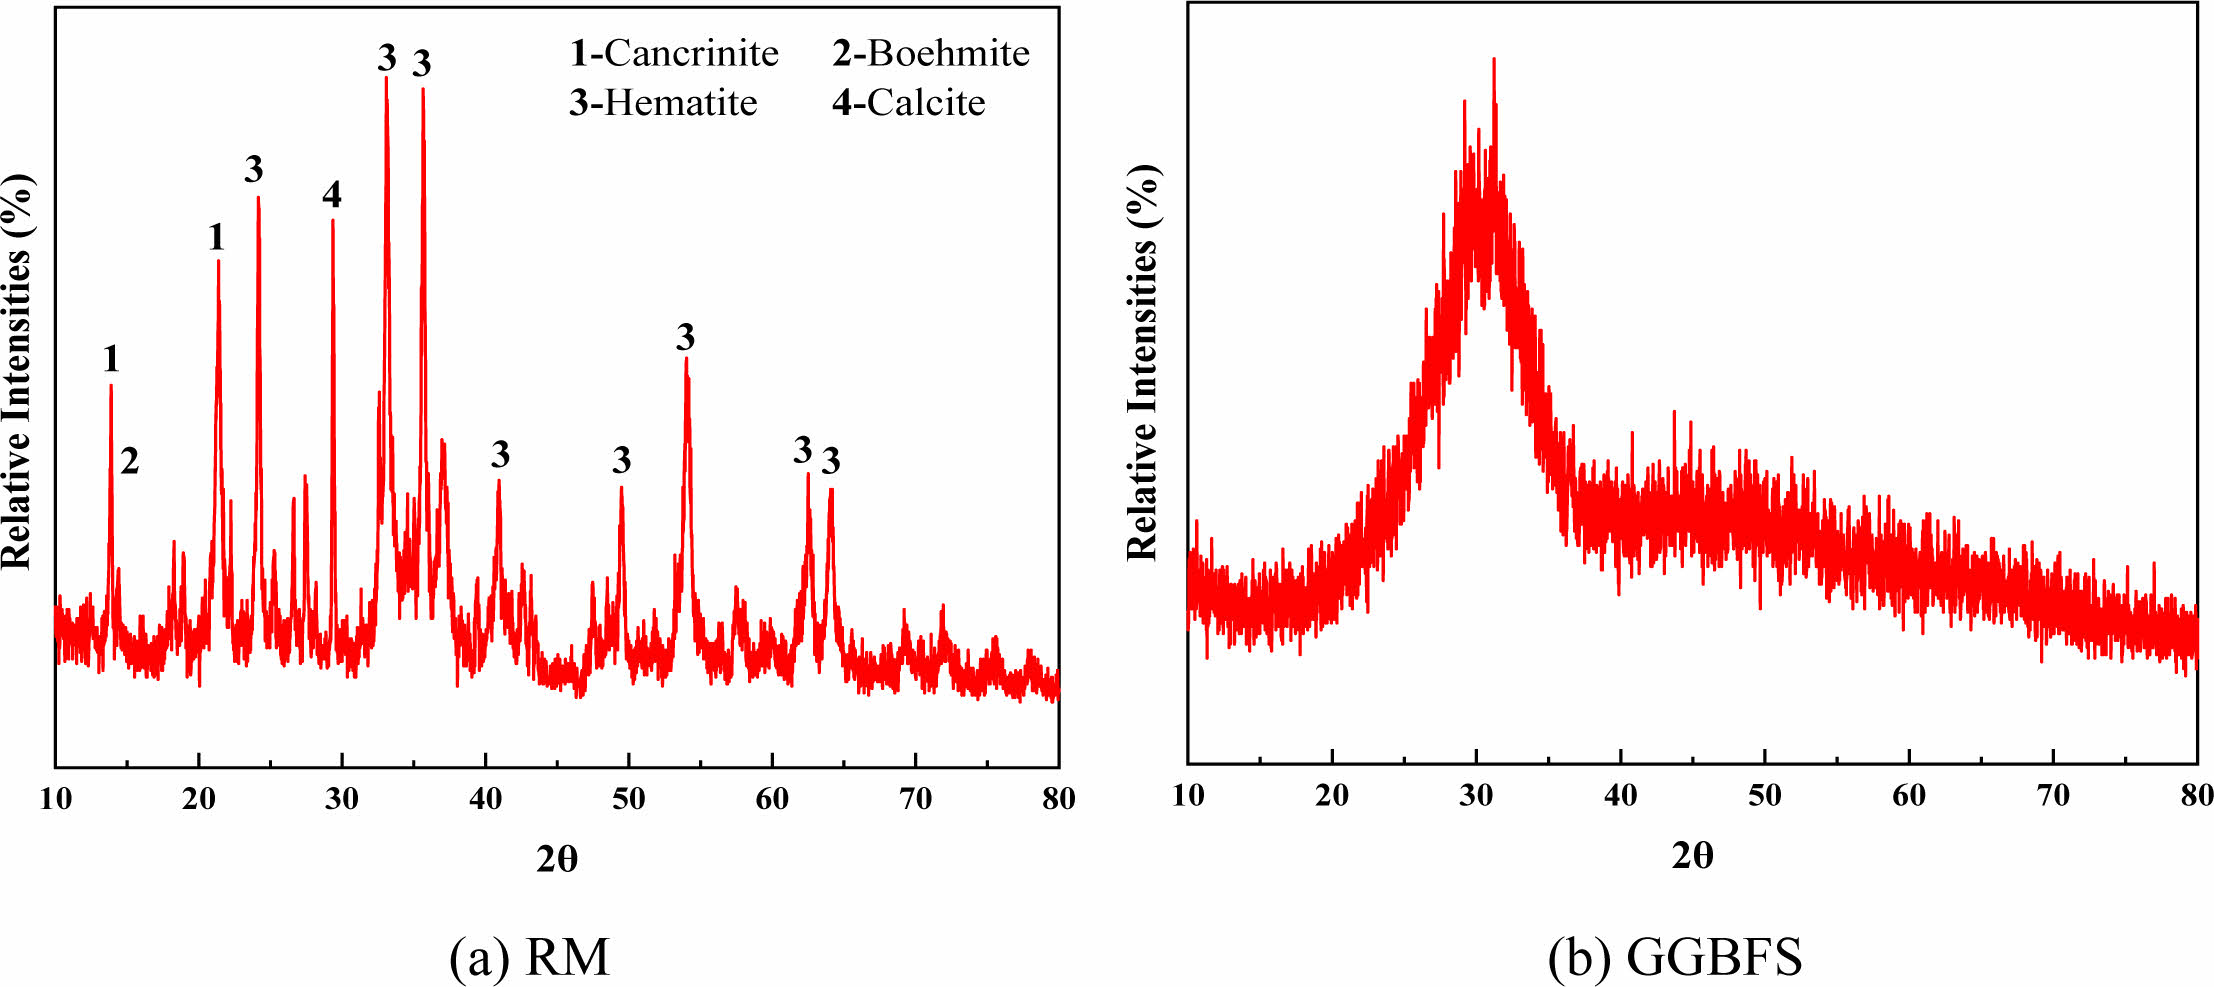
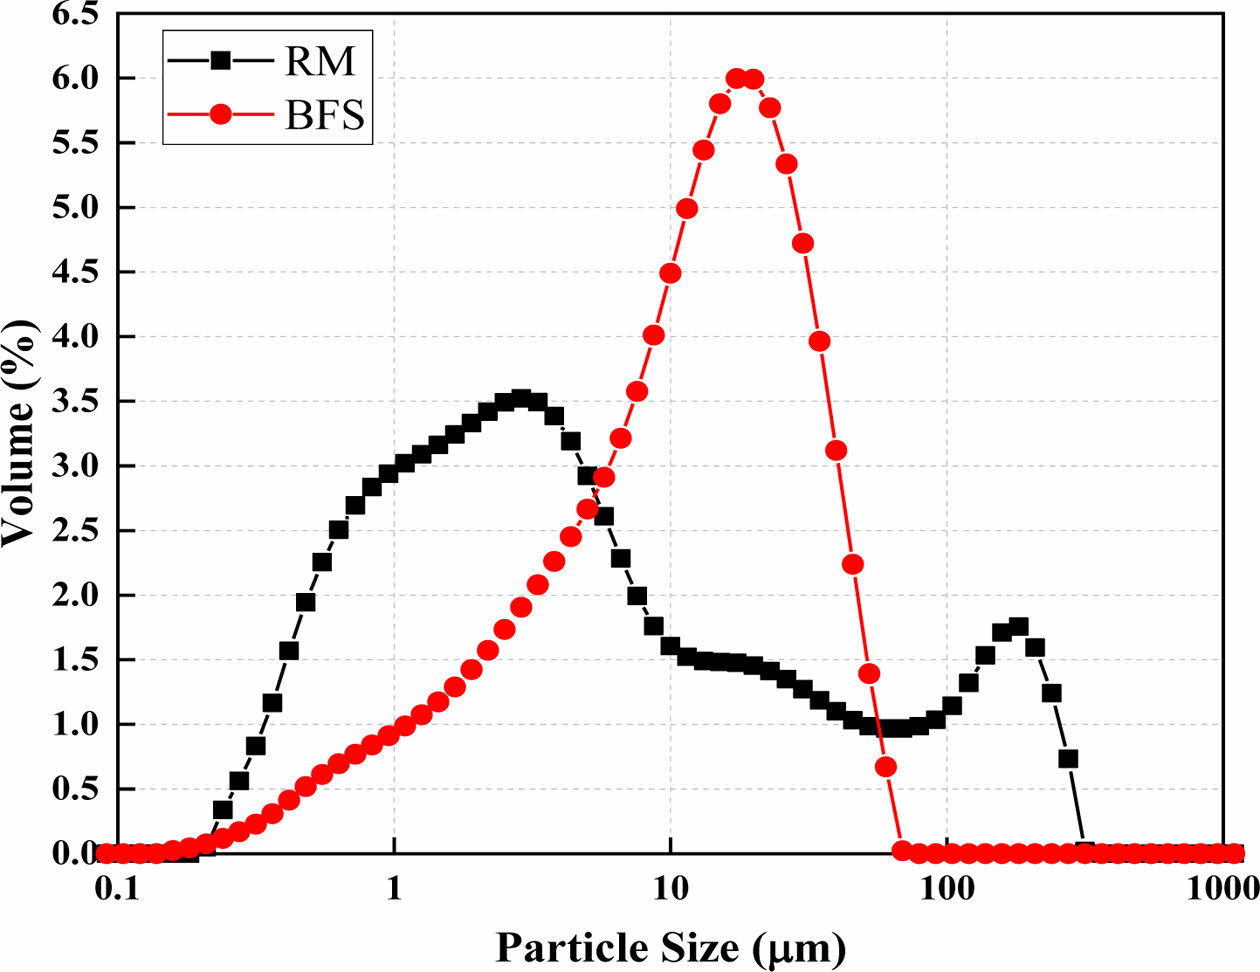
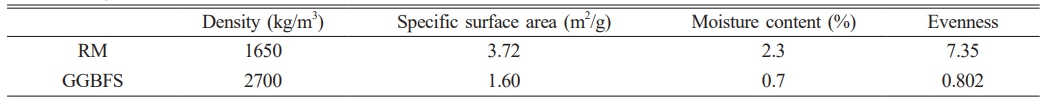
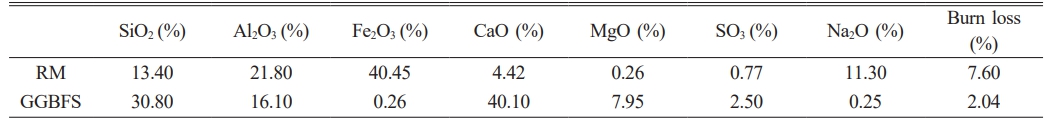
In this paper, RM was collected from Shandong Weiqiao Pioneering Group., Ltd. S95 ground granulated blast furnace slag (GGBFS) was purchased from Shandong Lubi Building Materials Group., Ltd. The chemical composition was determined by SRS3400 X-ray Fluorescence analyzer from Bruker, Germany. The mineral composition was determined by an EMPYREAN type X-ray Diffraction instrument by PANalytical of the Netherlands, which scans over a range of 5 to 90° and at a scanning speed of 5°/min. The particle size distribution was determined by the Mastersizer 2000 laser particle size analyzer of Malvern, UK. The physical properties and chemical composition are shown in Table 1 and 2, respectively. The mineral composition and particle size distribution are shown in Fig. 1 and 2, respectively. Three activators, NaOH (NH), sodium silicate solution (NSS) and sodium silicate powder (NSP), were used in this study. All chemical reagents are of analytical grade. The NSS has a solid content of 34% and an initial modulus of 3.3 M. The NSP exists as a white powder with a modulus of 1.4 M.
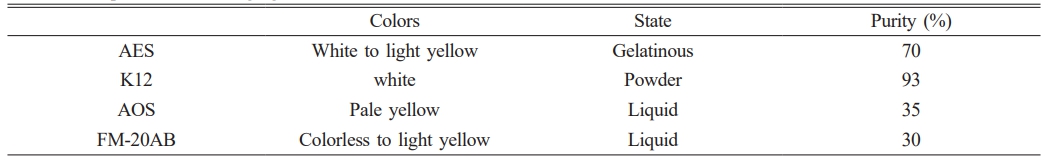
Four foam agents, sodium alcohol ether sulphate (AES), sodium dodecyl sulfate (K12), sodium alpha-olefin sulfonate (AOS) and compound alkylamidopropyl betaine (FM-20AB), were selected in this study. The properties of foams are shown in Table 3.
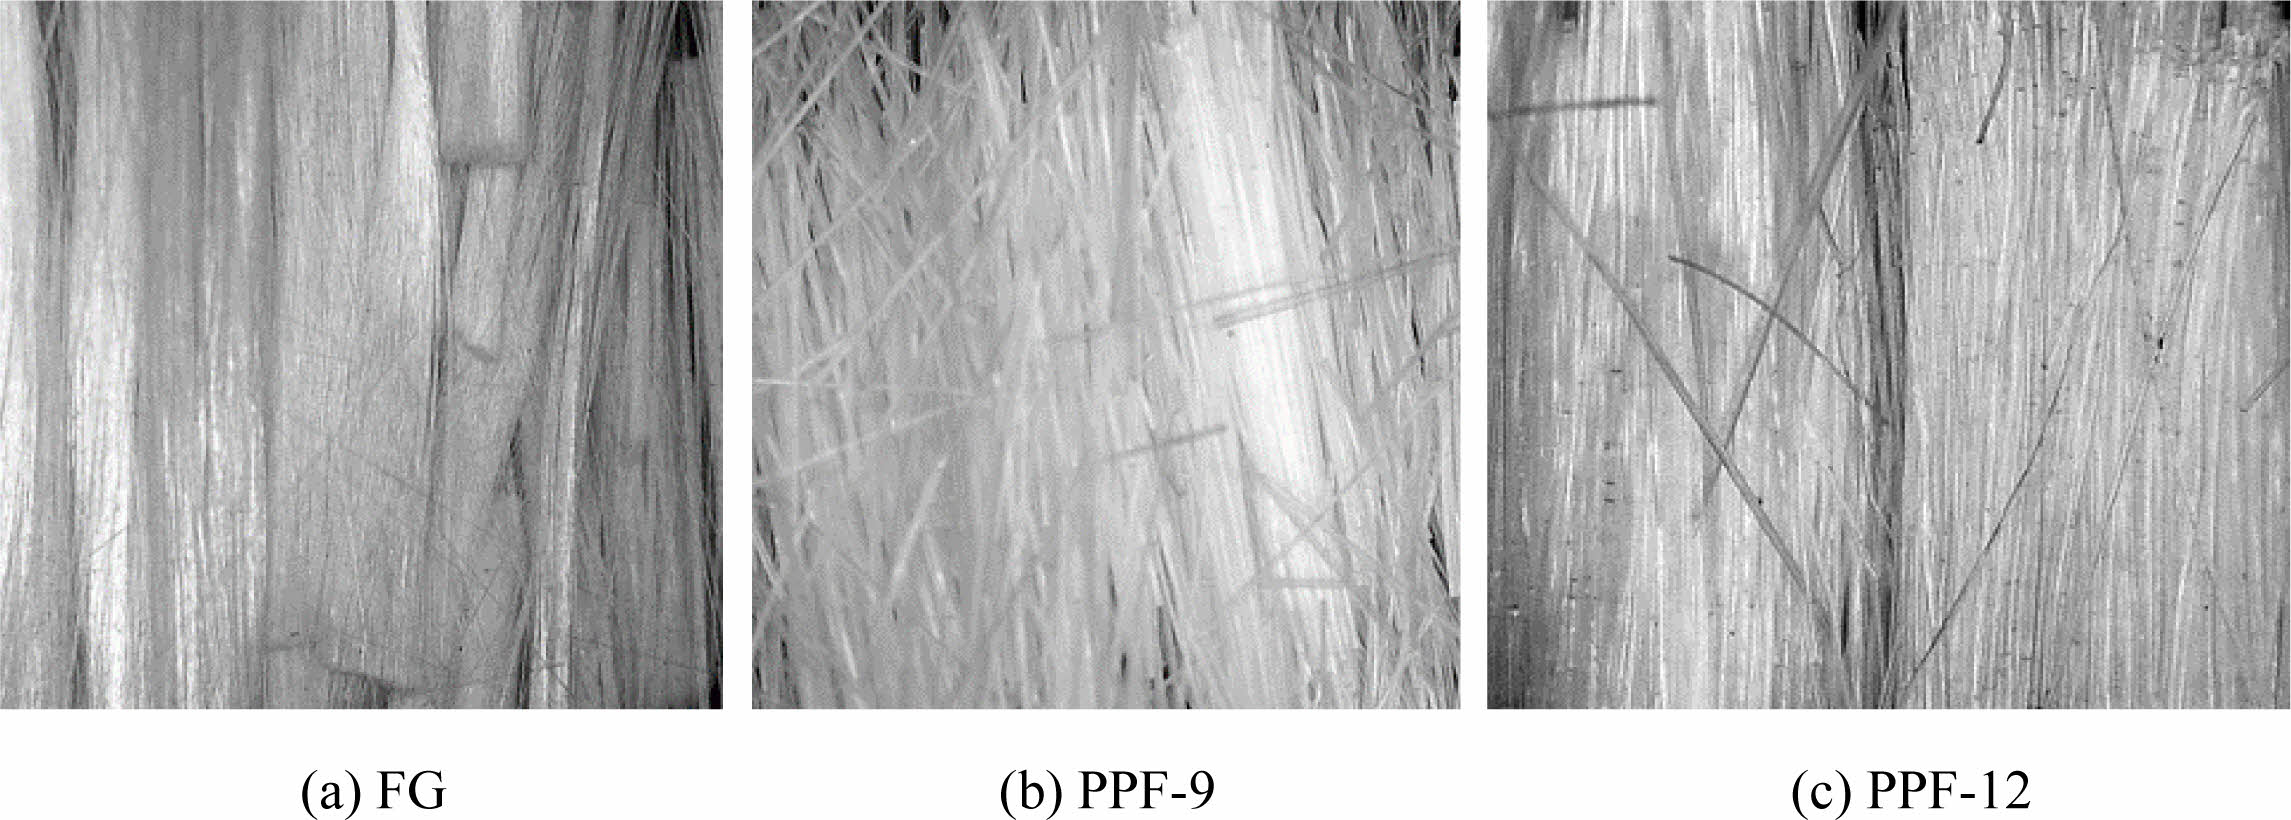
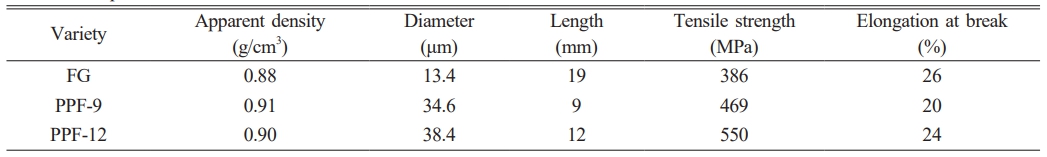
In this study, fiber was utilized to inhibit the shrinkage and cracking of RMFLS. Glass fiber (FG) and polypropylene fiber (PPF) are selected for research. The performance indexes are shown in Table 4, and the images are shown in Fig. 3.
Experimental program
In this study, the optimal ratio of RMCM was determined by studying the effects of RM content (40 wt%~80 wt%), activator type (NH, NSS, NSP), and activator dosage (4 wt%~8 wt%) on the setting time and compressive strength of red mud based cementitious materials. The specimens were thoroughly mixed and poured into molds with dimensions of 40 mm × 40 mm × 40 mm. After 24 hours, the specimens were demolded and transferred to a standard curing room. All specimens were cured for 28 d at a water-binder ratio (W/B) of 0.6. The optimum ratio of RMCM, the type of activator and the dosage were determined comprehensively by compressive strength and setting time.
The preparation process of RMFLS is as follows: RM, GGBFS, and activator were weighed, dry-mixed in the mixer for 30s, and then wet-mixed with water for 90s to prepare a slurry of RMCM for subsequent use. A foaming liquid was prepared using foam agent and water, which was then passed through a foaming machine to generate foam. The foam was subsequently transferred to a horizontal mixer and stirred with the RMCM for 120s to obtain a homogeneous mixture. The mixture was poured into a 100 mm × 100 mm × 100 mm mold and allowed to stand for 48 hours. Subsequently, the specimens were demolded and transferred to a standard curing room for maturation to the designated age.
Analytical methods
Mechanical properties such as compressive strength and flexural strength were tested by WDW-300M universal testing machine. The test of setting time for RMCM was according to GB/T 1346-2011. The determination of foam sedimentation distance and water secretion volume was according to CJJ/T 177-2012. The rheological properties of RMCM were tested by Thermo Fisher's Mars 60 rheometer. The wet volume weight, fluidity and compressive strength of the RMFLS were tested according to CJJ/T 177-2012.
|
Fig. 1 Mineral composition of RM and GGBFS. |
|
Fig. 2 Particle size distributions of RM and GGBFS. |
|
Fig. 3 The micrographs of fibers |
Composition design of RMCM
Setting time
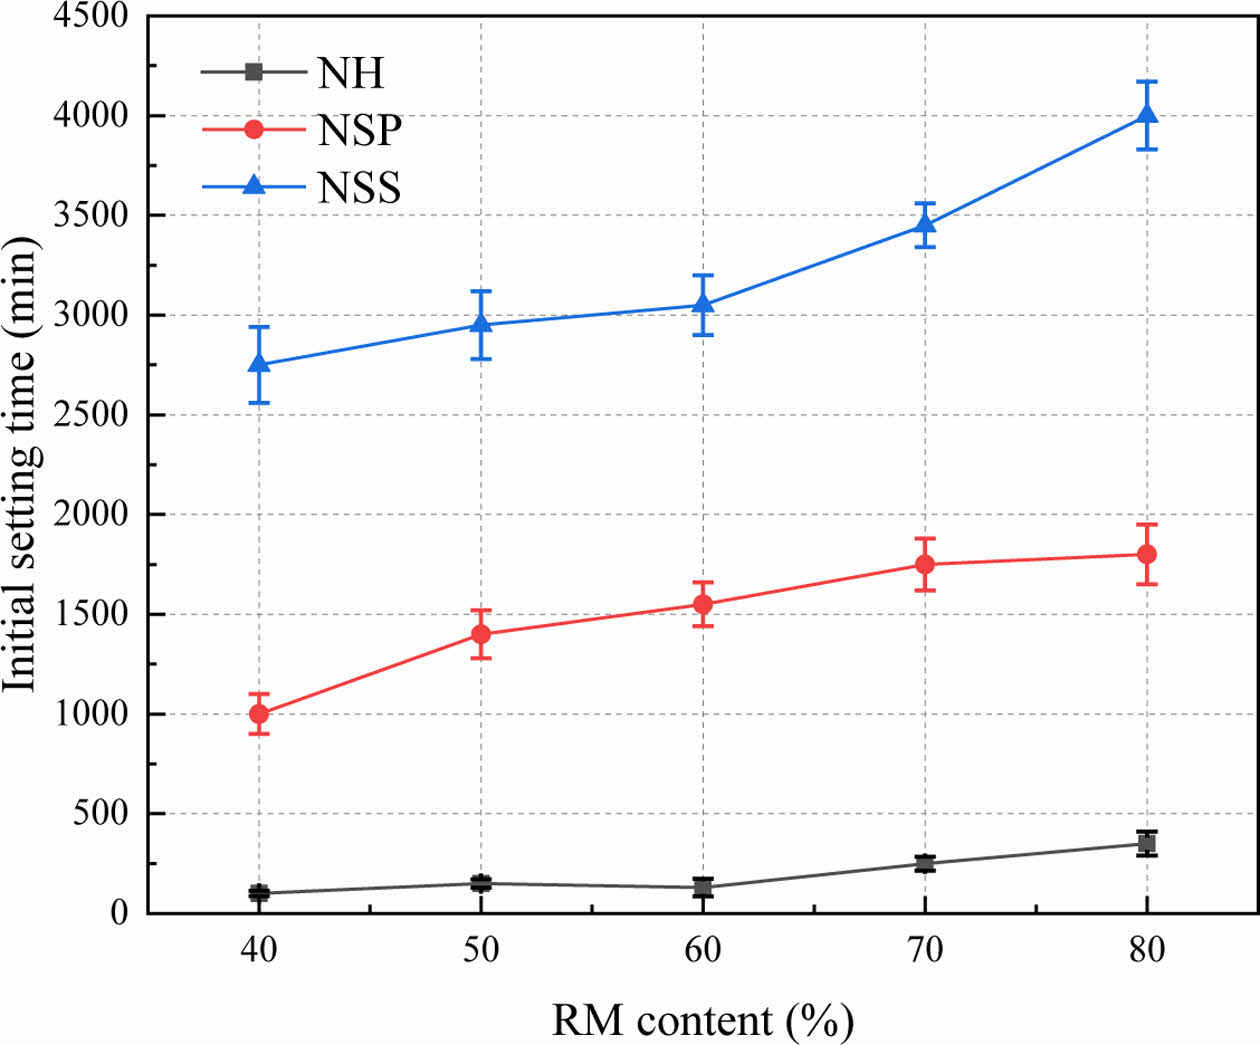
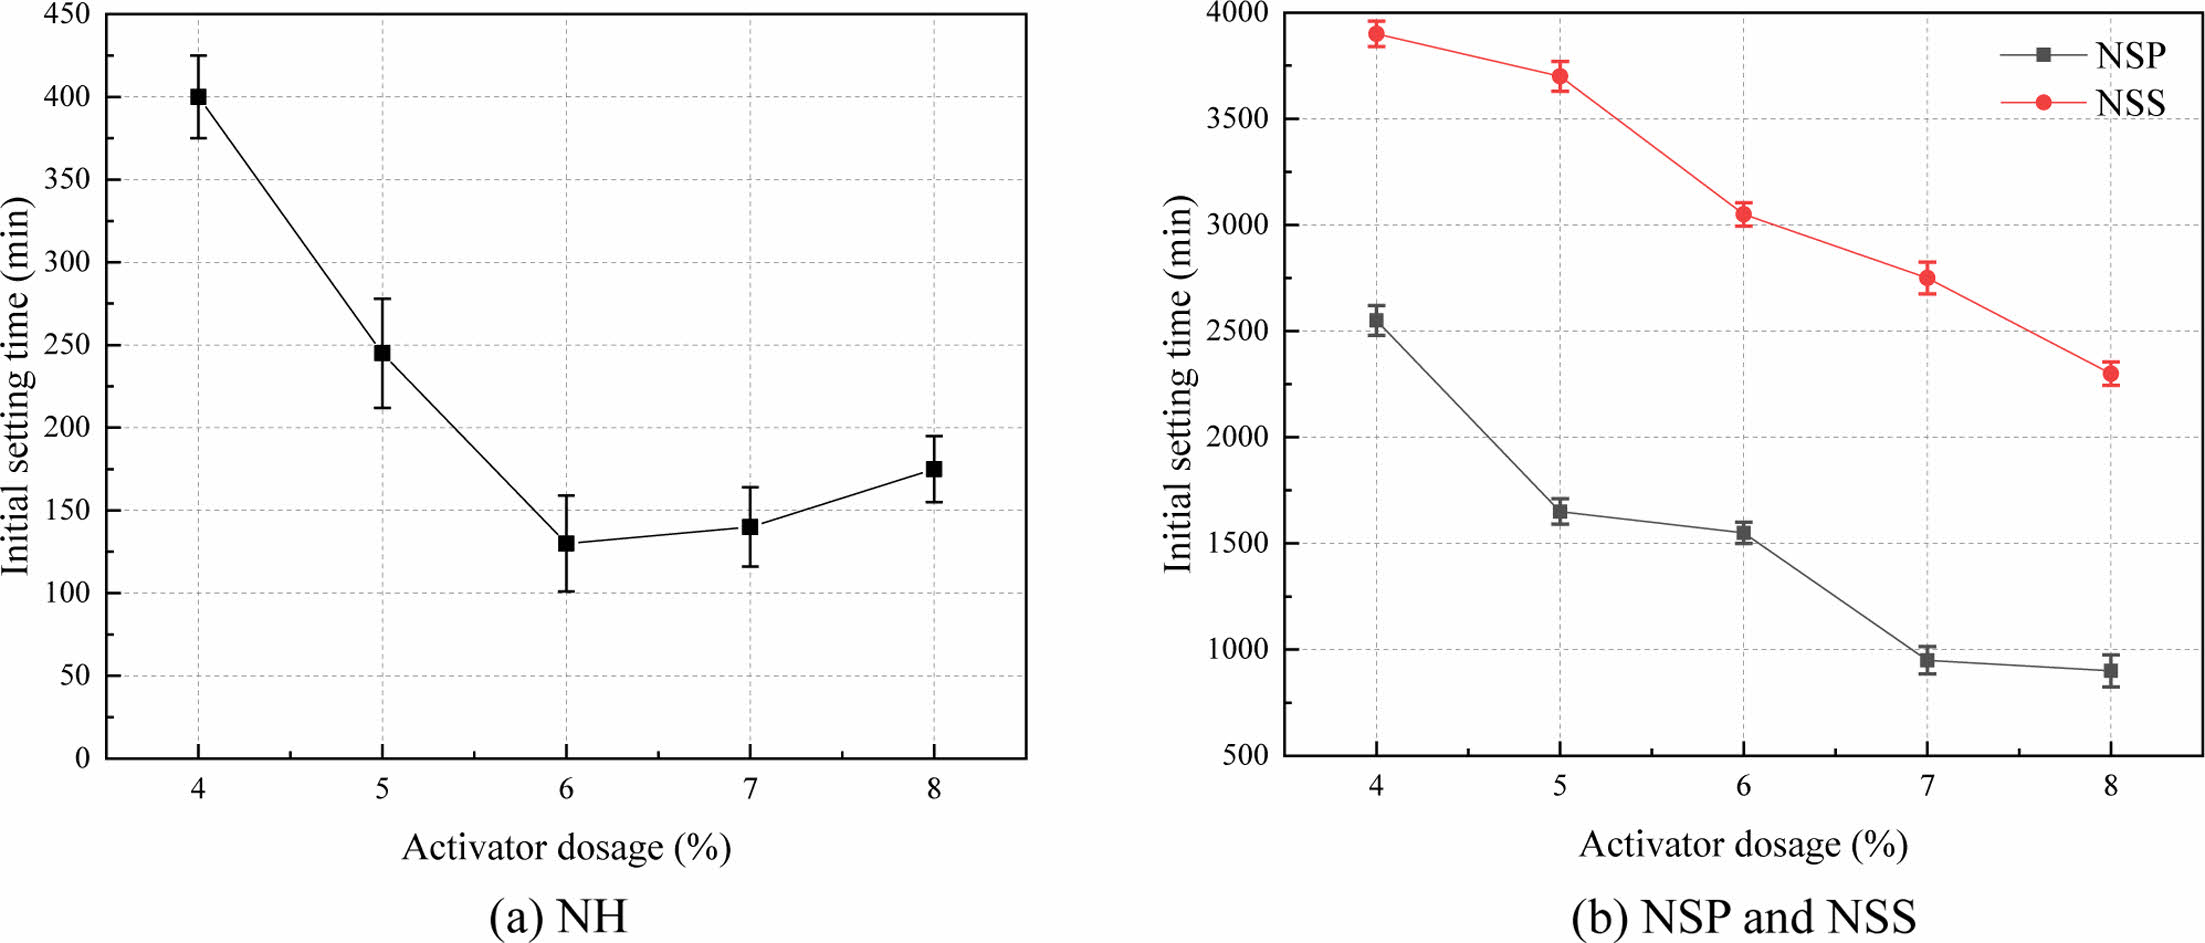
Fig. 4 illustrates the variation in setting time of RMCM for varying RM content. The initial setting time gradually increased as the RM content increased. When NSS was used as the activator, the initial setting time increased from 2771 min to 4004 min with the rising RM content. This is due to the insufficient content of active ingredients in RM, leading to a slow hydration rate. The specimens activated by NH exhibited the shortest initial setting time. At an equivalent dosage, the initial setting time of RMCM activated by NH ranged from 109 minutes to 351 minutes, significantly lower than that activated by NSS and NSP. This is attributed to the highly alkaline of NH, which expedites the geopolymerization reaction, consequently markedly reducing the initial setting time of the specimens.
Fig. 5 illustrates the effect of activator content on the initial setting time of RMCM. The initial setting time of RMCM initially decreased and then rised with the increasing NH dosage, reaching the shortest setting time of 128 min at 6 wt% NH dosage (Fig. 5a). This is because the increasing NH dosage promotes the release of Ca2+ in GGBFS and accelerates the geopolymerization reaction. Nevertheless, excessive activator dosage may impede polycondensation and diminish the reaction rate. With the increase in NSS and NSP dosage, the initial setting time gradually shortens (Fig. 5b). When the dosage of NSS and NSP increased from 4 wt% to 8 wt%, the setting time of RMCM decreased from 3866 min and 2546 min to 2270 min and 929 min, respectively. This is because with the increase in the dosage of NSS and NSP, the concentration of [SiO4]4- rises, thereby amplifying the activator effect, accelerating the reaction rate, and consequently reducing the coagulation time.
Compressive strength
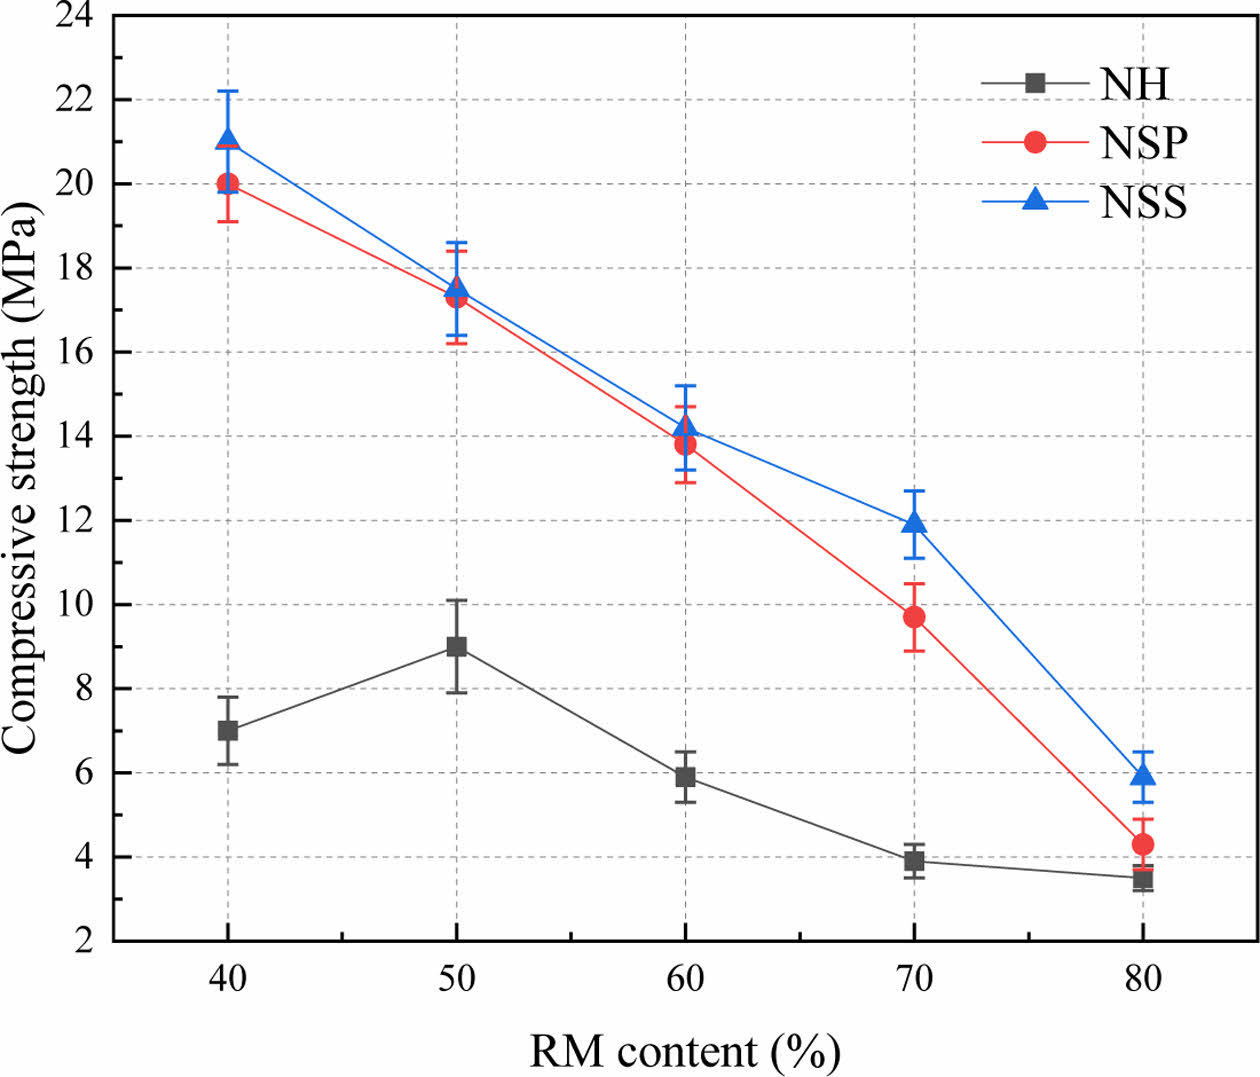
Fig. 6 illustrates the impact of RM content on the compressive strength of RMCM at 28 d of curing. When NH served as the activator, the compressive strength of the RMCM initially rose and then declined with increasing RM content. At a 50 wt% RM content, the maximum compressive strength reached 9.04 MPa. The alkalinity of RM promotes geopolymerization, leading to a denser micro structure. Moreover, RM possesses a small particle size and exhibits a micro-aggregate effect. Consequently, RM can fill pores, enhance the density of specimens, and subsequently improve the compressive strength. When the RM content exceeded 50 wt%, the predominant component of low reactivity RM led to a reduction in compressive strength. When NSS and NSP served as the activator, as the RM content increased from 40 wt% to 80 wt%, the compressive strength of specimens decreased from 20.89 MPa and 19.94 MPa to 5.76 MPa and 4.58 MPa, respectively. The impact of three activators on the compressive strength of specimens follows the order of NSS, NSP, and NH, from highest to lowest. NH is used only as an alkaline activator to provide an alkaline environment for geopolymerization. NSS and NSP contribute to an alkaline environment and provide Si4+ for participation in geopolymerization, leading to the generation of hydration products and an improvement in compressive strength.
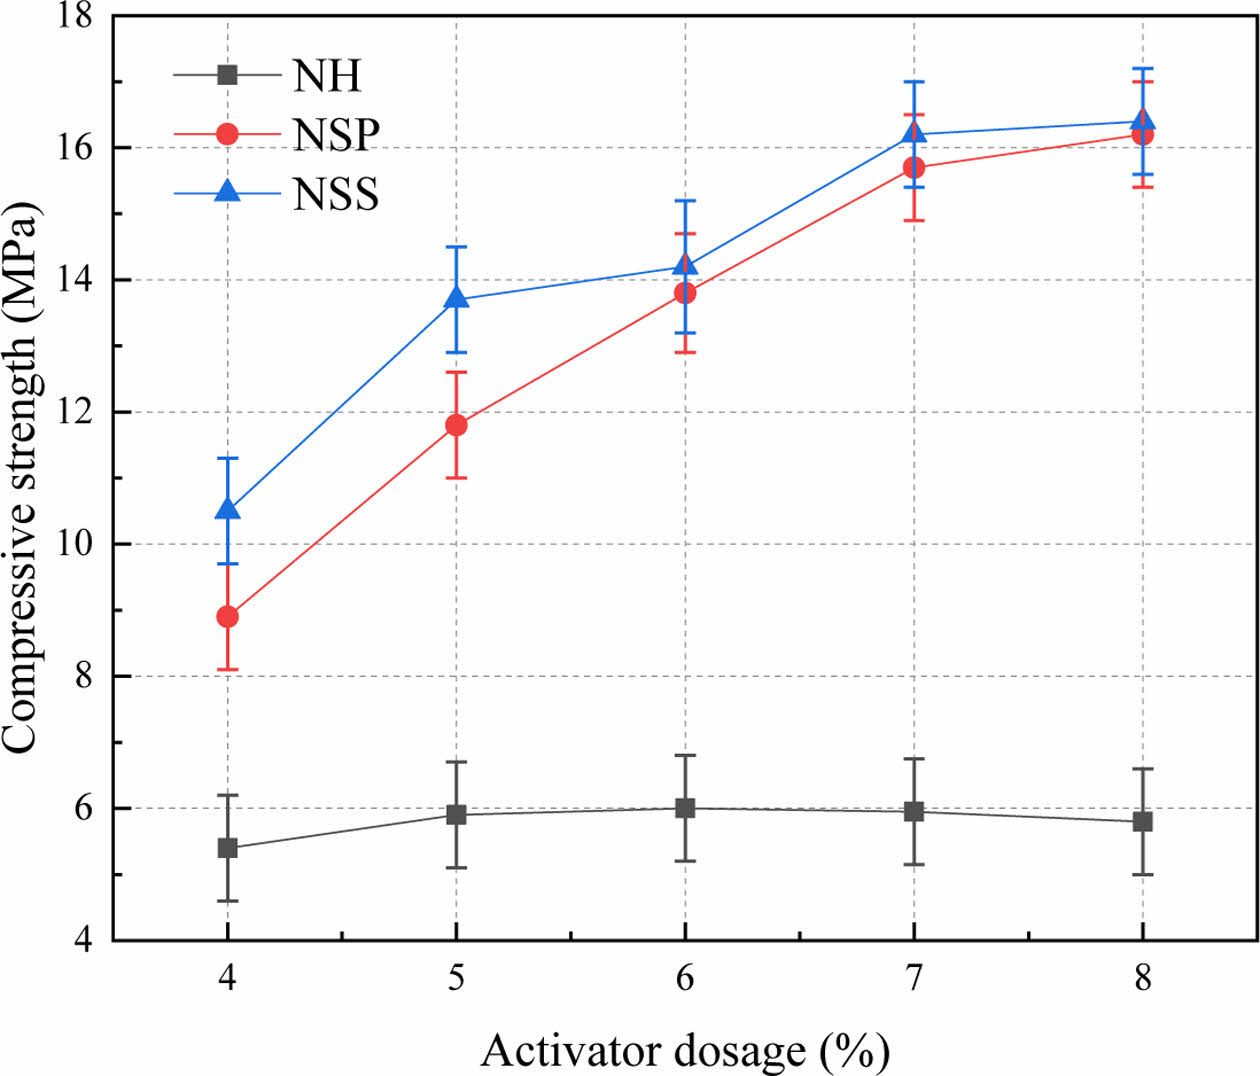
The effect of activator dosage on compressive strength of specimens at 28 d of curing is shown in Fig. 7. With an increase in NH dosage from 4 wt% to 6 wt%, the compressive strength reached the peak value of 6.02 MPa. However, as the NH dosage continues to rose to 8 wt%, the compressive strength subsequently decreased to 5.78 MPa. The compressive strength of specimens gradually increased as the NSS or NSP dosage increased. Furthermore, under equivalent dosages, NSS demonstrated a superior effect compared to NSP. As NSS dosage increased, the activation effect increased. This prompts GGBFS and RM to release more Al3+ and Si4+, initiating the geopolymerization reaction, and resulting in the formation of hydrated gel. Consequently, this process enhances the compressive strength of specimens.
In conclusion, when NH serves as the activator, the specimens exhibit the shortest initial setting time, and the optimal effect is attained at a 6 wt% dosage. To attain substantial RM content and superior compressive strength, the optimal ratio is established as follows: 60 wt% RM, 40 wt% GGBFS, and 6 wt% NH.
Foaming properties
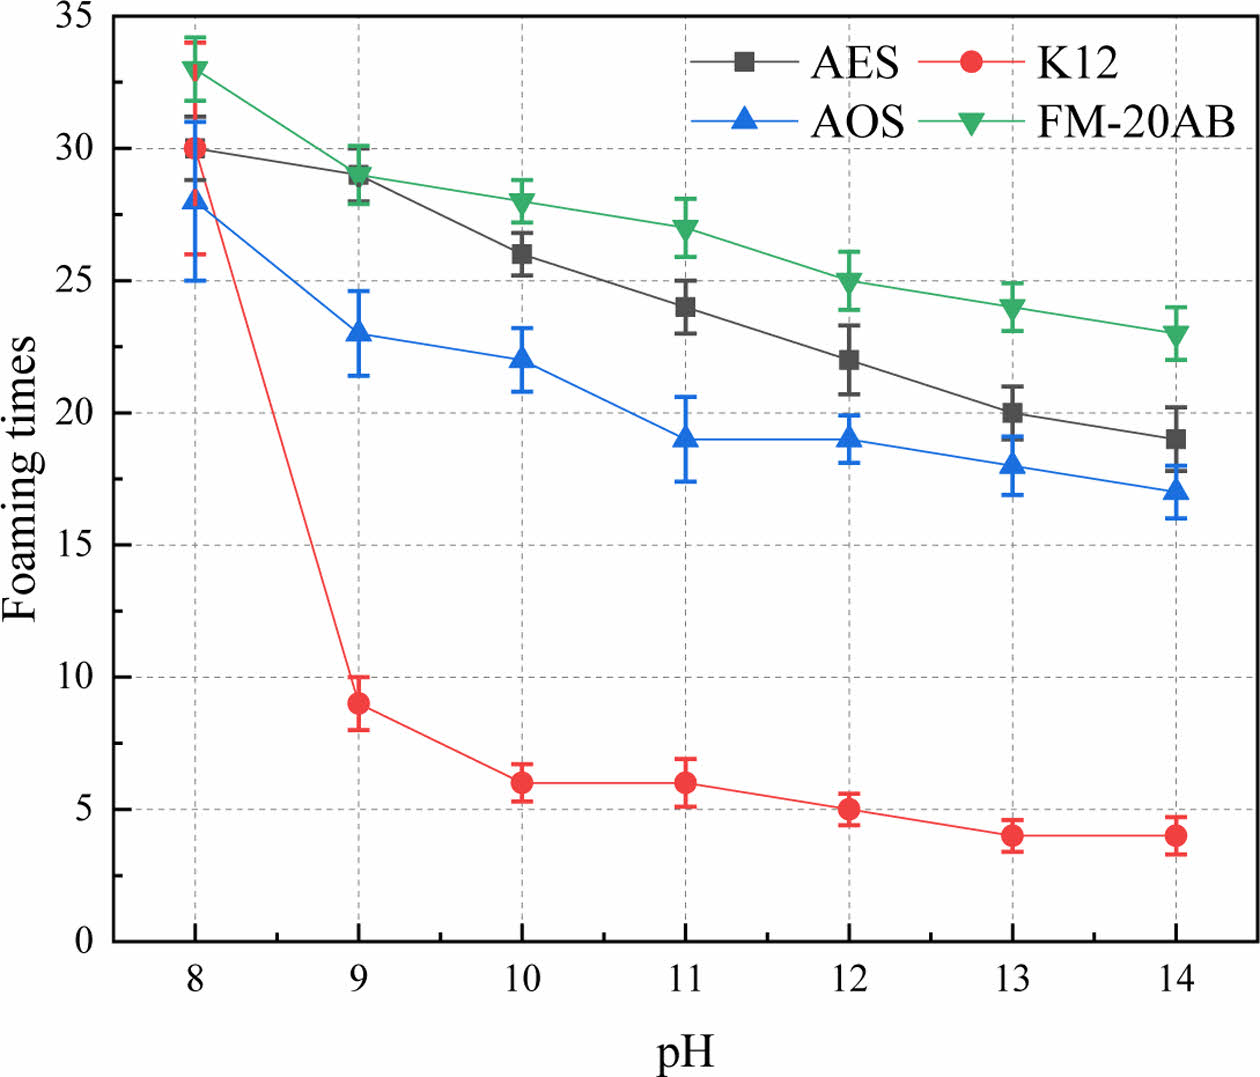
The RMCM exhibits strong alkalinity. Therefore, the impact of the alkaline environment on the foam agent was investigated by examining the variations in the properties of the foam agent at different pH. NH particles were introduced into distilled water to create an alkaline solution with a pH range of 8 to 14. Subsequently, the foaming properties of AES, K12, AOS, and FM-20AB were analyzed after the solution was diluted 60 times under different pH conditions. The foaming ratio variations with the pH of the solution are depicted in Fig. 8. As the pH increased, the foaming multiples of the four foam agents exhibit a decreasing trend. The foaming capacities of all foam agents exhibited a decline in alkaline solutions, with K12 displaying the most pronounced decrease. At a pH of 14, the foaming multiples were as follows: FM-20AB-23, AES-19, AOS-17, and K12-4. This phenomenon arised due to the alkaline solution causing a notable contraction or even disappearance of the oil-in-water (W/O) and water-in-oil (O/W) microemulsion regions in the phase diagram of the K12 solution. Consequently, there is a decrease in surface activity, leading to a decline in foaming performance. The adaptability of the four foam agents to alkaline solutions followed the order of FM-20AB, AES, AOS, and K12, ranging from strong to weak.
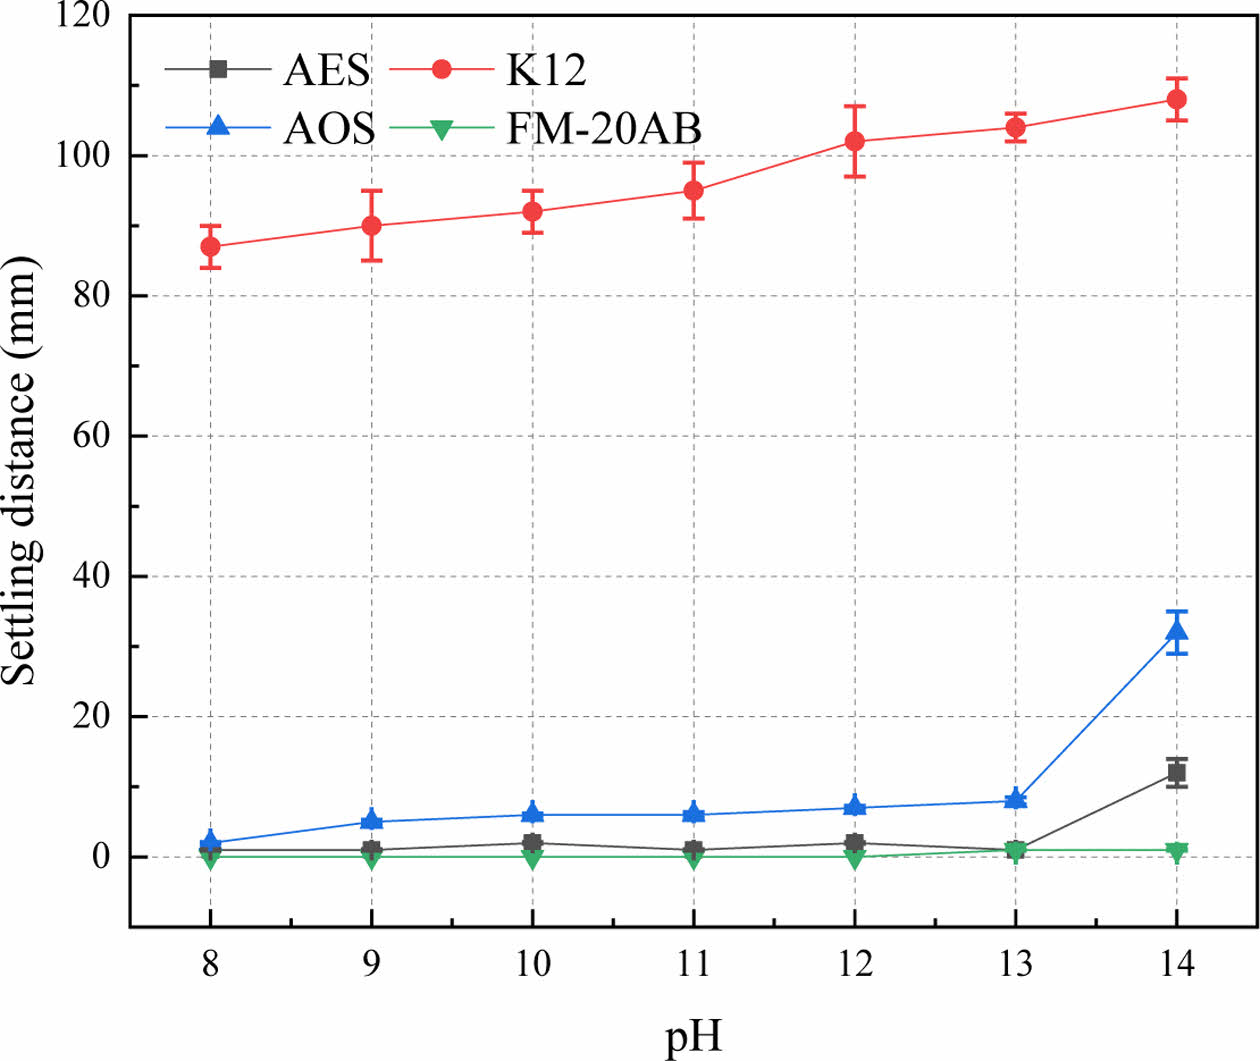
Stability is typically assessed through parameters such as settling distance and water secretion, which respectively indicate the extent of defoaming and liquid film water loss. The relationship between settling distance and pH is illustrated in Fig. 9. The settlement of K12 in an alkaline solution is notably pronounced. With the pH escalating from 8 to 14, the settling distance increased from 87 mm to 108 mm. When the pH was below 13, both AES and AOS exhibited slight increments in settling distances, reaching maximum settling distances of 2 mm and 8 mm, respectively. When the pH exceeded 13, the settling distance of AES increased from 2 mm to 12 mm, while AOS showed an increase from 8 mm to 32 mm. Nevertheless, the settling distances of FM-20AB in an alkaline solution was minimal, with no discernible settling observed in alkaline solutions within the pH range of 8 to 12. A slight settling distance of 1 mm was noted in a highly alkaline environment with pH ranging from 13 to 14. It could be inferred that the foam stability performance of the four foam agents in alkaline solution follows the order of FM-20AB, AES, AOS, and K12, ranging from the best to the worst.
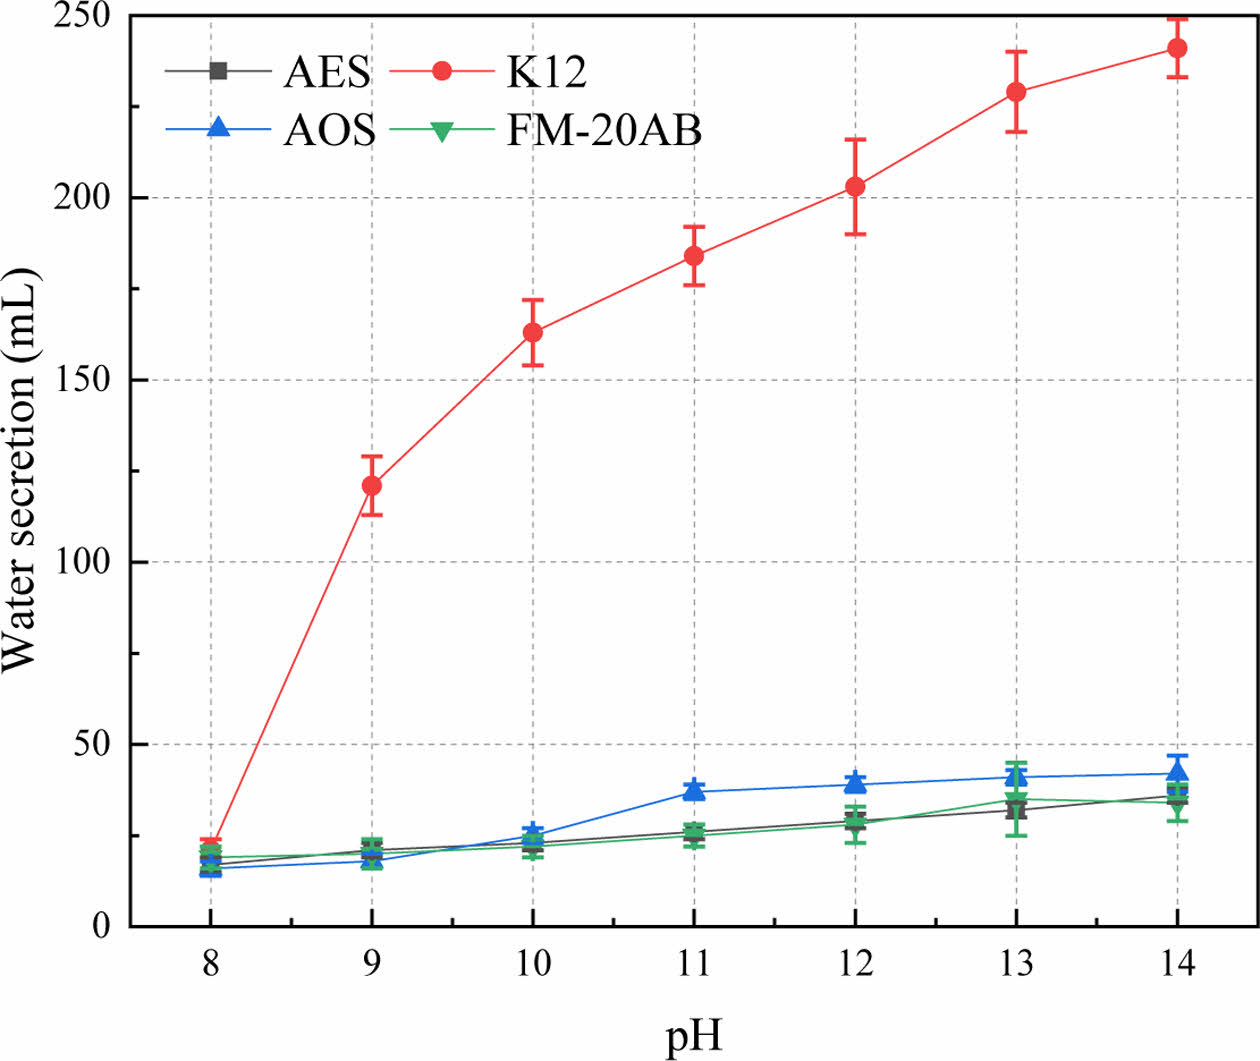
The relationship between water secretion and pH is depicted in Fig. 10. There is a positive correlation between water secretion and pH for all four foam agents. As the pH increased from 8 to 14, the water secretion of FM-20AB rose from 19 mL to 34 mL. The water secretion in foam primarily comprised interbubble water and liquid film water. Initially, free water existing between the bubbles is discharged, followed by the drainage of liquid film water through gravity and surface tension mechanisms. These two drainage methods work together to make the liquid film thin and the bubble burst. AOS exhibits the poorest foaming capacity and the highest liquid-carrying capacity, leading to more liquid discharge. The structure of K12 is compromised in an alkaline environment, making it challenging to form a dense creamy foam. Despite this, it retains characteristics of a foam agent solution close to a fluid, contributing to the highest water secretion. Based on the quantity of water secreted, the foam stability performance of the four foam agents in alkaline solution can be ranked as follows: AES, FM-20AB, AOS, and K12, from best to worst.
FM-20AB demonstrated superior foaming and foam stabilization properties when diluted 60 times in an alkaline solution with a pH range of 8 to 14. It achieved a peak foaming ratio of 24, the minimal settling distance after 1 h was 1 mm, and the water secretion over 1 hour amounted to 35 mL. Xanthan gum (XG) was selected as foam stabilizing agent. The foam agent system FM-20AB:XG (FMX) = 1:0.2 was selected to carry out following studies.
Influence of foam dosage on the properties of RMFLS
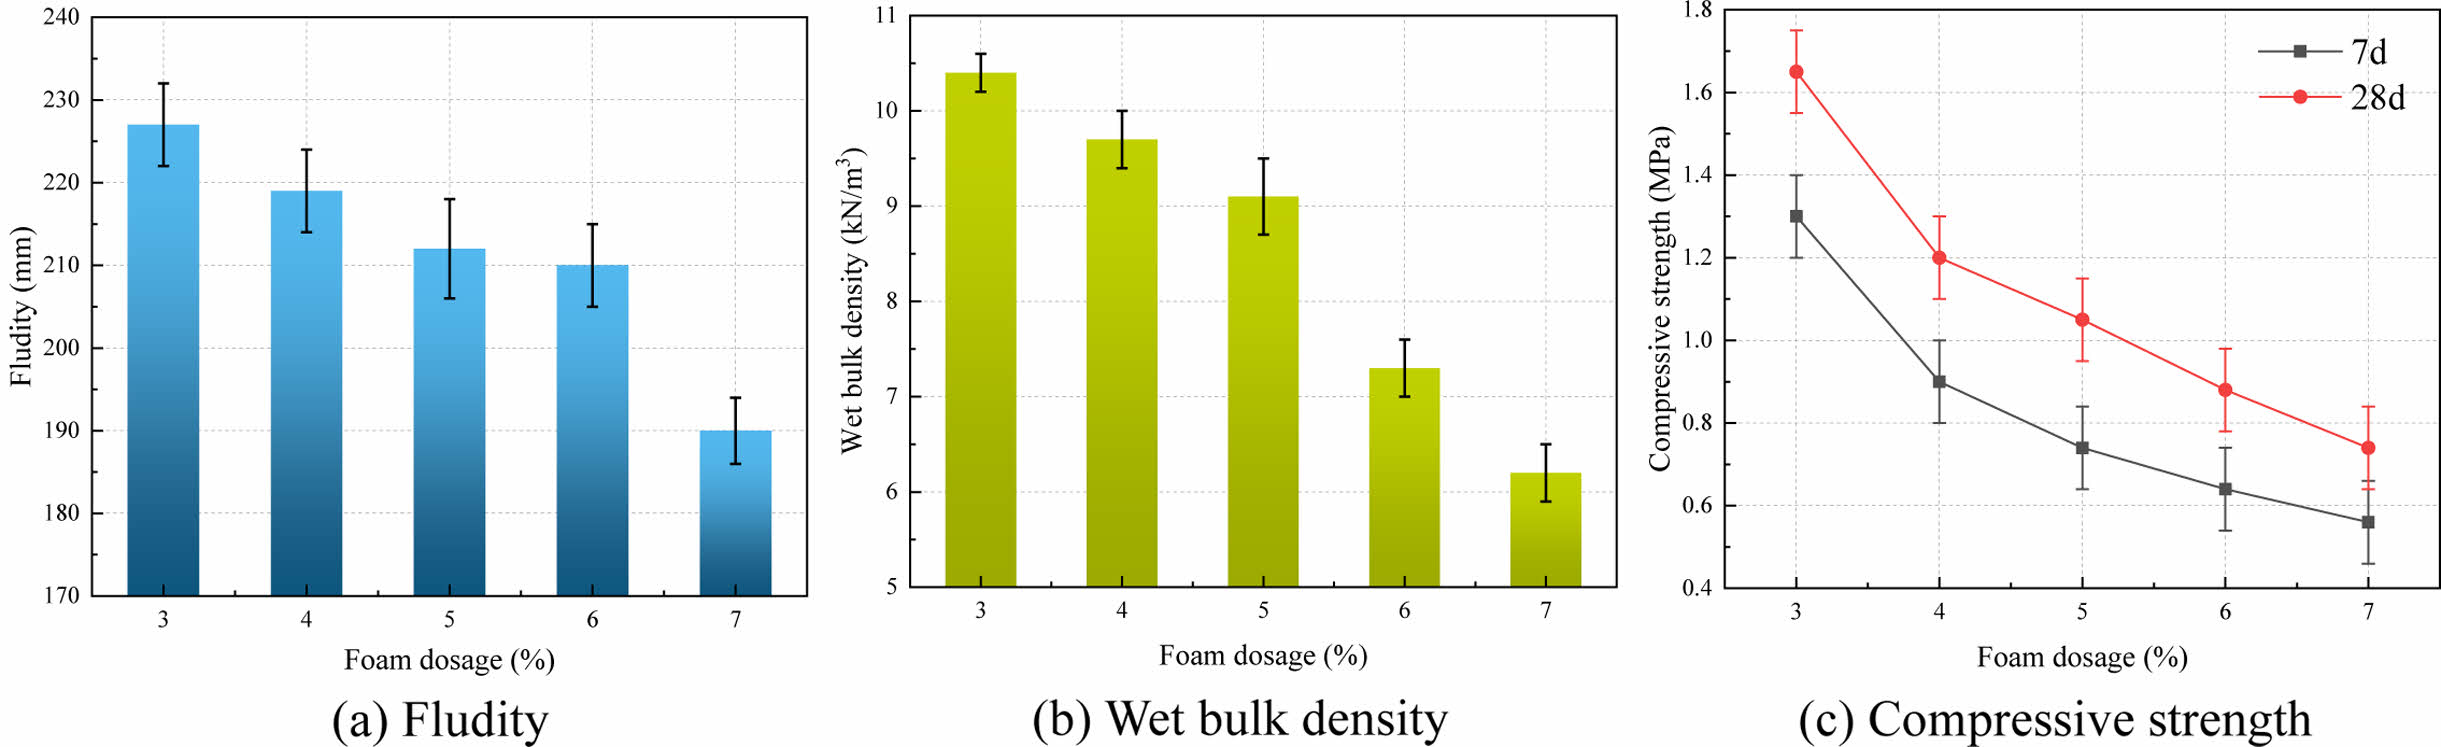
The correlation among fluidity, wet volume weight, compressive strength, and foam dosage of RMFLS prepared with FMX foam agent is illustrated in Fig. 11. The fluidity exhibited a gradual decline with the augmentation of foam dosage. As the foam dosage elevated from 3 wt% to 7 wt%, the fluidity of the FMX specimen diminished from 227 mm to 190 mm. This decline could be attributed to the directional adsorption of surfactant molecules from the foam onto the particle surface, thereby enhancing adhesion with the cementing material. Furthermore, both wet volume weight and compressive strength exhibited a linear decrease with the escalation of foam dosage. As the foam dosage increased from 3 wt% to 7 wt%, the wet bulk density of FMX decreased from 10.4 kN/m³ to 6.2 kN/m³. The compressive strength of specimens at 28 d curing decreased from 1.65 MPa to 0.74 MPa. The strength of RMFLS primarily relies on the cementing material derived from RM. The introduction of foam introduces numerous macroscopic pores, leading to a relative increase in pore volume and a corresponding decrease in the solid phase volume. Consequently, this results in a gradual reduction in wet bulk density and compressive strength.
In conclusion, taking into account the lightweight and high-strength attributes of RMFLS, the optimal foam dosage is determined to be 5 wt%. The preparation involves mixing RMCM with foam. The optimal composition comprises 60 wt% RM, 40 wt% GGBFS, 6 wt% NH, and 5 wt% of the foaming dosage FMX. The specimen had a fluidity of 212 mm and wet bulk weight of 9.1 kN/m3. The compressive strength of the specimen reached 0.74 MPa at 7 d of curing and increased to 1.05 MPa at 28 d of curing.
Enhancement for crack resistance of RMFLS
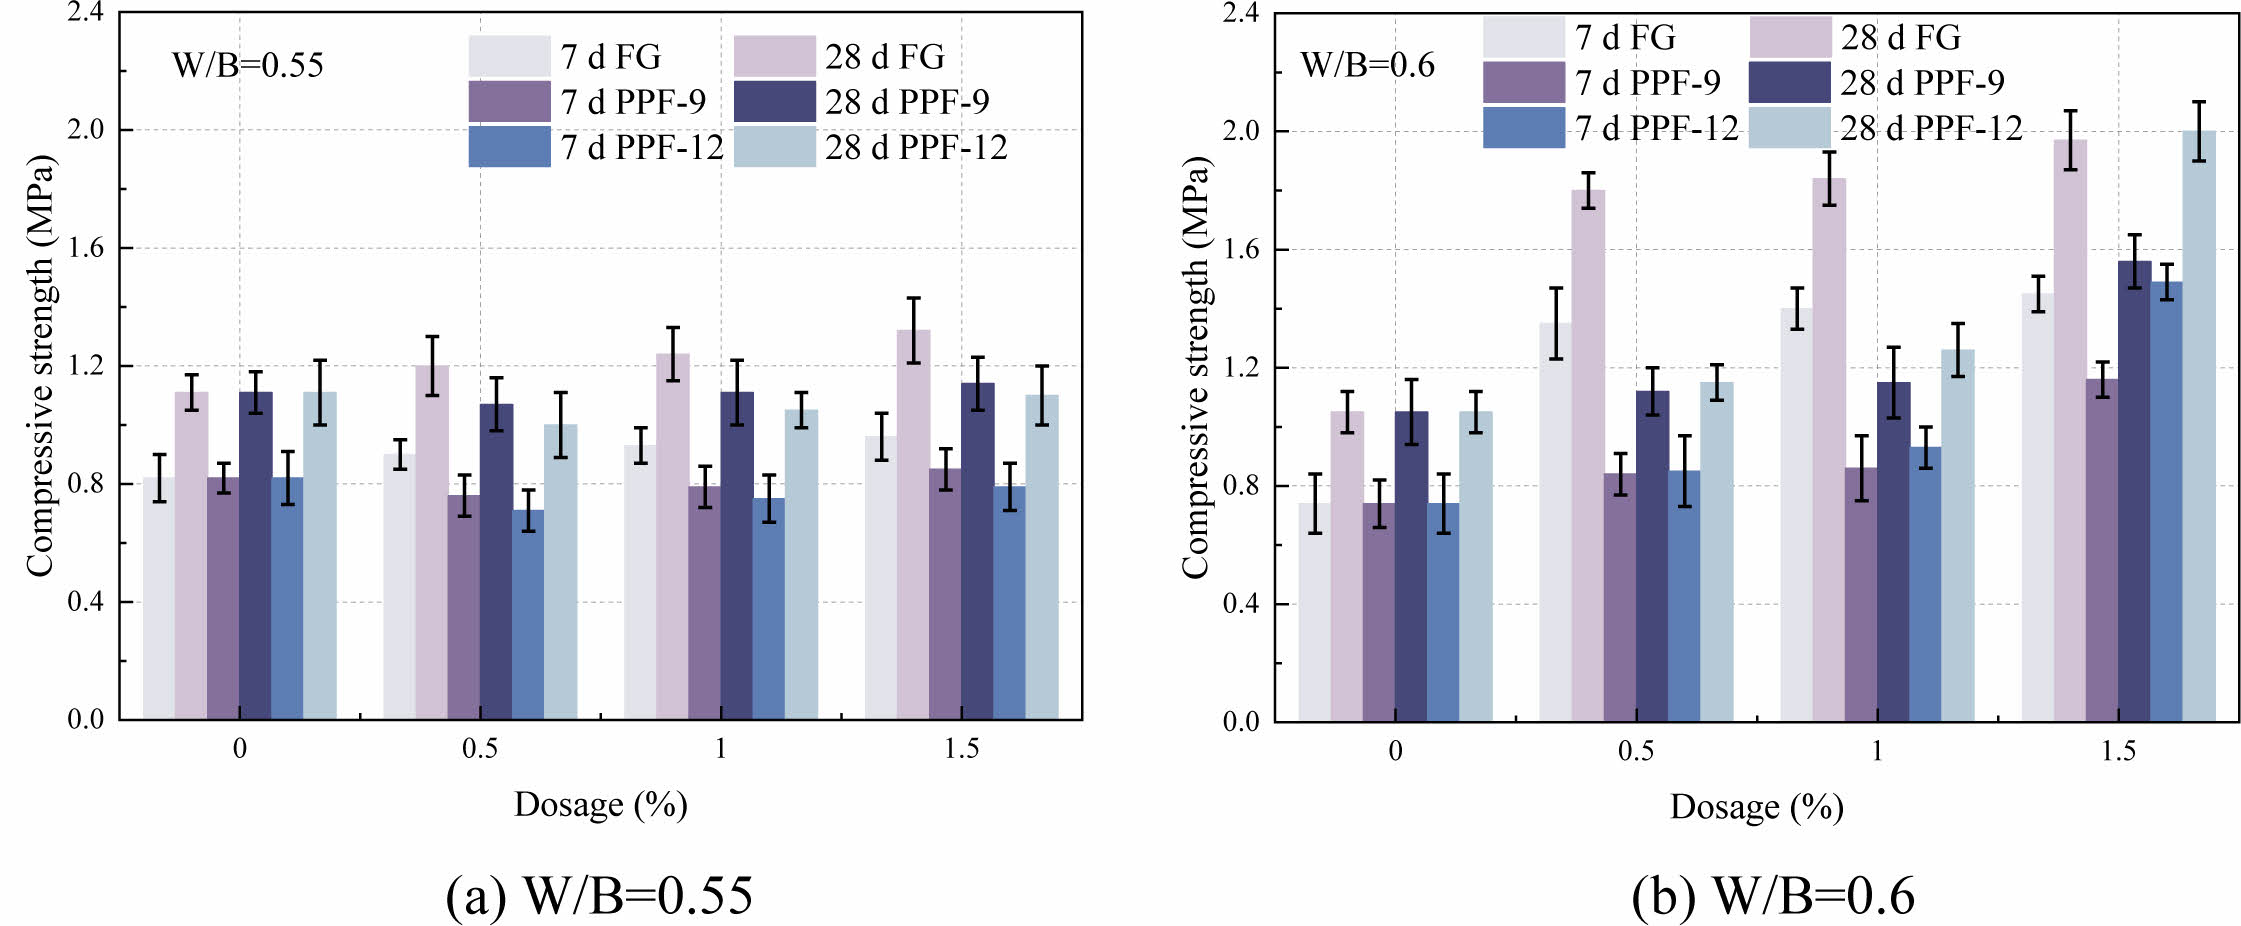
The effect of fiber on the compressive strength of RMFLS is shown in Fig. 12. FG could significantly improve the compressive strength of specimens. At a W/B of 0.6, the compressive strength growth rate reached 87.6% with 1.5 wt% FG dosage. Conversely, at a W/B of 0.55, the compressive strength initially decreased and then rose with the increasing dosage of PPF-9 and PPF-12. The length of a fiber dictates its uniform dispersion within the grout, where evenly distributed short fibers work to impede crack extension and enhance strength. Longer fibers, however, pose a risk of clustering within the paste, leading to irregular dispersion and local stress concentration due to their globular appearance, ultimately diminishing the strength [25]. However, after the addition of FG, the strength development showed the opposite trend. FG has the largest length, but has the strongest effect on compressive strength. This may be due to the smaller diameter of FG, which increases its contact area with the slurry. This promotes an increase in compressive strength. With 0.6 W/B, the incorporation of PPF contributes to an enhancement in compressive strength. At a 28 d curing, adding 1.5 wt% PPF-12 resulted in an increase of 28.2% in compressive strength compared to PPF-9. This improvement was attributed to the increasing W/B, which minimized the clustering of long fibers. In addition, PPF-12 has a larger diameter than PPF-9, so it can inhibit crack growth more effectively.
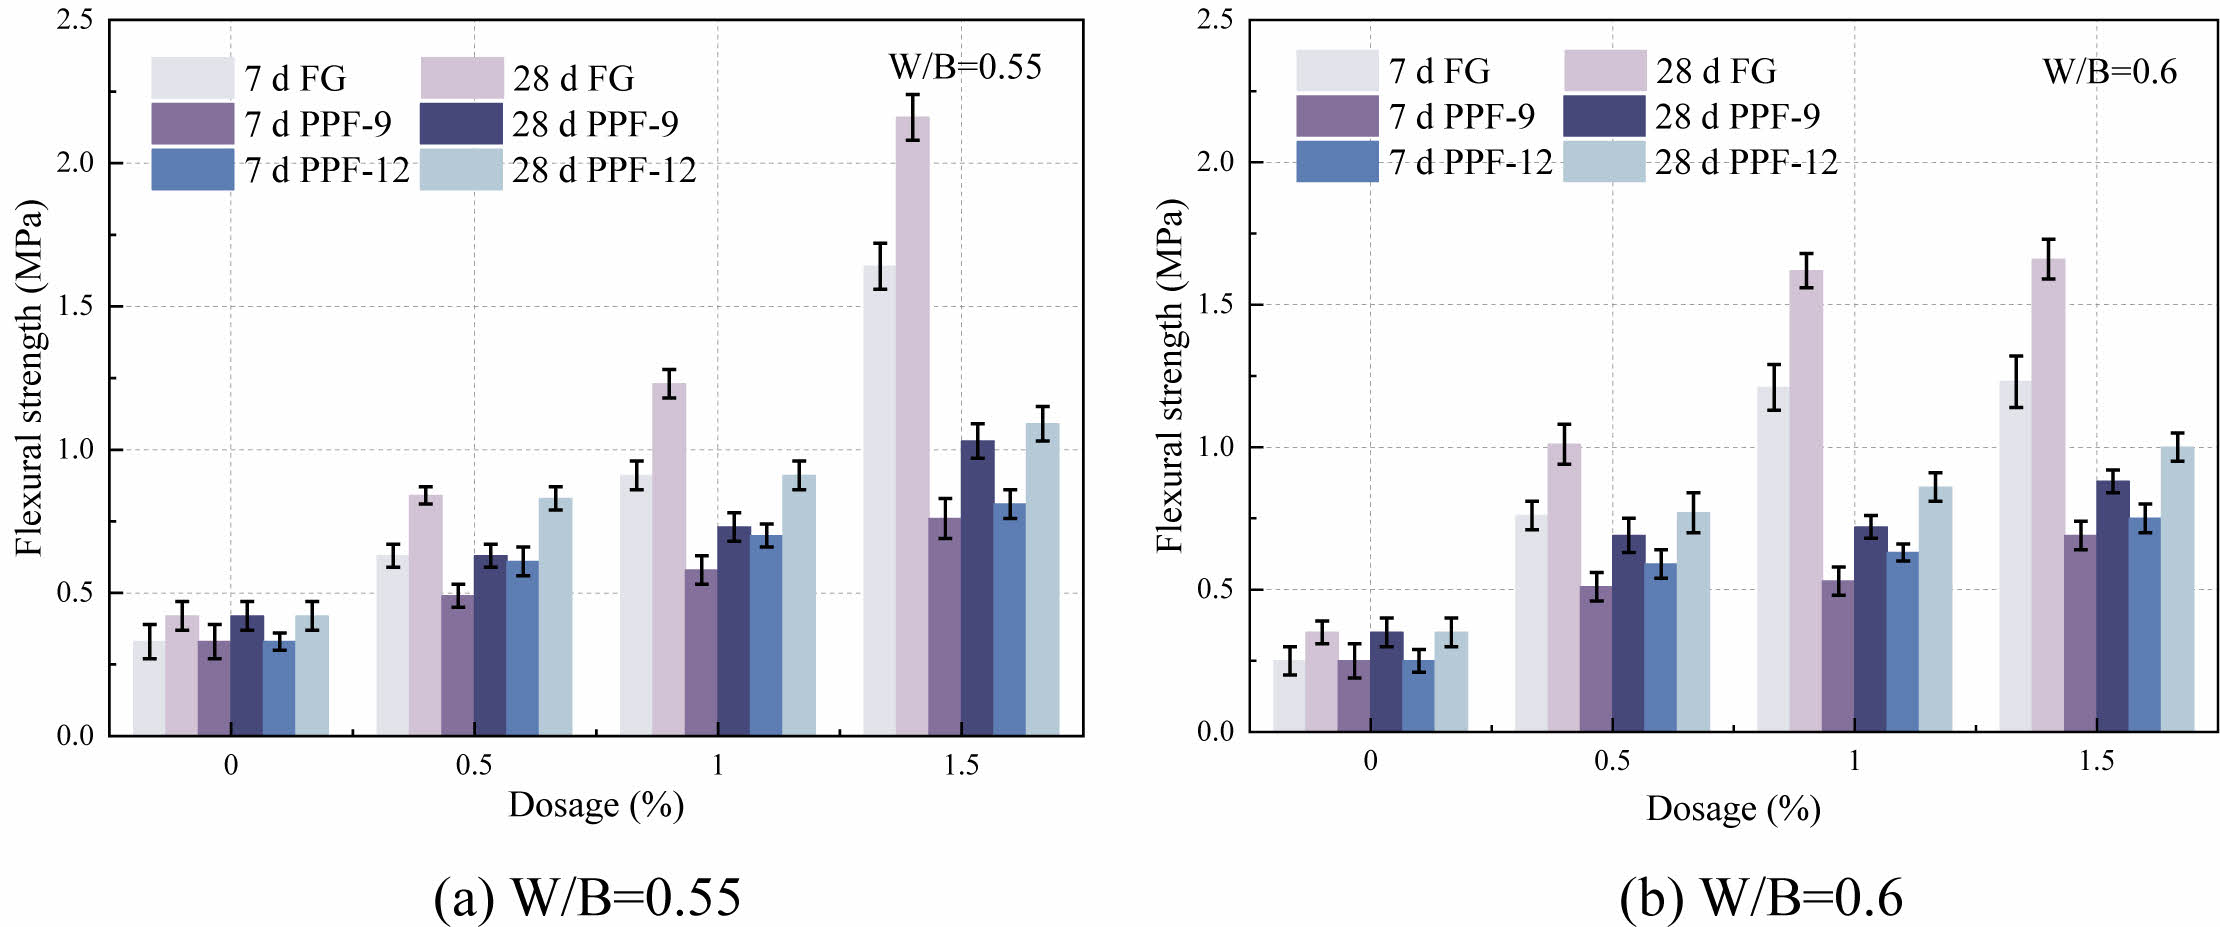
The flexural strength of fibers in RMFLS is illustrated in Fig. 13. All types of fibers contributed to the enhancement of flexural strength in foamed lightweight soil. As the fiber dosage increases, the contact area with RMCM gradually expands, forming a three-dimensional network structure. When the specimen is subjected to a load, the fibers absorb energy, enhance deformation capability, and ultimately improve flexural strength [26]. In addition, the ascending order of flexural strength is FG, PPF-12, and PPF-9 from the highest to the lowest. The increase in PPF-9 content has a very low contribution to the increase in the flexural strength of the specimen. This is because compared to short fibers, long fibers exhibit a larger contact area with the cementing material, leading to enhanced interface adhesion and greater resistance to load. At a W/B of 0.55, the flexural strength of RMFLS added with FG exhibits a remarkable increase. At a 28 d curing, the specimen experienced a respective increase of 414.3% and 374.3% in flexural strength at W/B of 0.55 and 0.6, with a 1.5 wt% dosage of FG. Conversely, altering the W/B does not have a pronounced effect on the flexural strength of RMFLS added PPF. At a 28 d curing and 1.5 wt% PPF-9 dosage, the flexural strength of the specimen increased by 145.2% and 151.4% at W/B of 0.55 and 0.6, respectively. Upon the addition of PPF-12, there was an increase in flexural strength by 159.5% and 185.7%, respectively. The W/B significantly impacts the interface strength between the fiber and cementitious material [27]. An elevation in the W/B leads to an increase in free water content, and the surplus free water evaporates during condensation and solidification, creating pores within the stone body, consequently reducing the flexural strength [28].
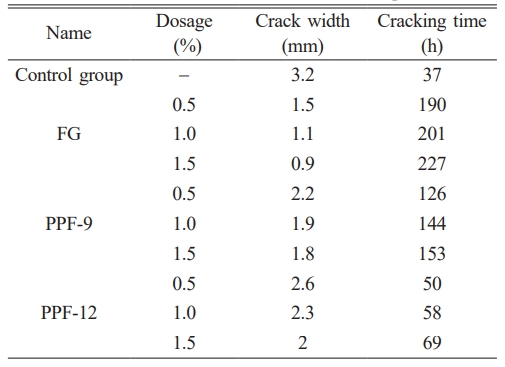
Table 5 presents the crack width and cracking time on the surface of RMFLS after the addition of fibers. The W/B and curing time are set at 0.6 and 7 d, respectively. The control group exhibited the widest crack width at 3.2 mm and the shortest cracking time at 37 hours. Fibers play a mitigating role in the cracking phenomenon of RMFLS, with FG exhibiting the most pronounced optimization effect. The crack width of specimens with a 1.5 wt% dosage was the narrowest at 0.9 mm, representing a 71.9% reduction compared to the control group. Fibers contribute to the enhanced toughness of RMFLS, improving its resistance to deformation, reinforcing shrinkage resistance, and prolonging cracking time. The efficacy in mitigating cracking in RMFLS follows the order of FG, PPF-9, and PPF-12 from best to worst, with a stronger effect observed with an increase in fiber dosage.
|
Fig. 4 Effect of RM content on initial setting time. (activator-6%) |
|
Fig. 5 Effect of activator dosage on initial setting time. (RM content-60%) |
|
Fig. 6 Effect of RM content on compressive strength. (activator-6%) |
|
Fig. 7 Effect of activator dosage on compressive strength. (RM content-60%) |
|
Fig. 8 The relationship between foaming times and pH of four foaming agents. |
|
Fig. 9 The relationship between settling distance and pH of four foaming agents. |
|
Fig. 10 The relationship between water secretion and pH of four foam agents. |
|
Fig. 11 The effect of foam dosage on properties of RMFLS. |
|
Fig. 12 The effect of fiber on compressive strength of RMFLS. |
|
Fig. 13 The effect of fiber on flexural strength of RMFLS. |
In this paper, RMFLS was developed, and the effect of fiber on crack resistance improvement in the foamed lightweight soil was studied. The conclusions can be drawn:
(1) The optimal ratio was determined as 60 wt% RM, 40 wt% GGBFS, and 6 wt% NH. At 28 d of curing, the compressive strength of RMCM reached 6.02 MPa and the initial setting time was 104 min.
(2) FM-20AB had the best performance in alkaline solution with pH range from 8 to 14, achieving the highest foaming ratio of 24 and the lowest settling distance of 1 mm. The composite foam agent FMX was composed of XG and FM-20AB. When the dosage was 5 wt%, the mobility of foamed lightweight soil was 212 mm. The compressive strength was 0.74 MPa at 7 d of curing and increased to 1.05 MPa at 28 d of curing.
(3) Fiber could effectively improve the crack resistance of RMFLS. FG exhibited the most pronounced improvement effect, and the enhancement became more pronounced as the dosage of fiber increased. The crack width of RMFLS with 1.5 wt% FG was the narrowest of 0.9 mm and the longest cracking time was 227 h.
This study was financially supported by the Shandong Province Key R&D Program (Major Technological Innovation Project) (No. 2021CXGC010301 and 2023ZLGX01), the National Key Research and Development Program of China (No. 2022YFB2601900), the Youth Project of National Natural Science Foundation (No. 52309136), and the competitive innovation platform project of Shandong Province (No. 2023CXPT080). The authors would like to thank Chenxiao Qi from Shiyanjia Lab (www.shiyanjia.com).
Ning Zhang: Investigation, Methodology, Writing- Original draft, Writing-review & editing. Xingzhang Guo: Supervision, Conceptualization, Methodology. Yuyan Li: Writing-review & editing. Jian Zhang: Writing-review & editing, Funding acquisition. Tingting Yu: Writing-review & editing.
☑ The authors declare that they have no known competing financial interests or personal relationships that could have appeared to influence the work reported in this paper.
☐ The authors declare the following financial interests/personal relationships which may be considered as potential competing interests.
This study was financially supported by the Shandong Province Key R&D Program (Major Technological Innovation Project) (No. 2021CXGC010301 and 2023ZLGX01), the National Key Research and Development Program of China (No. 2022YFB2601900), the Youth Project of National Natural Science Foundation (No. 52309136), and the competitive innovation platform project of Shandong Province (No. 2023CXPT080). The authors would like to thank Chenxiao Qi from Shiyanjia Lab (www.shiyanjia.com).
Data available on request from the authors.
- 1. K. Asghari, S. Sotoudeh, and J.A. Zakeri, Transp. Geotech. 28 (2021) 100519.
-

- 2. T.H.M. Le, T.W. Lee, and J.W. Seo, Transp. Geotech. 28 (2021) 100542.
-
- 3. J. Li, Z. Chen, and W. Chen, Structures 27 (2020) 1951-1961.
-
- 4. A. Al-Shwaiter and H. Awang, Constr. Build. Mater. 376 (2023) 131052.
-
- 5. S. Feng, Y. Zhou, and Q.M. Li, Constr. Build. Mater. 357 (2022) 129340.
-
- 6. T.S. Tie, K.H. Mo, and A. Putra, J. Build. Eng. 30 (2020) 101219.
-
- 7. J. Xiao, H. Zhang, and S. Zou, J. Build. Eng. 53 (2022) 104555.
-
- 8. M.R. Jones and L. Zheng, Mag. Concrete. Res. 65[4] (2013) 209-219.
-
- 9. Z. Li, Y. Gao, and J. Zhang, Mater. Chem. Phys. 267 (2021) 124657.
-
- 10. J. Wang, K. Xu, and Z. Li, J. Ceram. Process. Res. 23[1] (2022) 79-85.
-
- 11. D.J. Moon, Y.B. Kim, and J.S. Ryou, J. Ceram. Process. Res. 9[3] (2008) 278-281.
-
- 12. S.T. Lee, J. Ceram. Process. Res. 9[4] (2008) 358-361.
-
- 13. C. Park and K. Kim, J. Ceram. Process. Res. 11[5] (2010) 570-574.
-
- 14. H.Y. Kim, B.S. Chun, and T.H. Park, J. Ceram. Process. Res. 12[2] (2011) 202-206.
-
- 15. T.H. Ahn and J.S. Ryou, J. Ceram. Process. Res. 15[4] (2014) 216-220.
-
- 16. C.W. Hong, J.I. Lee, and J.H. Ryu, J. Ceram. Process. Res. 17[7] (2016) 768-772.
-
- 17. F. Matalkah, A. Ababneh, and R. Aqel, Ceram. Int. 49[6] (2023) 9967-9977.
-
- 18. Z. Zhang, J.L. Provis, and A. Reid, Cem. Concr. Compos. 62 (2015) 97-105.
-
- 19. Y. Yang, J. Jiang, and L. Hou, Constr. Build. Mater. 254 (2020) 119226.
-
- 20. S. Yan, F. Zhang, and J. Liu, J. Clean. Prod. 227 (2019) 483-494.
-
- 21. Y. Liu, Y. Meng, and X. Qiu, Ceram. Int. 49[4] (2023) 7030-7039.
-
- 22. S. Agrawal and N. Dhawan, Miner. Eng. 171 (2021) 107084.
-
- 23. N. Koshy, K. Dondrob, and L. Hu, Constr. Build. Mater. 206 (2019) 287-296.
-
- 24. Z. Li, Y. Gao, and M. Zhang, Mater. Chem. Phys. 276 (2022) 125311.
-
- 25. S. Peng, F. Li, and J. Man, Mater. Today. Commun. 33 (2022) 104408.
-
- 26. M. Orouji, S.M. Zahrai, and E. Najaf, Structures 33 (2021) 4616-4628.
-
- 27. H. Yin, J. Liu, and X. Zhou, Constr. Build. Mater. 370 (2023) 130708.
-
- 28. F. Gu, J. Xie, and C. Vuye, J. Clean. Prod. 420 (2023) 138335.
-
 This Article
-
2024; 25(3): 355-364
Published on Jun 30, 2024
- 10.36410/jcpr.2024.25.3.355
- Received on Feb 21, 2024
- Revised on Mar 17, 2024
- Accepted on Mar 19, 2024
Services
- Abstract
introduction
materials and methods
results and discussion
conclusion
- Acknowledgements
- Author Contributions
- Declaration of Interest
- Data availability statement
- References
- Full Text PDF
Shared
Correspondence to
- Jian Zhang
-
aGeotechnical and Structural Engineering Research Center, Shandong University, Jinan, Shandong, 250061, PR China
cSolid Waste Recycling Technology Innovation Center of Shandong Province, Jinan, Shandong, 250098, PR China
Tel : 15069192830 E-mail: zhjian1@126.com - E-mail: zhjian1@126.com
Clean-Energy Research Institute(CRI), Hanyang University, 222, Wangsimni-ro, Seongdong-gu, Seoul, 04763, Korea
E-mail: jcpr@hanyang.ac.kr