


- Indigenous materials revolution: Synthesizing porcelain alumina ceramic insulators for sustainable electrical systems in Indonesia
W. Garinasa,*, A. Fauzia, H. Hidayaturrahmana, Q.N. Madraa, Subarib, D.M. Nurjamana, W. Hidayata, Y. Sudiyantoa, N.V. Permatasaria, Zulfahmia and Yurohmanc
aMining Technology Research Center, National Research and Innovation Agency, Serpong, Indonesia
bAdvanced Materials Research Center National Research and Innovation Agency, Serpong, Indonesia
cPolymer Technology Research Center, National Research and Innovation Agency, Serpong, IndonesiaThis article is an open access article distributed under the terms of the Creative Commons Attribution Non-Commercial License (http://creativecommons.org/licenses/by-nc/4.0) which permits unrestricted non-commercial use, distribution, and reproduction in any medium, provided the original work is properly cited.
The modern electrical industry in Indonesia faces escalating energy demands, projected to reach 1,413 Terawatt Hours by 2060. Meeting these demands necessitates enhancing the quality of electrical transmission systems, particularly insulators, with a focus on local materials to reduce dependency on imports. Porcelain Alumina Ceramic Insulators (PACI) offer promising alternatives due to their high resistivity and mechanical strength. This study investigates PACI synthesis using locally sourced materials: kaolin, ball clay, alumina, and feldspar. Chemical analysis confirms alumina as the primary component (99.7% Al2O3), while other materials contribute to silica content. Fabrication involves crushing, drying, grinding, sieving, and sintering at 1280 °C, yielding specimens (K1S, K2S, K3S). Material characterization employs XRD, XRF, SEM and electrical tests reveals phase compositions, morphological changes, and electrical properties. K3S, rich in feldspar, exhibits superior material strength (74.62 N/mm²) and hardness (190 N/mm²) with limited conductivity. Utilizing local resources for PACI production promises economic benefits and reduces import dependence. This study illuminates the interplay between material composition and resulting properties, offering insights into ceramic synthesis for improved electrical infrastructure.
Keywords: Local raw materials, Porcelain alumina ceramic insulators, Sintering process, X-ray diffraction (XRD) analysis, Scanning electron microscopy (SEM), Electrical properties.
The electrical industry is integral to human existence, facing increasing energy demands in Indonesia [1]. By 2060, it’s projected to require 1,413 Terawatt Hours (TWh) of electricity [2]. To meet these needs sustainably, enhancing the quality of transmission systems, especially insulators, is crucial [3]. Challenges include reducing reliance on imported raw materials for insulator production. Utilizing local resources like Kaolin, Ball clay, Feldspar, Quartz Sand, and Bauxite could mitigate costs associated with maintenance and replacement [4]. This shift toward local materials remains underexplored despite their abundance. As such, the sector must prioritize research into optimizing these resources. Meeting this demand entails improving all aspects of electrical infrastructure, particularly focusing on critical components such as insulators [5].
One type of insulator commonly used and still viable for further development is the Porcelain Alumina Ceramic Insulators (PACI). The most important characteristics of PACI for applications in electric power distribution and transmission systems include high electrical resistivity, high dielectric strength, high electrical stability, good mechanical properties, corrosive resistance and excellent radiation and heat insulation capacity [6]. In particular, electrical resistivity, dielectric strength, and mechanical strength are important factors influenced by the primary phase of porcelain materials, especially the mullite and glass phases formed during high firing temperatures. These materials undergo different physical transformations and exhibit interactive responses under thermal conditions, which ultimately contribute to the production of the final product [7].
The production of Porcelain Alumina Ceramic Insulators (PACI) doesn’t demand sophisticated equipment or complex processes, unlike other high voltage insulators. Consequently, manufacturing and testing standards for PACI are less stringent [8]. Despite Indonesia’s ceramic industry utilizing materials like kaolin, feldspar, ball clay, alumina, and quartz for insulator production, some materials are still imported. To address this, leveraging locally available resources for PACI manufacturing is essential. This research seeks to synthesize PACI using indigenous materials such as kaolin, feldspar, ball clay, and alumina, aiming to bolster the country’s economy and reduce dependence on imports. By utilizing abundant natural resources, the study aims to make a substantial contribution to the local economy while ensuring self-sufficiency in PACI production [9].
Materials
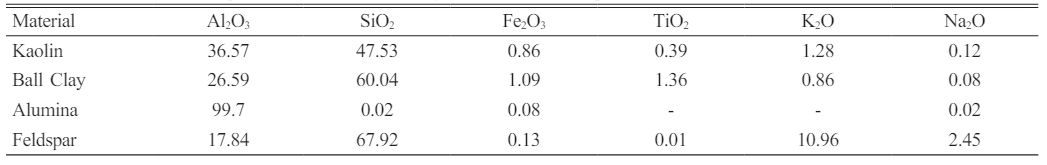
The four raw materials: kaolin, ball clay, alumina and feldspar were sourced locally from selected deposits in Indonesia. Kaolin was got from Belitung Island; ball clay and alumina was sourced from West Kalimantan; Lampung provided feldspar. The chemical composition of these raw materials was carried out using X-Ray diffraction analysis (XRD) method, and the results can be seen in Table 1.
The primary chemical component in the raw material employed for the fabrication of porcelain alumina ceramic insulators is alumina, constituting a dominant chemical composition of approximately 99.7% Al2O3. Additionally, the components including kaolin, ball clay, and feldspar contribute significantly to the silica dioxide (SiO2) content, with respective proportions of approximately 47.53%, 60.04%, and 67.92%. The binding agent utilized for the composite material during the mixing process is a deflocculant.
Methods
Sample Preparation
The experimental procedure started with treating kaolin, ball clay, and feldspar rock samples, crushed to 10 mesh, while alumina remained in powder form at 20 mesh. After drying at 60 °C, grinding ensured uniformity, followed by sieving to achieve 200 mesh particle size. These steps, crucial for raw material preparation, ensure standardized conditions for fabricating porcelain alumina ceramic insulators [10].
Composite synthesis process
Samples consisting of kaolin (Al2Si2O5(OH)4), ball clay (Al2O2SiO2∙2H2O), feldspar (KAlSi3O8 - NaAlSi3O - CaAl2Si2O8), and alumina (Al2O3), totaling 5 kg with varied mass percentages (detailed in Table 2), underwent mechanical milling for an hour to ensure material homogenization. Post-milling, the product was combined with 20 ml deflocculant and 300 ml water, thoroughly stirred for uniformity. The composite was then molded into 5 cm diameter specimens under 200 Bar pressure. These specimens underwent sintering at 1280 °C for 8 hours, followed by controlled cooling to room temperature. Resulting sintered specimens, denoted as K1S, K2S, and K3S, were systematically produced to meet defined compositions and properties for evaluation and subsequent application in porcelain alumina ceramic insulators [11].
Material Characterization
Pre- and post-sintering composite samples will undergo thorough characterization, analyzing phases, crystal structure, and size using a Rigaku Miniflex 600 X-ray diffractometer. Operating at 40 kV and 40 mA, it ensures accurate measurements with a wavelength of 1.5406 Å. Crystallite size determination will employ the Scherrer equation [12] as follow:
In the Scherrer equation, ‘K’ represents a crystal form factor (often 0.9 for ceramics), while λ Cukα1 is the X-ray wavelength (0.15405 nm for Cu K-α1 radiation). ‘D’ stands for crystallite size (in nanometers), ‘θ’ for Bragg’s angle, and ‘β’ for line broadening (determined by FWHM in radians). Highscore plus software quantifies XRD results for phase percentages, lattice parameters, and unit cell volume.
XRF with Rigaku NexCG determines elemental composition, complementing XRD insights. SEM with Phenom ProX and ImageJ analysis quantify particle sizes, revealing morphological characteristics. Electrical properties were evaluated using Phenix Technologies equipment, elucidating conductivity and resistivity. This comprehensive approach integrates morphological, chemical, and electrical assessments, providing a thorough understanding of composite material properties and potential applications. Each technique contributes essential insights, enhancing knowledge of the material’s structure, composition, and functional behavior, thereby facilitating informed decision-making regarding its use in various applications.
|
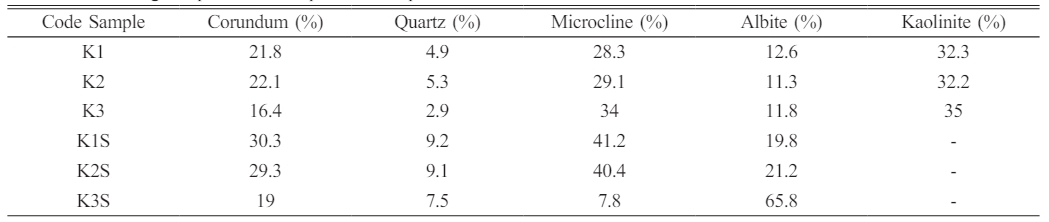
Table 1 The chemical composition of kaolin, ball clay, alumina and feldspar (wt.%). |
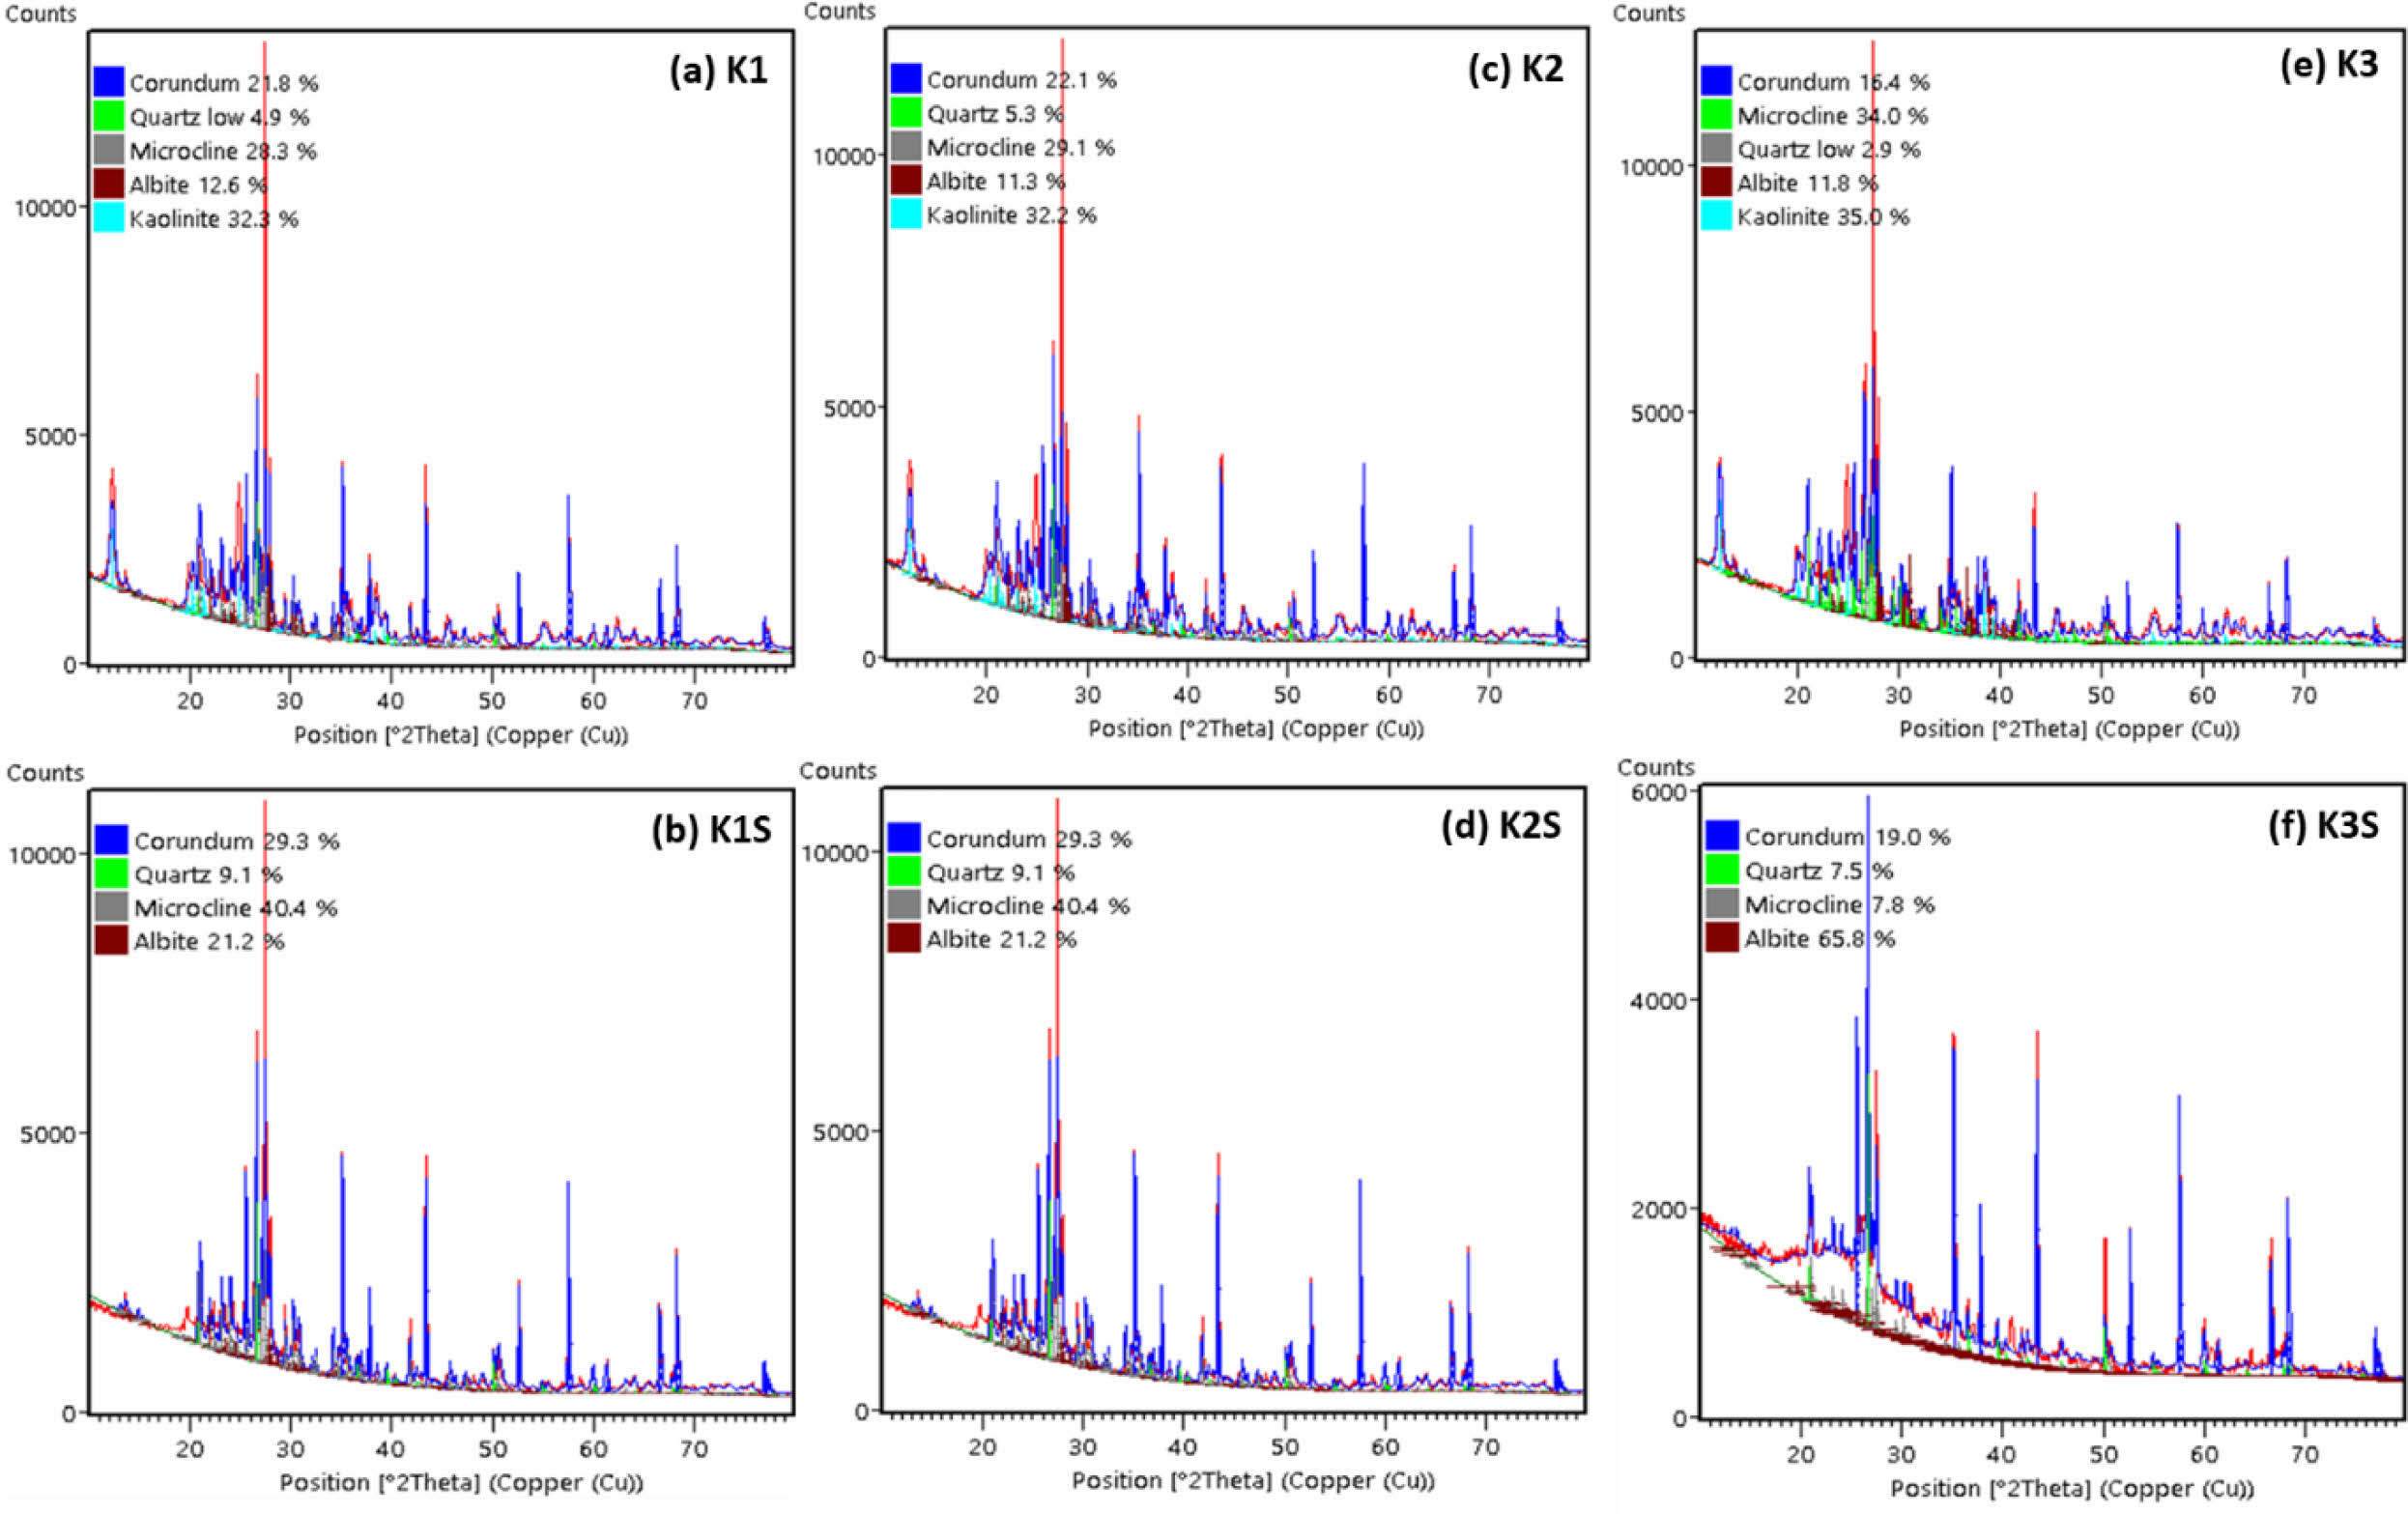
Composition Analysis through XRD Patterns
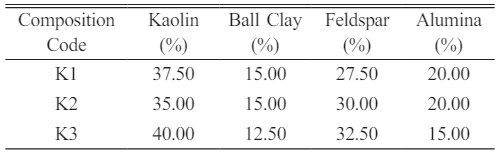
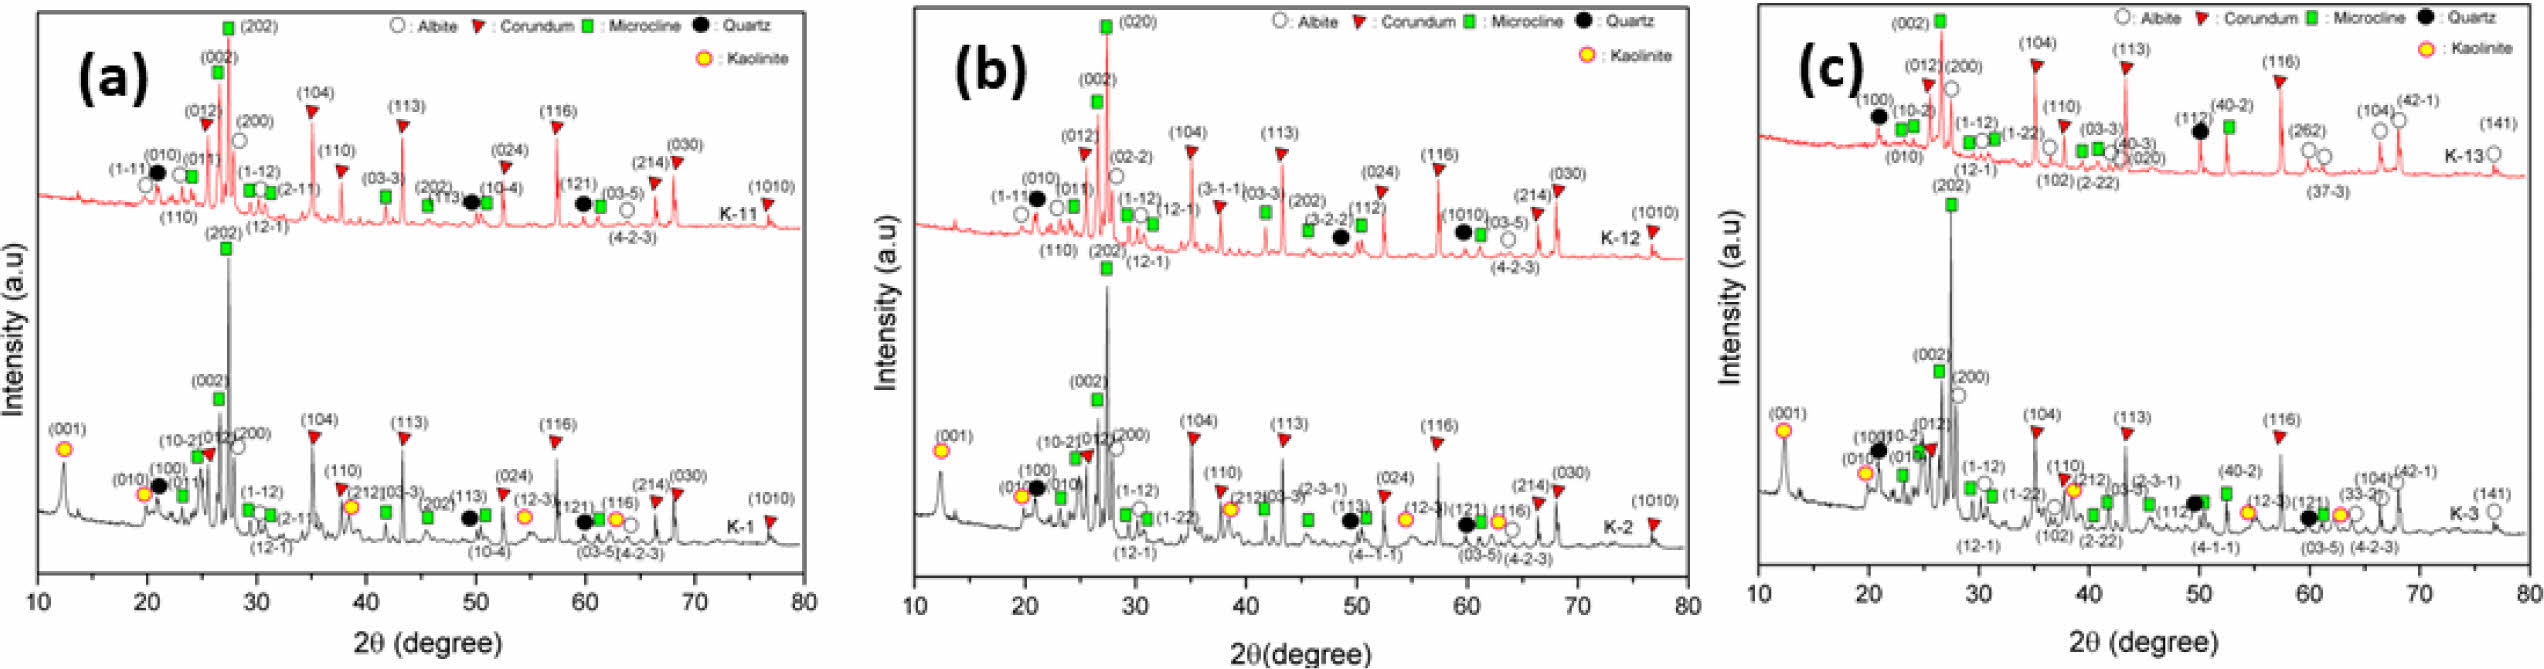
The qualitative and quantitative details of phase compositions from the X-ray diffraction (XRD) patterns for various samples under investigation, differentiating between unsintered (K1, K2, K3) and sintered (K1S, K2S, K3S) states. The percentage composition of each identified phase, including Corundum (Al2O), Quartz (SiO2), Microcline (KAlSi3O8), Albite (Na(AlSi3O8)), and Kaolinite (Al2Si2O5(OH)4), is meticulously documented for a comprehensive understanding (Fig. 1 and Table 4). For the unsintered samples (K1, K2, K3), the data reveals varying proportions of phases, with K3 exhibiting a lower content of Corundum (16.4%) and Quartz (2.9%) but a higher presence of Microcline (34%) and Kaolinite (35%). In contrast, K1 and K2 show higher percentages of Corundum and Quartz, while K2 has a relatively higher proportion of Microcline. Upon sintering (K1S, K2S, K3S), a notable transformation in phase composition is evident. The Corundum content increases substantially in all sintered samples, with K1S and K2S exhibiting higher proportions compared to K3S. Quartz and Microcline also show increments after sintering, contributing to the overall densification of the materials. Albite becomes a dominant phase in the sintered states, particularly in K3S, where it constitutes the majority (65.8%) of the composition.
The prevalence of the kaolinite phase at 32.5% can be attributed to the composition of raw material K1, which contains a higher percentage of kaolin compared to ball clay, feldspar, and alumina. This higher kaolin content imparts favorable plastic properties, facilitating easy formability of the insulator shoulder material prior to the sintering process. The dominance of the kaolinite phase aligns with its utility in enhancing the plasticity of ceramic formulations [13]. The presence of kaolinite in the XRD results corresponds to the crystallographic data obtained from the Crystallography Open Database (COD) entry with number 9009230 (Fig. 1a). However, kaolinite, present in the unsintered samples, is absent in the sintered state, as evidenced by the lack of diffraction peaks associated with kaolinite and its indication of melting [14].
This augmentation is clearly visible in the XRD patterns, which reflect an increase in the percentage of albite phase in the post-sintered samples. Further analysis of Sample K1S revealed that the feldspar raw material, which is the composition, contributed to the appearance of new diffraction peaks at 2θ, specifically at 19.72° with the (1-11) crystal lattice plane, as illustrated in Fig. 1b. After the sintering treatment, a comprehensive XRD pattern analysis was carried out using a continuous refinement approach. This analysis confirmed the absence of a kaolinite phase, showing a percentage of 0%. As a result, there is a proportional increase in the percentage of corundum, microcline, and albite phases, approximately 30.3%, 41.2%, and 19.8%, respectively, as depicted in Table 4. These findings underscore the transformative impact of sintering on the crystalline phase in ceramic composites [15].
Quantitative XRD Pattern Analysis with Rietveld Refinement Method
Quantitative results on the results of the XRD pattern given by the Rietveld refinement method using Highscore plus. XRD data file results from measurements using XRDML files and COD (Crystallography Open Database) data are universal XRD data results that have been standardized. In the Highscore Plus software, to match the measurement data and universal data using the Rietveld refinement method to obtain data on the percentage of corundum, microcline, albite, kaolinite and quartz phases. This shows that the XRD measurement data matches the universal XRD data. In Fig. 2a, the Rietveld refinement results on sample K1 can be seen from the red line which shows the XRD measurement data which coincides with the blue line which shows the corundum phase, the green line is the quartz phase, the gray line is the microcline phase, the brown line is the albite phase and the light blue line are kaolinite. Meanwhile, in Fig. 2b, after the Rietveld refinement process was carried out, only 4 phases appeared, namely the corundum, quartz, microcline and albite phases, while the kaolinite phase disappeared because the aluminum bonds were reduced to fuse with sodium to form the dominant albite phase.
Figure 2c shows the results of Rietveld refinement on the K2 sample which shows that the sample XRD measurement data coincides with the universal XRD data resulting in 3 dominant phases, namely corundum, kaolinite, microcline. This shows that the Al bond from the raw material kaolin with feldspar contains sodium so that the kaolinite phase appears before it is burned, but if sintered Al melts at a sintering temperature above 1280 oC so that Al is substituted into sodium, forming the dominant albite phase which can be seen in Fig. 2d. Fig. 2e shows that the Rietveld refinement results obtained by universal standard XRD data and XRD measurement data have coincided with each other so that 5 diffraction peaks were obtained, namely the corundum, microcline, quartz, albite and kaolinite phases. After the sintering process, the kaolinite phase disappeared resulting in the albite phase being more dominant. can be seen in Fig. 2f. This shows that decreasing the percentage of feldspar in the composite can have the effect of increasing the addition of the albite phase.
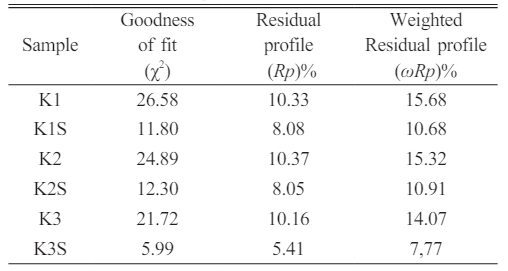
The fitting results using the Rietveld refinement method are a way of matching the diffraction peaks of XRD measurement data with universal standard XRD data in a coincident manner. Fitting results that match or match universal standard XRD data can be seen from the Goodness of Fit (GOF) value. The ideal GOF parameter value is close to 1.9 [16]. The Rietveld refinement results near the composite before and after sintering in Table 5 show a value that is almost close to the ideal GOF value, namely sample K3S with a GOF value of around 5.99. This shows that the diffraction peaks of the XRD measurement data and the diffraction peaks of the universal standard XRD data are almost in agreement. Meanwhile, the residual result from fitting the diffraction peaks of XRD measurement data and universal standards is the fitting difference which can be shown to be the residual profile values (Rp) and (ωRp). The ideal Rp and ωRp parameter values are below 10% [17]. The results show that the K3S sample has Rp and ωRp values close to the ideal parameter values, namely around 5.41 and 7.77%, meaning that the XRD pattern data from the measurements obtained by K3 is in accordance with the universal standard XRD pattern data. Meanwhile, the GOF, Rp and ωRp values owned by K1, K1S, K2, K2S and K3 must be carried out again through a Rietveld refinement process to obtain ideal values.
Crystallite Size Analysis through XRD Patterns
X-ray diffraction (XRD) employs the Rietveld refinement method for quantitative analysis of composite materials, extracting crystal structure and phase composition details. This iterative process adjusts parameters like atomic positions and thermal vibrations to match experimental and calculated XRD patterns. Full-Width at Half Maximum (FWHM) values, reflecting peak width, are crucial metrics influenced by factors like crystallite size and strain. The Scherrer Formula, utilizing X-ray wavelength, FWHM, and Bragg angle, calculates crystallite size. Combining Rietveld refinement and the Scherrer Formula provides a comprehensive understanding of a material’s crystallographic properties, aiding phase quantification and revealing crystallite size distribution [18].
Corundum
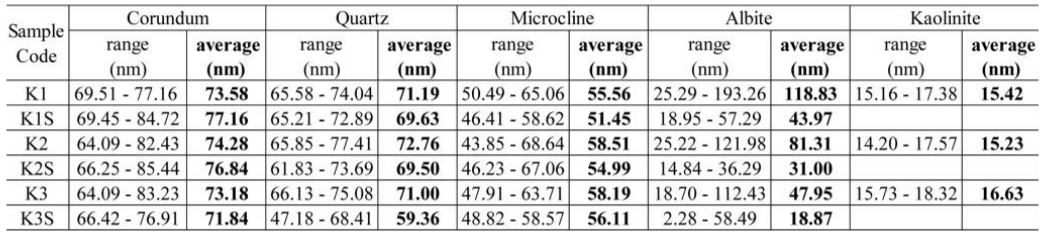
The XRD pattern of sample K1 exhibits quantitative analysis indicating a rise in the corundum phase from 21.8% to 30.3% in K1, attributed to aluminum-oxygen interaction resulting from sintering an alumina-based material. This increase sharpens diffraction peaks, reflected in reduced FWHM values. Crystallite size calculations show a significant corundum size increase from 69.51 to 77.16 nm (Table 6). For samples K2 and K2S, Rietveld refinement reveals a higher pre-sintering FWHM in K2, indicating decreased stability due to aluminum-oxygen interaction during sintering [19]. Post-sintering, FWHM decreases, enhancing corundum stability, altering crystallite size from 74.28 to 76.84 nm. Sample K3 displays reduced corundum presence, with only five characteristic diffraction peaks due to composition variations. Reduced alumina content limits aluminum-oxygen interaction during sintering, decreasing corundum to 19% [6]. Consequently, crystallite size shifts from 73.18 to 71.84 nm after sintering.
Quartz
Quantitative XRD analysis of sample K1 (Table 6) detected FWHM changes at these peaks, attributed to silicon-oxygen interactions, resulting in an increased Quartz phase from 4.9% to 9.2% [11]. Crystallite size decreased post-sintering (K1S) from 71.19 to 69.93 nm. Samples K2 and K2S showed Quartz phase percentages from 5.3% to 9.1%, with increased FWHM values indicating interaction stability. This stability, while widening peaks, decreased crystallite size from 72.76 to 69.50 nm in K2S. Rietveld refinement on K3 and K3S revealed a significant FWHM increase at 20.89°, yielding a crystallite size of 47.18 nm. Quartz phase in K3S exhibited reduced crystallite size from 71.00 to 59.36 nm across peaks. These findings underscore the sintering process’s impact on Quartz phase stability and crystallite size in composites [20].
Microcline
In the XRD analyses of samples, microcline phases were evident in K1 at specific 2θ diffraction peaks. Post-sintering, a decrease in one diffraction peak indicated increased microcline phase stability, alongside a reduction in crystallite size from 55.56 to 51.45 nm (K1S). Similarly, in K2, a microcline phase (KAlSi3O8) comprised approximately 40.4% of the composite. Sintering induced phase stability, coinciding with decreased intensity and disappearance of a diffraction peak. This alteration led to a substantial decrease in crystallite size to 54.99 nm. Quantitative analysis of K3 using Rietveld refinement revealed a microcline phase percentage of 7.8%. Increased interaction between aluminum bonds and sodium favored the albite phase dominance [21]. This shift relegated microcline to a minor phase, correlating with the disappearance of four diffraction peaks and a decrease in crystallite size from 58.19 to 56.11 nm (K3S).
Albite
In sample K1, XRD analysis identifies three albite phase diffraction peaks. After sintering (K1S), two additional diffraction peaks appear. This transformation coincides with a decrease in FWHM values, indicating a reduction in crystallite size from 118.83 to 43.97 nm. Similarly, for K2, XRD analysis post-sintering reveals a decrease in crystallite size from 81.31 to 31.00 nm alongside the appearance of the albite phase [13]. In K3, the sintering process exhibits a significant albite phase diffraction peak, with 65.8% albite content and ten 2θ angle diffraction peaks. The disappearance of the peak at 19.85°, replaced by one at 19.72°, indicates albite phase formation. However, in K3S, the decrease in crystallite size from 47.95 to 18.87 nm accompanies the loss of the kaolinite phase and the transformation of albite into Mullite. These findings emphasize the complex interplay between composition, sintering conditions, and resultant crystalline structure in the examined composite materials, revealing intriguing insights into crystallite size and phase transformations [22].
Kaolinite
In the K1, diffraction peaks, FWHM values, and crystallite sizes were determined for each peak, resulting in an average crystallite size of 15.42 nm for the entire composition. Similarly, detailed data on diffraction peaks, FWHM values, and crystallite sizes for K2 and K3 compositions were analyzed. Quantitative analysis employed Rietveld refinement, with FWHM values utilized in the Scherrer formula to calculate crystallite sizes in the Kaolinite phase. Remarkably, a higher percentage of kaolin correlated with larger crystallite sizes, notably seen in the K3 composition with a significant size of approximately 16.63 nm. Mechanical milling during the mixing process revealed that composition variations, particularly in kaolin percentage, led to discernible changes in crystallite size. Subsequent sintering at 1280 °C for 8 hours induced significant transformations. The diffraction peak corresponding to the Kaolinite phase at 12.39° disappeared in XRD patterns of compositions K1S, K2S, and K3S due to aluminum bond melting within the Al2Si2O5(OH)4 compound at 660 °C. The absence of the Kaolinite phase post-sintering underscored the structural changes induced by thermal treatment. Overall, these detailed XRD results and subsequent analyses offer comprehensive insights into the crystalline properties and behavior of Kaolinite compositions under diverse conditions, enhancing understanding of their structural evolution [14].
XRF Analysis
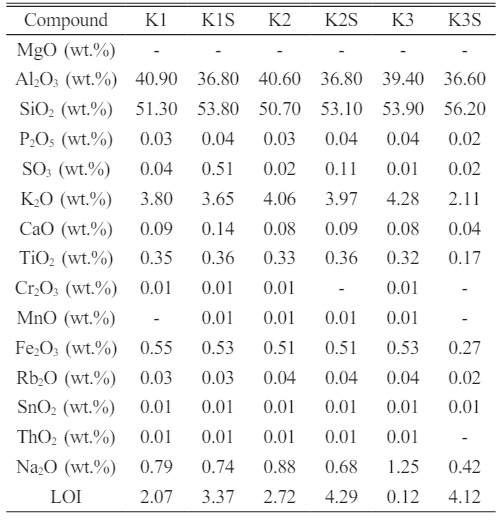
The X-ray Fluorescence (XRF) analysis conducted on composite samples, both before (K1, K2, K3) and after sintering (K1S, K2S, K3S), offers valuable insights into their elemental composition. In the pre-sintered state, K1 exhibits predominant elements such as Al2O3 (40.90%), SiO2 (51.30%), and K2O (3.80%), with minimal impurities, notably Fe2O3 at 0.55%. Trace elements like Rb2O and SnO2 are also present. The Loss on Ignition (LOI) is recorded at 2.07%, indicating weight loss due to volatile substances. Following sintering, K1S shows a reduction in Al2O3 (36.8%) and a significant increase in SiO2 (53.8%), with a slight decrease in K2O (3.65%). The LOI notably increases to 3.37%, suggesting a higher loss of volatile substances post-sintering.
Similarly, K2 pre-sintering displays notable compositions, including Al2O3 (40.60%), SiO2 (50.70%), and K2O (4.06%), with Fe2O3 as the primary impurity (0.51%). Post-sintering, K2S experiences a reduction in Al2O3 (36.8%) and an increase in SiO2 (53.1%), alongside a slight decrease in K2O (3.97%). The LOI notably rises to 4.29%, indicating increased volatile substance loss during sintering.
In the case of K3 before sintering, Al2O3 (39.4%), SiO2 (53.9%), and K2O (4.28%) dominate, with trace elements present. Following sintering (K3S), there is a decrease in Al2O3 (36.6%) and an increase in SiO2 (56.2%), while K2O significantly decreases to 2.11%. Additional elements like SnO2 emerge, with traces of P2O5, SO3, and Rb2O. The LOI notably rises to 4.12%, indicating substantial volatile substance loss during sintering. These changes underscore the transformative effects of sintering on the materials’ elemental compositions, influencing their structural and chemical properties.
Furthermore, Table 7 highlights the elemental composition of composite samples, particularly relevant to porcelain insulators. SiO2 emerges as the predominant component, alongside significant quantities of Al2O3, K2O, and Na2O. It’s noted that, aside from Al2O3 and SiO2, other components don’t directly contribute to porcelain insulators’ mechanical strength [23]. Fe2O3, acting as an impurity, may impact material properties [24]. The increase in Al2O3 weight is suggested to enhance mechanical and thermal performance in alumina insulators, suggesting a positive correlation between Al2O3 weight and desirable insulator properties.
Effects of compositional variation on morphology
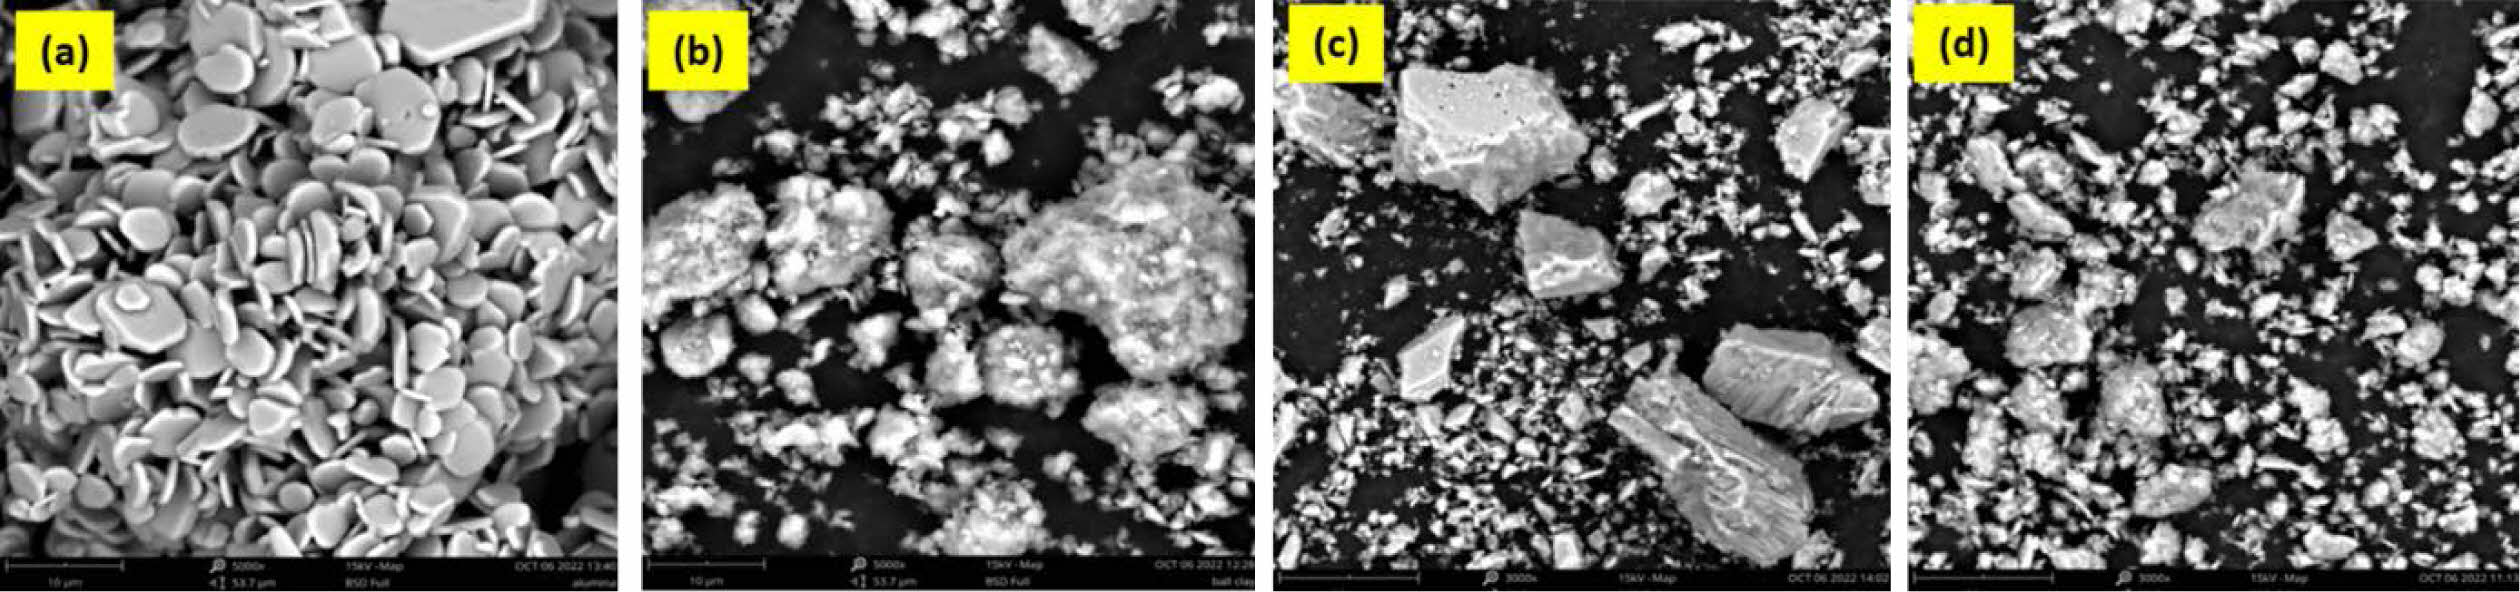
Scanning Electron Microscope (SEM) analysis reveals the morphological features of composite raw materials. Alumina, as observed, exhibits a distinctive morphology characterized by a collection of flat coins stacked atop one another, with some adopting the form of flat hexagonal crystal structure (Fig. 3a) [25, 26]. Ball clay forms irregular accumulations with fibrous surfaces (Fig. 3b), while feldspar exhibits large rocky lumps, highlighting its non-uniformity (Fig. 3c). Lastly, Fig. 3d illustrates the morphology of kaolin raw materials, which assumes the form of small, evenly distributed rock chunks. The uniform distribution of these rock chunks underscores the distinct morphology of kaolin within the composite [27].
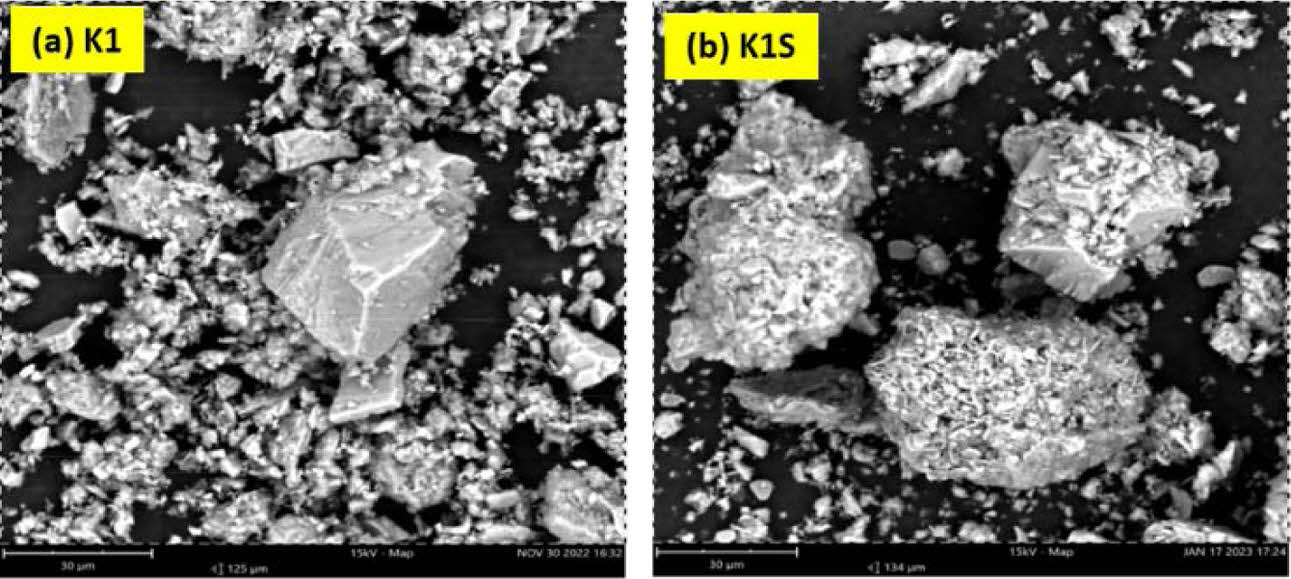
For porcelain ceramics production, raw materials like Alumina, Ballclay, Feldspar, and Kaolin undergo mechanical milling to ensure uniform mixing. Composition 1, with varying percentages of Alumina, Ballclay, Feldspar, and Kaolin (approx. 20%, 15%, 27.5%, and 37.5% respectively), undergoes morphological changes during milling. Kaolin displays small, uniform rock chunks, while Feldspar exhibits large ones. Ballclay dominates the upper part, and Alumina’s morphology is less distinct due to mingling with Kaolin (Fig. 4a). After sintering at 1280 °C, Alumina’s flat coins integrate uniformly with Feldspar’s large boulders [25]. Kaolin’s rock chunks enlarge, merging with Ballclay’s morphology. The kaolinite phase transforms into albite in Feldspar (Fig. 4b), showing seamless integration of Alumina with Feldspar and mutual amalgamation of Kaolin and Ballclay [14].
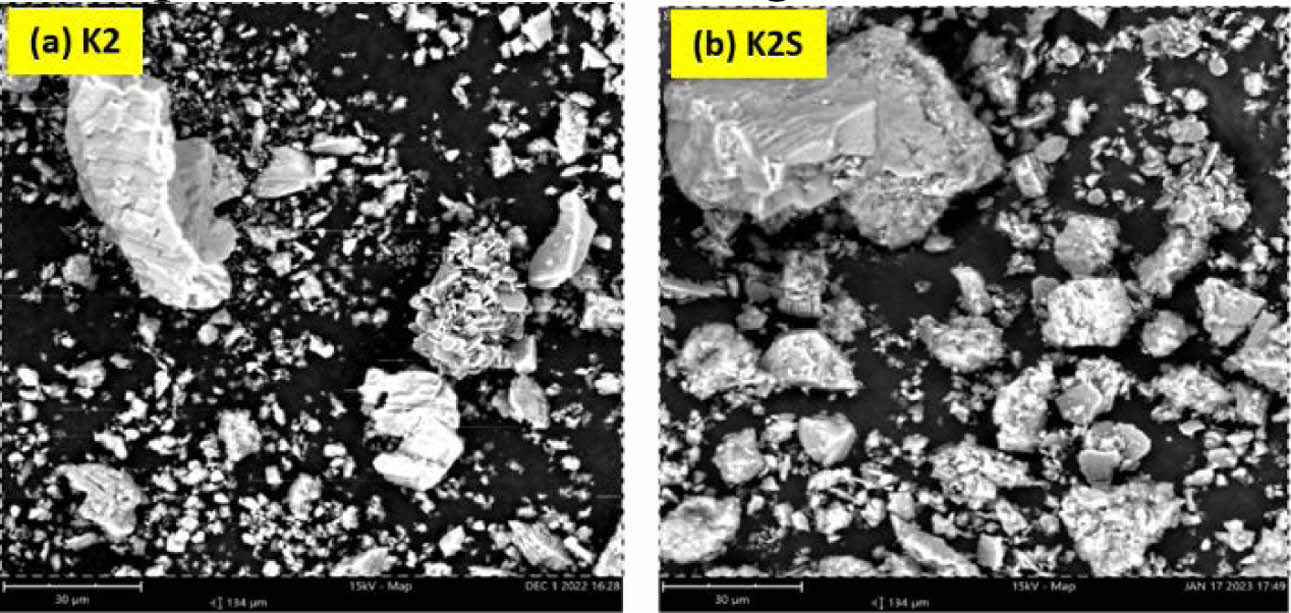
The morphology observed in Fig. 5a corresponds to the K2 composition, featuring a greater variation in feldspar composition, approximately 30%. Large chunks of rock are visible, followed by the morphology of alumina, which exhibits several pieces piled up and spread evenly, alongside small rocks representing the kaolin morphology. The ballclay morphology is not very prominent. After the sintering process, the kaolin morphology of the small rocks undergoes a clumping process, resulting in the even distribution of larger rocks [10]. The morphology of feldspar, characterized by relief lumps, becomes more pronounced, with only a small amount of alumina being substituted into the feldspar, as illustrated in Fig. 5b.
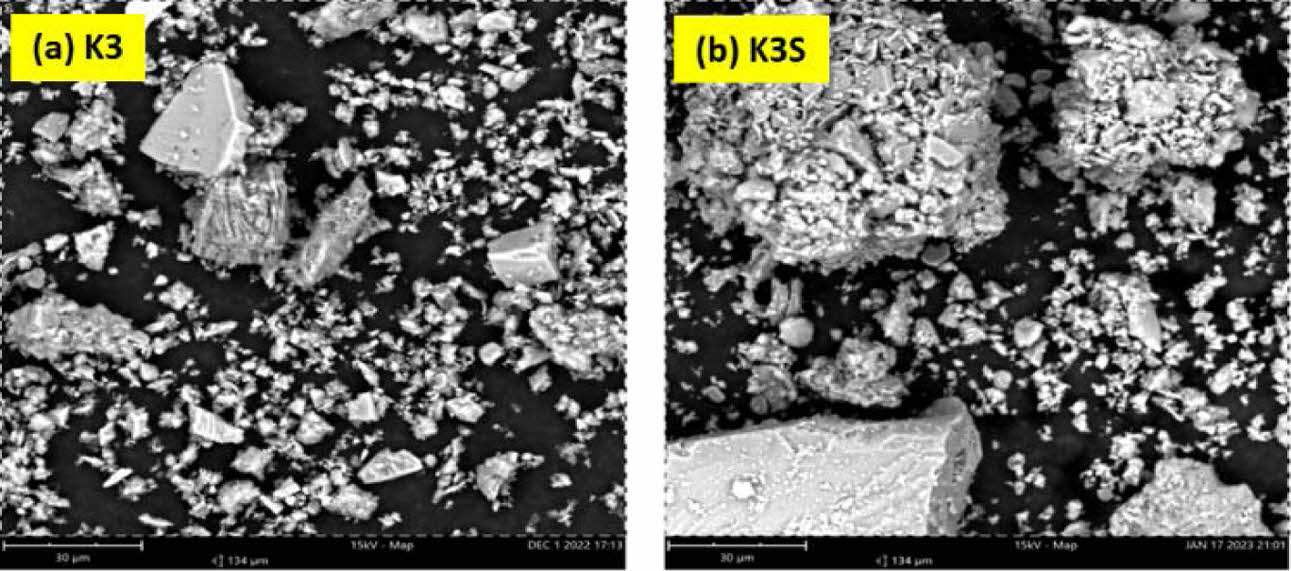
Figure 6a depicts kaolin’s morphology with a more uniform distribution, comprising 40% of the composite, while accompanying rock chunks represent feldspar, with alumina and ballclay morphologies less distinct. Upon sintering at 1280 °C, aluminum undergoes a phase change, binding with oxygen to form flat alumina pieces [28]. Fig. 6b illustrates stacked alumina pieces concealing feldspar chunks. Particularly in K3S composition, alumina’s delicate edges adopt feldspar-like characteristics, enhancing material strength and influencing electrical properties. Variations in composition, notably increased kaolin percentage, induce significant morphological shifts, affecting Al-O or Al and Na bonds and potentially altering porcelain ceramics properties [11].
Effect of composition variations on the electrical properties and strength of materials
Ceramics synthesis for electrical insulation involves varied compositions to influence both electrical properties
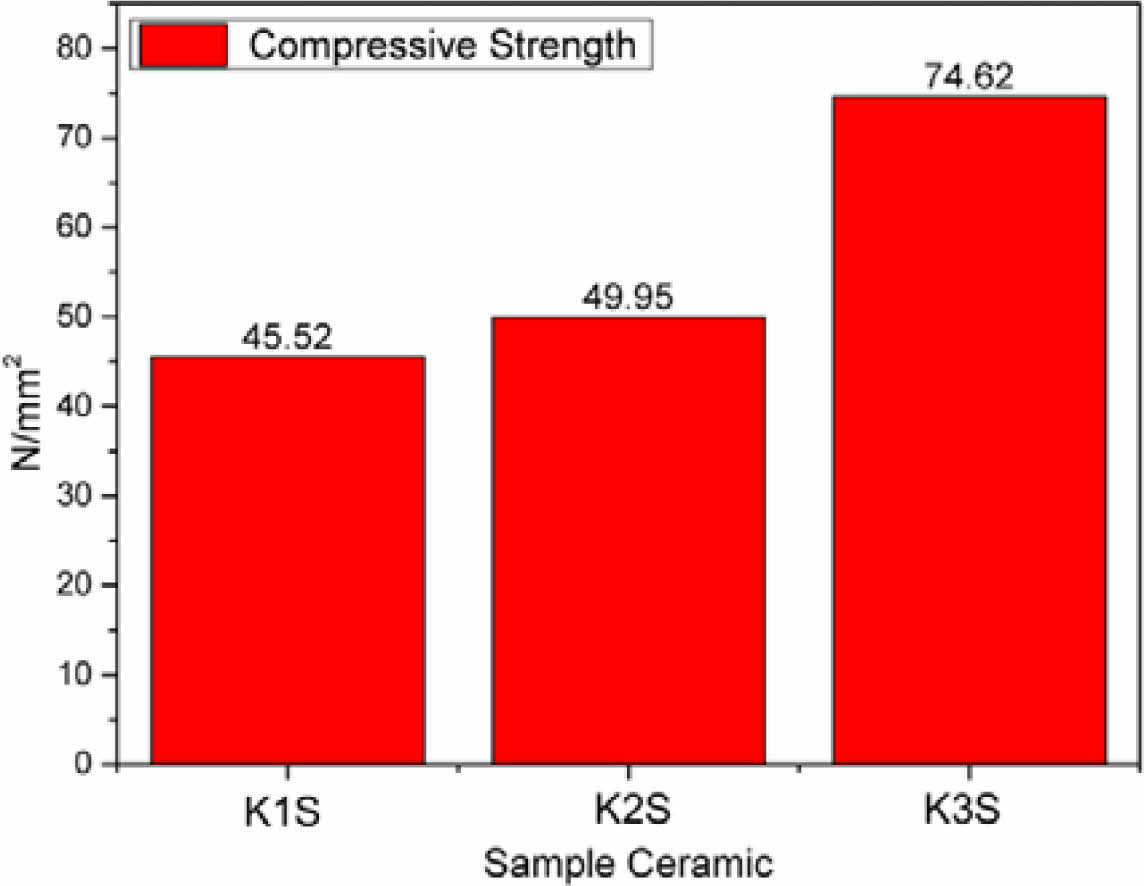
and material strength. Comparative analysis of compositions labeled K1, K2, and K3, along with their respective burned samples K1S, K2S, and K3S, reveals varying material strength properties. Notably, K3S demonstrates superior strength, reaching approximately 74.62 N/mm², surpassing other samples (Fig. 7). This strength is attributed to K3S’s composition, with a higher percentage of feldspar raw material, approximately 32.5%. Sintering feldspar at elevated temperatures strengthens bonds between Na atoms and Al, resulting in significant material strength enhancement [29]. This improvement correlates directly with the material’s hardness.
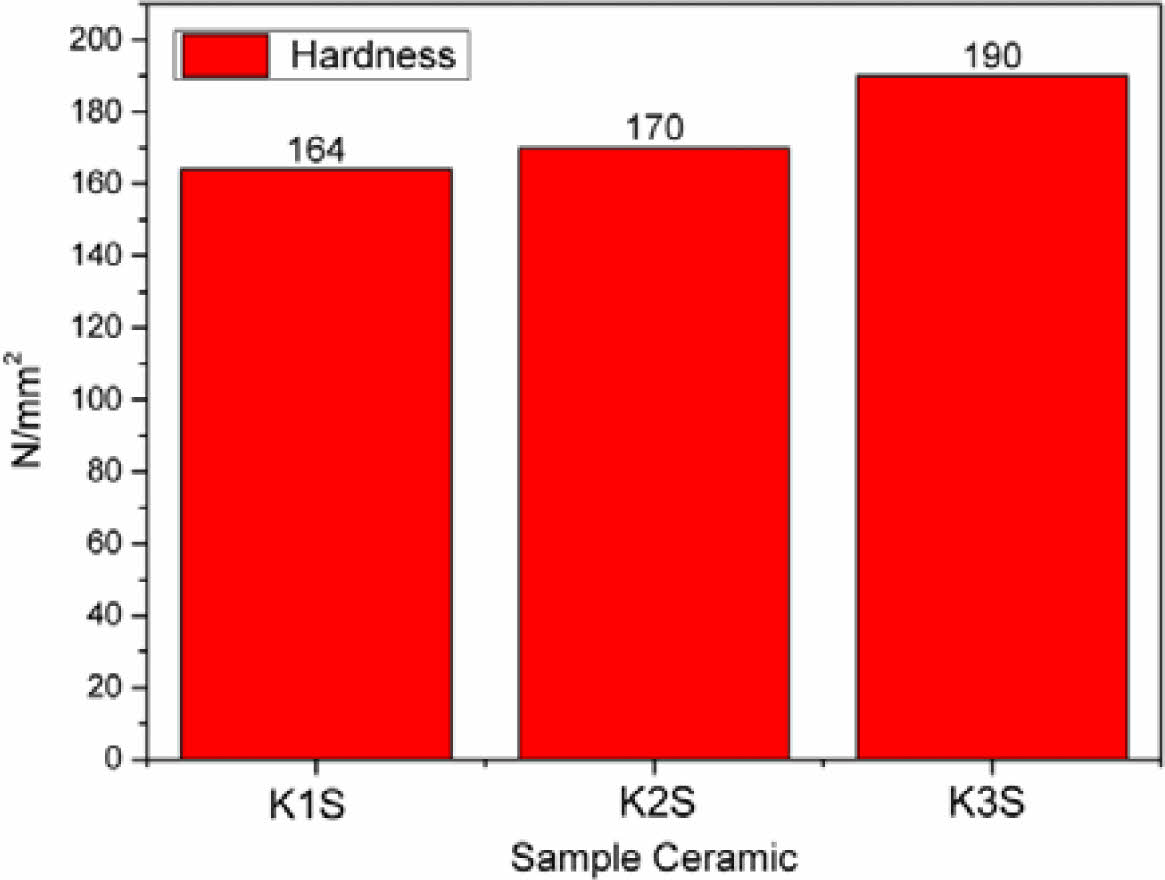
The material hardness properties of K3S are notably higher, approximately at 190 N/mm², as depicted in Fig. 8. This indicates that K3S exhibits superior material hardness properties compared to others, primarily due to the composition where the percentage of kaolin raw
material is approximately 40%, distinguishing it from other ceramic compositions. In the sintering process, kaolin, containing a kaolinite phase, undergoes treatment, leading to the melting of this phase into the feldspar phase, resulting in complete substitution. This process enhances the bonds between Al atoms and Na, contributing to the observed increase in material hardness [14].
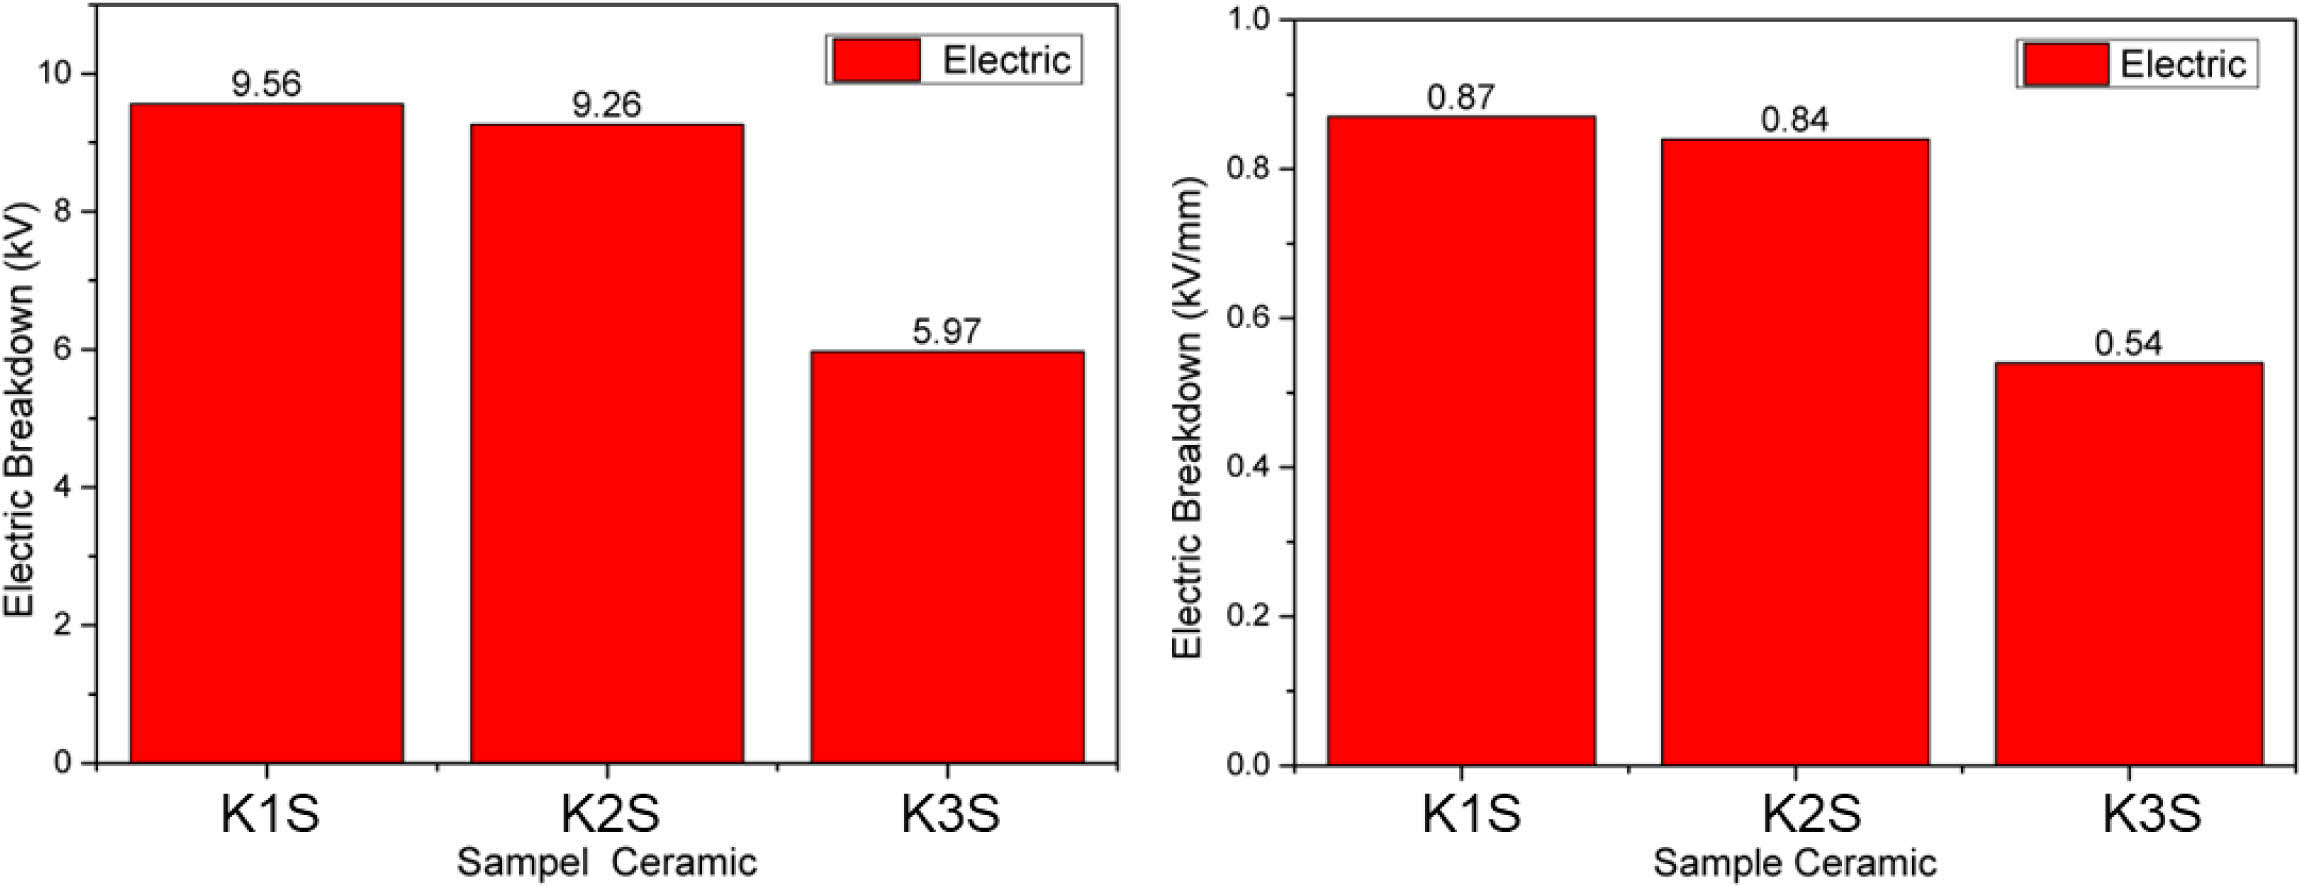
K3S exhibits hardness and strength properties but experiences a notable decrease in electrical properties, with surface electrical resistance dropping to about 5.97 kV (Fig. 9a). This indicates its reduced ability to withstand electric currents, crucial for insulating ceramics. Conversely, sample K1S displays higher surface resistance at approximately 9.56 kV, attributed to its higher alumina content (around 20%). Alumina forms robust Al bonds with oxygen, enhancing insulation efficacy. Moreover, K1S demonstrates superior current containment depth, about 0.87 kV/mm, compared to others (Fig. 9b). Raw material composition variations significantly impact strength, hardness, and electrical properties. Despite K3S’s strength and hardness, it withstands smaller electric currents compared to other samples [10].
The insulator, composed of corundum, quartz, microcline, and albite, undergoes a transformation from kaolinite to mullite, enhancing its thermal stability and mechanical strength for improved performance in electrical transmission systems. Additionally, changes in crystal size and morphology after sintering can strengthen electrical insulation and mechanical resistance. The results of hardness and strength tests, along with adequate electrical insulation capacity, indicate that the insulator is prepared to deliver reliable performance in electrical transmission systems [6].
Based on the findings of this study, the sintered composite infrastructure of local raw materials (K3S)
demonstrates notable strength and hardness as characteristics of Porcelain Alumina Ceramic Insulators (PACI). However, its electrical properties are comparatively lower than those of other local raw material composites. Despite this, the insulator remains suitable for specific locations. In Indonesia, over 4,700 rural areas still lack access to the national power grid, making the use of this insulator more efficient in supporting the development of electrical infrastructure in these regions. This efficiency is attributed to the relatively lower electrical demand in these areas. Furthermore, its outstanding physical properties contribute to maintaining the insulator’s durability over an extended period [30].
|
Fig. 1 The X-ray diffraction (XRD) results for both unsintered (red line) and sintered (black line) compositions, delineated as follows: (a) K1 and K1S; (b) K2 and K2S; (c) K3 and K3S. |
|
Fig. 2 Rietveld Refinement Analysis of XRD Patterns in and Unsintered (a, c, d) and Sintered (b, d, f) Composite Sample. |
|
Fig. 3 SEM results of raw materials (a) Alumina, (b) Ball clay, (c) Feldspar, and (d) Kaolin. |
|
Fig. 4 SEM results of the composition of K1 before sintering and K1S after sintering. |
|
Fig. 5 SEM results of the composition of K2 before sintering and K2S after sintering. |
|
Fig. 6 SEM results of the composition of K3 before sintering and K3S after sintering. |
|
Fig. 7 Material Strength Test Results on K1S, KS2 and K3S ceramic samples. |
|
Fig. 8 Material Hardness Test Results on K1S, K2S and K3S ceramic samples. |
|
Fig. 9 Electrical test results (a) surface section (b) depth section on K1S, K2S and K3S ceramic samples. |
|
Table 4 Percentage of phases in composition samples that have not been and have been sintered. |
|
Table 5 Rietveld refinement results of composite samples before and after sintering. |
|
Table 6 Size of Corundum, Quartz, Microcline, Albite and Kaolinite phase crystallites. |
In conclusion, comprehensive X-ray diffraction (XRD) analyses of ceramic samples (K1, K2, K3) before and after sintering (K1S, K2S, K3S) provided detailed insights into phase compositions, crystalline structures, and transformations induced by sintering. Unsintered samples displayed diverse phase proportions, with sintering universally increasing Corundum content, elevating Quartz and Microcline percentages, and establishing Albite dominance, particularly in K3S. The presence and subsequent absence of kaolinite in K1 highlighted its role in plasticity, while new feldspar-related peaks in K1S confirmed refinement. Quantitative XRD analysis demonstrated the influence of feldspar percentage on phase dominance, especially Albite post-sintering, revealing the dynamic interplay between composition, sintering conditions, and resulting crystalline structures in ceramic composites.
XRD pattern analysis of Quartz phases (K1, K2, K3) indicated changes in phase composition and crystallite size, illustrating the intricate relationship between phase stability and crystallite characteristics post-sintering. Microcline phases displayed increased stability and reduced crystallite size after sintering, reflecting the process’s impact on ceramic composite microcline phases. Compositional variations led to the emergence of the albite phase and a notable decrease in crystallite size post-sintering, highlighting transformative effects on crystalline structures.
SEM morphological analysis highlighted distinct characteristics of composite raw materials and their transformations after sintering, emphasizing the profound influence of composition on morphological shifts, shaping porcelain ceramics’ properties and performance. Investigation into electrical properties and material strength revealed composition-dependent influences, with K3S exhibiting superior material strength due to higher feldspar content, while K3S displayed heightened material hardness with increased kaolin percentage. However, this enhanced strength and hardness were accompanied by a decline in surface electrical properties, illustrating intricate relationships between raw material composition variations and resulting electrical and mechanical properties of ceramics. These findings significantly contribute to understanding complex interdependencies between composition, sintering processes, and ceramic material properties, offering valuable insights for potential applications across various fields.
The findings of this research unveil several promising avenues for further investigation in the field of Porcelain Alumina Ceramic Insulators (PACI), encompassing synthesis, characterization, and performance evaluation. One promising area for exploration is the optimization of PACI synthesis. Research efforts may delve into refining the synthesis process through variations in the composite composition of local raw materials such as Kaolin, Ball clay, Feldspar, and Alumina. Additionally, the optimization of particle size, including the consideration of nanoparticle integration, is essential for the development of robust insulators and maximizing the efficiency of their electrical properties.
- 1. I.F.U. Muzayanah, H.H. Lean, D. Hartono, K.D. Indraswari, and R. Partama, Heliyon. 8[9] (2022) e10634.
-

- 2. S.P. Kanugrahan and D.F. Hakam, Energies. 16[12] (2023) 4719.
-
- 3. M. Othman, M. Isa, M.N. Mazlee, M.A.M. Piah, and N. Abd. Rahman, in 2019 IEEE Student Conference on Research and Development (SCOReD), October 2019, (Institute of Electrical and Electronics Engineers, 2019) p. 86-89.
-
- 4. Subari, B.D. Erlangga, E. Maryani, and D.N. Arifin, Min. Miner. Depos. 15[3] (2021) 1-6.
- 5. J. Song, X. Yang, P. Chen, H. Xu, D. Luo, R. Liu, and Z. Lai, J. Ceram. Process. Res. 23[4] (2022) 409-414.
-
- 6. A. Merga, H.C.A. Murthy, E. Amare, K. Ahmed, and E. Bekele, Heliyon. 5[8] (2019) e02327.
-
- 7. A.M. Tullu, T.T. Terfasa, E.A. Zerfe, M. Tadese, E. Beyene, A.M. Abebe, and D.M. Adoshe, Heliyon. 8[2] (2022) e08922.
-
- 8. B. Ngayakamo and S.E. Park, Cerâmica. 64[372] (2018) 570-576.
-
- 9. J. Gunawan, D. Taufik, V. Takarini, and Z. Hasratinigsih, in IOP Conference Series: Materials Science and Engineering, July 2019, (IOP Publishing, 2019) p. 012030.
-
- 10. U.E. Ekpunobi, U.A. Onuigbo, I. Tabugbo, E. Amalu, C. Ihueze, C. Onu, P. Igbokwe, A. Ekpunobi, S. Agbo, and H. Oiora-Ilouno, Phys. Sci. Rev. 9[3] (2024) 1573-1583.
-
- 11. J.E. Contreras, J. Taha-Tijerina, J.F. López-Perales, F. Banda-Muñoz, L. Díaz-Tato, and E.A. Rodríguez, Mater. Chem. Phys. 263 (2021) 124389.
-
- 12. S.D. Yudanto, S.A. Chandra, R. Roberto, D.P. Utama, V.O. Herlina, and Lusiana. J. Ceram. Process. Res. 23[3] (2022) 287-291.
-
- 13. R.G. Frizzo, A. Zaccaron, V. de Souza Nandi, and A.M. Bernardin, J. Build. Eng. 31 (2020) 101432.
-
- 14. P.J. Sánchez-Soto, D. Eliche-Quesada, S. Martínez-Martínez, L. Pérez-Villarejo, and E. Garzón, Materials. 15[2] (2022) 583.
-
- 15. Y. Sawadogo, L. Zerbo, M. Sawadogo, M. Seynou, M. Gomina, and P. Blanchart, Results Mater. 6 (2020) 100085.
-
- 16. B.A. Logue and E. Manandhar, Talanta. 189 (2018) 527-533.
-
- 17. M. Yousaf, T. Iqbal, M.A. Hussain, A.N. Tabish, E.U. Haq, M.H. Siddiqi, S. Yasin, and H. Mahmood, Ceram. Int. 48[2] (2022) 1603-1610.
-
- 18. Savita, M. Jain, Manju, A. Vij, and A.Thakur, in AIP Conference Proceedings, April 2019, (AIP Publishing, 2019) p. 020024 (1-4).
-
- 19. H. Xie, F. Deng, H. Wang, and S. Han, Powder Technol. 378 (2021) 639-646.
-
- 20. V.C. Nwachukwu and S.A. Lawal, IOP Conf. Ser. Mater. Sci. Eng. 413 (2018) 012076.
-
- 21. F. Azarmi and A. Amiri, Ceram. Int. 45[1] (2019) 271-278.
-
- 22. A. Sanz, J. Bastida, A. Caballero, and M.A. Kojdecki, Appl. Clay Sci. 198 (2020) 105805.
-
- 23. J.J. Liang, Q.H. Lin, X. Zhang, T. Jin, Y.Z. Zhou, X.F. Sun, B.G. Choi, I.S. Kim, J.H. Do, and C.Y. Jo, J. Mater. Sci. Technol. 33[2] (2017) 204-209.
-
- 24. A. Andrews, S.K.Y. Gawu, and P.A. Olubambi, J. Ceram. Process. Res. 16[1] (2015) 37-40.
-
- 25. B.K. Park and C.S. Kim, J. Ceram. Process. Res. 8[5] (2007) 376-381.
-
- 26. W. Burger and G. Kiefer, J. Compos. Sci. 5[11] (2021) 306.
-
- 27. A.N.N. Dowuona, A. Yaya, E. Nyankson, J.K. Efavi, L.N.W. Damoah, D. Dodoo-Arhin, V. Apalangya, E. Annan, E.K. Tiburu, B. Onwona-Agyeman, and B. Tomiczek, J. Ceram. Process. Res. 19[2] (2018) 95-100.
-
- 28. M.L. Bella, M. Hamidouche, and L. Gremillard, Ceram. Int. 47[11] (2021) 16208-16220.
-
- 29. E. Beyene, S.N. Tiruneh, D.M. Andoshe, A.M. Abebe, and A.M. Tullu, Mater. Res. Express. 9[6] (2022) 065201.
-
- 30. R.N. Indah and A.D. Rarasati, in IOP Conference Series: Materials Science and Engineering, April 2020, (IOP Publishing, 2020) p. 022069.
-
 This Article
-
2024; 25(2): 306-315
Published on Apr 30, 2024
- 10.36410/jcpr.2024.25.2.306
- Received on Feb 21, 2024
- Revised on Mar 18, 2024
- Accepted on Mar 19, 2024
Services
Shared
Correspondence to
- W. Garinas
-
Mining Technology Research Center, National Research and Innovation Agency, Serpong, Indonesia
Tel : +62812 1908 3564 Fax: +6221-7592845 - E-mail: garinas64@gmail.com
Clean-Energy Research Institute(CRI), Hanyang University, 222, Wangsimni-ro, Seongdong-gu, Seoul, 04763, Korea
E-mail: jcpr@hanyang.ac.kr