- KCl flux-assisted CaTiO3: Pr3+ red phosphors for temperature sensing
Xin Liua, Xiuying Tiana,*, Huiyan Shenga, Changyan Jia, Zhi Huangb, Jin Wena, Hongxia Penga, Ling Zhua, Jing Lia, Ping Liuc, Yangxi Penga and Guowen Lid
aModern Industry School of Advanced Ceramics, Hunan Provincial Key Laboratory of Fine Ceramics and Powder Materials, School of Materials and Environmental Engineering, Hunan University of Humanities, Science and Technology, Loudi, Hunan, 417000, China
bNational Electronic Ceramic Product Quality Supervision and Inspection Center, Loudi, Hunan, 417000, China
cHunan Province Xinhua County Xinxing Electron Ceramics Co., Ltd., Xinhua, Hunan, 417000, China
dXinhua Shunda Electronic Ceramics Co., Ltd., Xinhua, Hunan, 417000, ChinaThis article is an open access article distributed under the terms of the Creative Commons Attribution Non-Commercial License (http://creativecommons.org/licenses/by-nc/4.0) which permits unrestricted non-commercial use, distribution, and reproduction in any medium, provided the original work is properly cited.
The red CaTiO3: Pr3+ phosphors were fabricated by employing a solid-state method using KCl flux, and investigated for temperature sensing. There were no structural changes observed with increasing KCl concentration, and no impurities were detected. The obtained crystal structure was identified as an orthorhombic perovskite, belonging to space group of Pnma(62). The typical sample exhibited spherical particles (1-2 μm). The optical bandgap of the sample was measured to be approximately 3.62 eV. Notably, when the KCl concentration reached 3%, the sample exhibited the highest photoluminescence intensity, indicating excellent crystallization strength. They closely resembled the chromaticity coordinates of ideal red light based on CIE chromaticity diagram, and the color purity was determined to be 79.51%. Furthermore, the absolute sensitivity (Sa) was approximately as high as 0.148 K-1, while the relative sensitivity (Sr) reached approximately a high value of 6.57% K-1, which highlights the significant potential of optical thermometry.
Keywords: XRD, Calcium titanate, Praseodymium, Temperature sensing, KCl.
Over the past few decades, compared with rare earth free phosphors [1], the application of rare earth doped phosphors in white light-emitting diodes (w-LEDs) has made significant progress [2-4]. The w-LEDs have been considered as the cutting-edge illumination technology [5]. They have not only changed our way of life but also propelled the development of technology. Moreover, the use of LEDs with rare earth-doped phosphor for plant growth is a key component in plant factories [6]. The transparent polycrystalline phosphor ceramic plates (PCPs) have demonstrated their potential for use in high-brightness laser lighting [7]. However, this is just the tip of the iceberg for the potential applications such as lighting [3], display [8], agriculture [9], etc. Recently, scientists have begun to explore the new field of optical temperature measurement using rare earth doped phosphors, which can bring about far-reaching impacts.
As known, photoluminescence spectroscopy has emerged as a sensitive and versatile tool for temperature measurement [10] due to the unique spectral characteristics of rare earth doped phosphors, which are highly regarded because of long lifetimes, narrow emission peaks and high quantum yields [11]. In particular, Pr3+-doped materials have attracted significant attention due to the distinctive 4f2 electronic configuration of Pr3+ ions, making them highly intriguing for optical thermometry applications [12].
Recently, CaTiO3 has been explored for using as a host for rare-earth ion doping to achieve temperature sensing based on luminesce intensity ratio (LIR) [13, 14]. Herein, The luminescence intensity ratio (LIR) method relies on temperature-dependent thermal coupling levels [15]. It has the characteristics of no spectral loss, accuracy and non-contact thermometry [13]. The temperature sensitivity can be restricted due to the effective energy separation (200-2000 cm-1) of the thermal coupling levels. In general, it can be accepted that energy separation is less than 2000 cm-1, which indicates that the highest Sr value does not exceed a certain threshold of 2878/T2 [15]. The LIR thermometry is based on the interaction between non-thermal coupling levels to overcome the above disadvantages. This LIR thermometry is intended to be constructed by using trap emission and the emission peak of Pr3+. Recently, CaMoO4:Pr3+ thermochromic phosphors with diverse thermal responses for temperature sensing by the above method has been reported by our research group [15]. As known, the enhanced emission intensity of Pr3+ can reduce the signal-to-noise ratio, and improve the thermometry sensitivity. Therefore, the flux-assisted solid-state reaction for synthesizing rare earth doped phosphors is a good approach for enhancing emission. Recently, the fluxes like H3BO3 [16], SiO2 [17, 18], CaF2 [19], Lu2O3 [20], KCl [21], NH4Cl [22], etc. can enhance emission intensity of phosphors. Herein, compared to other fluxes, KCl flux has several advantages, including a lower melting point (1043 K) [23], higher solubility, higher crystallization strength and reduced crystal defects, and simpler equipment and processes. Therefore, we report the preparation of KCl flux assisted CaTiO3:Pr3+ luminescent thermometer powders and their application for LIR thermometry. It is expected that the photoluminescence intensity and temperature sensitivity of CaTiO3:Pr3+ will be enhanced by the addition of KCl flux.
In this study, KCl flux-assisted CaTiO3:Pr3+ powders were obtained by employing a solid-state reaction method. The sample of CaTiO3:Pr3+ powder exhibited a narrow emission peak at 614 nm under the excitation wavelength of 330 nm. By comparing the broad peak centered at around 370 nm with the narrow peak at 614 nm, it was observable that one broad band is insensitive to temperature, while the other narrow peak is more sensitive to temperature. Therefore, it is possible to construct an intensity ratio for temperature measurement. Therefore, KCl flux-assisted CaTiO3:Pr3+ powders were used for LIR thermometry over a wide temperature range.
Materials and agents
The materials and agents employed in this study consist of CaTiO3 (calcium titanate, AR), TiO2 (titanium dioxide, AR), Pr6O11 (praseodymium oxide, 99.99%) and a flux agent, KCl (potassium chloride, AR). CaTiO3 was sourced from Sinopharm Chemical Reagent Co., Ltd. TiO2 was obtained from Macklin Reagent Co., Ltd. Similarly, the Pr6O11, KCl and ethanol agent were purchased from Macklin Reagent Co., Ltd., ensuring consistency and reliability in the experimental process.
Preparation process
KCl flux assisted CaTiO3: 0.6%Pr3+ samples were fabricated by utilizing a solid-state reaction method. Firstly, CaTiO3, TiO2, Pr6O11, and KCl flux agent were weighed in stoichiometric amounts and thoroughly ground and mixed in an agate mortar. The resulting mixture was then placed into an alumina crucible and heated at 1073 K for 100 min, followed by a gradual heating rate of 4 K/min reaching the desired temperature of 1300 °C. The crucible was then maintained at 1573 K in air for 2 h to ensure complete reaction and crystallization. After cooling to room temperature, the obtained samples were ground again for 10 min and kept for testing purposes. In this study, CaTiO3: 0.6%Pr3+ was added by using different concentration of KCl flux. Herein, nKCl:nCaTiO3 is 0.01, 0.02, 0.03 and 0.04, according to their molar ratio, which were denoted by CaTiO3: 0.6%Pr3+ +xKCl (x=1%, 2%, 3% and 4%).
Characterization
X-ray diffraction (XRD) patterns were derived from TD-3500 X-ray diffractometer (China, Dandong), to analyze the crystal structure and phase composition. The surface morphologies of samples were examined utilizing EM-30 Plus scanning electron microscopy (SEM, Korea, COXEM). Energy-dispersive X-ray spectroscopy (EDS) mapping was utilized in order to explore the elemental distribution on the sample surface, utilizing an Oxford EDS system. Ultraviolet-visible (UV-vis) diffuse reflectance spectra were carried out using a Shimadzu UV-2700 Spectrophotometer to examine light absorption and bandgap properties of samples. At room temperature, fluorescence spectra were recorded using a Hitachi F-7000 Fluorescence Spectrophotometer. The temperature-dependent photoluminescence spectra were measured using a temperature control system from Orient KOJI Instrument Co., Ltd. in China.
XRD
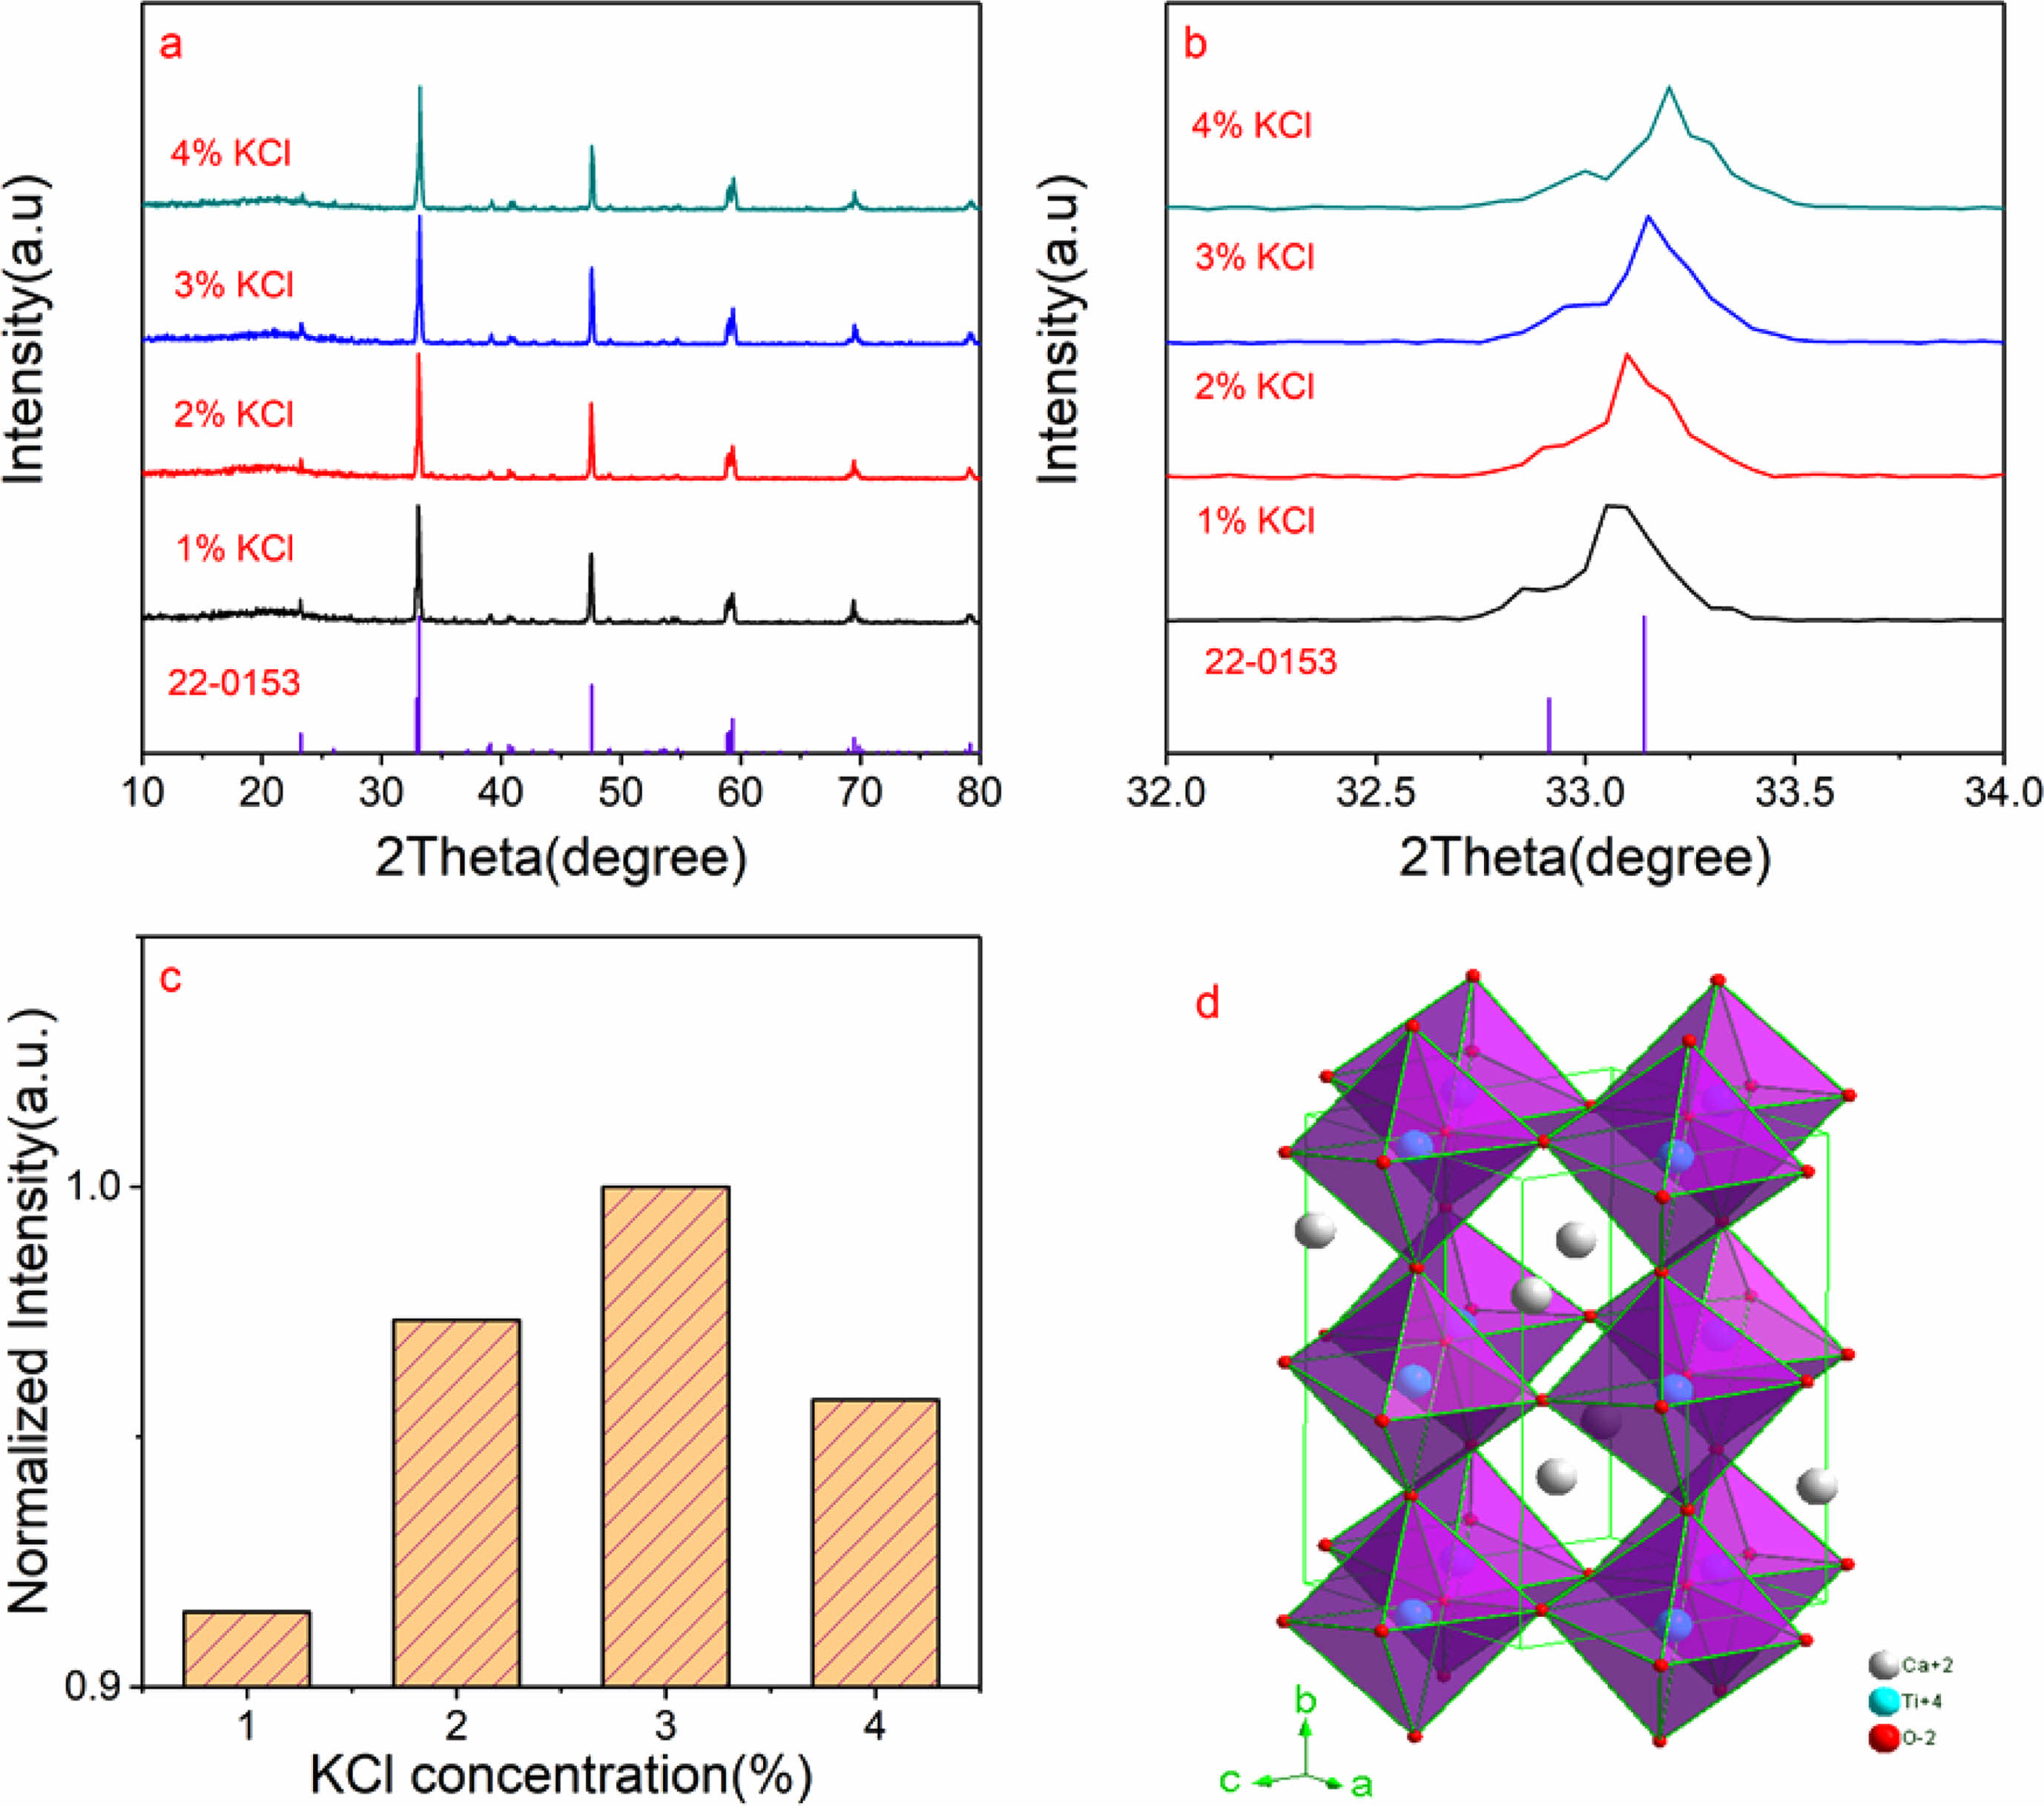
XRD is a widely used technique for phase identification. Fig. 1a shows XRD patterns of CaTiO3: 0.6%Pr3+ +xKCl (x=1%, 2%, 3% and 4%). As shown in Fig. 1a, it is observable that the diffraction peak positions of samples are consistent with those of the standard reference card (PDF#22-0153), and no impurity peaks have been detected. This suggests that Pr3+ ions have successfully substituted the Ca2+ ions at the Ca2+ sites in the CaTiO3 host material, due to similar ionic radii of Pr3+ (1.30 Å) and Ca2+ ions (1.34 Å) when CN is 12 [24]. The crystal structure is not modified by the amount of KCl flux added. Fig. 2b displays the enlarged patterns of XRD in the range of 32-34o. As the amount of KCl increases, we observe a progressive displacement of the (121) diffraction peak towards higher angles.
When KCl is added, K+ ions enter the crystal structure of CaTiO3 by occupying the vacancies of Ca2+ ions. Due to the smaller ionic radii of K+ ions (1.33 Å), compared to Ca2+ ions (1.34 Å), the entry of K+ ions leaded to a decrease in the lattice constant. The decrease in lattice constant implies a shorter distance between lattice planes, causing a reduction in unit cell size. When the unit cell shrinks, the crystal structure of CaTiO3 undergoes changes, which are manifested by the shift of X-ray diffraction peaks towards higher angles. According to Bragg's law, a reduction in lattice size results in an increase in the diffraction angle of X-rays, causing the (121) diffraction peak to shift towards higher angles.
Fig. 1c shows the normalized intensity of diffraction peak (121) with different concentrations of KCl flux. As the flux KCl increases, the normalized intensity of the (121) diffraction peak exhibits an initial increase, followed by a decrease. As the amount of the KCl flux increases, it may affect the diffusion rate of calcium and titanium ions in the crystal, which in turn affects the crystal growth and crystallization strength. Specifically, at low concentrations of KCl flux, it may promote crystal growth, resulting in an increase in crystallization strength. However, at high concentrations, excessive K+ ions can interfere with the crystal growth process, leading to a decrease in crystallization strength. A high host crystalline strength has benefits for luminescence. It means that the crystal structure is more robust, aiding in maintaining long-term stability and luminescence efficiency.
The crystal structure of CaTiO3 can be described as a perovskite structure, as shown in Fig.1d. It consists of tilted TiO6 octahedral units and Ca2+ ions located within the octahedral cavities. The titanium ions are centrally bonded to oxygen atoms forming octahedra, and the Ca2+ ions occupy the spaces between the octahedra. The CN of Ca2+ in CaTiO3 is 12, which means that Ca2+ ion is surrounded with 12 oxygen atoms in the crystal structure of CaTiO3.This arrangement results in a three-dimensional network of connected octahedra, giving CaTiO3 its characteristic crystal structure.
SEM
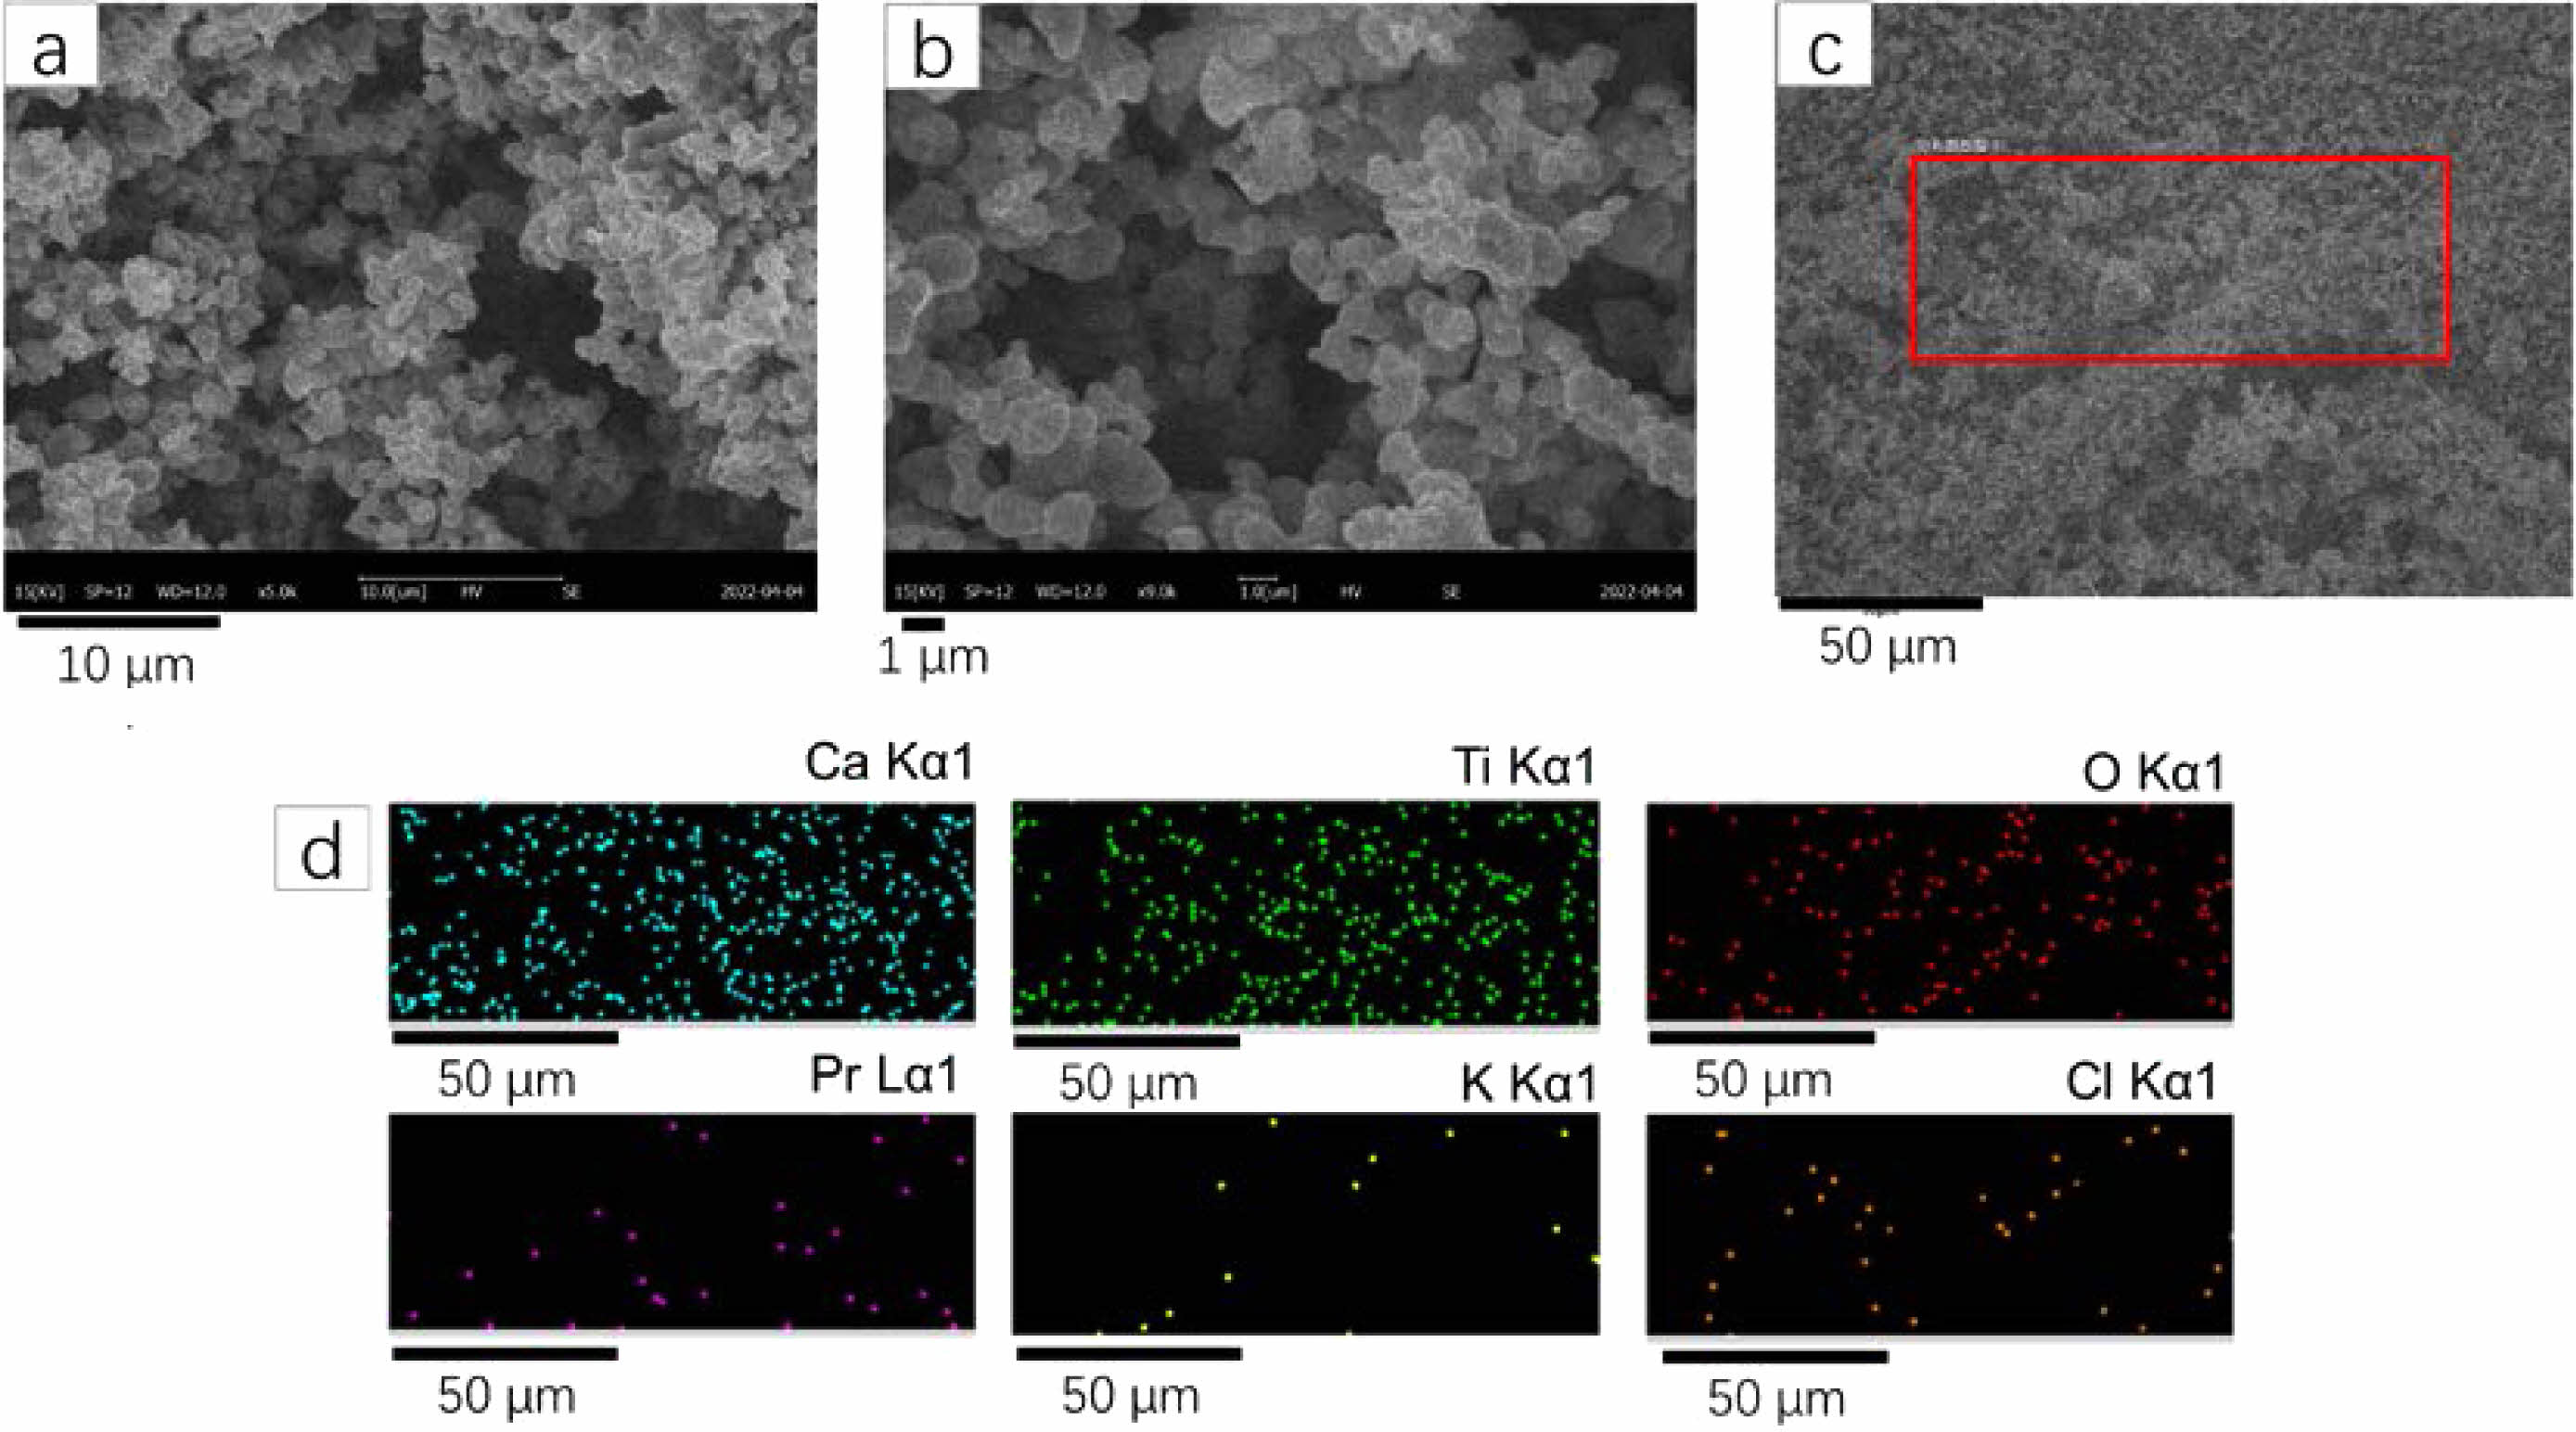
SEM can be used to help understand the composition and structure of sample. Fig. 2a and b show SEM images under different magnifications of CaTiO3: 0.6%Pr3++3%KCl. From the Fig. 2a and b, it is observable that CaTiO3:0.6%Pr3++3%KCl consists of spherical particles with some degree of aggregation. The particle size appears to be relatively uniform. The particle size is approximately 1-2 μm. Fig. 2c shows the SEM image with the scanning range of CaTiO3:0.6%Pr3++3%KCl, which is highlighted by red box. Fig. 2d shows the elements mapping images of Ca, Ti, O, Pr, K and Cl. It is found that this typical sample consists of Ca, Ti, and O, with small amounts of Pr, K, and Cl.
UV-vis diffuse reflectance spectra
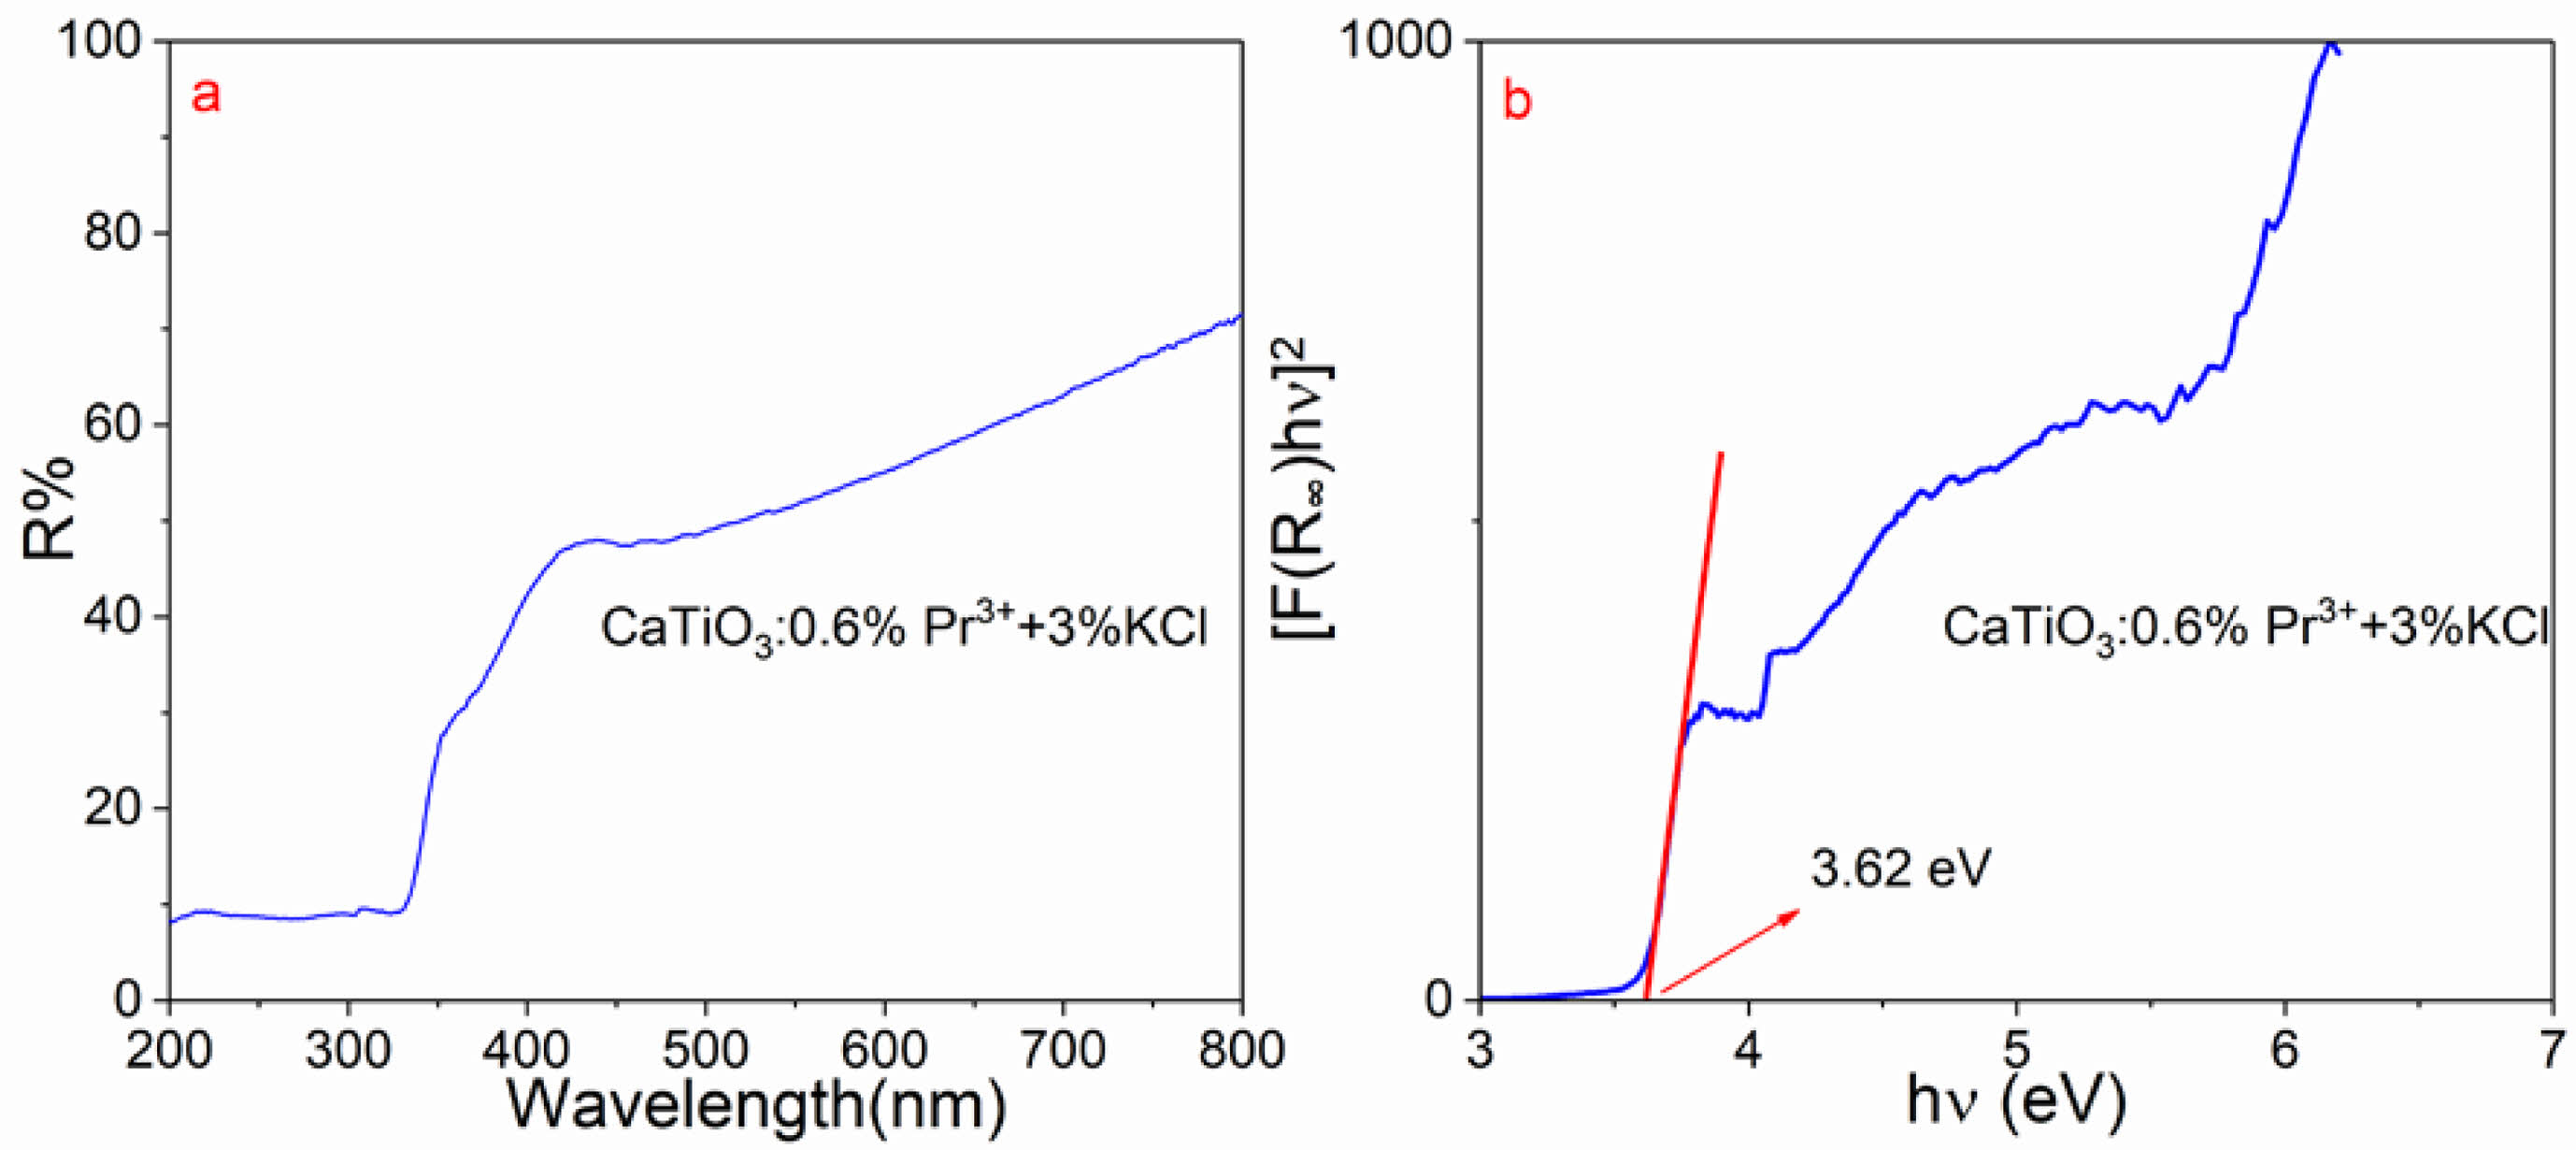
The bandgap calculation based on UV-vis diffuse reflectance spectra of CaTiO3:0.6%Pr3++3%KCl according to the relation of versus photon energy (hv) are shown in Fig. 3a and b. The sample had the strong absorption band 200~350 nm, attributed to the transition from the valence band to the conduction band and the transition of 4f→5d from Pr3+ ions. Then, the shoulder absorption of 360-400 nm is caused by intervalence charge transfer (IVCT) state, which can be denoted by the expression (Pr3+−O−Ti4+→Pr4+−O−Ti3+). Moreover, the weak peaks at ~455 nm ~476 nm ~495 are caused by 3H4→3P2, 3H4→3P1 and 3H4→3P0 transitions, respectively. According to Figure 3b, the plot illustrates the relationship between and . It is employed to evaluate the direct optical bandgap energy (Eg) of CaTiO3:0.6%Pr3++3%KCl. This was accomplished using the Kubelka–Munk (K–M) theory [25].
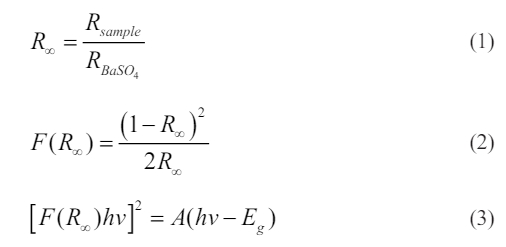
Herein, R∞ is the ratio of reflectance of the sample to BaSO4 and K–M function is denoted by F(R∞). Therefore, the bandgap value Eg of CaTiO3:0.6%Pr3++3%KCl is ~3.62 eV, which exhibits similarity to the values documented in the literature [13]. Moreover, bandgap is influenced by the crystallite and particle sizes, morphologies, and crystallinities of the samples [26, 27].
Photoluminescence analysis
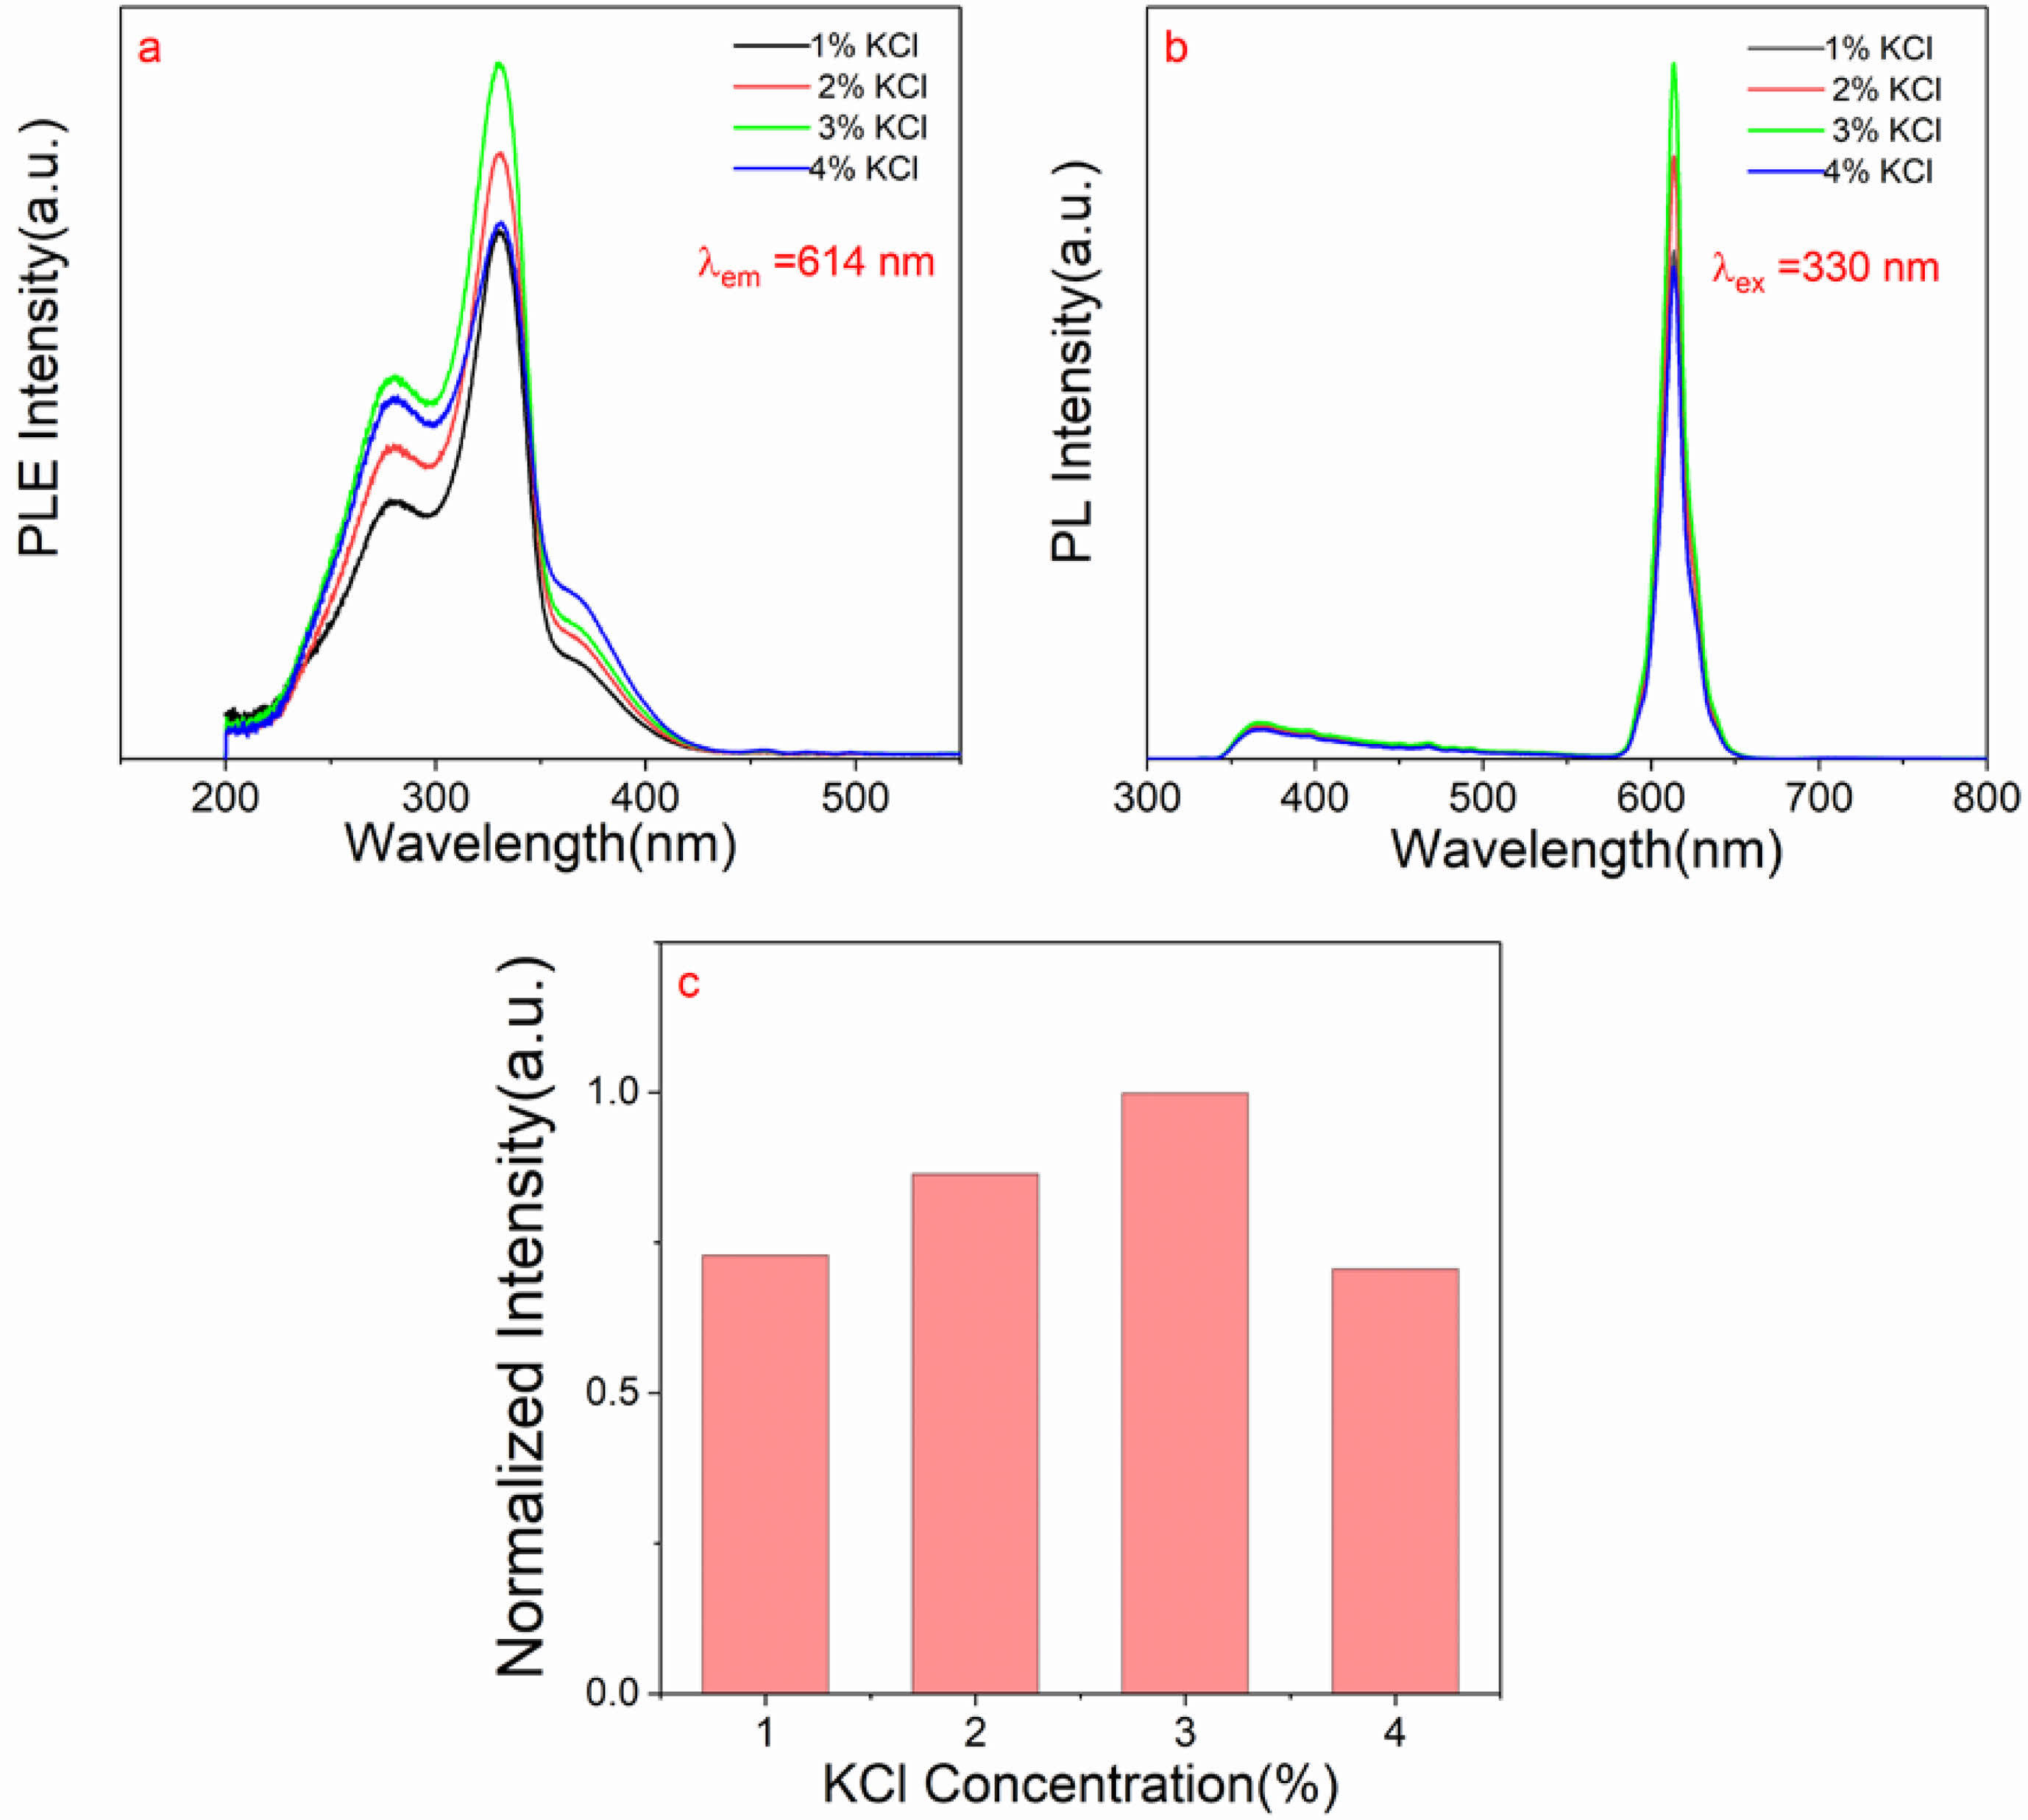
Fig. 4a shows the photoluminescence excitation spectra detected at 614 nm of CaTiO3: 0.6%Pr3++xKCl (x=1%, 2%, 3% and 4%)and Fig. 4b indicates photoluminescence spectra with λex = 330 nm of CaTiO3: 0.6%Pr3++xKCl (x=1%, 2%, 3% and 4%). The photoluminescence excitation spectrum of the samples reveals three typical peaks. The excitation peak at ~277 nm is caused by the 4f to 5d transition of Pr3+. The strong excitation peak at ~330 nm is caused by the transition from the valence band to the conduction band. The shoulder peak of 360-400 nm is caused by IVCT state [28]. The weak peak at ~455 nm is caused by 3H4→3P2 transition. Furthermore, the photoluminescence spectra show that the strong emission peak of 614 nm is caused by 1D2→3H4 transition. The broad band of 350-450 nm is caused by trap emission. Fig. 4c indicates normalized intensity of the characteristic peak (614 nm) of CaTiO3: 0.6%Pr3++xKCl (x=1%, 2%, 3% and 4%). The normalized intensity of the red emission peak (614 nm) exhibits an initial increase as the KCl concentration increases, followed by a subsequent decline. When the concentration of KCl is 3%, the photoluminescence intensity of the sample is strongest, which is attributed to good crystallinity and the robust crystal structure, which can reduce non-radiative transitions and enhance luminescence. These factors are crucial for optimizing the design and fabrication processes of luminescent materials. However, at high concentrations, excessive K+ ions can interfere with the crystal growth process, leading to a decrease in crystallization strength. Therefore, it can be explained that higher KCl concentration can quench the luminescence of Pr3+. A high degree of crystallinity in the host matrix means a more stable lattice structure. This stability aids in the distribution and immobilization of rare earth ions within the matrix, reducing non-radiative transition processes and enhancing luminescence intensity. Moreover, lattice vibrations are an important factor affecting the luminescence intensity of phosphors. A high degree of crystallinity in the host matrix can lower the energy of lattice vibrations, thereby reducing non-radiative transitions and increasing the probability of radiation transitions for rare earth ions. Furthermore, a high degree of crystallinity in the host matrix can provide a better environment, allowing rare earth ions to form a more stable local environment around them. This stable local environment helps to enhance the luminescence intensity of rare earth ions. In addition, host matrices with high crystallinity typically have a lower density of crystal defects. These defects may act as centers for non-radiative transitions, so reducing crystal defects can help minimize non-radiative transitions and improve luminescence intensity. Enhanced luminescence intensity improved signal-to-noise ratio and enhanced temperature sensing sensitivity. By reducing signal noise and enhancing optical signals, it is also possible to improve the signal-to-noise ratio and stability. However, it should be noted that the relationship between enhanced luminescence intensity and temperature sensing sensitivity may be influenced by many other factors, such as reaction mechanisms and background noise. Therefore, in practical applications, various factors need to be considered comprehensively to optimize the performance of temperature sensing technology.
Chromaticity diagram
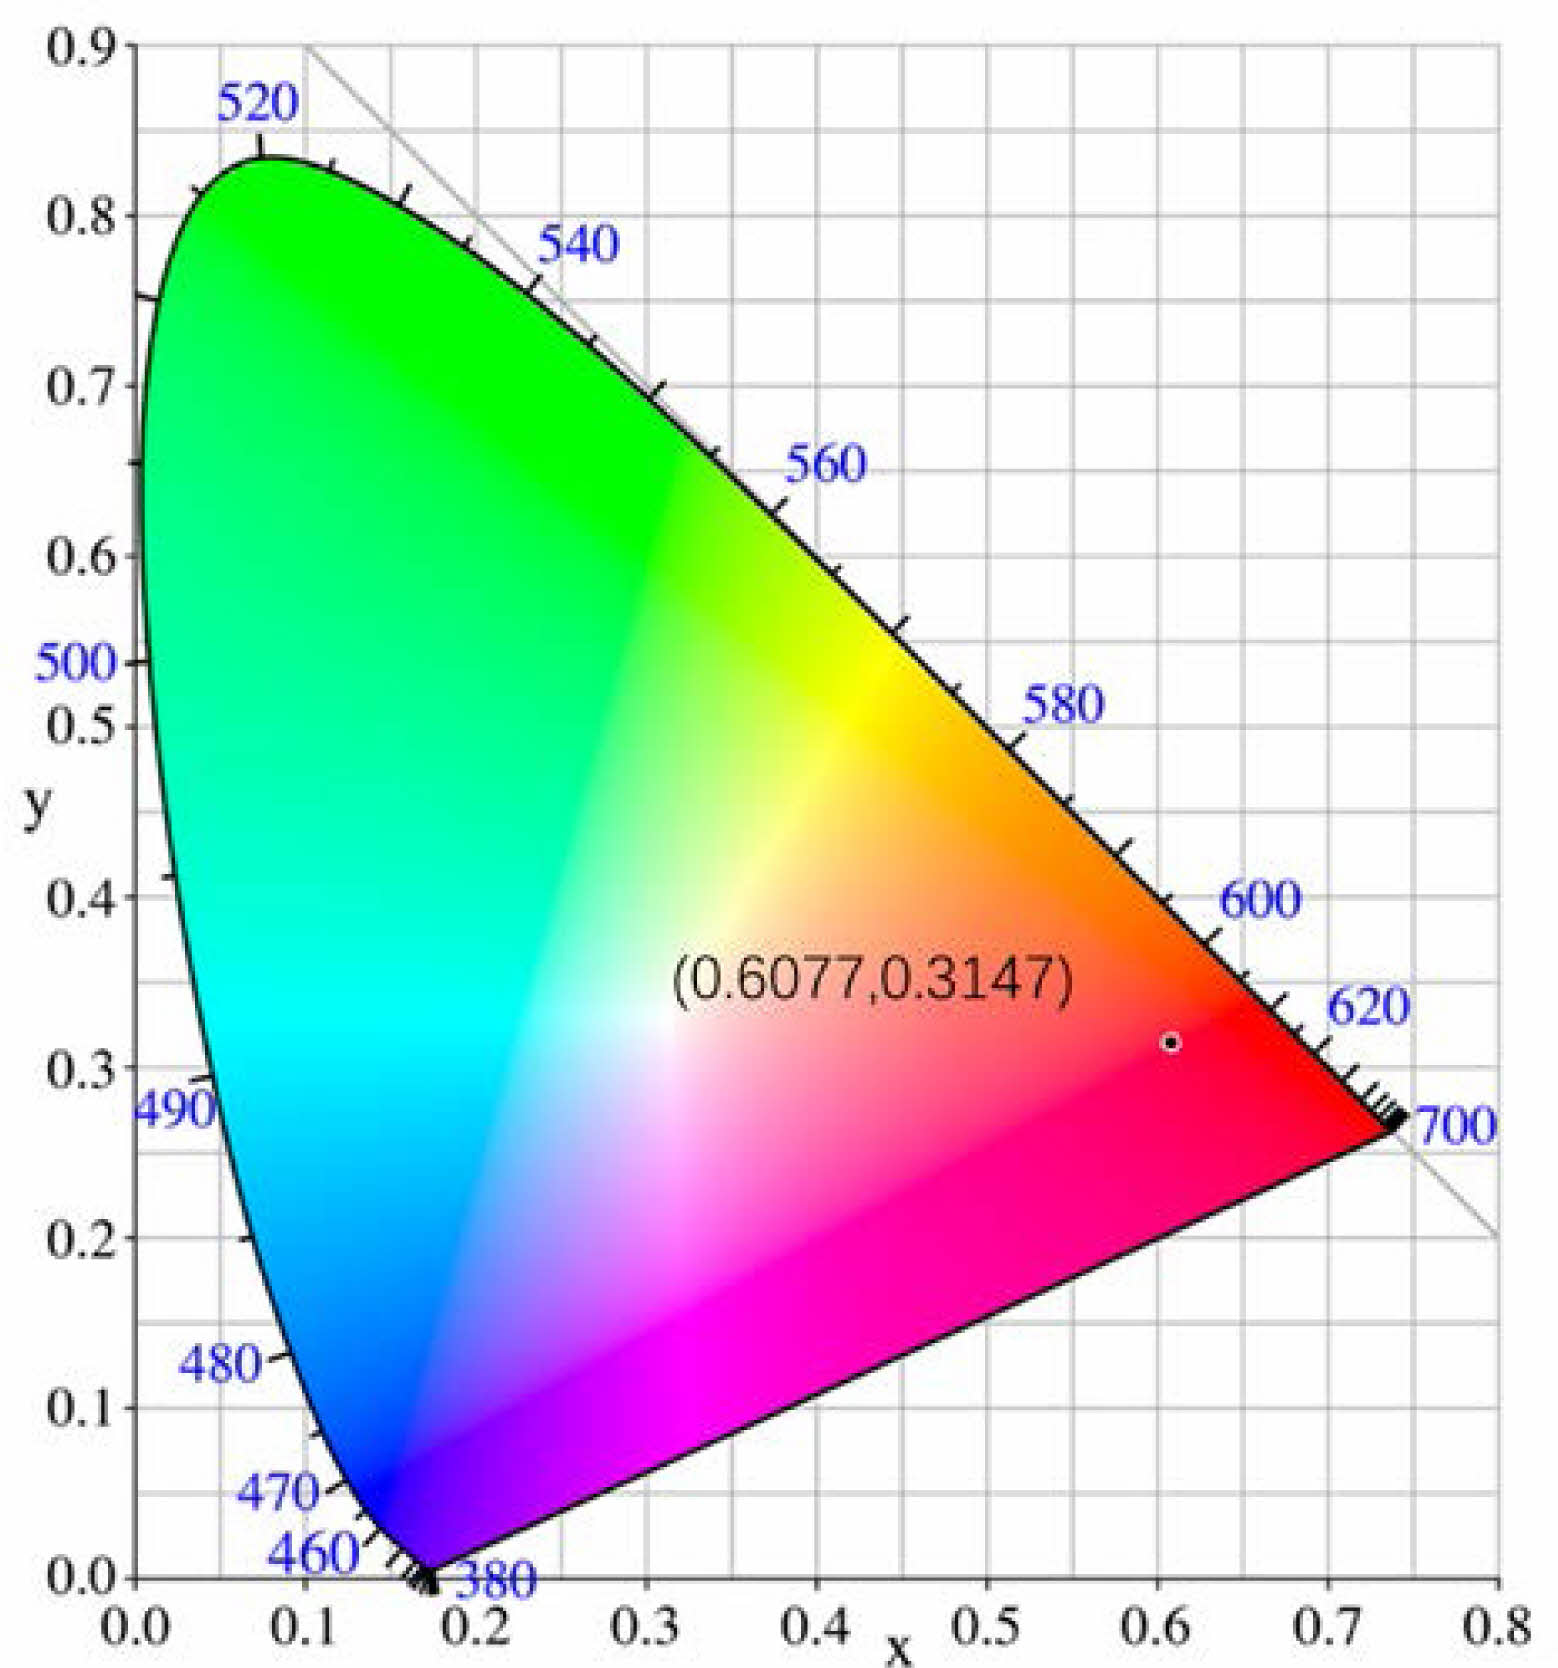
Fig. 5 displays the Commission Internationale De I′eclairage (CIE) coordinate of CaTiO3:0.6%Pr3++3%KCl. The coordinate (x, y) of CaTiO3:0.6%Pr3++3%KCl is (0.6077, 0.3147) according to the photoluminescence spectrum with λex = 330 nm and they are close to the coordinate (0.670, 0.330), which is from the ideal red light [29].
In order to evaluate its quality, the color purity of CaTiO3:0.6%Pr3++3%KCl can be calculated as Eq. (4)[30].

where (x, y) is the color coordinate, (xi, yi) is the CIE coordinate from white light and dominant wavelength (xd, yd) is (0.68, 0.32). The color purity of CaTiO3:0.6%Pr3++3%KCl according to photoluminescence spectrum excited by 330 nm is 79.51 %.
Temperature sensing
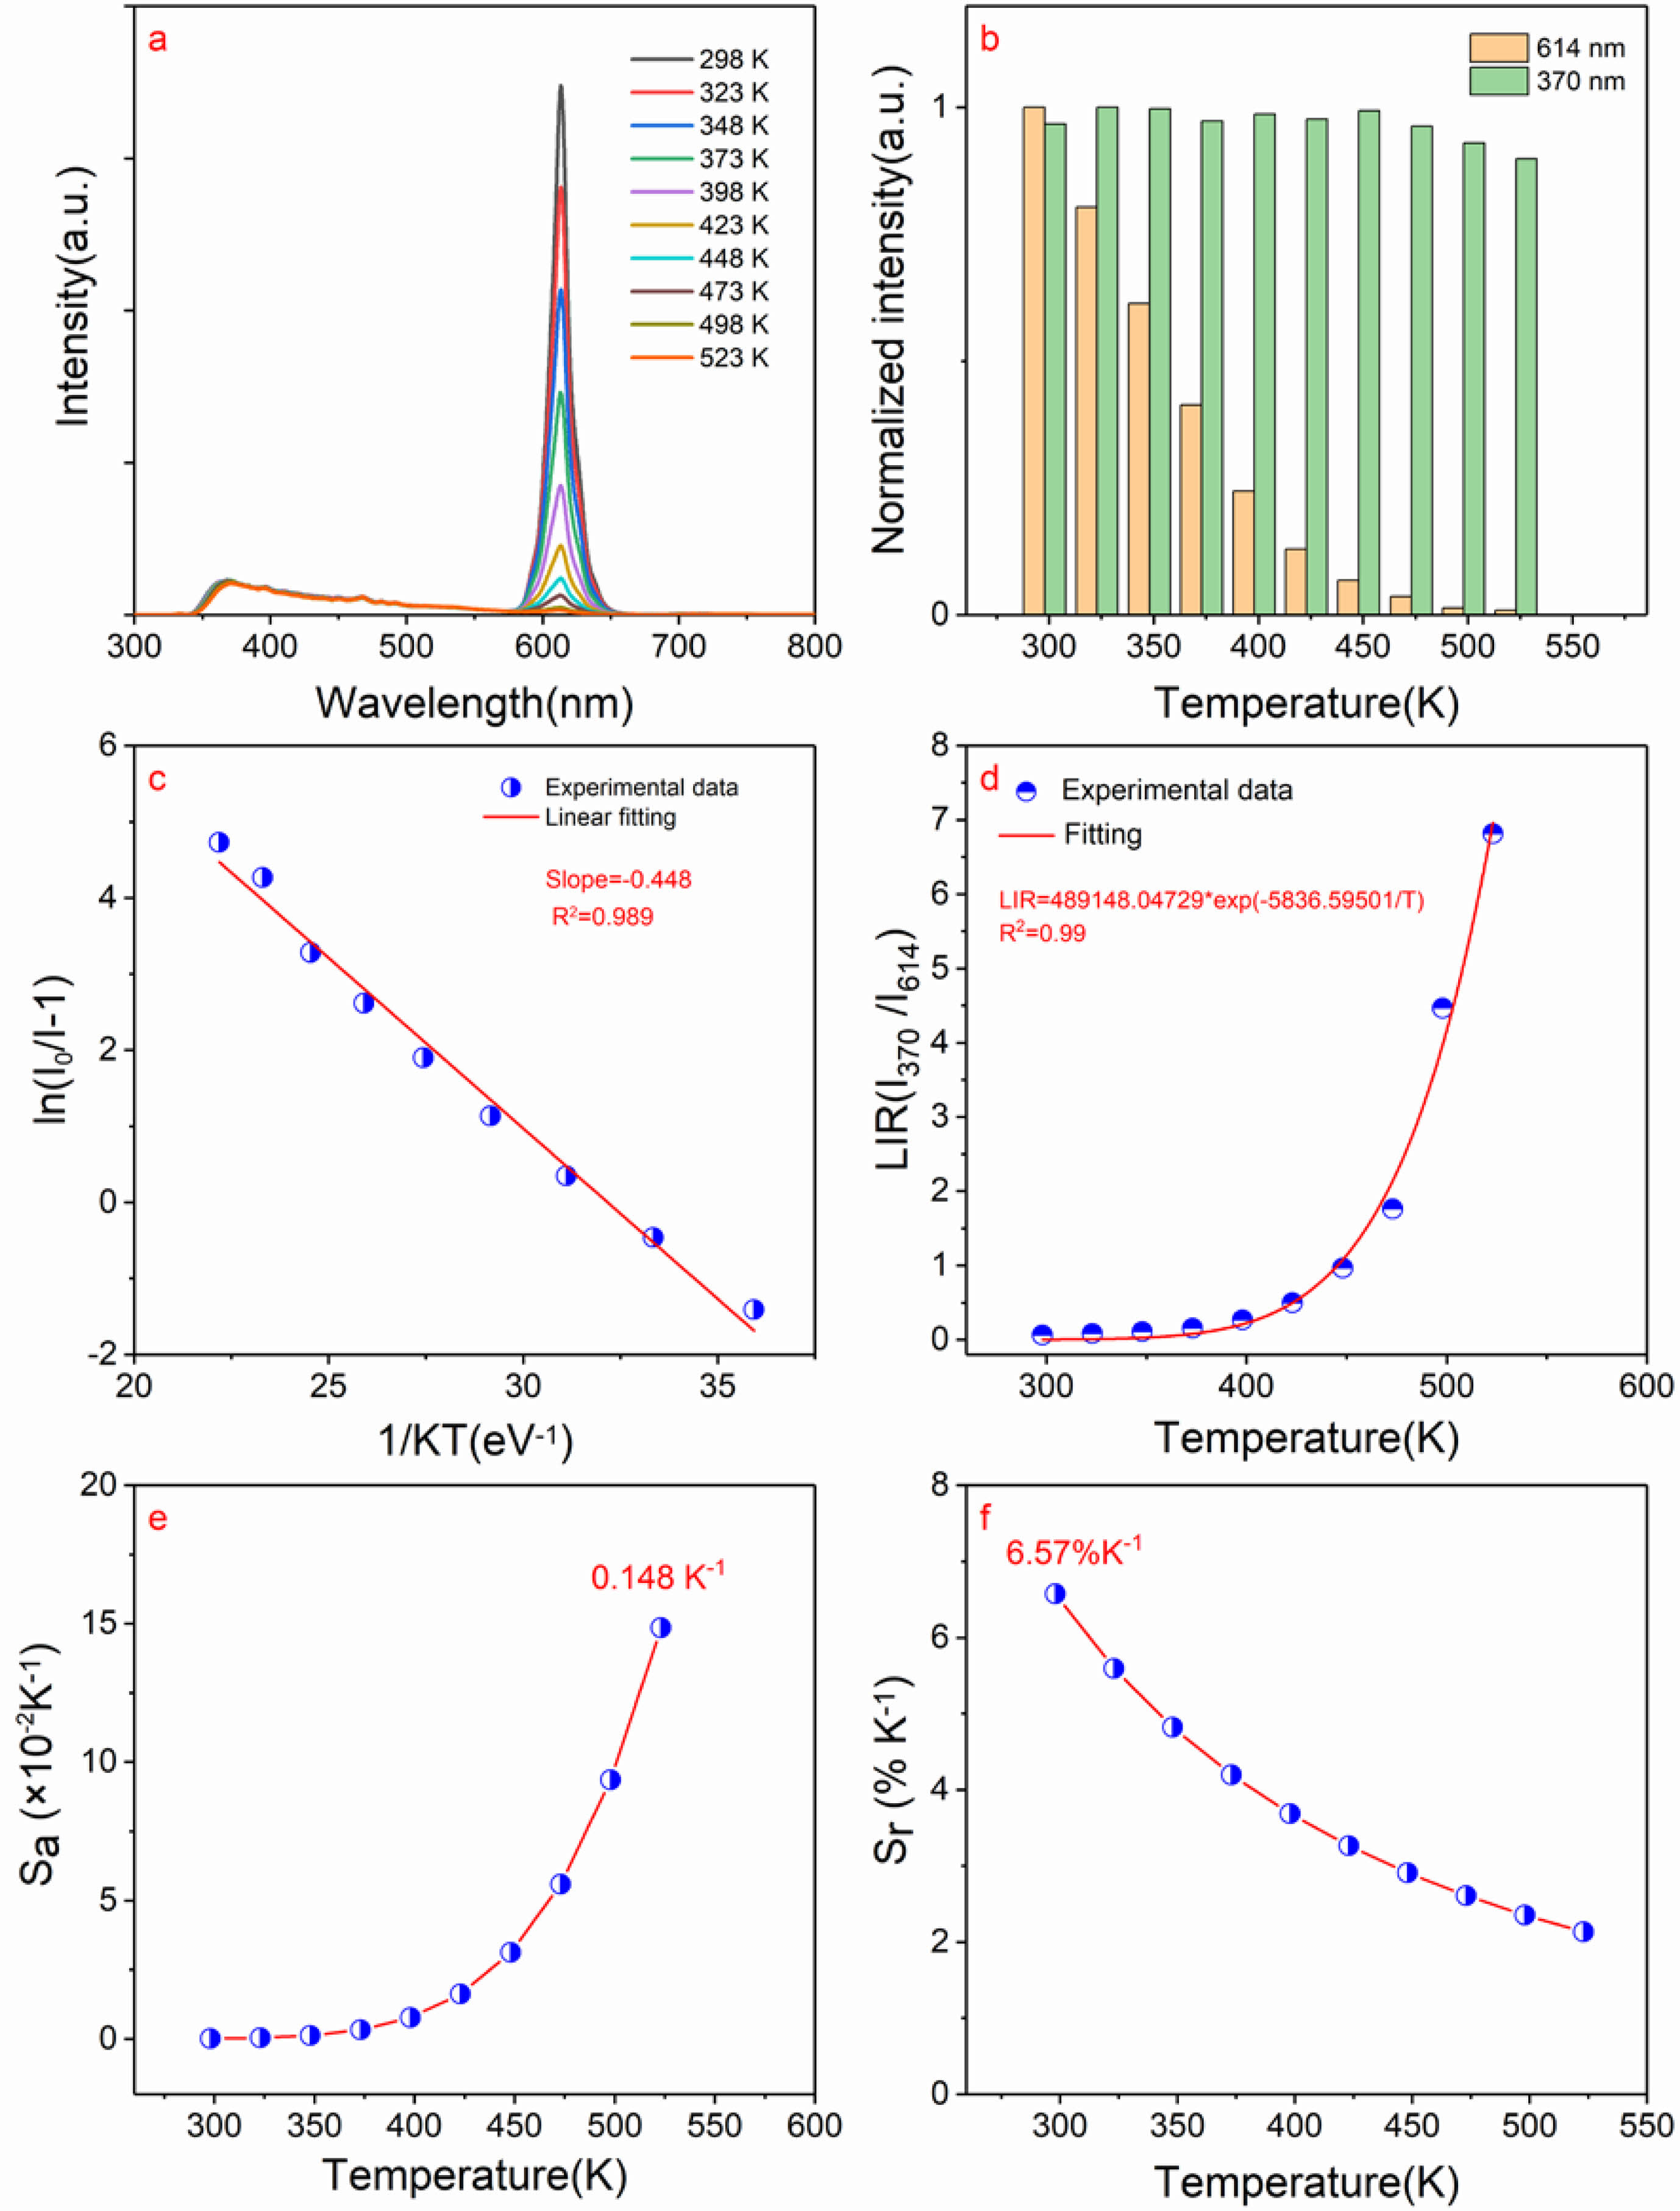
Fig. 6a shows the temperature-dependent photoluminescence spectra with excitation wavelength of 330 nm in 298-523 K for CaTiO3:0.6%Pr3++3%KCl with measurements taken at 25 K intervals. The dominant red peak of 614 nm was observed and caused by the 1D2→3H4 transition. Moreover, the broad weak band of 350-450 nm is caused by trap emission. Fig. 6b shows the normalized intensity of photoluminescence spectra of 614 nm and 370 nm with different temperatures. As the temperature is rising, the photoluminescence intensity measured at different temperatures gradually decreases, which is caused by the thermal quenching effect. However, a weak band at 370 nm attributed to trap emission remains little significant variation with increasing temperature. Moreover, to evaluate thermal quenching of the typical sample based on the peak at 614 nm, the important activation energy (Ea) is calculated by the linear fitting of ln(I0/I-1) versus 1/kT according to Eq. (5) [31], as shown in Fig. 6c.

Where I0 is the initial photoluminescence intensity at 298 K, I represents the photoluminescence intensity of 614 nm. Based on the linear fitting of ln(I0/I-1) versus 1/kT, the slope is found to be equal to -0.448, which can be denoted as −Ea. As a result, the activation energy (Ea) is approximately determined to be 0.448 eV. Herein, if the activation energy is expressed in wavenumbers, it is approximately 3613 cm-1, close to that (4000 cm-1)
of the reference [32]. Fig. 6d shows the relation of LIR values using the trap emission centered at 370 nm and the peak at 614 nm from 1D2→3H4 transition versus temperature. Clearly, this LIR is temperature-sensitive. Herein, LIR value of I370/I614 can be expressed by the following Eq. (6).

As shown in Fig. 6d, based on a nonlinear fitting of the experimental data, the value of DE/k is ~5836.6 K and energy gap DE is ~4056 cm-1, which is more than 2000 cm-1. Therefore, it can be seen that it is beneficial to improve the temperature sensitivity of measurement. The temperature sensitivity includes the absolute sensitivity (Sa) and relative sensitivity (Sr), as expressed in Eqs. (7-8).

Fig. 6e shows the relation of Sa versus the temperature. Its maximum value at 523 K is equal to ~0.148 K-1. Moreover, the value Sr of 5836.6/T2 is relatively high and Sr value at 298 K is as high as ~6.57% K-1, as depicted in Fig. 6f. The reported temperature sensitivity from Pr3+ doped luminescence materials based on LIR is shown in Table 1. By comparing Table 1, it can be concluded that the KCl flux assisted CaTiO3:Pr3+ red phosphors have broad prospects for temperature measurement applications.
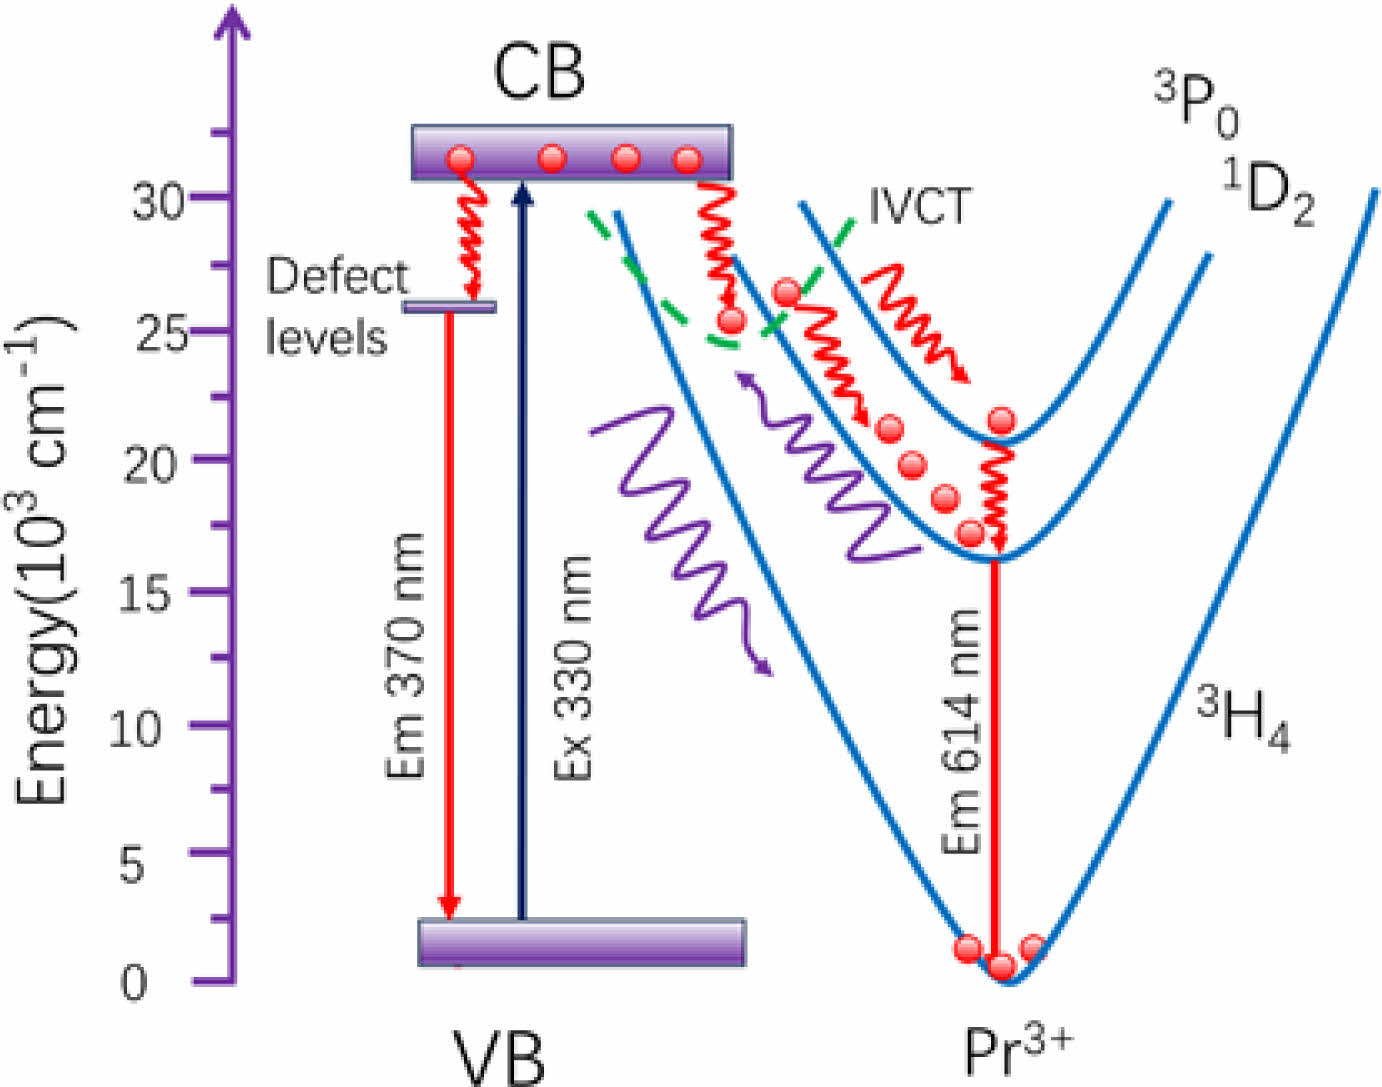
The luminescence of defects varies little with temperature, which is due to the inherent coupling mechanism between the point defects and the luminescence properties of the materials. Because this defect is inherent rather than external, the defect quantity and properties of the material do not change much even at different temperatures, so the trap emission properties are not sensitive to the change of temperature. Using the different thermal responses of peaks at 370 and 614 nm to temperature, the possible mechanism of constructing LIR for temperature measurement can be explained by the configuration coordinate, as shown in Fig. 7. When the sample is excited by 330 nm, electrons transition from valence band (VB) to conduction band (CB) and electrons can transition through the CB through non-radiative transition to intervalence charge transfer (IVCT) band, and then because the position of intersection of IVCT and 1D2 level is much lower than that of the intersection of IVCT and 3P0 level, it is in the form of non-radiative transition to 1D2 and emit light of 614 nm from 1D2→3H4 transition. In addition, the conduction band electrons can also jump to the defect energy level in the form of non-radiative transition and emit a wide emission centered at 370 nm. With the increase of temperature, the 1D2 emission becomes weaker and thermal quenching occurs, because the electrons can overcome the potential barrier and then return to the ground state 3H4 in the form of non-radiative transition.
In Pr3+ doped phosphors, the energy level position of Pr3+ needs to match the bandgap width (Eg) of the host material in order to achieve effective energy transfer and improve luminous efficiency. When the bandgap width of the host material is sufficiently large to accommodate the energy levels of Pr3+ ions, the energy transfer between the host and Pr3+ becomes more efficient, resulting in enhanced luminous efficiency and temperature sensitivities. The size of activation energy (Ea) represents the thermal stability of a phosphor. Generally, a larger activation energy indicates higher thermal stability and lower thermal quenching. Conversely, lower thermal stability results in higher thermal quenching. If the thermal stability of the phosphor is good, its emission intensity will decrease more slowly at high temperatures, making it suitable for measuring higher temperatures. However, it should be noted that if the thermal stability is too good, it may lead to reduced temperature sensitivity because the change in emission intensity is small and difficult to accurately measure temperature changes. On the other hand, if the thermal stability of the phosphor is poor, its emission intensity may decrease rapidly at high temperatures, which is advantageous for measuring lower temperatures. However, this can also result in reduced temperature sensitivity because the change in emission intensity is also small at low temperatures. Therefore, by properly designing and selecting the host material, the type and concentration of Pr3+ ions, and the choice of fluxing agent, it is possible to achieve effective control over luminous efficiency and temperature sensitivity.
|
Fig. 1 (a) XRD patterns of CaTiO3: 0.6%Pr3+ +xKCl (x=1%, 2%, 3% and 4%); (b) Enlarged XRD patterns in the range of 32-34o ; The normalized intensity of diffraction peak (121) with different concentrations of KCl flux; (d) The crystal structure of CaTiO3 host. |
|
Fig. 2 (a) SEM image under ×5000 magnification of CaTiO3:0.6%+3%KCl; (b) SEM image under ×9000 magnification of CaTiO3:0.6%+3%KCl; (c) SEM image with the scanning range (highlighted by red box) of CaTiO3:0.6%+3%KCl; (d) The elements mapping images of Ca, Ti, O, Pr, K and Cl of CaTiO3:0.6%Pr3++3%KCl. |
|
Fig. 3 (a) UV-vis diffuse reflectance spectrum and (b) Bandgap calculation of CaTiO3:0.6%Pr3++3%KCl. |
|
Fig. 4 (a) The photoluminescence excitation spectra with λem = 614 nm and (b) photoluminescence spectra with λex = 330 nm of CaTiO3: 0.6%Pr3++xKCl (x=1%,2%,3% and 4%); (c) Normalized intensity of the characteristic peak centered at 614 nm of CaTiO3: 0.6%Pr3++xKCl (x=1%, 2%, 3% and 4%) |
|
Fig. 5 CIE chromaticity coordinates of CaTiO3:0.6%Pr3++3%KCl. |
|
Fig. 6 a) The temperature-dependent photoluminescence spectra with λex = 330 nm in 298-523 K of CaTiO3:0.6%Pr3++3%KCl with measurements taken at 25 K intervals; (b) The normalized intensity of photoluminescence spectra of 614 nm and 370 nm versus temperature;(c) The linear fitting of ln(I0/I-1) versus 1/kT; (d) The relation of LIR values using the trap emission and 1 D2→3 H4 transitions versus temperature; (e). The relation of absolute sensitivity (Sa) versus temperature; (f) The relation of the relative sensitivity (Sr) versus temperature in 298-523 K |
|
Fig. 7 Configuration coordinate diagram. |
|
Table 1 Temperature sensitivity from Pr3+ doped luminescence materials based on LIR. |

KCl flux-assisted Pr3+ doped CaTiO3 red phosphor for temperature sensing was fabricated using solid-state reaction process. With the increase of KCl concentration, XRD patterns show that no structural changes have occurred and no impurity was found. The orthorhombic perovskite structure with Pnma(62) space group could be concluded. The typical sample consists of sphere-like particle of 1-2 μm. For the typical sample, optical bandgap was ~3.62 eV. When the concentration of KCl was 3%, the sample had the strongest photoluminescence intensity, due to high crystallization strength. The chromaticity coordinates closely resembled those of ideal red light, and the color purity was measured at 79.51%. the activation energy Ea was ~0.448 eV (~3613 cm-1) and energy gap DE is ~0.503 eV (~4056 cm-1). The maximal Sa value was ~0.148 K-1 and Sr is ~6.57% K-1, respectively, which had broad prospects in optical thermometry application. Moreover, the possible mechanism of constructing LIR for temperature measurement can be explained by the configuration coordinate. The relationship between bandgap width, activation energy, and temperature sensitivity was also discussed.
We gratefully acknowledge the financial support provided by the Natural Science Foundation of Hunan Province (Grant No. 2023JJ50486 and 2022JJ30315), Aid Program for Science and Technology Innovative Research Team in Higher Educational Institutions of Hunan Province (Grant No. Xiang Jiao Tong [2023] 233), Hunan Provincial Engineering and Technology Research Center (Grant No. 2023TP2113), the University Key Discipline Construction Program of Hunan University of Humanities, Science and Technology-Chemistry (No. 39223012) and the Planned Science and Technology Project of Loudi City (Grant No. Lou Ke Fa [2022] 32).
- 1. Y.J. Park, S.W. Kim, K. Sugimoto, T. Hasegawa, K. Tanima, K. Uematsu, K. Toda, and M. Sato, J. Ceram. Process. Res. 20[5] (2019) 460-463.
-

- 2. B.S. Choi, D.H. Lee, J.H. Ryu, and H. Cho, J. Ceram. Process. Res. 20[1] (2019) 80-83.
-

- 3. J. Lee, H. Cho, and J.H. Ryu, J. Ceram. Process. Res. 17[9] (2016) 1006-1010.
-

- 4. K. Toda, M. Iwaki, M. Katsu, S. Kamei, S. Kim, T. Hasegawa, M. Muto, R. Yamanashi, T. Sakamoto, K. Uematsu, M. Sato, and D.-H. Yoon, J. Ceram. Process. Res. 20[3] (2019) 276-279.
-

- 5. M. Iwaki, K. Sugimoto, M. Watanabe, K. Uematsu, K. Toda, and M. Sato, J. Ceram. Process. Res. 20[3] (2019) 205-210.
-

- 6. S.J. Kim, J. Ceram. Process. Res. 24[6] (2023) 963-967.
-

- 7. B. Joshi and G. Gyawali, J. Ceram. Process. Res. 21[6](2020) 705-711.
-

- 8. X. Li, Y. Gao, L. Zhang, and J. Lian, J. Ceram. Process. Res. 23[5] (2022) 709-715.
-

- 9. Y. Wu, F. Yang, H. Zhang, F. Yan, and R. Zou, J. Ceram. Process. Res. 22[4](2021) 436-440.
-

- 10. Y. Cheng, Y. Gao, H. Lin, F. Huang, and Y. Wang, J. Mater. Chem. C 6[28] (2018) 7462-7478.
-

- 11. M. Sun, H. Chen, L. Guo, B. Zhang, X. Mi, B. Kang, Z. Jiang, X. Yu, Z. Fu, Z. Zhang, and H. Zheng, J. Lumin. 248 (2022) 118944.
-

- 12. R. Shi, L.T. Lin, P. Dorenbos, and H. Liang, J. Mater. Chem. C 5[41] (2017) 10737-10745.
-

- 13. X. Tian, S. Lian, C. Ji, Z. Huang, J. Wen, Z. Chen, H. Peng, S. Wang, J. Li, J. Hu, and Y. Peng, J. Alloys Compd. 784 (2019) 628-640.
-

- 14. X. Tian, L. Guo, J. Wen, L. Zhu, C. Ji, Z. Huang, H. Qiu, F. Luo, X. Liu, J. Li, C. Li, Y. Peng, J. Cao, Z. He, and H. Zhong, J. Alloys Compd. 959 (2023) 170574.
-

- 15. X. Tian, S. Xu, J. Wen, L. Zhu, C. Ji, Z. Huang, X. Wang, F. Luo, X. Liu, Y. Lu, J. Li, C. Li, Y. Peng, J. Cao, and Z. He, Ceram. Int. 49[16] (2023) 27126-27137.
-

- 16. X. Tian, C. Wang, J. Wen, S. Lian, C. Ji, Z. Huang, Z. Chen, H. Peng, S. Wang, J. Li, J. Hu, and Y. Peng, J. Lumin. 214 (2019) 116528.
-

- 17. X. Zhang, C. Cao, C. Zhang, L. Chen, J. Zhang, and X. Wang, Phys. B 406[20] (2011) 3891-3895.
-

- 18. R. Chen, and D. Chen, Spectrochim. Acta, Part A 127 (2014) 256-260.
-

- 19. Y. Chen, M. Gong, and K.W. Cheah, Mat. Sci. Eng. B 166[1] (2010) 24-27.
-

- 20. X. Zhang, J. Zhang, X. Zhang, L. Chen, S. Lu, and X. Wang, J. Lumin. 122-123 (2007) 958-960.
-

- 21. X. Tian, L. Li, M. Wei, C. Ji, Z. Huang, X. Liu, J. Wen, and Y. Peng, J. Ceram. Process. Res. 22[5] (2021) 555-567.
-

- 22. J. Park and Y.J. Kim, J. Ceram. Process. Res. 15[3](2014) 189-192.
-

- 23. H. Suzuki, O. Tomita, M. Higashi, A. Nakada, and R. Abe, Appl. Catal. B 232 (2018) 49-54.
-

- 24. X. Zhang, J. Zhang, X. Zhang, L. Chen, Y. Luo, and X. Wang, Chem. Phys. Lett. 434[4] (2007) 237-240.
-

- 25. S. Kumar, R. Prakash, V. Kumar, G.M. Bhalerao, R.J. Choudhary, and D.M. Phase, Adv. Powder Technol. 26[4] (2015) 1263-1268.
-

- 26. M. Chang, Y. Song, J. Chen, L. Cui, Y. Sheng, Z. Shi, and H. Zou, Cryst. Growth Des. 17[12] (2017) 6486-6497.
-

- 27. W. He, X. Tian, Y. Du, C. Sun, X. Zhang, X. Han, S. Han, X. Sun, X. Du, and Y. Yue, Mat. Sci. Eng. C 30[5] (2010) 758-762.
-

- 28. J.Q. Qi, J.X. Chang, R.Q. Zhang, Q.Q. Zhang, B.D. Liu, J. Chen, and X.M. Han, Ceram. Int. 44[12] (2018) 14342-14347.
-

- 29. P. Du, X. Huang, and J.S. Yu, Chem. Eng. J. 337 (2018) 91-100.
-

- 30. K. Mondal, D. Singh, and J. Manam, J. Alloys Compd. 761 (2018) 41-45.
-

- 31. K. Li, M. Shang, H. Lian, and J. Lin, Inorg. Chem. 54[16] (2015) 7992-8002.
-

- 32. P. Boutinaud, L. Sarakha, E. Cavalli, M. Bettinelli, P. Dorenbos, and R. Mahiou, J. Phys. D Appl. Phys. 42[4] (2009) 045106.
-

- 33. S. Zhou, G. Jiang, X. Wei, C. Duan, Y. Chen, and M. Yin, J. Nanosci. Nanotechnol. 14[5] (2014) 3739-3742.
-

- 34. W. Tang, H. Ni, Q. Zhang, and J. Ding, RSC Adv. 8[42] (2018) 23996-24001.
-

- 35. Y. Gao, F. Huang, H. Lin, J. Xu, and Y. Wang, Sens. Actuators, B 243 (2017) 137-143.
-

- 36. H. Sun, Q. Zhang, X. Wang, and C. Bulin, J. Am. Ceram. Soc. 98[2] (2015) 601-606.
-

 This Article
-
2024; 25(2): 242-250
Published on Apr 30, 2024
- 10.36410/jcpr.2024.25.2.242
- Received on Dec 15, 2023
- Revised on Jan 18, 2024
- Accepted on Jan 24, 2024
 Services
- Abstract
introduction
experimental
results and discussion
conclusions
- Acknowledgements
- References
- Full Text PDF
Shared
 Correspondence to
- Xiuying Tian
-
Modern Industry School of Advanced Ceramics, Hunan Provincial Key Laboratory of Fine Ceramics and Powder Materials, School of Materials and Environmental Engineering, Hunan University of Humanities, Science and Technology, Loudi, Hunan, 417000, China
Tel : +86-0738-8326910 Fax: +86-0738-8326910 - E-mail: xiuyingt@126.com


 Copyright 2019 International Orgranization for Ceramic Processing. All rights reserved.