


- Investigation and parametric optimization with 97Mg+1.5Ag+1.5 LiAlO2 metal matrix composite in wire EDM performance using DFA technique
T. Suresha,*, P. Sureshb and M. Prabuc
aAssistant Professor, Department of Mechatronics Engineering, Kumaraguru College of Technology, Coimbatore, Tamilnadu, India
bProfessor, Department of Mechatronics Engineering, Sona College of Technology, Salem, Tamilnadu, India
cProfessor, Department of Mechanical Engineering, K.S.R College of Engineering, Tiruchengode, Tamilnadu, IndiaThis article is an open access article distributed under the terms of the Creative Commons Attribution Non-Commercial License (http://creativecommons.org/licenses/by-nc/4.0) which permits unrestricted non-commercial use, distribution, and reproduction in any medium, provided the original work is properly cited.
In several research studies, many experiments have been conducted on non-traditional Electric Discharge Machining (EDM) and also investigated how different EDM process parameters influence the surface quality and productivity. EDM is a material removal process in which desired shape can be obtained by generation of spark. EDM process parameters play the vital role to improve the surface finish and productivity simultaneously. This paper presents the effects of EDM machining parameter such as Discharge ON Time, Discharge OFF Time, and Wire Feed, and their interactions on the Material Removal Rate (MRR) and Surface Roughness (SR) during the machining of magnesium matrix composites (MgZE41A) reinforced with Ag and LiAlO2. The hybrid composite of 97Mg+1.5Ag+1.5 LiAlO2 combination is selected for manufacture using powder metallurgy technique as it has a high wear resistance. Analysis of Variance (ANOVA) is adopted to study the influencing process parameters for each response. Desirability function analysis (DFA) tool is adopted to find the optimal EDM process parameters which would reduce the surface roughness and improve the material removal rate simultaneously. From the analysis results it has been found that desirability ‘D’ of 0.55 gives the better results.
Keywords: ANOVA, Desirability, EDM, Surface roughness and MgZE41.
The literature study discusses the application of Response Surface Methodology (RSM) to optimize the parameters of Wire Cut Electrical Discharge Machining (WEDM) on magnesium based hybrid alloys.
Magnesium and its alloy having low density and better compatibility with various ceramics reinforcements. Magnesium density is around two thirds of aluminium and one fifth of steel. Though, magnesium and its alloys anticipated high specific strength, amongst conventional engineering alloys. Many magnesium alloys are there such as AZ31, AZ61, AZ91, ZE41A etc. MgZE41A which is having higher amount of Zn, Ce and Zr alloying element in Mg. It provides better mechanical bonding and increases the mechanical and tribological properties (Sankaranarayanan Seetharaman et al., 2021; Xia Zhou et al., 2021; Mohd Rafiq Parray et al., 2021). It is crucial to optimize the machining parameters, including Discharge ON time, Discharge OFF time, and Wire feed, to achieve better results in MRR and SR. Several studies (Cole, GS et al., 1995; She-xuan Shi et al., 2012; Aniza Alias et al., 2012; S. Sarkar et al., 2011; M.T. Antar et al., 2011) have shown that the experimental and predicted results are in good agreement. In a study conducted by R. Soundararajan et al. (2016), the MRR and SR of squeeze cast A413 alloy were evaluated using WEDM. The researchers optimized the process parameters through multi-response optimization using RSM. The experimental results demonstrated that the mathematical model accurately predicted the optimum values, limiting the error. The average error percentages for MRR and SR were found to be 7.30% and 3.0%, respectively. To achieve better MRR, the optimal parameter values were determined as follows : MRR of 35.760 mm3/min was obtained with Ton set to 1.03 µs, Toff set to 20 µs, and IP set to 200 Amps. On the other hand, the optimal parameters for obtaining SR of 23.515 mm3/min and 2.302 µm were Ton of 1.15 µs, Toff of 20 µs, and IP of 160 Amps. T.U. Siddiqui et al. (2017) investigated and examined how magnesium alloy behaved during electrical discharge machining. The findings indicated that the voltage and capacitance had a significant impact on the energy gap and the amount of electrical energy supplied. Increasing these factors leads to a higher Material Removal Rate for magnesium. Additionally, the width of the kerf, or cut, increased as the capacitance of the power supply increased, while the voltage remained constant throughout the process. In their study, B. Rajeswari et al. (2017) examined the machinability of aluminium composites through end milling. They utilized RSM-based grey relational analysis to determine the optimal parameters for minimizing tool wear and surface roughness. The results indicated that the ideal spindle speed is 1000 rpm, the feed rate is 0.03 mm/rev, the depth of cut is 1 mm, and the composite should contain 5% SiC by weight. Xinwei Wang et al. (2017) conducted a study to explore how the specimen size and grain size of AZ31 magnesium alloy influenced its softening behavior using the uniaxial micro-tension technique. The research revealed that as the temperature rises in relation to the square root of the current density, the miniaturization of the sample decreases. However, it was observed that the grain size of the samples remained unaffected by this temperature increase. Nonetheless, the current density emerged as a significant and measurable factor in defining the electrical discharge model, consequently contributing to the softening of the material. In their research, Rajesh Choudhary et al. (2018) investigated the machining behavior of Al6061/14%wt fly-ash composite using electrical discharge machining with different types of electrodes. The study’s findings indicated that increasing the current, pulse-on time, and duty cycle of the electrode resulted in an increase in the material removal rate of the composites. However, as these parameters increased, the tool wear rate also increased. Interestingly, when the gap voltage and duty cycle were increased, the tool wear rate decreased.
High purity, magnesium with the particle size of less than 44 µm, silver and (Ag) and Lithium Aluminate (LiAlO2) are the particle size of less than 10 µm are purchased from M/s. Sigma Aldrich, Germany. The hybrid composite 97Mg+1.5Ag+1.5 LiAlO2 combination is manufactured using powder metallurgy technique as it has better admirable microstructure stability (Suresh, T et al., 2022).The influences of machining parameters such as Discharge ON Time, Discharge OFF Time and Wire Feed and their interactions on the Material Removal Rate (MRR) and Surface Roughness (SR) during machining of magnesium matrix composites (MgZE41A) reinforced with Ag and LiAlO2 with various propositions are presented in this research work. The machining parameters are analysed using Response Surface Methodology (RSM). Optimizing the machining parameters such as Discharge ON time, Discharge OFF time and Wire feed are crucial in-order to get the better result in MRR and SR (Cole, GS et al., 1995). Table 1 shows the machining parameters and its levels.
Cutting Conditions
The machinability of magnesium matrix composites shows that the discharge on time is the most significant factor to be considered. The higher amount of discharge on time provides higher MRR and SR in the workpiece. However, higher amount of cutting forces may induce development of temperature and it produces higher energy spent while machining (Matanda, B. K. et al., 2023; Soori et al., 2022; Gopal, P et al., 2017). It affects the surface roughness and dimensional tolerance of the workpiece. The WEDM studies are performed on the fabricated magnesium matrix composites by full factorial design of experiment and varying three input parameters and two levels. The maximum possible experiment sets were conducted based upon the input levels. Table 2 shows the Degree of Experimentation (DOE) for this study. The response of the machining shows the process efficiency and quality of the machined surfaces, MRR and SR. The responses such as MRR and SR are measured twice and the average results are used for this evaluation.
Microstructural stability with Elemental analysis
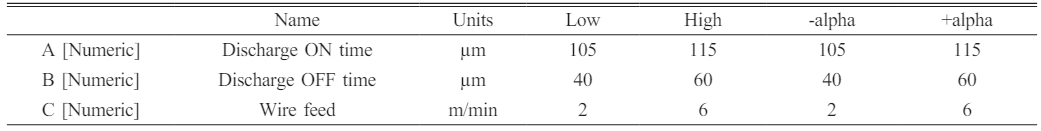
Scanning electronic microscopy image helps to analyse the microstructural of sintered composites for the evaluation of structure of grain, size and distribution of the particles. Fig. 1 portrays the SEM microstructure of the fabricated composite 97Mg+1.5Ag+1.5 LiAlO2. In microstructure image, it is clearly evident that the secondary particles such as Ag and LiAlO2 are evenly distributed in the magnesium matrix. Even though the secondary particles evenly distributed but few defects has been observed such as clusters and voids in microstructure. This is owing to the reason lack of bonding between the secondary reinforcement particles with magnesium matrix during the sintering process. The experimental study shows that thermal decomposition of matrix and reinforcement was enhanced with increasing the sintering temperature from 400 °C to 500 °C. Also, it has been observed that formation of dendrite occurs due to higher sintering temperature and it led to increase the mechanical and tribological properties.
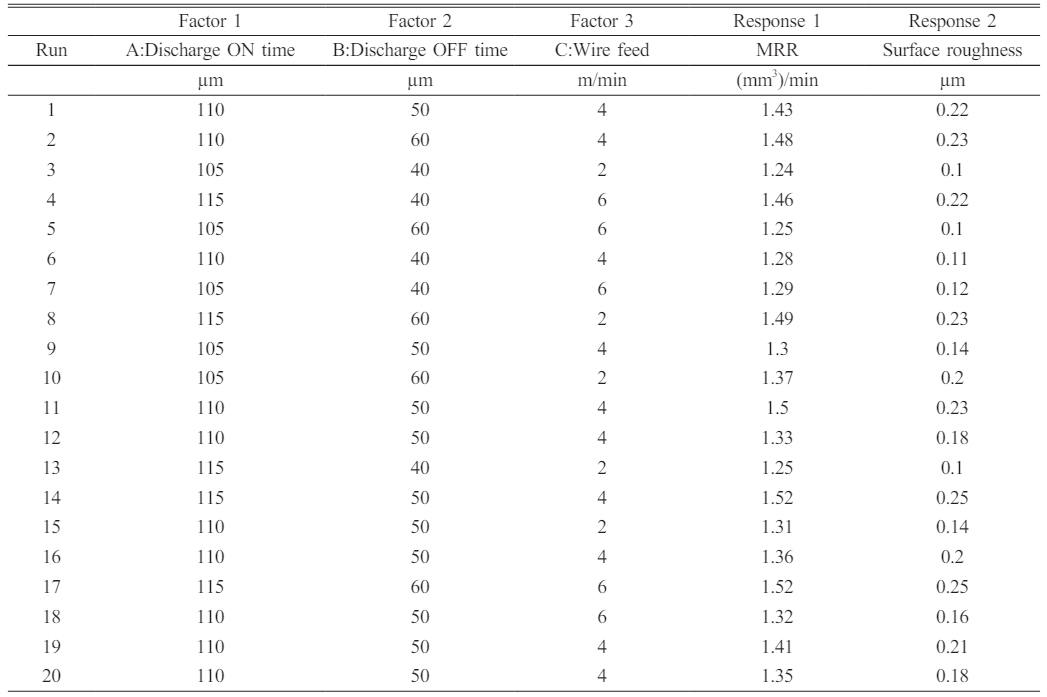
The elemental confirmation is not yet defined with SEM. Henceforth, EDS line mapping was essential for verifying the elemental confirmation of the fabricated composites and it displayed in Fig. 2. which shows the elemental line mapping of 97Mg+1.5Ag+1.5 LiAlO2. Six shaded colors are viewed in Fig. 2 namely green, pink, violet yellow, orange, and light green. It seems that Mg, Zn, Ce, Ag, Li and Al. The same is confirmed by the EDAX analysis also. The intensity of magnesium, zinc and cerium is high when compare to Ag. It illustrates that the presence of magnesium, zinc and cerium is high compared to Ag.
Parametric influences on MRR
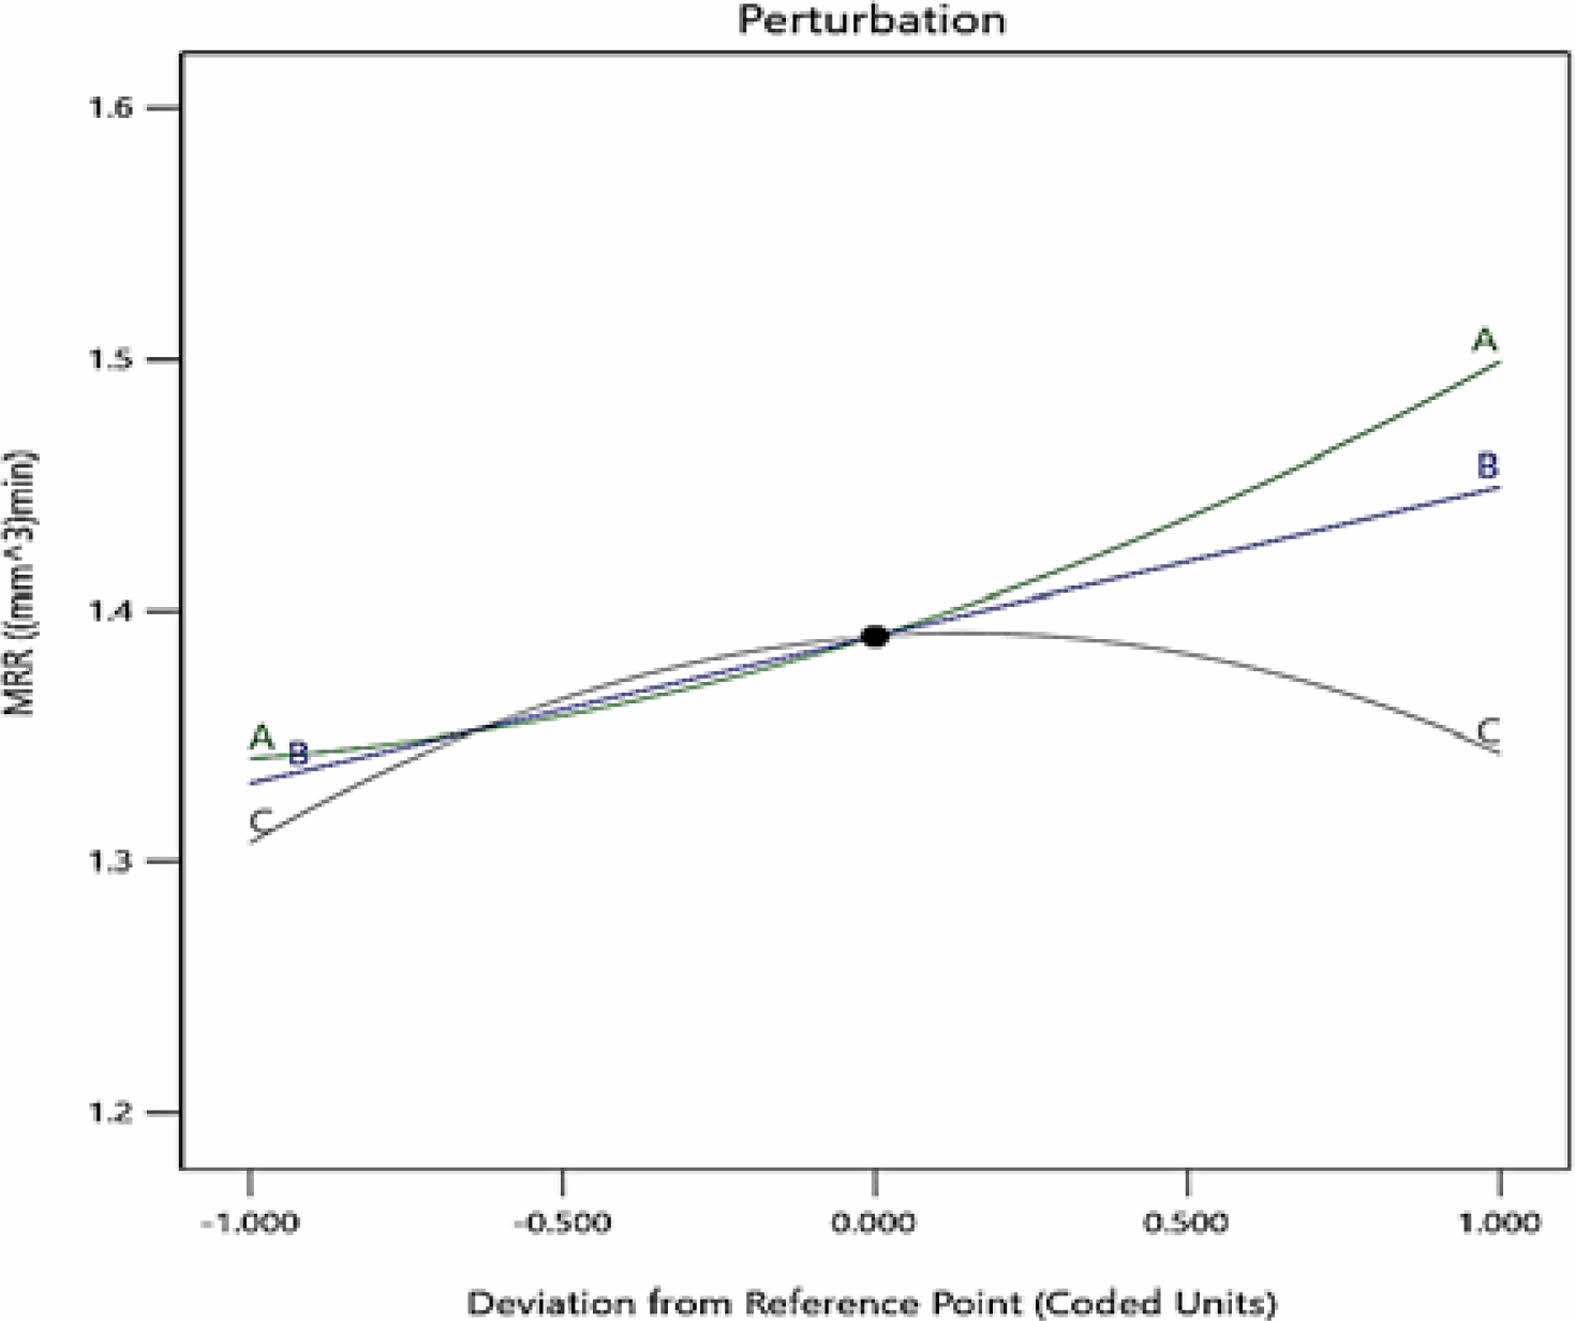
Material Removal Rate is one of the significant machinability criteria of the study. While EDM and WEDM experimentation of various electrically conductive materials, the surface quality of the component depends on input factors under EDM and non-EDM parameters (Prasad, DS et al., 2015; Rao, KV et al., 2014). In this study discharge on time, discharge off time and wire feed are varied and studied its influences. Fig. 3 shows the perturbation plot for MRR and it illustrates that influence of all three input parameters are plotted in the same profile.
In addition to perturbation plot for various input parameters, the ANOVA was conducted with and two-way interaction. The model value ‘P’ obtained 0.0054 which shows the value falls less than 0.05, thus the developed model is significant for MRR. F statistical values A-Discharge ON time (22.34), B-Discharge OFF time (12.46) and C-Wire feed (1.16) revealed that Discharge ON time is the maximum influencing EDM process parameter compare to the other process parameters. It clearly indicates the individual and interactive effects of the selected input parameters (Aruri et al., 2022,; Raj A, et al., 2022; Howmick et al., 2022). From the ANOVA results, it clearly illustrates that discharge on time (62%) contributes more than the other one discharge off time (34.8%) and wire feed (3.2%). Thus, the results stand with the main input parameter and selection for better MRR. The predicted regression model was also developed based upon the input parameters and output responses. The developed model F-value implies 5.84 and shows that the developed model is significant. However, due to noise 0.54% error was chance of developed and P-value seems that less than 0.050 and it also indicates the model is significant. In this model the lack of fit was 0.40 and implies that it was not significant and relative to pure error. There is a chance of 83.2% of lack of fit and it could be happening because of noise. The Predicted R² of 0.5166 is in reasonable agreement with the Adjusted R² of 0.6963; i.e. the difference is less than 0.2.
Interaction plot for MRR
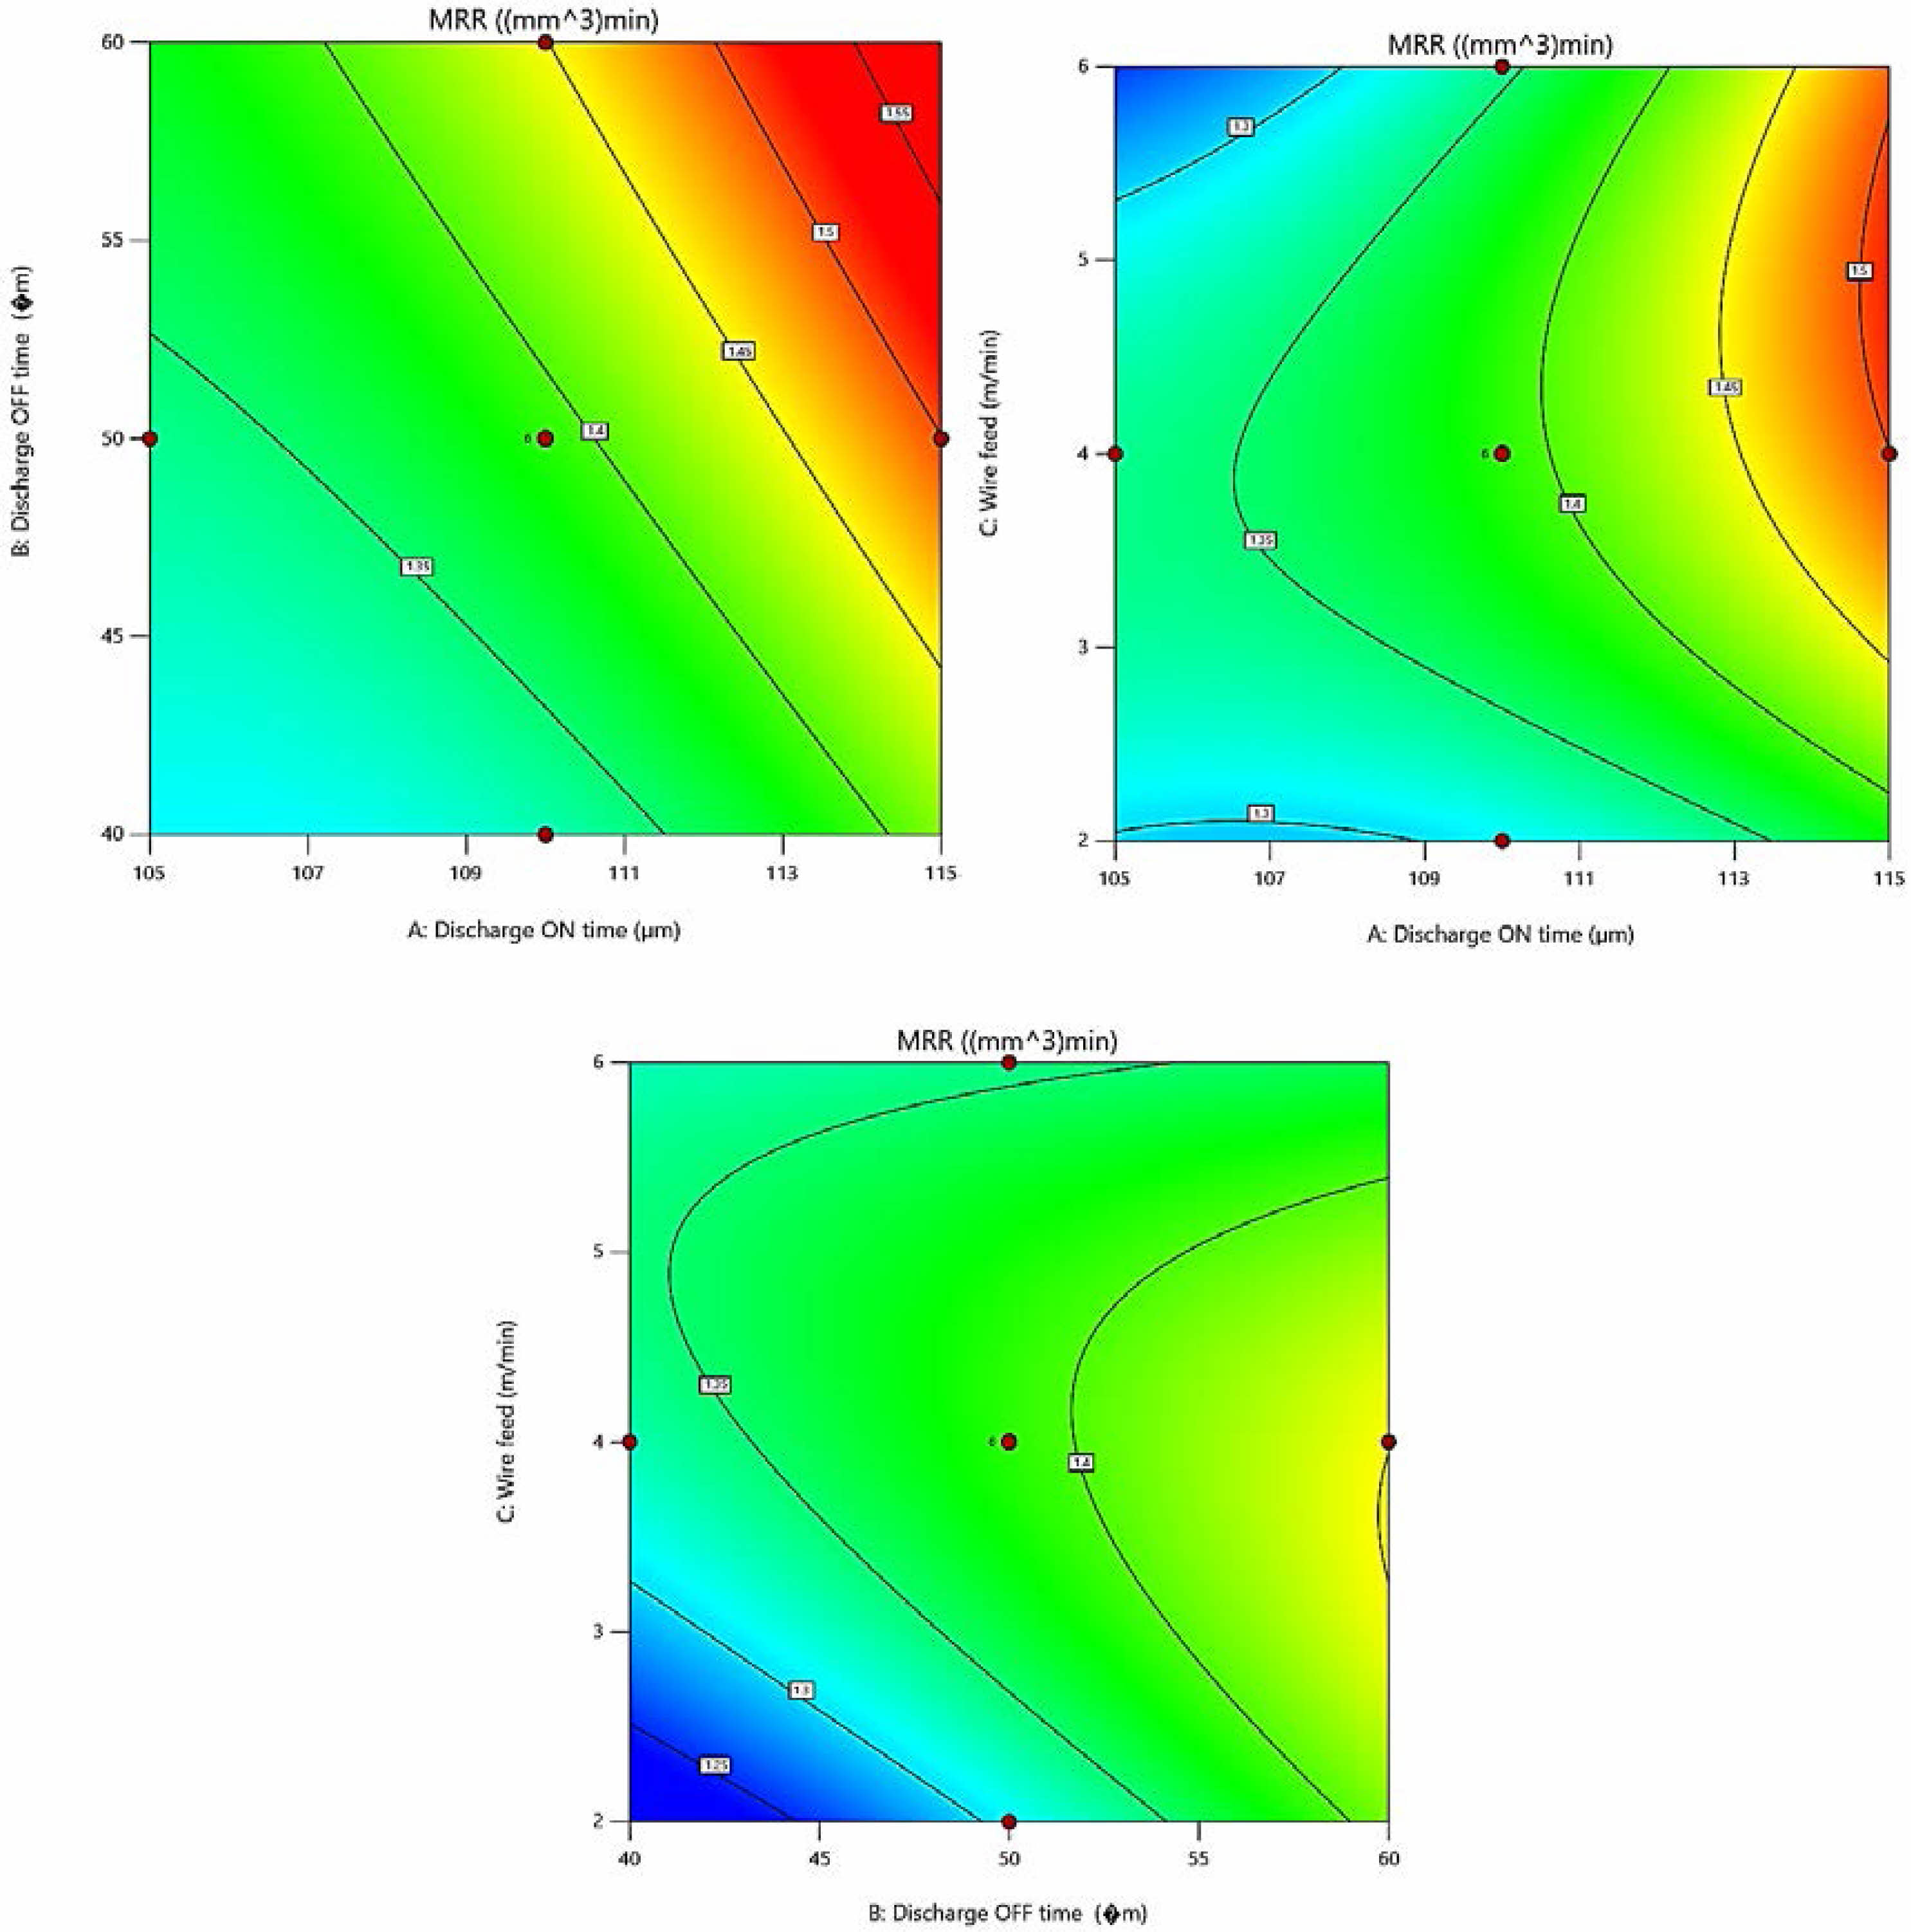
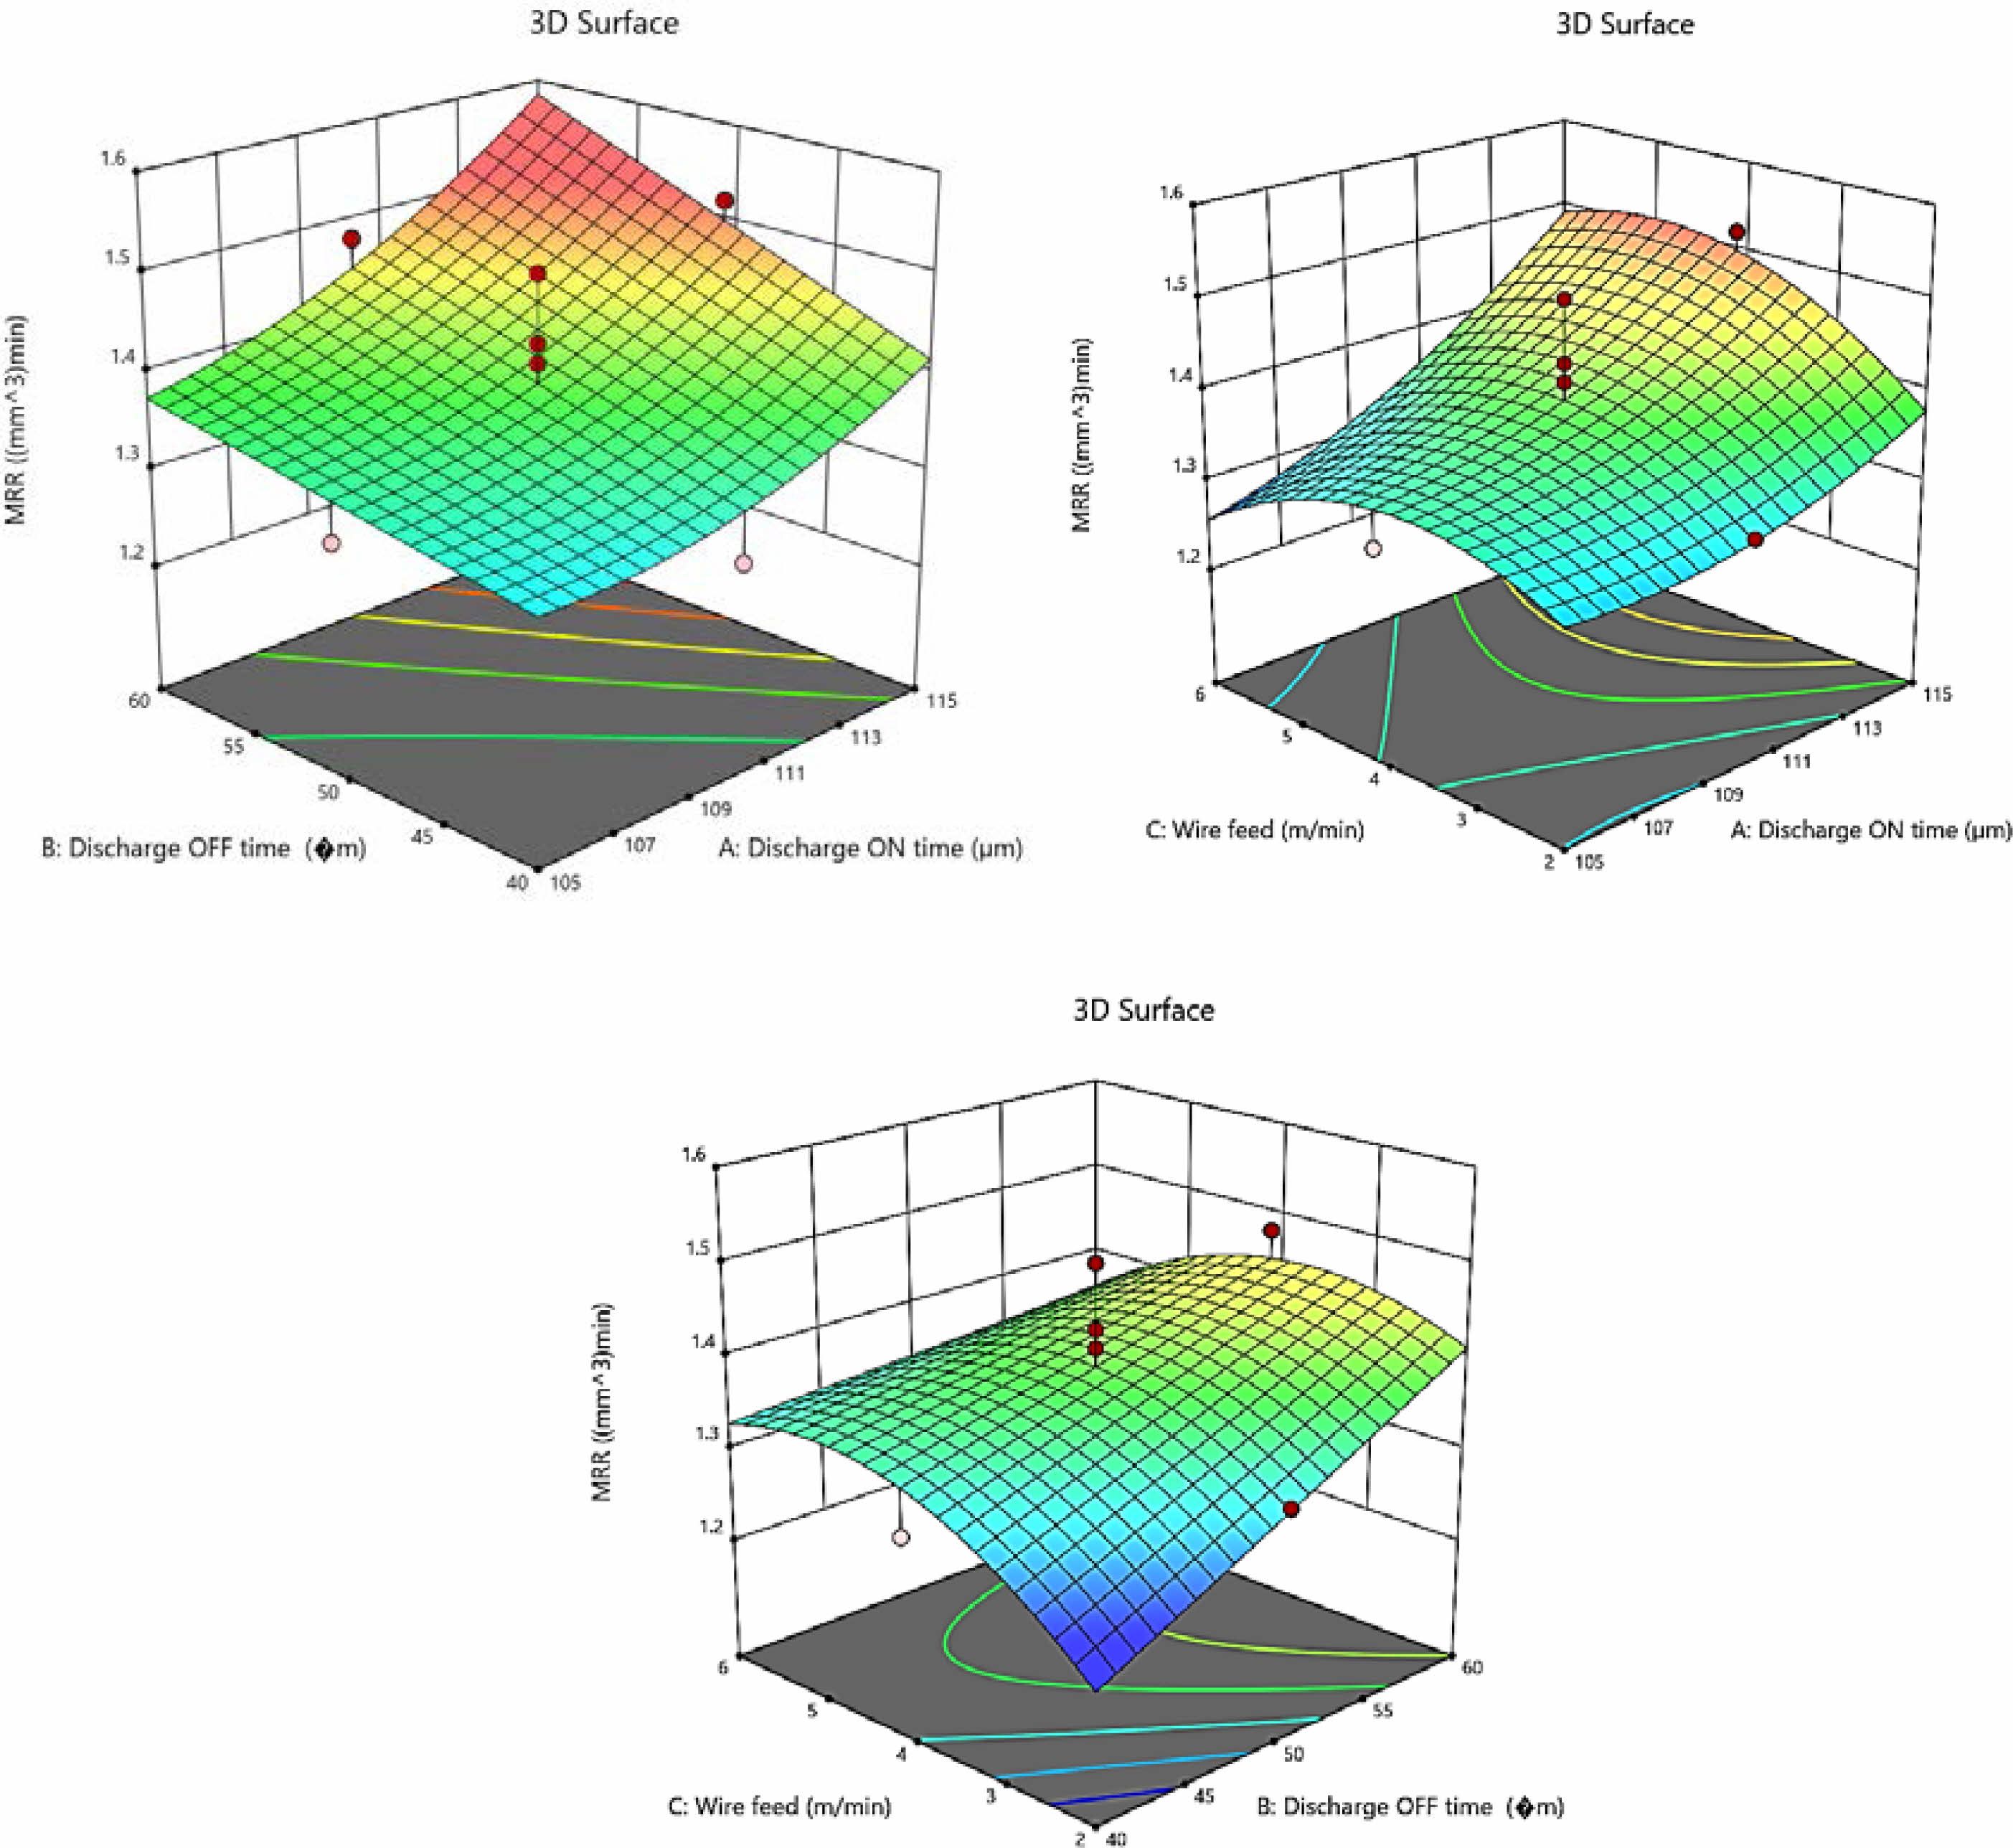
The interaction effect of the parameters was defined by 2D and 3D contour and surface plot for MRR and is shown in Fig. 4(a-c) and Fig. 5(a-c). It shows the interaction between discharge on time and discharge off time, discharge on time and wire feed and discharge off time and wire feed for MRR. It reveals that increasing the discharge on time led to increase the MRR. This is happening because of due to the increase in discharge on time duration that causes more discharge energy onto the work piece and leads to melting the most amounts of material and evaporation. However, increasing the discharge on time led to faster the cutting speed and produces higher MRR. In other hand, increasing the wire feed led to increase the MRR. Three different colors were noticed in both 2D and 3D graphs namely blue, green and red. Blue color denotes the minimum level, green color denotes the nominal and red color denotes the higher level.
Parametric influences on SR
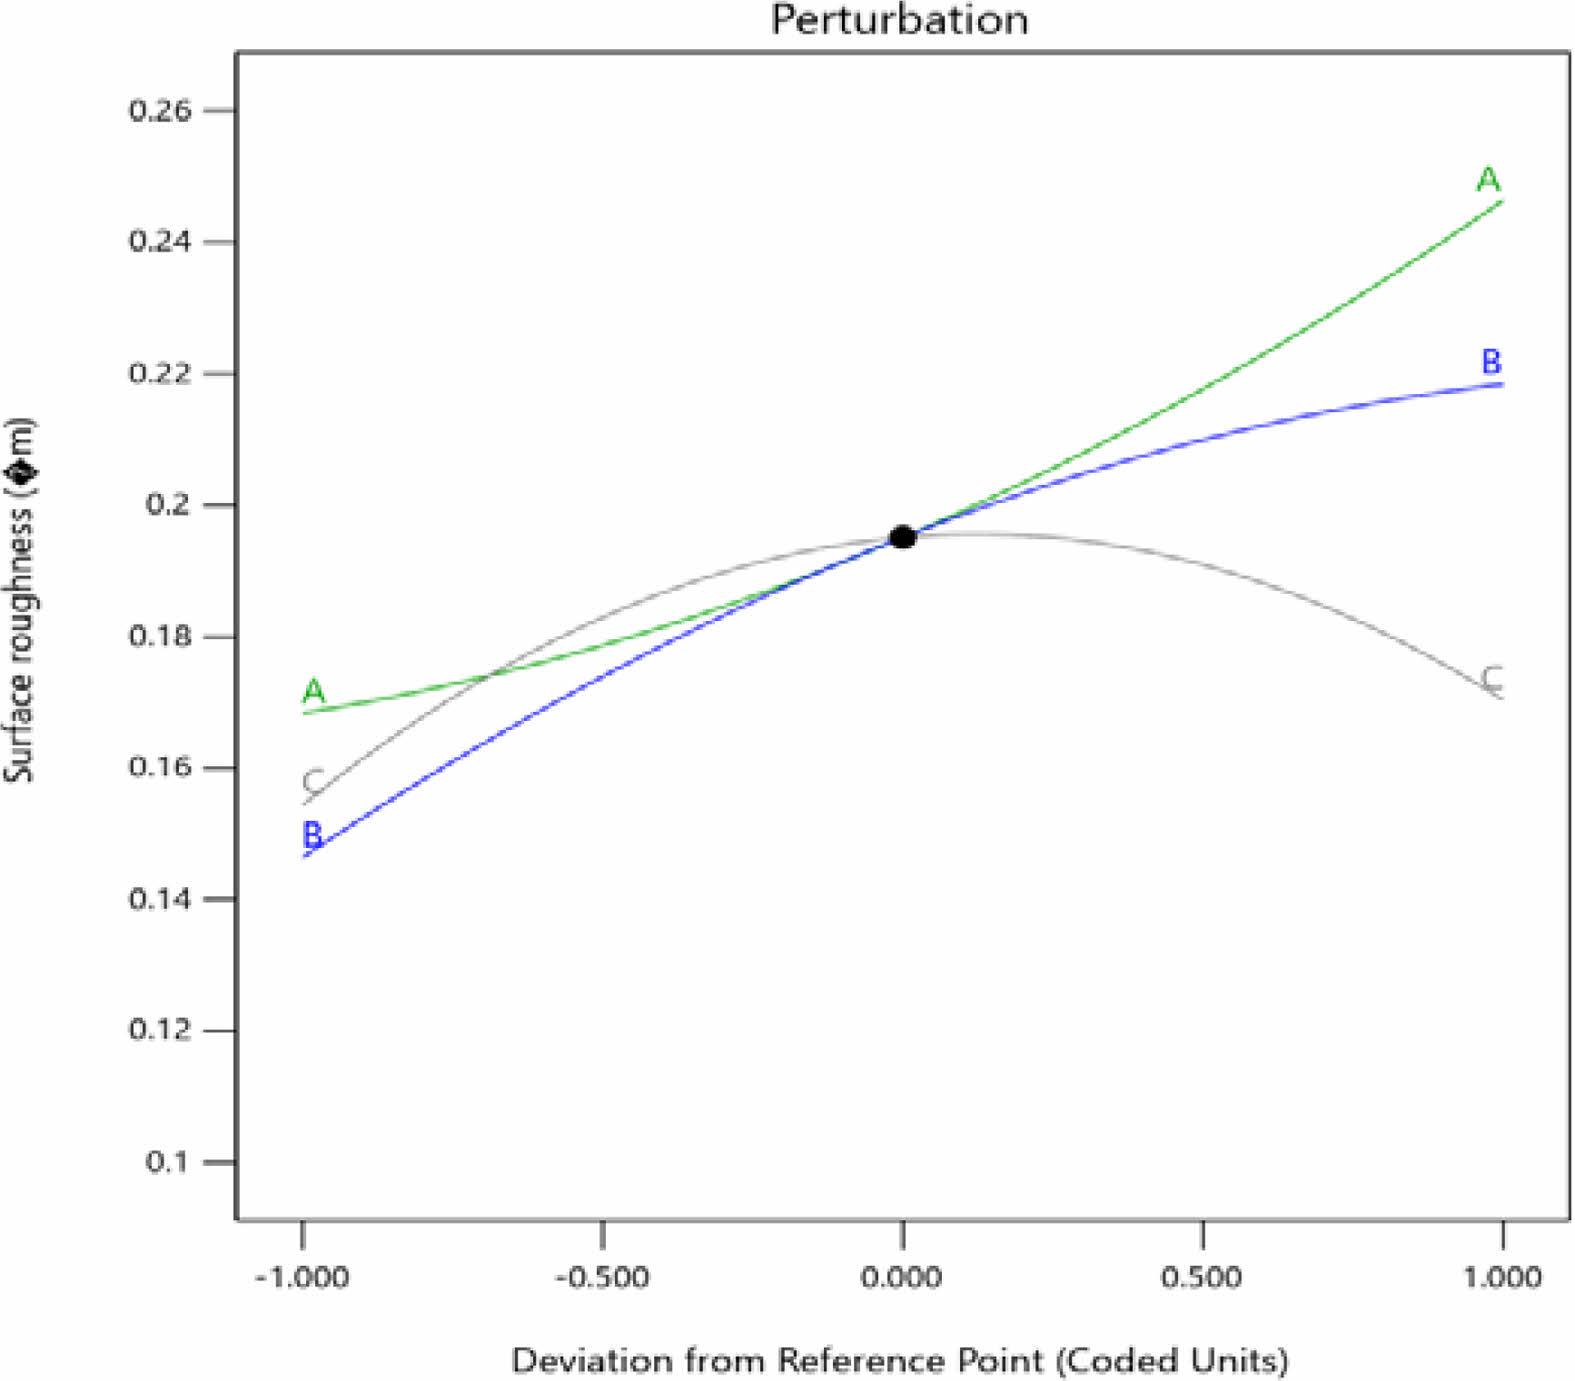
Surface Roughness (SR) is one of the significant machinability criteria of the study. While EDM and WEDM experimentation of various electrically conductive materials, the surface quality of the component depends on input factors under EDM and non-EDM parameters. In this study discharge on time, discharge off time and wire feed are varied and studied its influences. Fig. 6 shows the perturbation plot for SR and it illustrates that influence of all three input parameters are plotted in the same profile.
In addition to perturbation plot for various input parameters, the ANOVA was conducted with and two-way interaction. The model value ‘P’ obtained 0.0008 which shows the value falls less than 0.05, thus the developed model is significant for SR. F statistical values A-Discharge ON time (26.8), B-Discharge OFF time (22.84) and C-Wire feed (1.13) revealed that Discharge ON time is the maximum influencing EDM process parameter compare to the other process parameters. It clearly indicates the individual and interactive effects of the selected input parameters. From the ANOVA, it clearly illustrates that discharge on time (15%) contributes more than the other one discharge off time (13 %) and wire feed (0.6%). Thus, the results stand with the main input parameter and selection for better MRR. The predicted regression model was also developed based upon the input parameters and output responses. The developed model F-value implies 9.36 and shows that the developed model is significant. However, due to noise 0.08% error was chance of developed and P-value seems that less than 0.050 and it also indicates the model is significant. In this model the lack of fit was 0.40 and implies that it was not significant and relative to pure error. There is a chance of 79% of lack of fit and it could be happening because of noise. The Predicted R² of 0.5139 is in reasonable agreement with the Adjusted R² of 0.7983; i.e. the difference is less than 0.2.
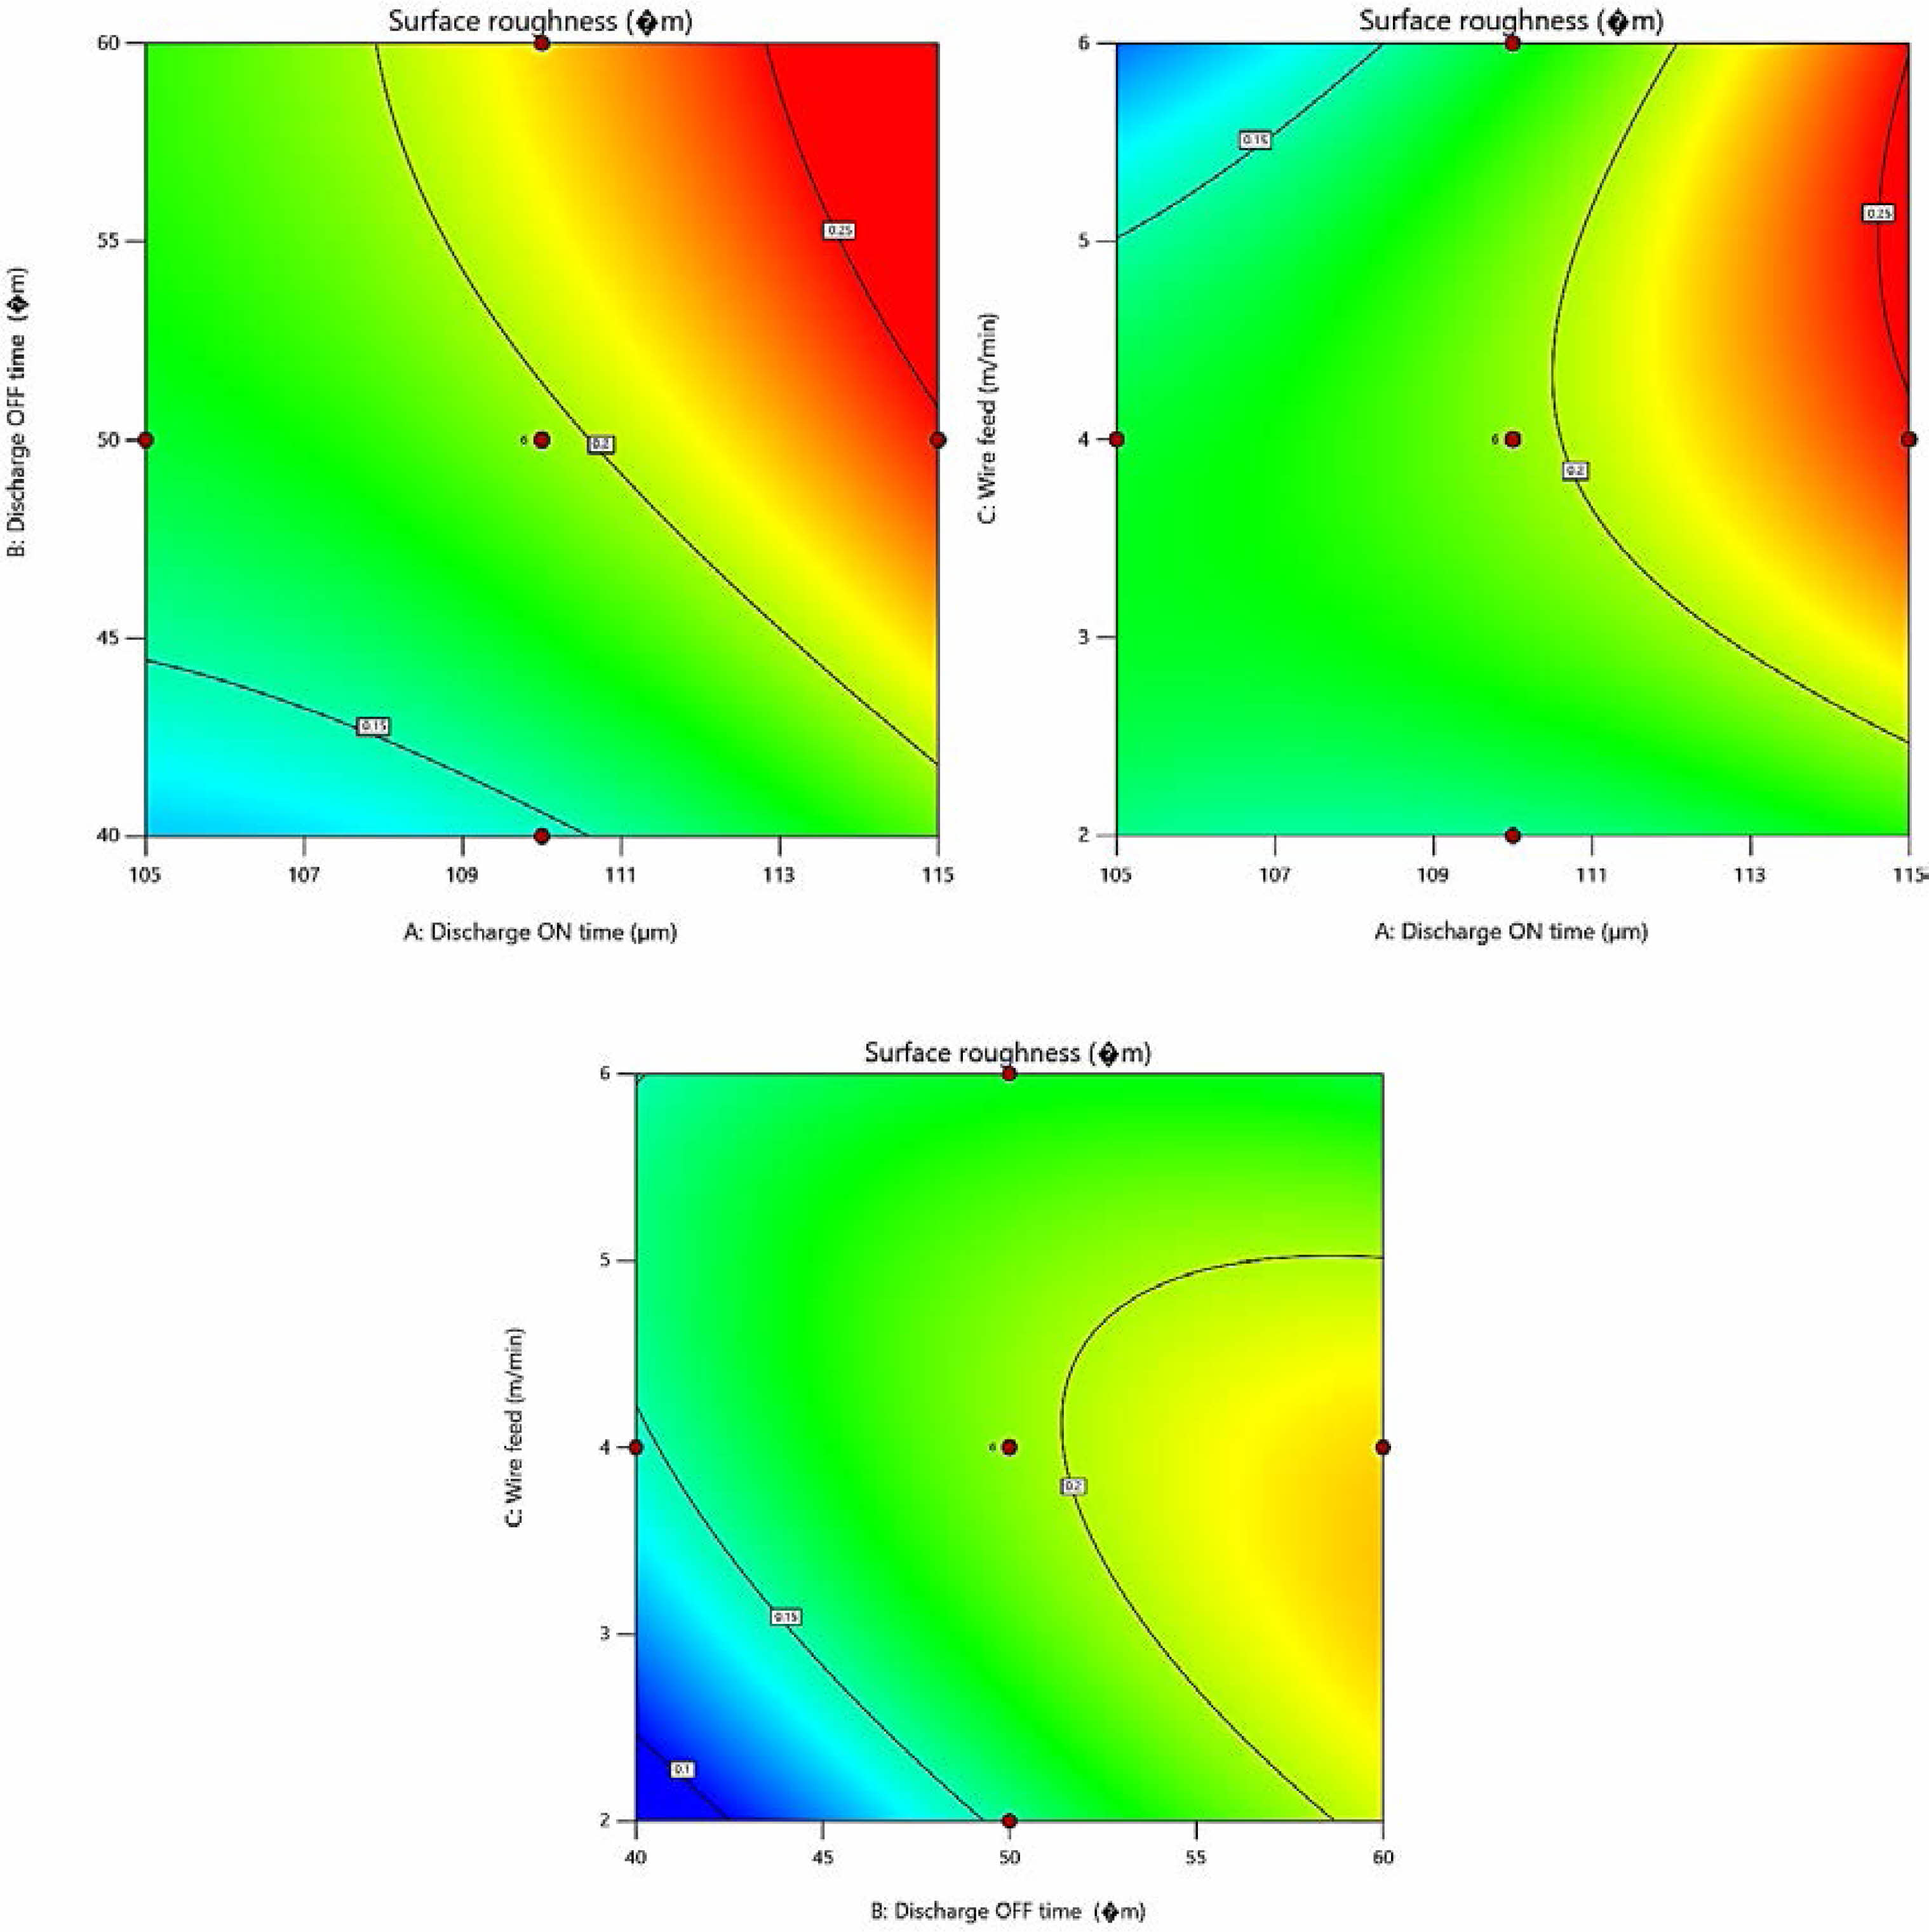
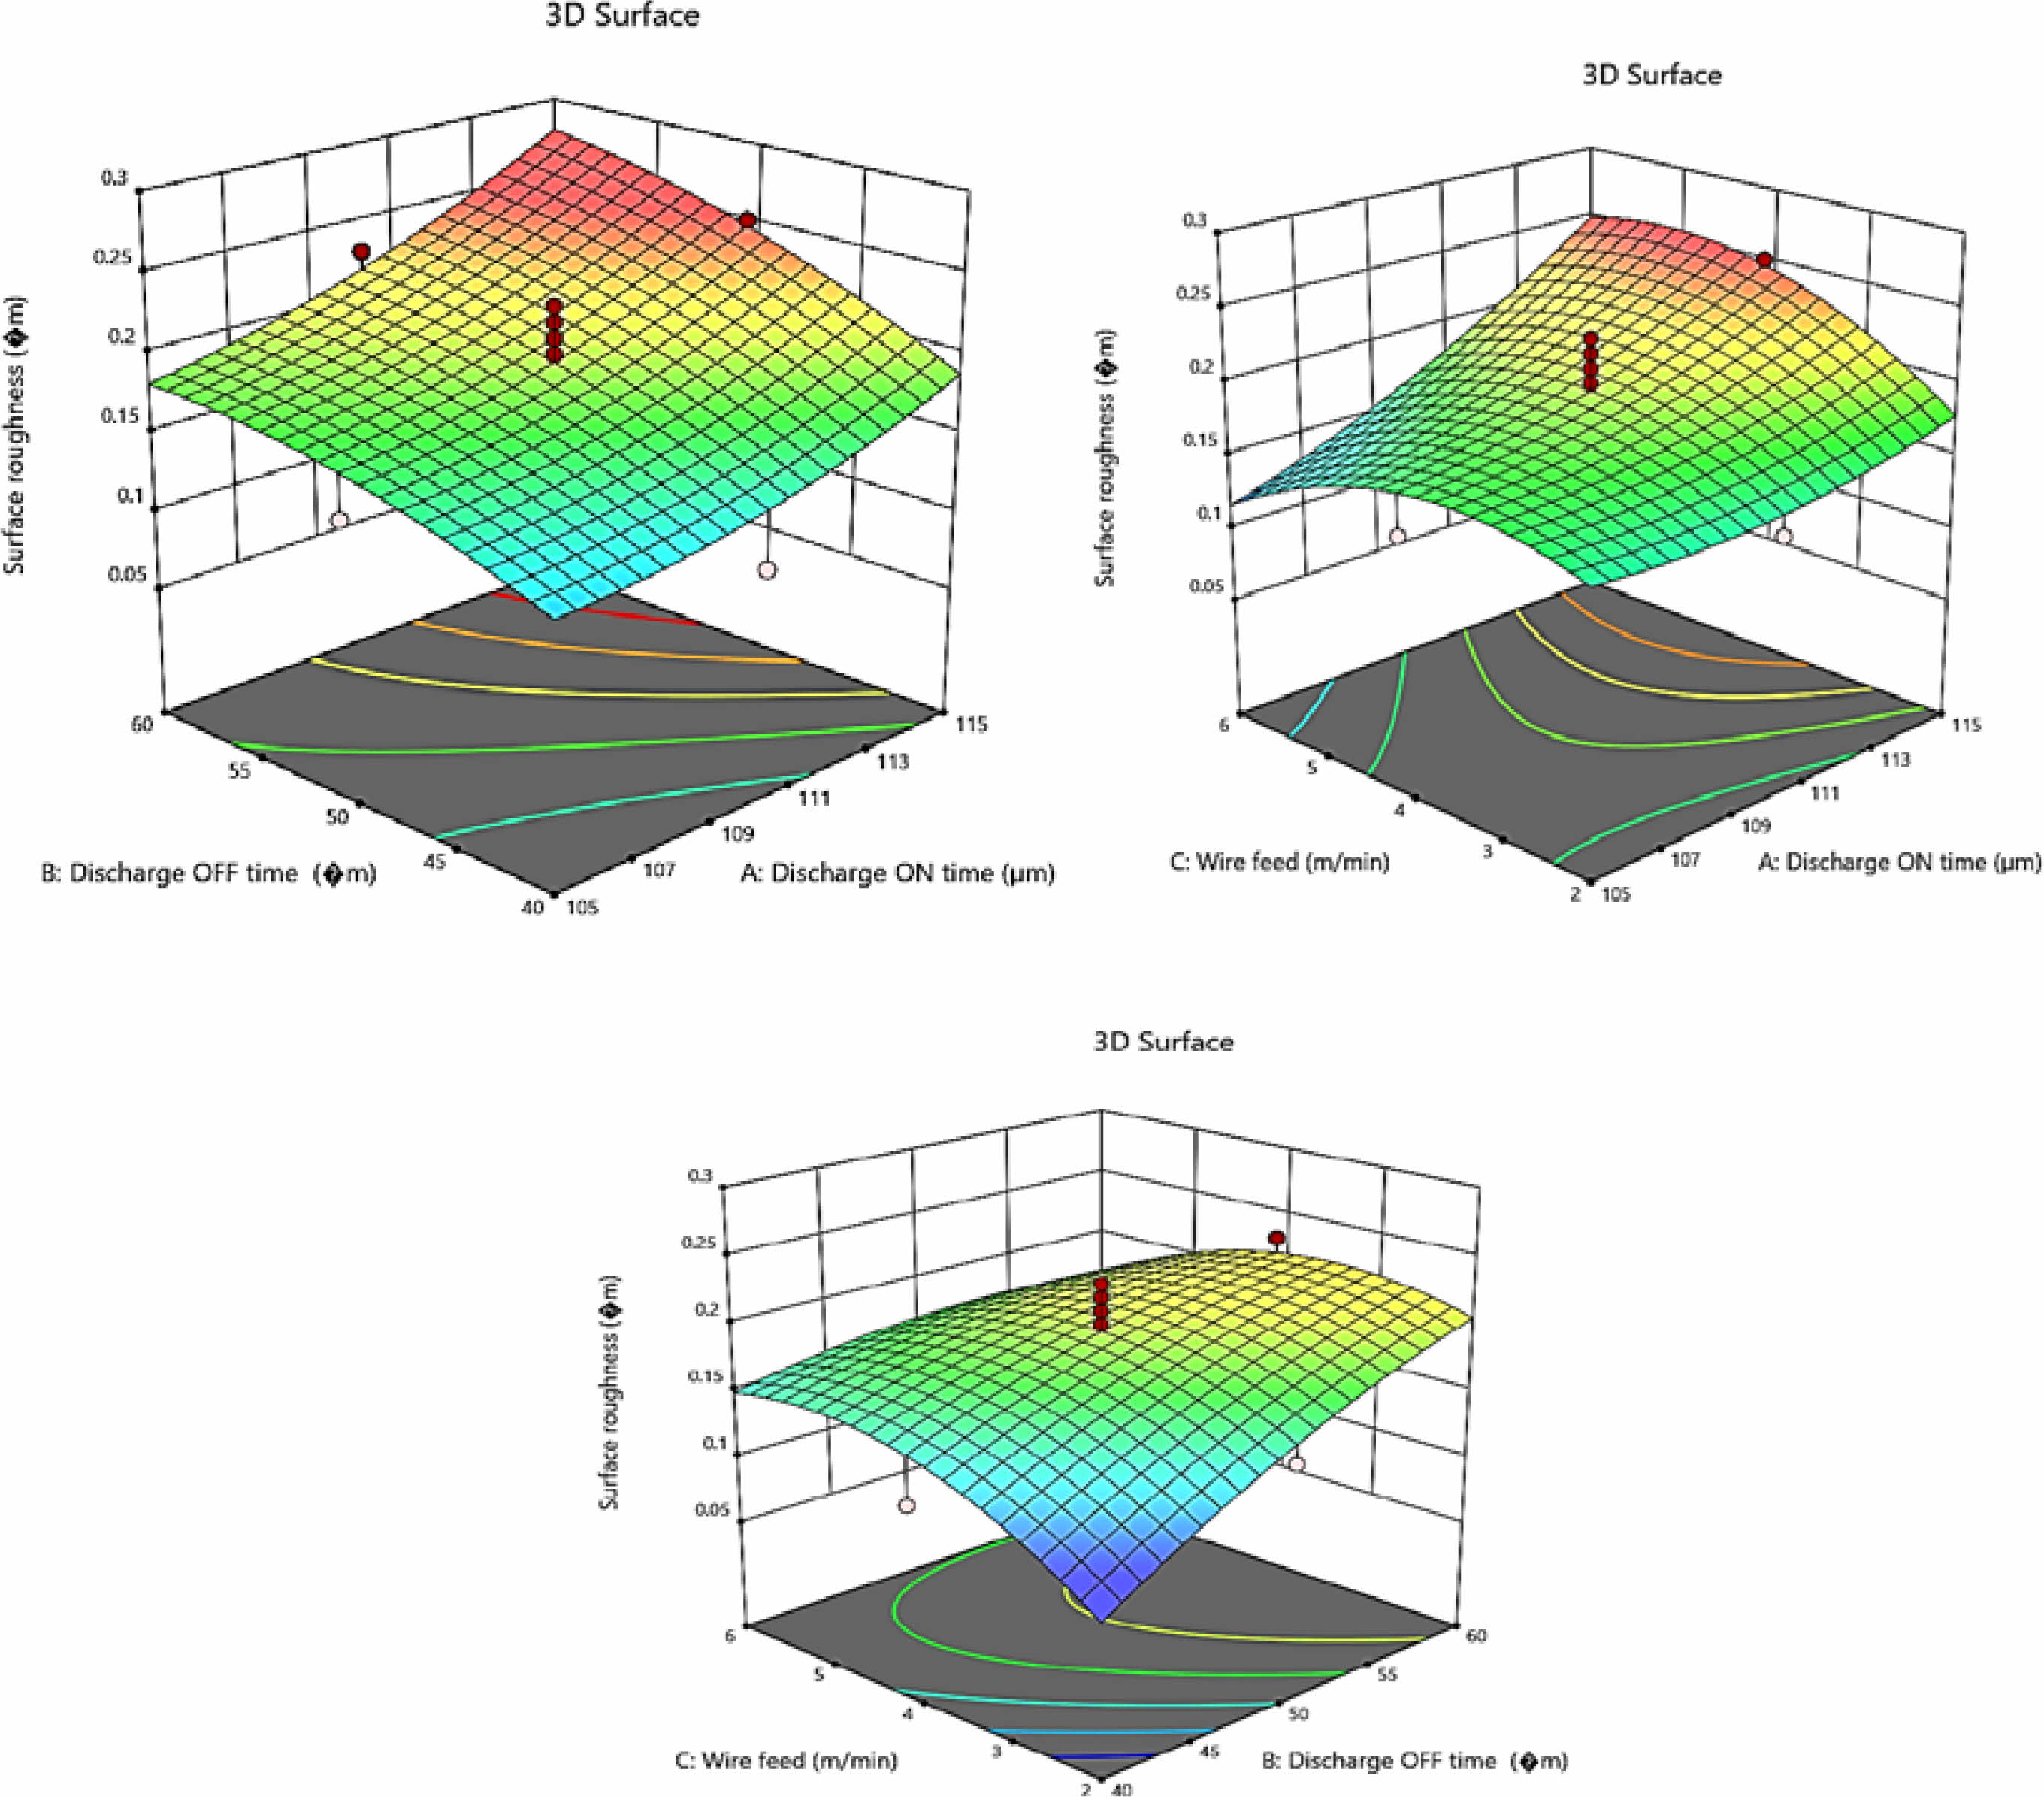
Interaction plot for SR
The interaction effect of the parameters was defined by 2D and 3D counter and surface plot for SR and is shown in Fig. 7(a-c) and 8(a-c). It shows the interaction between discharge on time and discharge off time, discharge on time and wire feed and discharge off time and wire feed . It reveals that increasing the discharge on time led to increase the SR. This is happening because of due to the increase in discharge on time duration that causes more discharge energy onto the work piece and leads to melting the most amount of material and evaporation. However, increasing the discharge on time led to faster the cutting speed and produces higher SR. In other hand, increasing the wire feed led to increase the SR. Three different colors were noticed in both 2D and 3D graphs namely blue, green and red. Blue color denotes the minimum level, green color denotes the nominal and red color denotes the higher level.
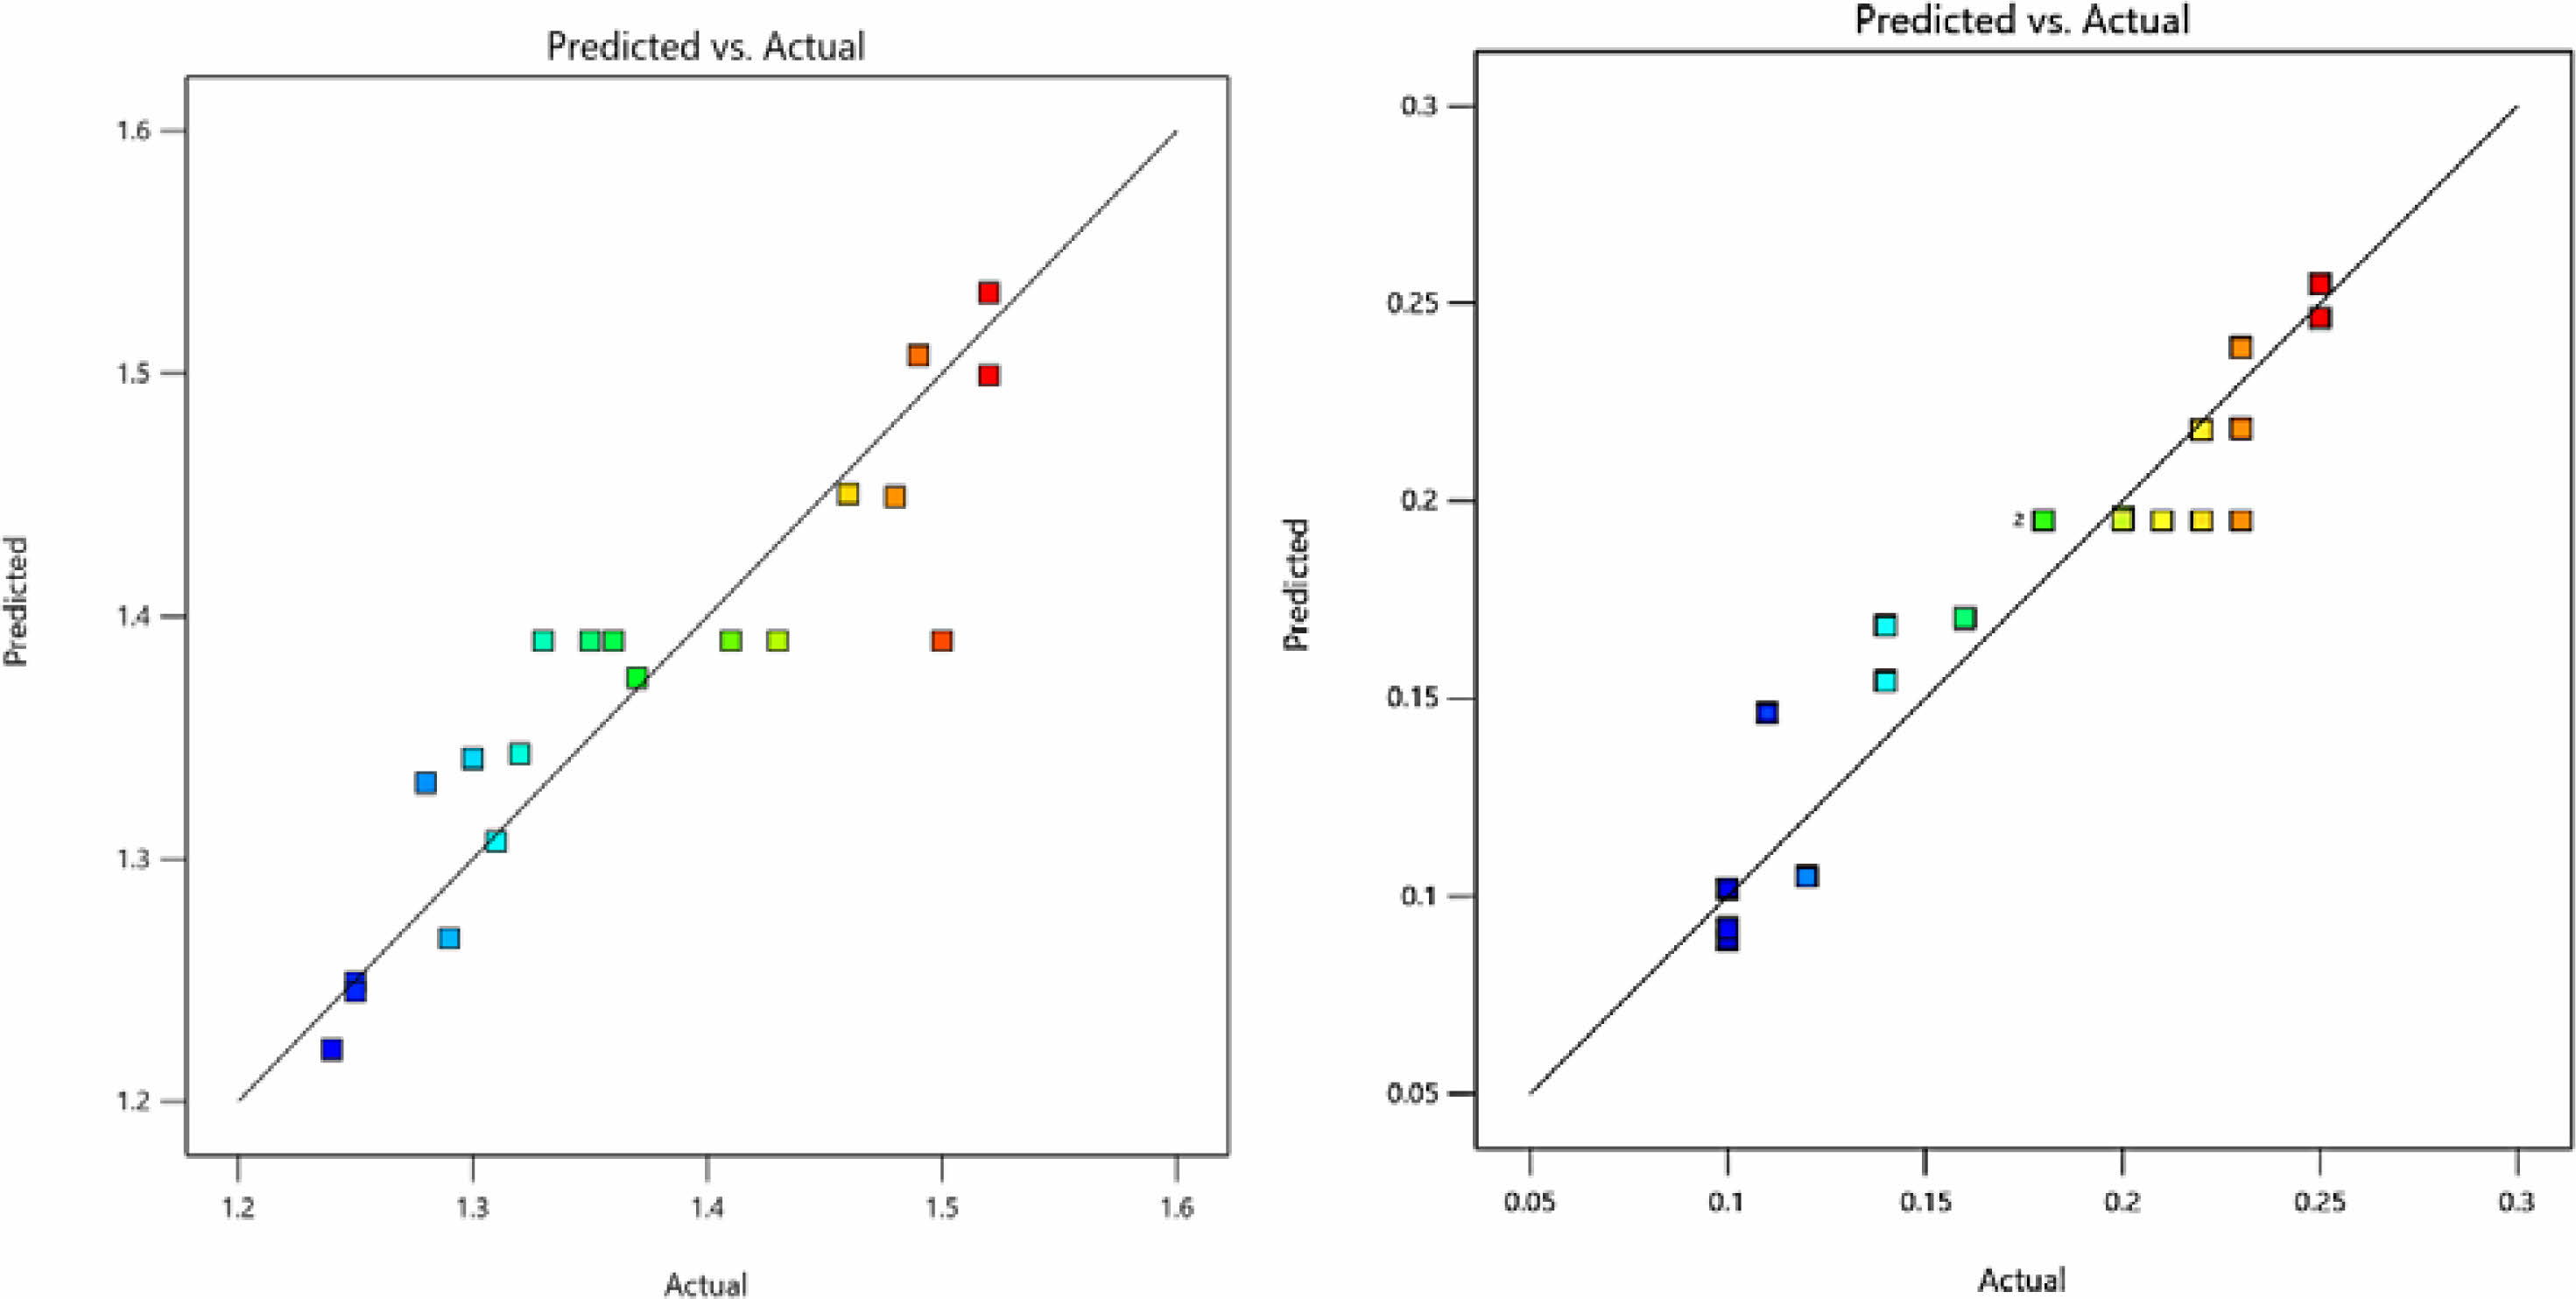
Actual Vs Predicted
The MRR and surface roughness validation plot were shown in Fig. 9 and, it illustrates that minimal data points were scattered outside the straight line. It clearly indicates that the developed model was good agreement with the experimental one. Measuring the actual vs predicted value always some eccentricities are arisen but it is very minimal and it is acceptable.
|
Fig. 1 Sintered Magnesium composites SEM image : 97Mg+ 1.5Ag+1.5 LiAlO2 (Suresh, T. et al., 2022). |
|
Fig. 2 EDS Elemental Line Mapping of 7Mg+1.5Ag+1.5 LiAlO2 (Suresh, T. et al., 2022). |
|
Fig. 3 Perturbation plot for MRR. |
|
Fig. 4 2D contour plot for MRR :(a) Interaction of Discharge ON time Vs Discharge OFF time, (b) Interaction of Discharge ON time Vs Wire feed, (c) Interaction of Discharge OFF time Vs Wire feed. |
|
Fig. 5 3D surface plot for MRR: (a) Interaction of Discharge ON time Vs Discharge OFF time, (b) Interaction of Discharge ON time Vs Wire feed, (c) Interaction of Discharge OFF time Vs Wire feed. |
|
Fig. 6 Perturbation plot for SR. |
|
Fig. 7 2D contour plot for SR: (a) Interaction of Discharge ON time Vs Discharge OFF time, (b) Interaction of Discharge ON time Vs Wire feed, (c) Interaction of Discharge OFF time Vs Wire feed. |
|
Fig. 8 3D surface plot for SR: (a) Interaction of Discharge ON time Vs Discharge OFF time, (b) Interaction of Discharge ON time Vs Wire feed, (c) Interaction of Discharge OFF time Vs Wire feed. |
|
Fig. 9 Actual vs predicted for SR. |
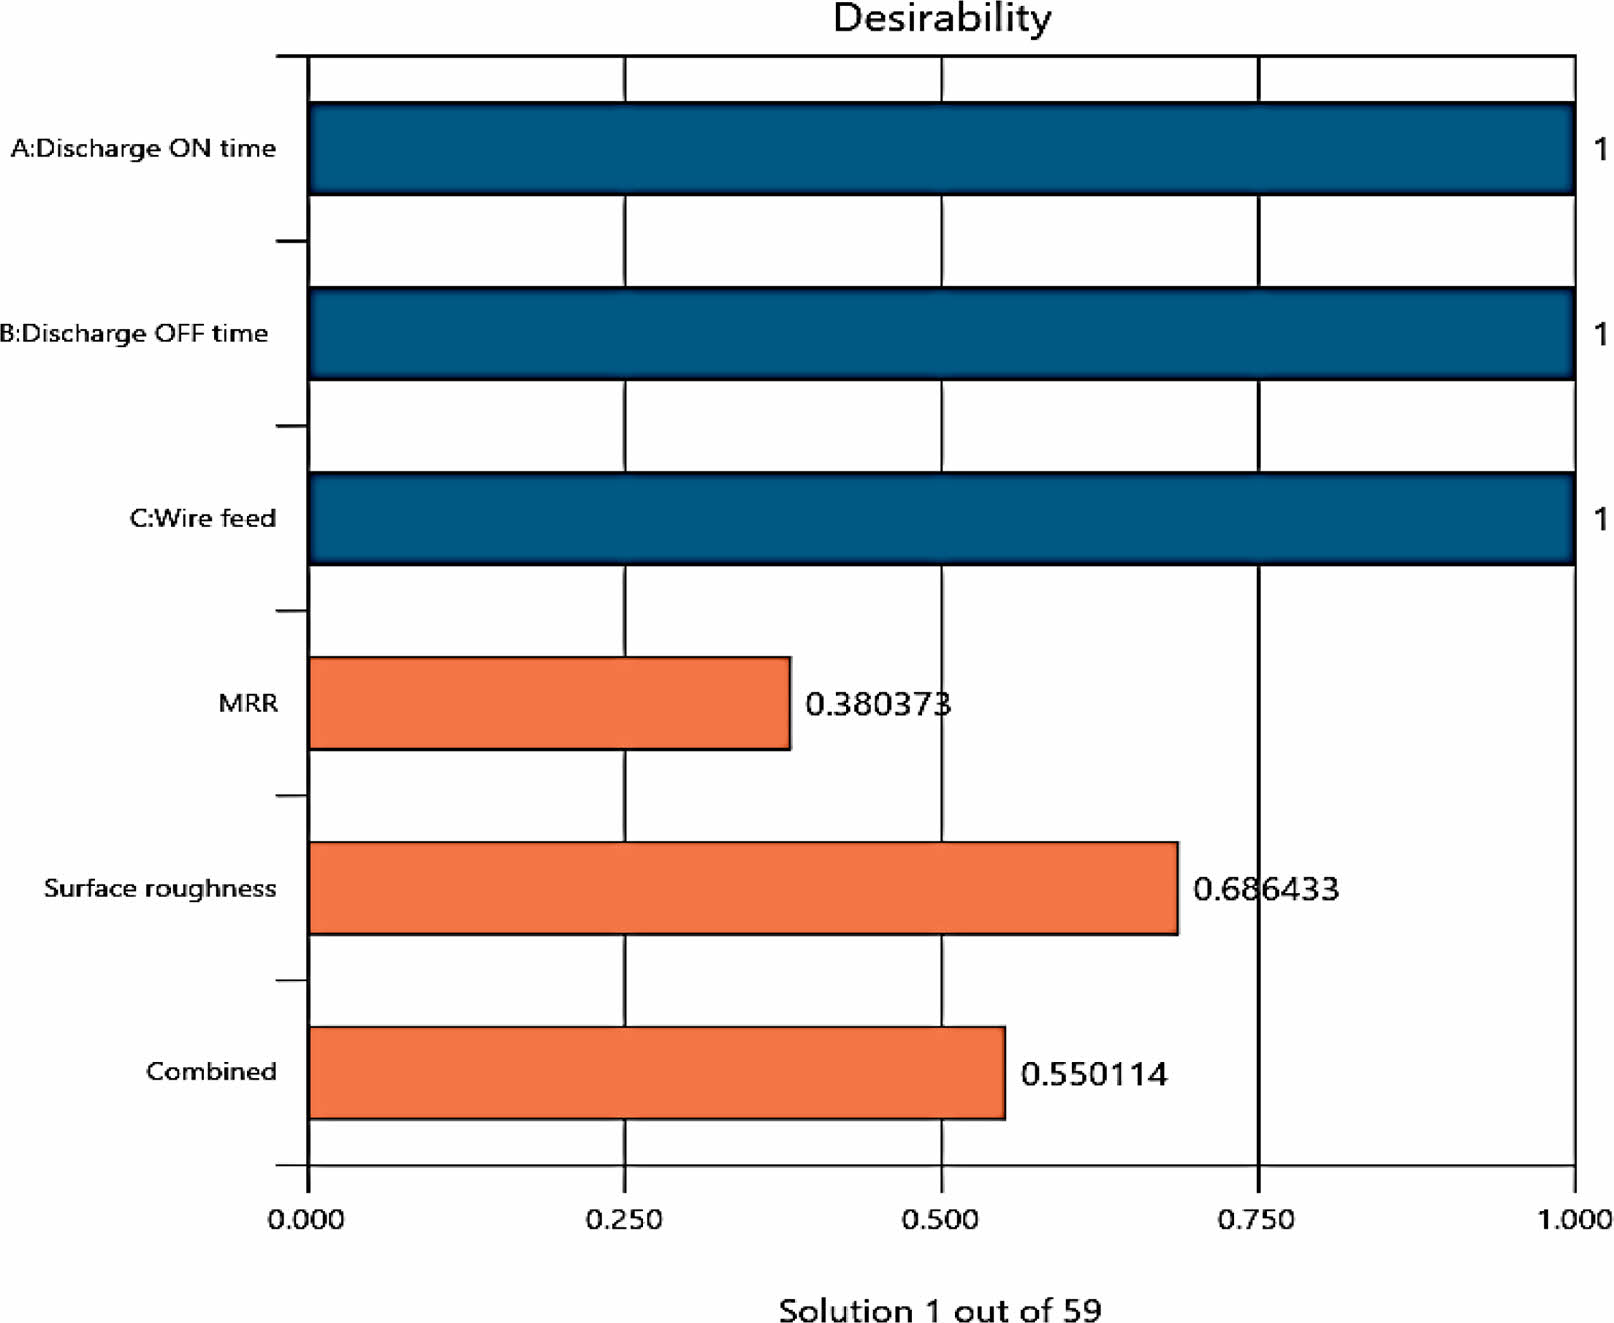
Optimization is normally based on minimization or maximization of the responses. The research is focused on analyse the optimum process parameters for MRR and SR using WEDM process. The process desirability values which varies from 0 to 1.
Desirability function analysis, also referred to as the desirability index or response optimization, is a statistical approach used in experimental design and quality improvement. Its purpose is to help researchers and engineers optimize several variables simultaneously by transforming them into a single desirability score, which quantifies how well specific goals or targets are met.
Determine the parameter settings or conditions that correspond to the highest overall desirability score. These conditions represent the best combination of factors that align with your objectives.
Desirability function analysis finds common use in fields like product design, manufacturing, and process optimization, helping decision-makers find the best trade-off between competing objectives when dealing with multiple variables. It serves as a valuable tool for making informed choices in complex scenarios.
The desirability function analysis equation involves determining how well a response variable meets specified targets or limits. Here’s the equation (1) for calculating the individual desirability score (Di) for a response variable:
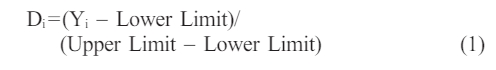
In this equation:
• Yi represents the observed value of the response variable.
• Lower Limit is the lower target or acceptable limit for the response variable.
• Upper Limit is the upper target or acceptable limit for the response variable.
This equation scales the observed value to a range between 0 and 1, where 1 indicates a perfect match with the target, 0 indicates a significant deviation from the target, and values in between reflect varying degrees of desirability.
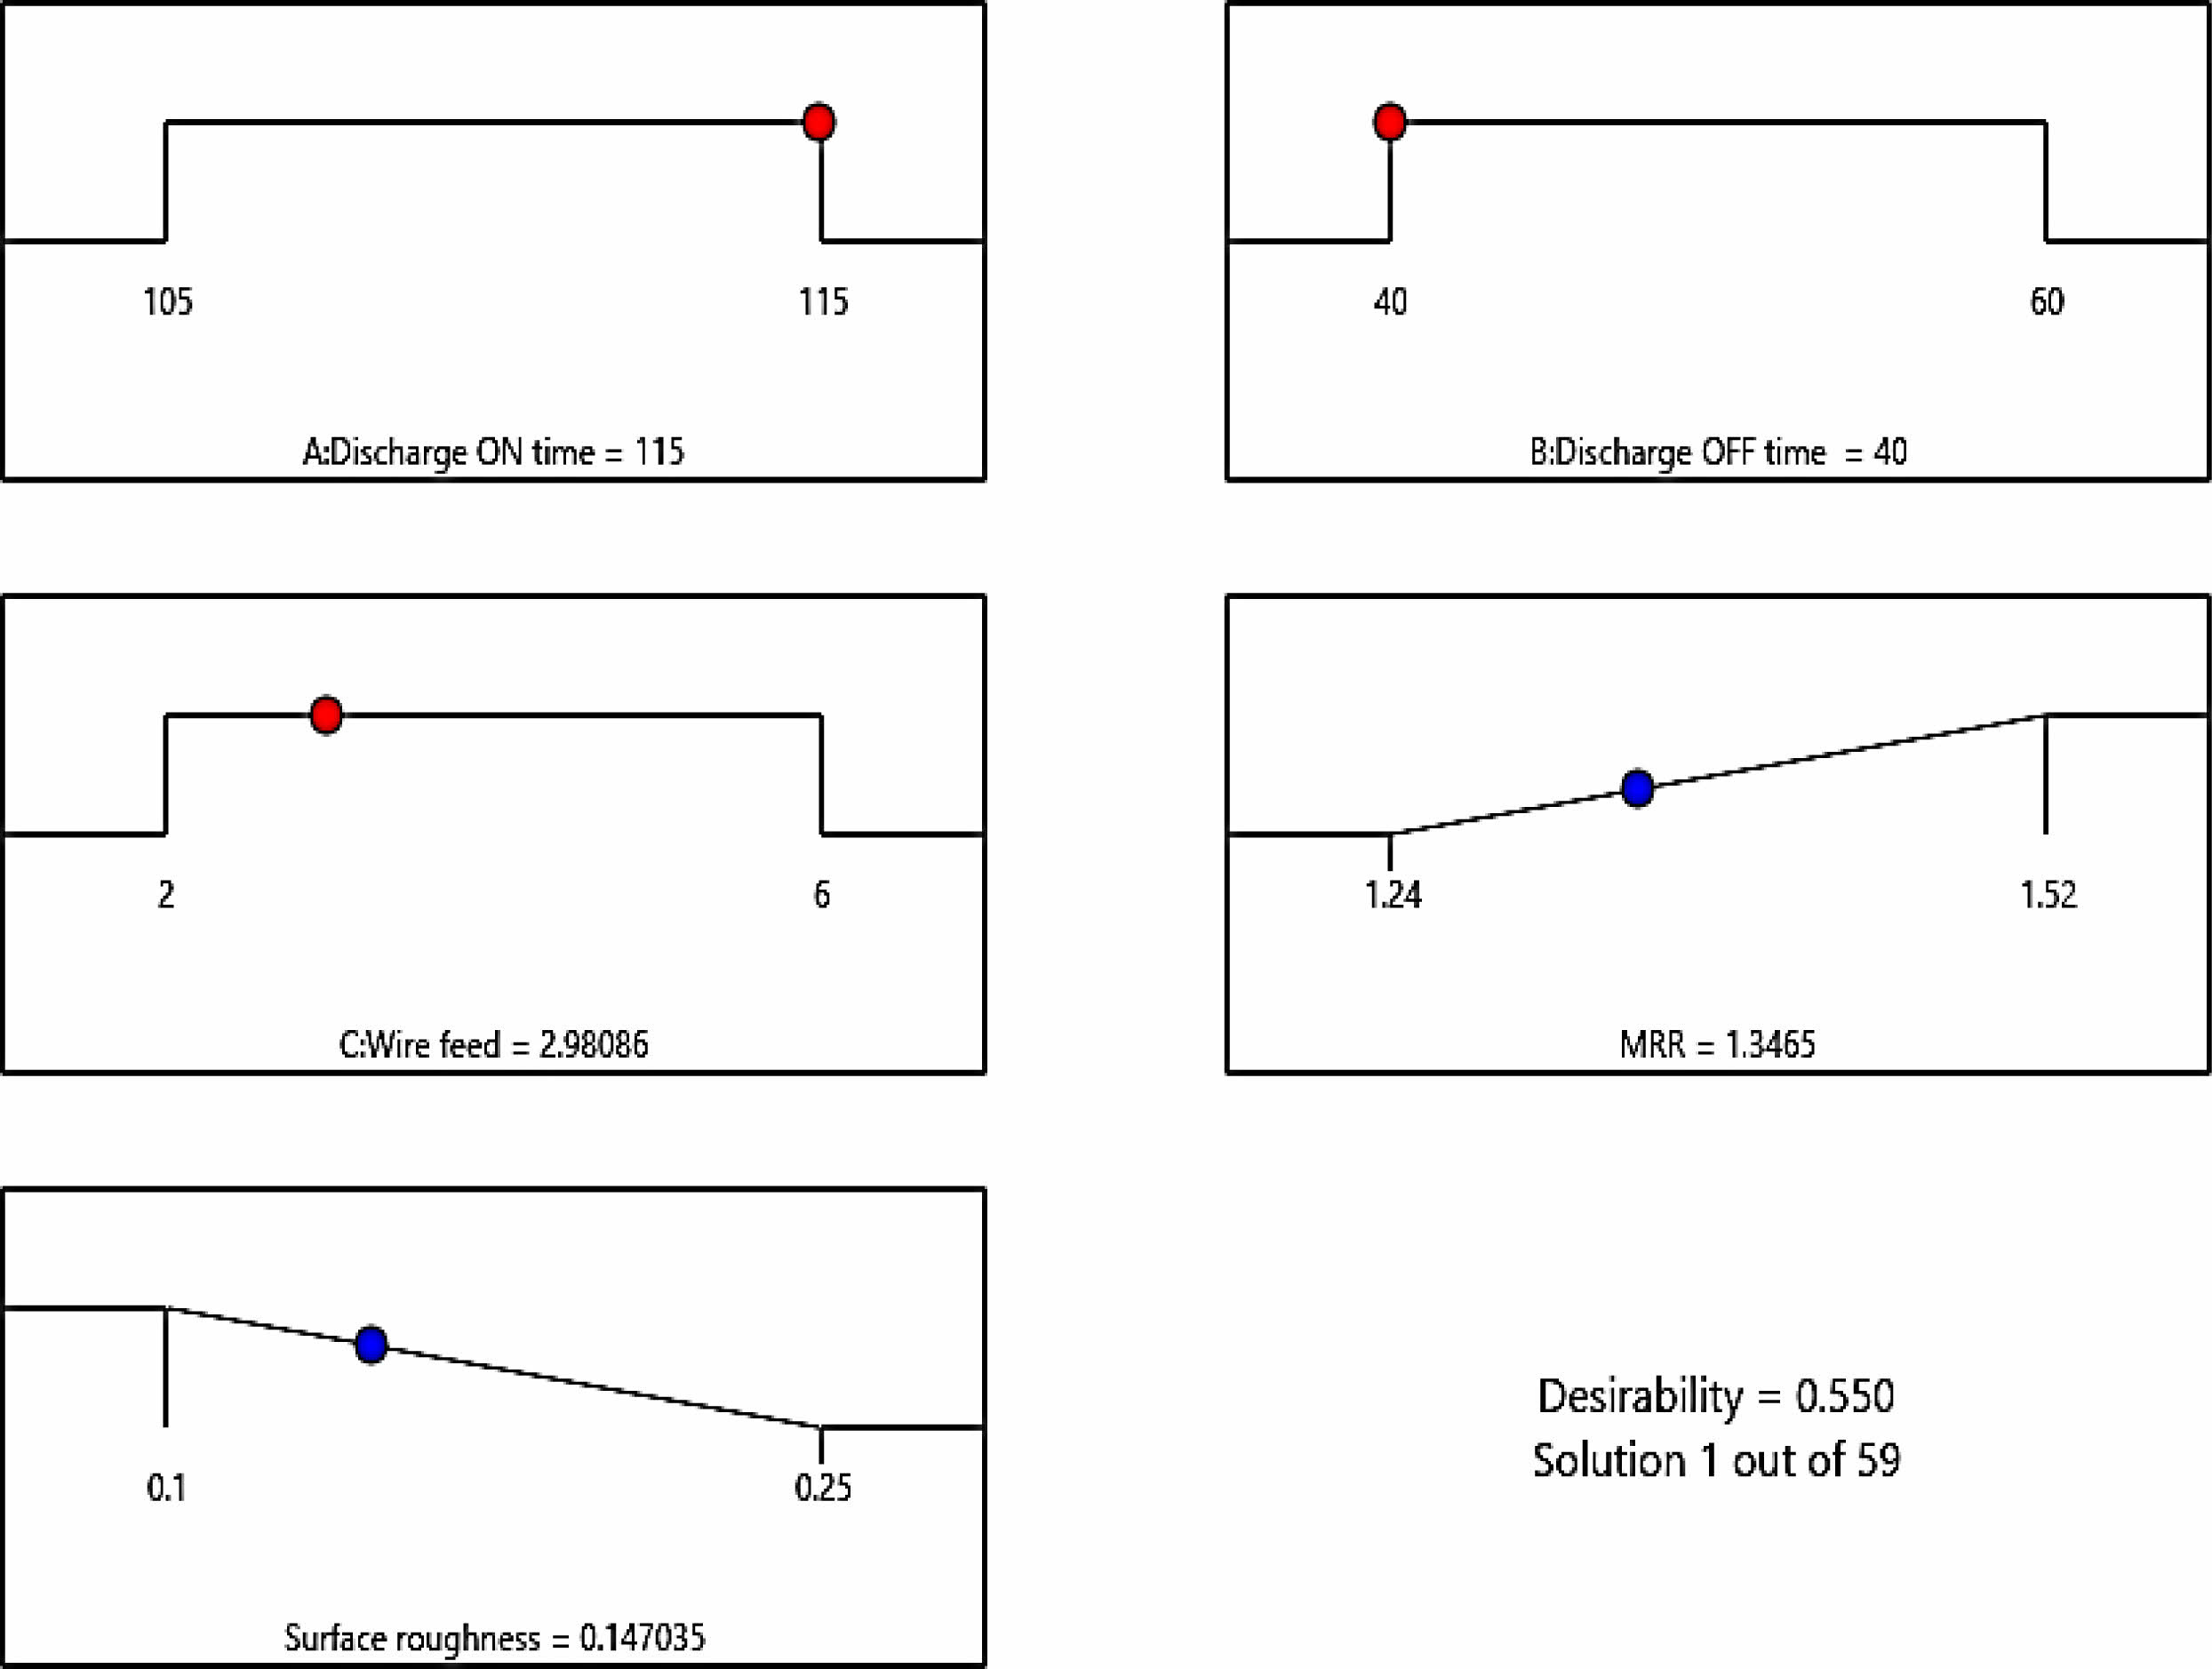
Fig. 10 shows the desirability bar graph and the values obtained from the graph was MRR (38%), SR (68%) and the combined was 55%. The overall desirability indicates each parameter was satisfying the criteria. The ramp plot for all input parameters is shown in Fig. 11 and it illustrates that Discharge on time 115 µm, Discharge off time 40 µm and wire feed 2.98 m/min provides the optimum output responses MRR 1.35 mm3/min and SR 0.15 µm respectively at the desirability ‘D’ of 0.55.
|
Fig. 10 Desirability bar graph for MRR and SR. |
|
Fig. 11 Ramp plot for MRR and SR. |
• SEM microstructure image clearly shows that the secondary particles such as Ag and LiAlO2 are evenly distributed in the magnesium matrix with minimum defects.
• The WEDM process parameters such as discharge on time, discharge off time and wire feed was optimized using RSM. It illustrates that increasing the discharge on time and wire feed led to increase the MRR and SR. Increasing the discharge off time led to decrease the MRR and SR.
• The final optimum value was evaluating using desirability analysis and found the optimum value of discharge on time, discharge off time and wire feed to obtain better MRR and SR.
• The overall ramp plot clearly portrays that Discharge on time 115 µm, Discharge off time 40 µm and wire feed 2.98 m/min provides the effective results in output responses such as MRR 1.35 mm3/min and SR 0.15 µm respectively.
- 1. S. Seetharaman, S. Jayalakshmi, R.A. Singh, and M. Gupta, Encyclopedia of Materials: Composites (2021) 52-77.
-

- 2. X. Zhou, Z. Liu, S.U. Feng, and Y. Fan, Trans. Nonferrous Met. Soc. China 31 (2021) 636-647.
-
- 3. M.R. Parray, N.Z. Khan, and A. Maqbool, Mater. Today: Proc. 46 (2021) 6507-6512.
-
- 4. G.S. Cole and A.M. Sherman, Mater. Charact. 35 (1995) 3-9.
-
- 5. S. Shi, Z. Wang, and. X. Li, Energy Procedia 17 (2012) 1339-1344.
-
- 6. A. Alias, B. Abdullah, and N.M. Abbas, Procedia Eng. 41 (2012) 1806-1811.
-
- 7. S. Sarkar, M. Sekh, S. Mitra, and B. Bhattacharyya, Precis. Eng. 35 (2011) 339-347.
-
- 8. M.T. Antar, S.L. Soo, D.K. Aspinwall, D. Jones, and R. Perez, Procedia Eng. 19 (2011) 3-8.
-
- 9. R. Soundararajan, A. Ramesh, N. Mohanraj, and N. Parthasarathi, J. Alloys Compd. 685 (2016) 533-545.
-
- 10. T.U. Siddiqui and J. Ramkumar, Mater. Today: Proc. 4[9] (2017) 10273-10277.
-
- 11. B. Rajeswari and K.S. Amirthagadeswaran, Measurement 105 (2017) 78-86.
-
- 12. X. Wang, J. Xu, D. Shan, B. Guo, and J. Cao, Mater. Des. 127 (2017) 134-143.
-
- 13. Rajesh Choudhary, Gagandeep Singh, Keshav Kumar, Prakash Bharti, Ramanuj Kumar, and Vikash Kumar, Mater. Today: Proc. 5[9] (2018) 19923-19932.
-
- 14. T. Suresh, P. Suresh, and M. Prabu, Dig. J. Nanomater. Bios. 17[3] (2022) 731-740.
-
- 15. B.K. Matanda, V. Patel, B. Singh, U. Joshi, A. Joshi, A.D. Oza, and S. Kumar, Int. J. Interact. Des. Manuf. (2023) 1-10.
-
- 16. Soori, Mohsen and M. Asmael, Jordan J. Mech. Ind. Eng. 16[2] (2022) 205-223.
- 17. P. Gopal, K.S. Prakash, and S. Jayaraj, Mater. Manuf. Process. 33 (2017) 77-84.
-
- 18. D. Aruri, M. Kolli, S. Kosaraju, and G.S. Kumar, Int. J. Interact. Des. Manuf. (2022) 1-16.
-
- 19. A. Raj, J.P. Misra, D. Khanduja, K.K. Saxena, and V. Malik, Int. J. Interact. Des. Manuf. (2022) 1-11.
-
- 20. S. Bhowmick, R. Mondal, S. Sarkar, N. Biswas, J. De, and G. Majumdar, CIRP J. Manuf. Sci. Technol. 40 (2023) 10-28.
-
- 21. D.S. Prasad, C. Shoba, K.R. Varma, and A. Khurshid, J. Alloys Compd. 646 (2015) 257-263.
-
- 22. K.V. Rao, B. Murthy, and N.M. Rao, Measurement 51 (2014) 63-70.
-
 This Article
-
2024; 25(2): 192-201
Published on Apr 30, 2024
- 10.36410/jcpr.2024.25.2.192
- Received on Sep 9, 2023
- Revised on Feb 29, 2024
- Accepted on Mar 18, 2024
Services
- Abstract
literature review
material and experimental procedure
results analysis
desirability optimization
conclusion
- References
- Full Text PDF
Shared
Correspondence to
- T. Suresh
-
Assistant Professor, Department of Mechatronics Engineering, Kumaraguru College of Technology, Coimbatore, Tamilnadu, India
Tel : +91-9942090470 - E-mail: sureshmc@gmail.com
Clean-Energy Research Institute(CRI), Hanyang University, 222, Wangsimni-ro, Seongdong-gu, Seoul, 04763, Korea
E-mail: jcpr@hanyang.ac.kr