- Review on interfacial properties of SiCf/SiC composites for gas turbine engines
Young-Seok Jeonga,b, Kyoon Choia,* and Ho Gyu Yoonb
aIcheon Branch, Korea Institute of Ceramic Engineering and Technology, Icheon 17303, Korea
bDepartment of Material Science & Engineering, Korea University, Seoul 02841, KoreaThis article is an open access article distributed under the terms of the Creative Commons Attribution Non-Commercial License (http://creativecommons.org/licenses/by-nc/4.0) which permits unrestricted non-commercial use, distribution, and reproduction in any medium, provided the original work is properly cited.
The mechanical behavior of SiC fiber-reinforced SiC composites (SiCf/SiC composites) is influenced by the interfacial properties between the matrix and the fiber. To enhance the performance of SiCf/SiC composites, it is essential to control the interfacial bonding strength by understanding the properties of the interface. This paper reviews how the interfacial properties between the fiber and matrix affect the cracking behavior of SiCf/SiC composites. It investigates the mechanical properties of SiCf/SiC composites in relation to the thickness and microstructure of the interphase. The paper also explores methods for forming an interphase on fibers with complex shapes and summarized techniques for quantifying the crystallization of the formed interphase
Keywords: SiC-fiber reinforced SiC composites, Interfacial properties, Interphase, Quantifying crystallization, Digital image processing
Silicon carbide (SiC) has limited applications in the aerospace field because of its low fracture toughness, despite its low density, wear/ablation resistance, and oxidation resistance. The most effective way to improve the fracture toughness of SiC is to prepare a preform using ceramic fibers and then fill the empty space in the preform with a matrix through an infiltration process. A composite composed of continuous SiC fibers and a SiC matrix is called a SiC fiber-reinforced composite (SiCf/SiC composites). These composites not only improve strain and fracture toughness by combining the matrix and fibers but also maintain excellent mechanical properties for a long time at high-temperature/pressure due to the characteristics of SiC [1, 2]. SiCf/SiC composites with outstanding high-temperature performance are utilized in the high heat regions of aircraft gas turbine engines, as vanes, turbine blades, and nozzles [3-5]. However, as such environments become even more severe, new studies are being conducted to improve the performance of existing SiCf/SiC composites.
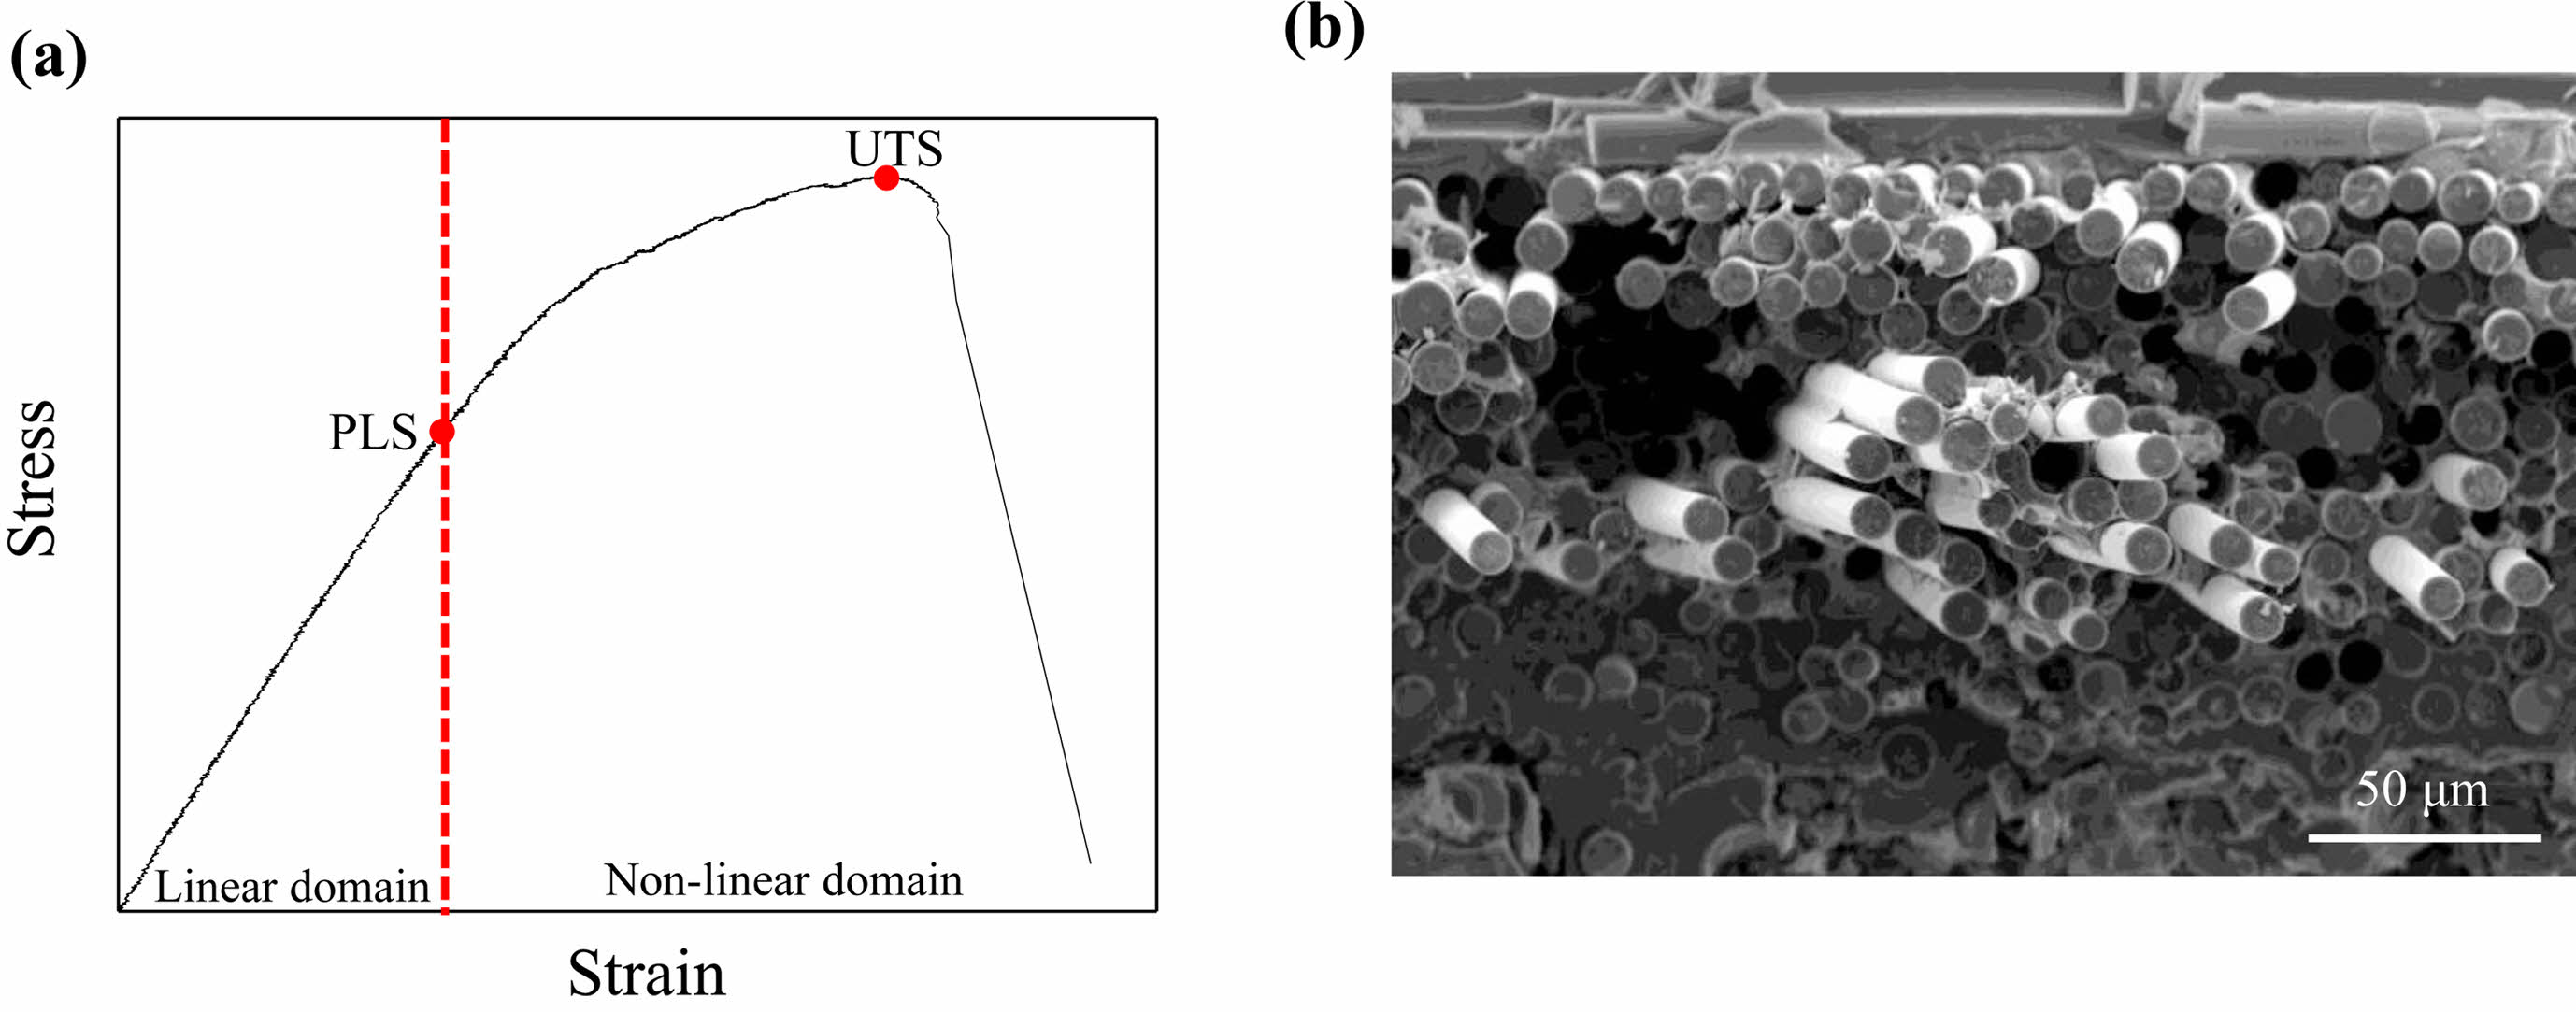
To improve the performance of SiCf/SiC composites, it is first essential to understand the failure behavior of these composites. Fig. 1(a) shows the stress-strain curves of SiCf/SiC composites, which can be divided into linear and nonlinear regions. When the applied load is lower than the proportional limit stress (PLS), microcracks are generated in the matrix of the SiCf/SiC composites, but the linear properties of the SiCf/SiC composites are retained. With further loading, multiple cracks develop in the matrix, resulting in a nonlinear stress-strain curve [6]. The load is transferred from the matrix to the fiber by crack deflection, fiber bridging, and debonding at the interface between the matrix and the fiber. When the stress in the SiCf/SiC composites reaches the ultimate tensile stress (UTS), the fibers finally fail. These failed fibers slide along the debonded interface and are pulled out. During the pull-out process, the kinetic energy of the cracks is either absorbed or dissipated through frictional sliding between the fibers and the matrix. The pull-out fibers can be observed on the fracture surface of the SiCf/SiC composite (Fig. 1(b)). The SiCf/SiC composites can absorb energy through toughness-enhancing mechanisms such as matrix multiple cracks, crack deflection, bridging, debonding and sliding. These mechanisms are influenced by the interfacial properties between the matrix and fibers [7, 8]. Controlling the behavior of cracks at the interface is crucial to improving the mechanical properties of SiCf/SiC composites.
The purpose of this review paper is to investigate the effect of interfacial properties on the crack behavior and mechanical properties of SiCf/SiC composites and to consider the manufacturing and evaluation methods.
|
Fig. 1 (a) Tensile stress-strain curves and (b) pull-out fibers at the fracture surface of SiCf/SiC composites. |
When a load is applied to SiCf/SiC composites, cracks initiate from defects such as pores, unreacted inclusions in the matrix, and two-dimensional defects between the fibers and the matrix. The cracks in SiCf/SiC composites propagate towards the surrounding fibers. The propagated crack may either penetrate or deflect at the interface between the fiber and matrix. Penetration allows cracks to pass through the interface between the fiber and matrix, directly breaking fibers and leading to the catastrophic failure of the SiCf/SiC composites [9]. In contrast, deflection can prevent the catastrophic failure of SiCf/SiC composites by inhibiting the attack on the fibers and delaying crack propagation, using toughness-enhancing mechanisms [10, 11]. Deflection can absorb a significant amount of energy at the interface between the matrix and fiber. Accordingly, crack deflection is necessary to improve the fracture toughness of SiCf/SiC composites, and it can be achieved by controlling the interfacial properties between fibers and matrix.
The cracking behavior of SiCf/SiC composites is dependent on the interfacial shear strength (τ) between the fiber and matrix. A weak interface (low interfacial shear strength) can easily induce crack deflection and absorb crack energy by generating long debonding along the fiber axis, thereby improving the toughness of the SiCf/SiC composite [12]. On the other hand, a strong interface (high interfacial shear strength) results in a shorter debonding length and sufficient load transfer from the matrix to the fibers [13]. This improves the strength of the SiCf/SiC composites. However, too strong bonding can allow cracks to pass through the fibers, leading to catastrophic failure of the SiCf/SiC composites. To enhance both toughness and strength properties it is crucial to appropriately maintain the interfacial shear strength. Anisotropic materials such as pyrolytic carbon (PyC) and hexagonal boron nitride (h-BN) can be introduced as an interphase to control the interfacial shear strength of SiCf/SiC composites. The properties of the interphase and controlling its thickness have a significant influence on the mechanical behavior of SiCf/SiC composites.
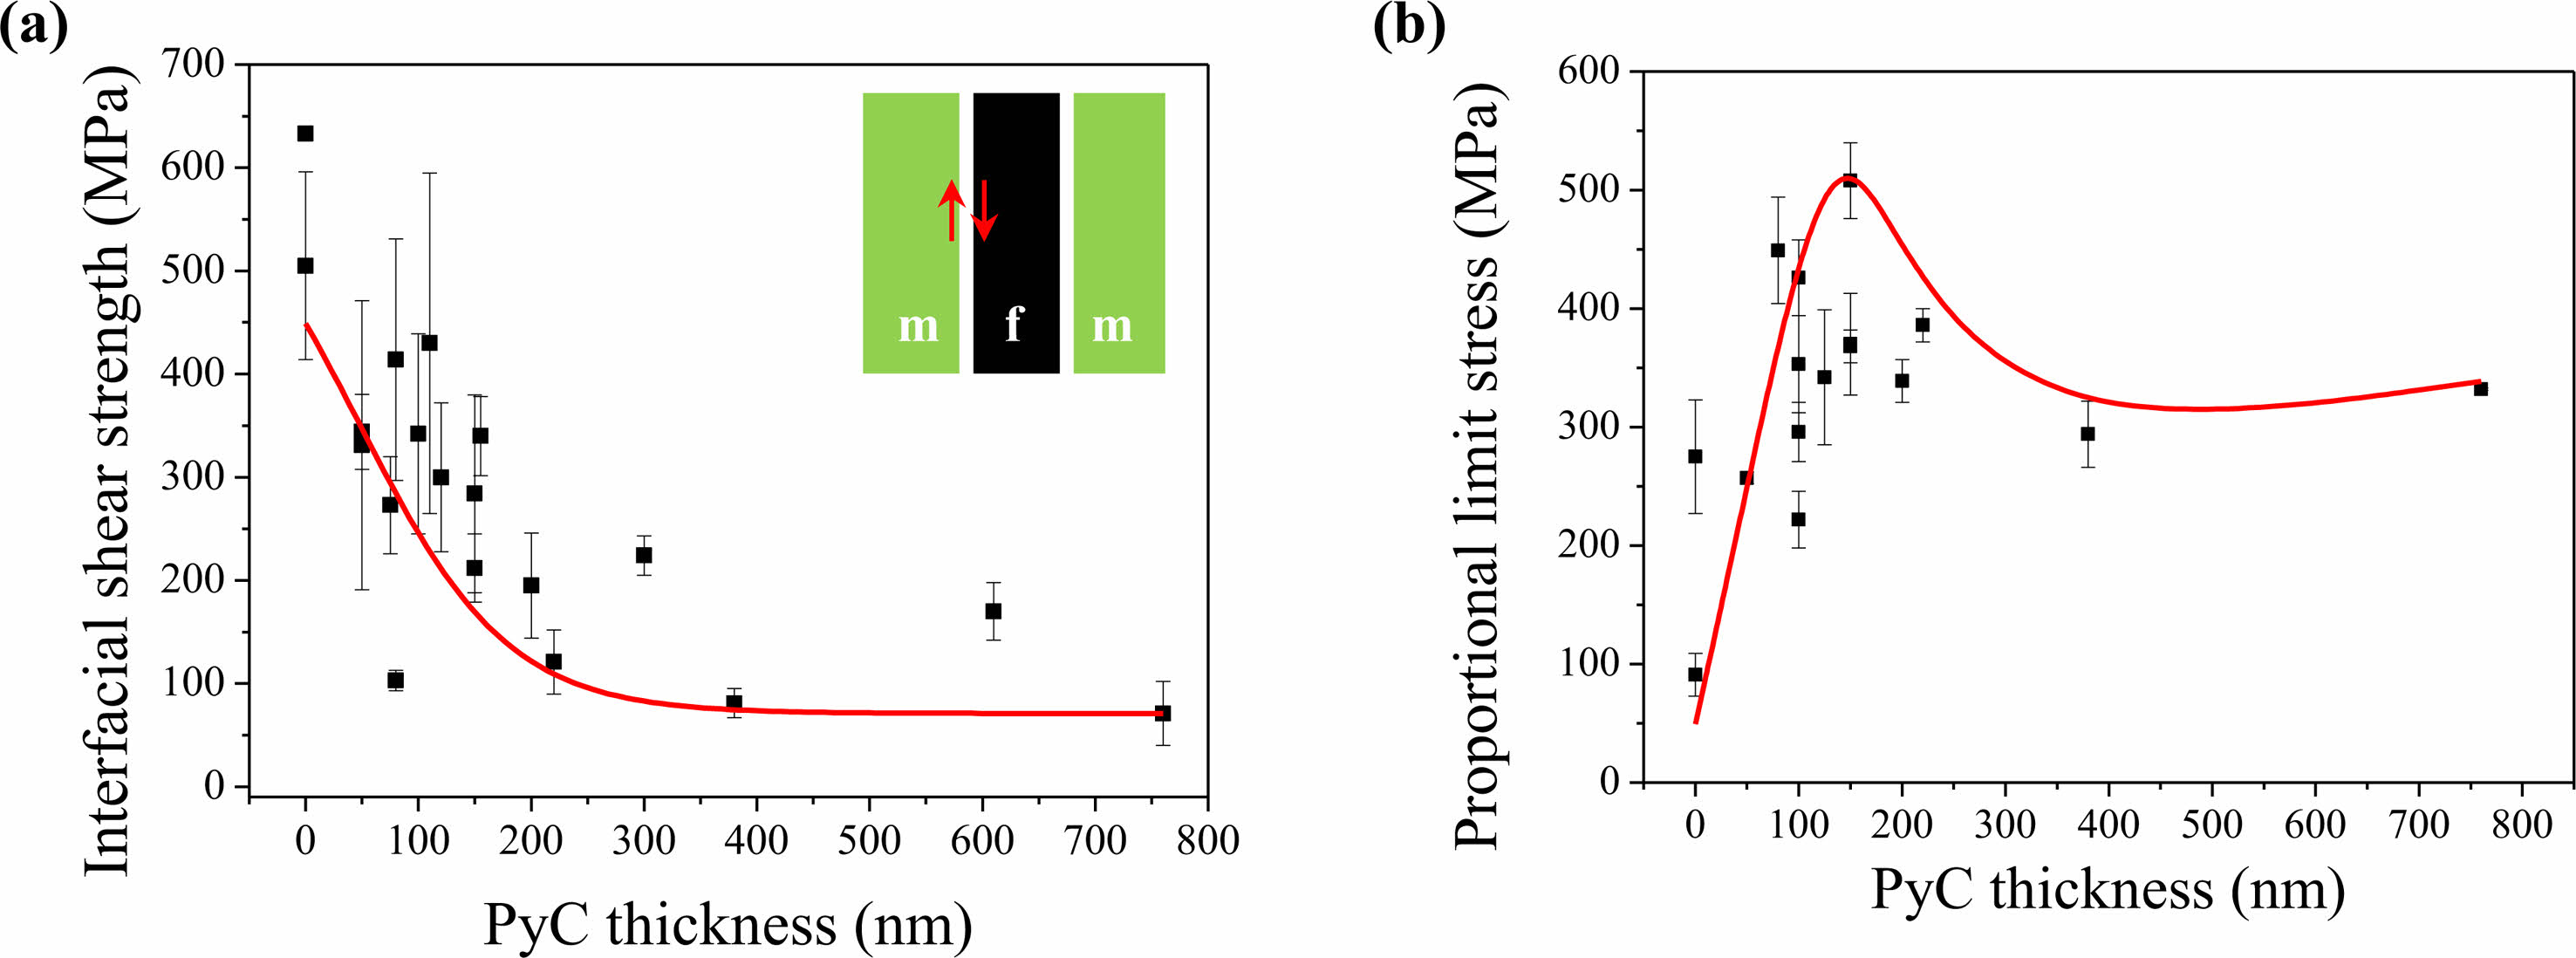
Fig. 2(a) presents the relationship between the interfacial shear strength and PLS with respect to the thickness of the PyC interphase. Initially, SiCf/SiC composites without an interphase suffer crack penetration at the interface because of the strong bonding between the matrix and fibers. To induce debonding or slip at the interface, it is necessary to reduce the interfacial shear strength by introducing an interphase between the fiber and matrix. The interfacial shear strength is dependent on the thickness of the interphase. As depicted in Fig. 2(a), the interfacial shear strength decreased to approximately 100 MPa as the thickness of the interphase was increased from 0 nm to 200 nm. Beyond 200 nm, the interfacial shear strength remained constant. The thickness of the interphase not only impacts the interfacial shear strength but also affects the PLS (Fig. 2(b)). By increasing the interphase thickness to 150 nm, the PLS of SiCf/SiC composites increases rapidly. According to Yang [18], the load-bearing capacity increases by partially sharing the concentrated stress of the matrix with the fibers. The interfacial shear strength is notably reduced at interphase thicknesses above 150 nm. It can easily debond the matrix and fibers at the interface, which greatly reduces PLS [20]. The strength of the SiCf/SiC composite reaches its maximum when the interphase thickness is around 150 nm.
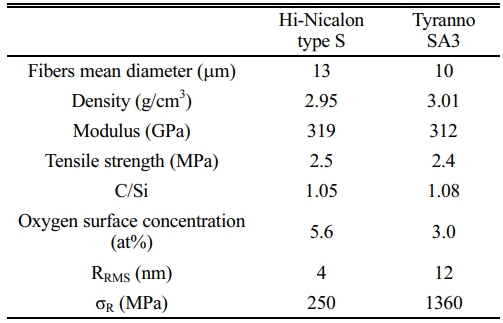
The interfacial properties between the fiber and matrix are influenced by the choice of SiC fiber used as reinforcement. Hi-Nicalon Type S (HNS) and Tyranno SA3 (SA3) are the most commonly used fibers in SiCf/SiC composites, both composed of crystalline SiC with a composition ratio of C/Si close to 1 (Table 1). The oxygen concentration on the fiber surface is also very low. This indicates the absence of a glass layer outside the fibers [23] that could weaken the interfacial bond strength between the interphase and fiber. The fibers generally have similar properties, although the physical properties of these HNS fibers and SA3 fibers are slightly different. The surface of the SA3 fiber is rougher than that of the HNS fiber. This is because the grain size (~400 nm) of SA3 is larger than that of the HNS (~50 nm) [24]. The surface roughness of the SiC fiber affects the interfacial residual stress (σR).
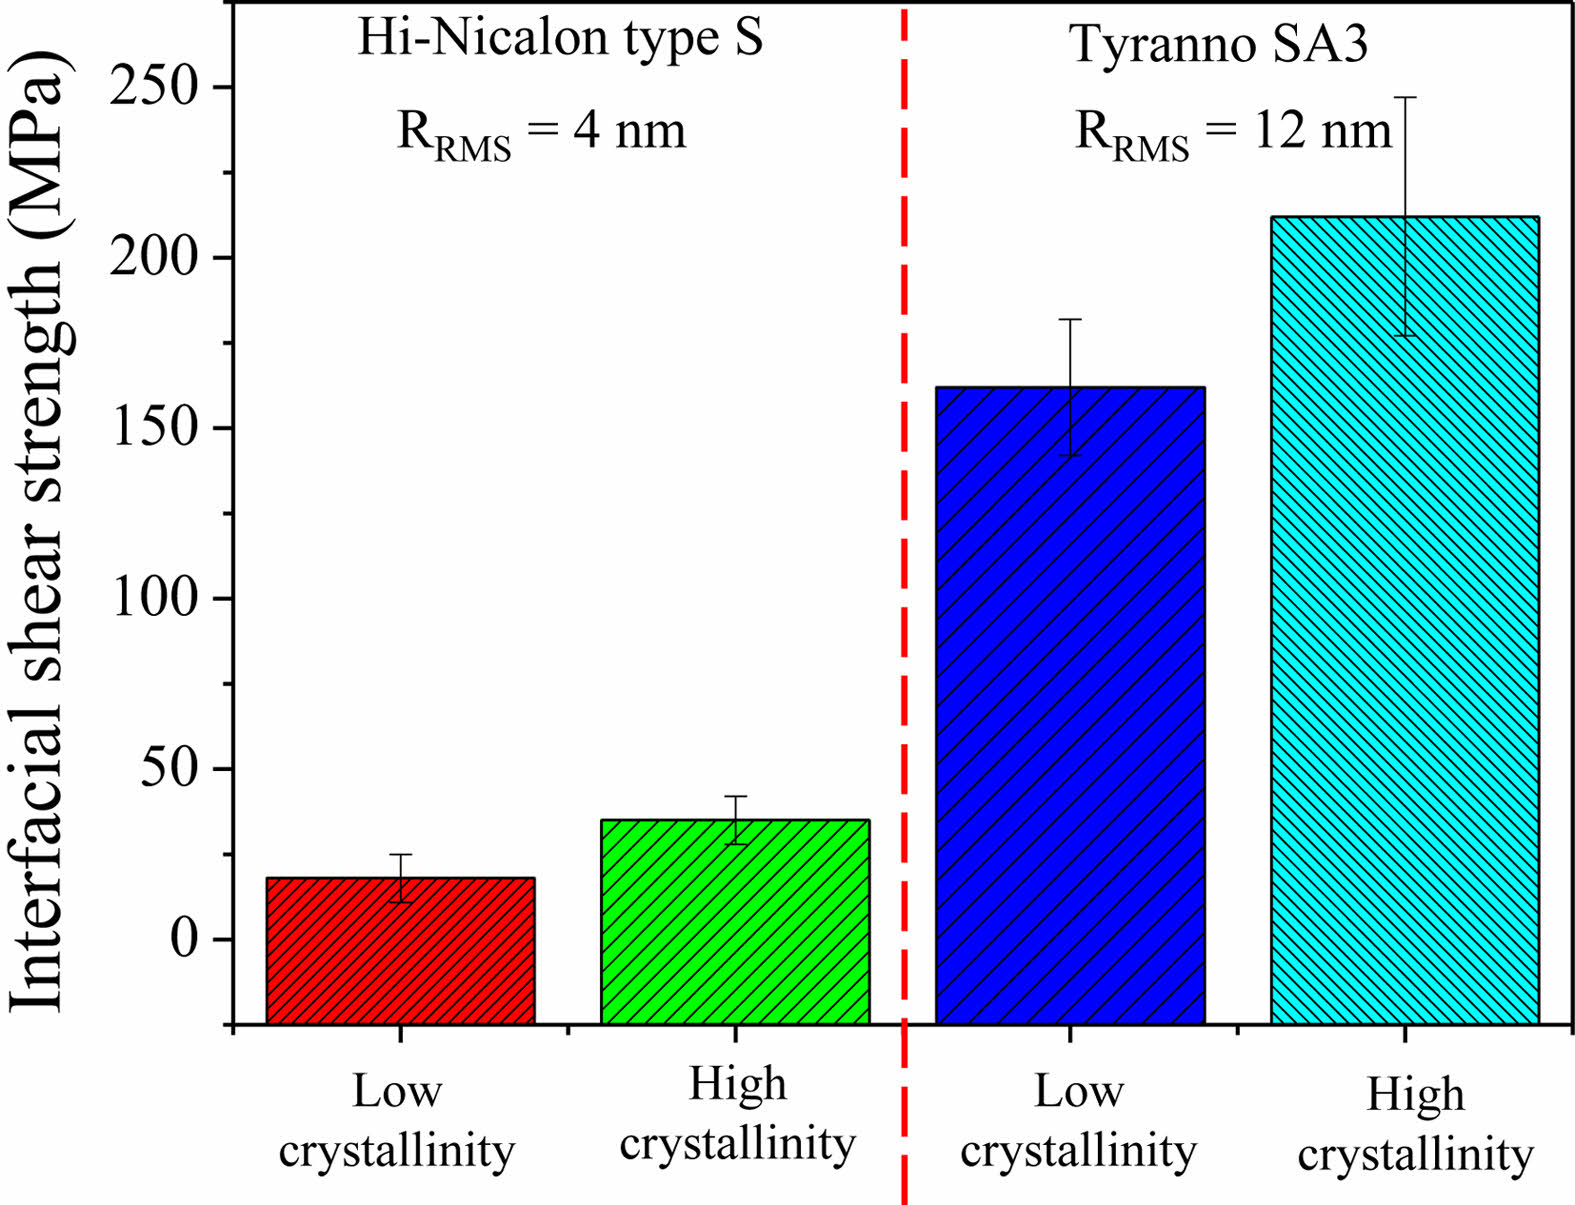
In SiCf/SiC composites, the interfacial residual stress can be categorized into two types: (1) residual stress induced by the difference in thermal expansion coefficient between the matrix and the fiber, and (2) the residual stress caused by the roughness of the fiber surface [25]. Firstly, since the thermal expansion coefficients of the SiC fiber and the SiC matrix are theoretically identical, the contribution of residual stress from thermal expansion mismatch is negligible [22]. Therefore, interfacial residual stress is primarily generated between the fiber and interphase by the surface roughness of the SiC fiber. The broken fibers are mechanically interlocked by the fiber surface roughness at the fiber-interphase during pull-out. This interlocking increases the interfacial shear strength of the fiber and matrix [26]. Consequently, the interfacial shear strength of the SA3 fiber is higher than that of HNS fiber because of its rougher surface (Fig. 3). SiCf/SiC composites with SA3 fiber exhibit excellent mechanical properties [27]. However, since a rough surface can increase the standard deviation, it is necessary to form a sufficiently thick interphase to minimize the effect on the fiber surface roughness. According to Hinoki [28], the effect of fiber surface roughness on the standard deviation can be minimized when the thickness of the interphase ranges from 30 to 200 nm. The mechanical properties of SiCf/SiC composites can be enhanced by applying a PyC layer of 100~200 nm on the SiC fiber when considering only the thickness of the interface. Furthermore, the crystallization of the interphase increases the shear strength regardless of the type of fiber (Fig. 3). This affects the mechanical properties of the SiCf/SiC composites [29].
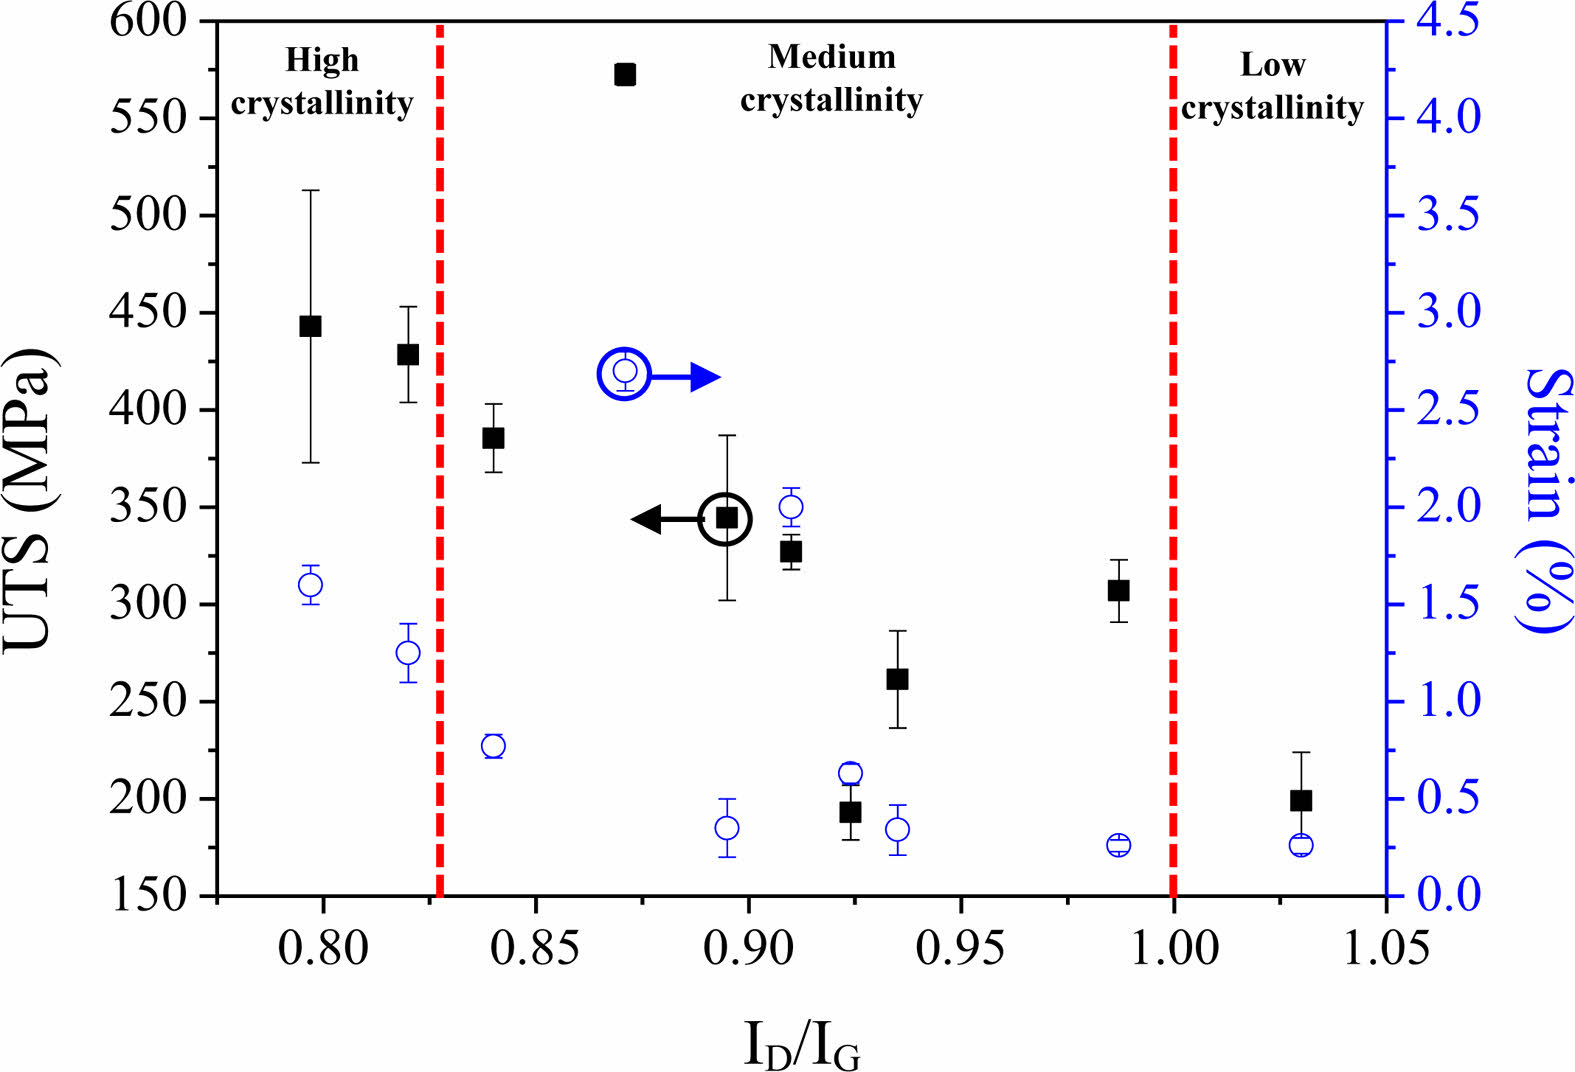
Fig. 4 illustrates the relationship between UTS and strain as a function of the crystallization of the PyC interphase. The crystallization of the PyC interphase can be quantified by ID/IG as extracted by Raman spectroscopy, where a lower ID/IG means high crystallization [31]. As the crystallization of the PyC interphase improves, both UTS and strain tend to increase. This phenomenon is attributed to the occurrence of multi-crack deflection within the interphase. Propagated cracks originating from the matrix are deflected by the anisotropic PyC with weak interplanar bonding strength (van der Waals bonds). They are subsequently deflected again by the anisotropic PyC in other regions. This successive deflections of cracks delays crack propagation, and crack kinetic energy is absorbed and dissipated. The load is transferred from the matrix to the fibers via the interphase. The strength of the SiCf/SiC composites is enhanced [32]. Additionally, crack deflection within the interphase results in cohesive failure, leading to pulled-out fibers with a rough surface. Cohesive failure helps to protect the fibers from being damaged by external oxidants [33]. In this way, the mechanical properties of SiCf/SiC composites can be enhanced by controlling the crystallization of the interphase.
|
Fig. 2 The interfacial shear strength (a) and proportional limit stress (b) of SiCf/SiC composites dependent on the thickness of PyC interphase [14-19]. |
|
Fig. 3 Interfacial shear strength of SiCf/SiC composites dependent on SiC fiber roughness and crystallization of the interphase (PyC thickness: 150 nm) [22]. |
|
Fig. 4 Variations in the UTS and strain by crystallization of the PyC interphase [30]. |
For interphase coating, dip coating and chemical vapor deposition (CVD) methods are mainly used. Dip coating is a method in which a preform is immersed in a solution, and then the fiber surface is covered with a precursor layer, and finally heat treated to form an interphase. This method is very simple and can easily and quickly coat large samples. However, there are several problems that need to be addressed to successfully implementation of dip coating in SiCf/SiC composites. Firstly, it is difficult to form an interphase with a uniform thickness on the fiber surface, and the space between the fibers is filled with the precursor after heat treatment. Secondly, the interphase coated on the SiC fiber is generally amorphous and requires heat treatment at high temperature to improve crystallization. Lastly, during cooling after heat treatment, peeling-off or microcracks can occur due to the difference in thermal expansion coefficient between the fiber and the matrix [34, 35]. These problems deteriorate the mechanical properties of the SiCf/SiC composites.
CVD is a method in which reactive gas decomposed at high temperature moves to the fiber surface by diffusion and then forms an interphase by a chemical reaction on the fiber surface. Among the CVD methods, the hot-wall type low pressure CVD (LPCVD) method is commonly employed to form an interphase because it offers several advantages. Firstly, it imposes fewer restrictions on the shape and size of the fiber preform as it forms a wide hot zone in the chamber. Secondly, it enables the formation of a uniform interphase thickness on the fiber by maintaining a constant temperature and pressure throughout the preform. Lastly, it does not cause chemical or mechanical damage to the fibers. However, the thickness of the interphase is not uniform, because when the reaction occurs throughout the preform deposition occurs preferentially on the external surface of the preform fiber. To obtain a uniform interphase layer, research is being proposed to optimize process conditions such as precursor concentration, temperature, and pressure.
Zhang et al. [36] conducted an analysis of PyC uniformity and crystallization within the preform by controlling the temperature and the partial pressure of methane. The uniformity of PyC depended on the temperature, regardless of the methane partial pressure. The condition with the most uniform thickness was at process temperatures of 1070 ℃ and 1095 ℃. The crystallization of PyC layer had improved in the range of 9.5 kPa (71 Torr) to 11 kPa (82 Torr) at 1095 °C. The crystallization of PyC decreased as the partial pressure and temperature decreased, which according to the authors, is related to the growth mechanism of carbon. Jeong et al. [37] compared the dependence of the thickness and crystallization of the PyC on the concentration of methane in the hydrogen. They observed that regardless of methane concentration, PyC was uniformly formed in the preform. However, the deposition rate was faster at 100% methane concentration. It was predicted that when hydrogen was used as a diluent gas, it inhibited the growth of the PyC layer [38]. Methane concentration also affects crystallization, which can be predicted as a ratio of C/H. At low C/H ratios the carbon atoms are actively rearranged on the fiber surface, and the PyC layer grows into a graphite-like structure [39]. In contrast carbon atoms at high C/H ratios form reactants in the gas phase. The reactants are adsorbed on the fiber surface to form an irregular PyC layer [40]. Thus, the uniformity and crystallization of PyC can be improved by controlling the C/H ratio.
h-BN can be deposited from BF3-NH3 or a BCl3-NH3 system at low temperature and pressure. The BF3-NH3 system can form a highly oriented BN interphase in the range of 1100~1200 °C [33] although the maximum thermodynamic yield is up to 15% [41]. But unreacted BF3 and reactant HF in the gas phase etch the fiber surface and chemically attack the fiber, leading to a degradation in the physical properties of the SiCf/SiC composites [41, 42]. The BCl3-NH3 system has a higher thermodynamic yield than the BF3-NH3 system and can form a BN interphase at a relatively low temperature for a short time [41]. The coated BN is amorphous and has an uneven thickness in the preform due to the fast deposition rate [41, 43]. Therefore, the BCl3-NH3 system requires compromising the BN deposition rate and crystallization by controlling the process temperature, pressure, flow ratio of the reaction gas (QNH3/QBCl3), and the concentration of the diluent gas.
Nyutu et al. [44] analyzed the effect of process parameters on the BN deposition rate in the BCl3-NH3-H2 system. They found that the deposition rate of BN was gradually faster as QNH3/QBCl3 increased. It also reached maximum when QNH3/QBCl3 and temperature were 1.6~1.9 and 900~950 ℃, respectively. Leparoux et al. [43] studied the uniformity and crystallization of BN by adjusting the flow rate of the reaction gas in a BCl3-NH3-H2 system at 700 °C. They observed that the thickness of BN was uniformly deposited at a low partial pressure of BCl3, and the crystallization improved as the total flow rate of reactant gas decreased. This means that the growth of BN is dominated by the flow of BCl3. A low partial pressure of BCl3 in an excess of NH3 slows down the deposition rate of BN and improves crystallization [45, 46]. BN grown in excess NH3 has crystal defects inside, which improves crystallization during heat treatment. Gallet et al. [47] reported that the crystallization of BN exposed to air improves after heat treatment. BN absorbs moisture to produced BH3 and H2BO3 reactants during the heat treatment process, which promoted the rearrangement of the BN crystal plane [47-49]. Fig. 5
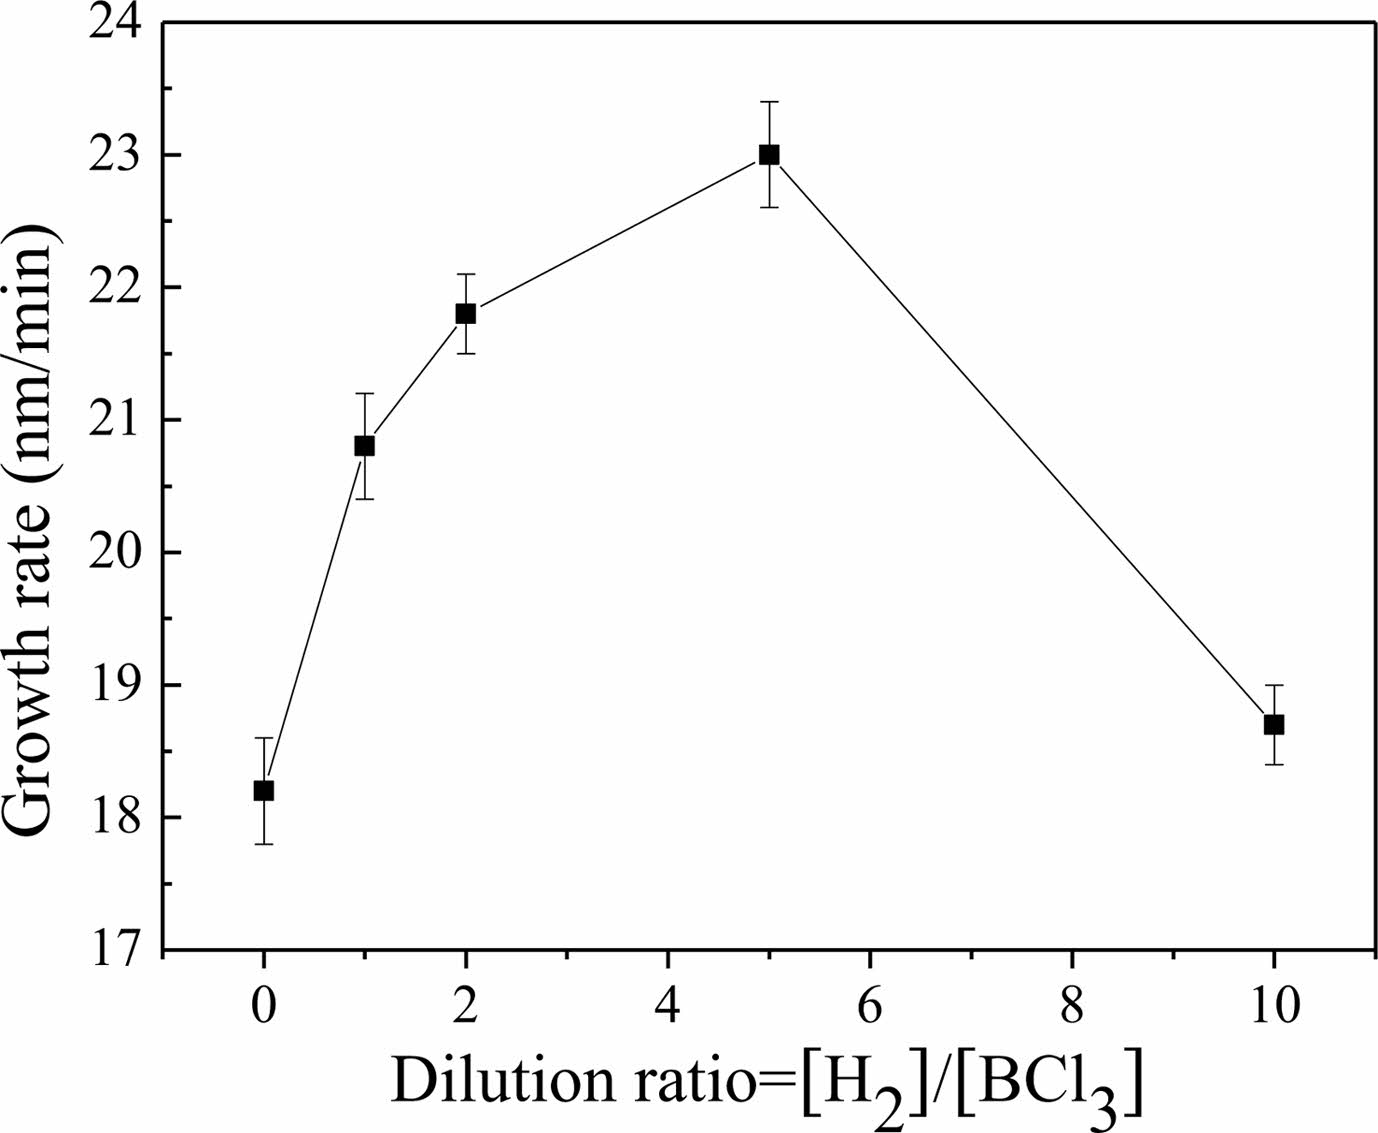
Dai et al. [50] investigated what effect the ratio of dilute gas had on the deposition rate of BN in the BCl3-NH3-H2 system, as shown in Fig. 6. The dilution gas ratio was defined as the ratio of H2 to BCl3. BN deposited without diluent gas H2 had a deposition rate of 18 nm/h and had a very rough surface and was amorphous. The introduction of H2 diluent gas increased the growth rate of BN. The growth rate of BN was maximized when the dilution gas ratio was 5. Simultaneously, the crystallization of BN was improved. However, the excessive injection of H2 gas reduced the growth rate and degraded crystallization. Therefore, to improve the growth rate and crystallization of BN, the ratio of dilution gas ratio should be appropriately adjusted.
As can be seen in Table 2, the crystallization of BN depends on the nature of the dilution gas. To evaluate the crystallization of BN, the parameters L002 (space between planes), LC (crystal size of stacked layers), and η (asymmetry) were used, where η represents the degree of randomly stacked layers. The crystallization of BN improves as η approaches 1. The crystallization of BN in dilution gas Ar was improved compared to that in H2. This is because the intermediate reactants depend on the nature of the dilution gas [51]. Dilution gas H2 reacts with BCl3 to produce BHCl2(g) as an intermediate reactant, which degrades crystallization. In contrast, BCl3 and NH3 react in the inert gas Ar to produce Cl2BNH2(g) as intermediate reactants, and these reactants are adsorbed onto the fiber surface, improving the crystallization of BN.

|
Fig. 5 (a) The growth rate of PyC for each preform position at 5% and 100% methane concentration, and microtextures of PyC formed with methane concentration of (b) 5% and (c) 100% [37]. |
|
Fig. 6 The growth rate of BN dependent on the dilution ratio in the BCl3-NH3-H2 system. |
|
Table 2 Comparison of the crystallization of BN dependent on the nature of the dilution gas [51]. |

PyC or BN, which have low inter-plane bonding and strong intra-plane bonding, are the most widely used and effective materials for SiCf/SiC composites, but are mostly formed in turbostratic structures. Turbostratic structures consist of nanodomains composed of sp2 carbon which exist in a carbon matrix hybridized with sp2 and sp3, and sp3 bonded carbon atoms. This involves the bending of graphene layers, disordered stacking, and increasing interplanar spacing [52, 53]. As shown in Fig. 7(a), the regularly stacked regions within the nanodomains can be defined by lattice constants, which include the size of the in-plane graphite crystals (La), the size of the stacked layer (Lc), and the inter-plane spacing (L002) [54]. The crystallization of turbostratic structures can be quantified, and is dependent on the degree of disorder in domain alignment within a certain size. A well-oriented anisotropic structure, such as highly ordered pyrolytic graphite (HOPG), is a form in which domains made up of a certain size are aligned parallel to the basal plane. The turbostratic dependence on the disorder of nanodomains can be classified as Low texture (LT), medium texture (MT), and high texture (HT) (Fig. 7(b)).
The crystallization of the turbostratic structure can be confirmed by XRD, Raman spectroscopy, high-resolution transmission electron microscopy (HRTEM), and selected area electron diffraction (SAED). XRD measurements conducted immediately after the formation of the interphase on the fiber is the most widely used method, because of its simplicity and database availability [55-58]. Raman spectroscopy is capable of non-destructive measurement and is also very sensitive to internal defects such as graphene, carbon nanotubes, and graphite. This method can evaluate structural properties such as the orientation of molecules or crystals, and can also analyze the crystallite size and the stacking fault [59-61]. It is widely used to analyze the microstructure of the interphase. However, since the probe size of the Raman spectroscope is about 1 mm, it can be affected by the matrix or fiber around the interphase [62]. The area of the interphase must be large enough. The thickness of interphase in the SiCf/SiC composites should be greater than 1 μm for structural measurements.
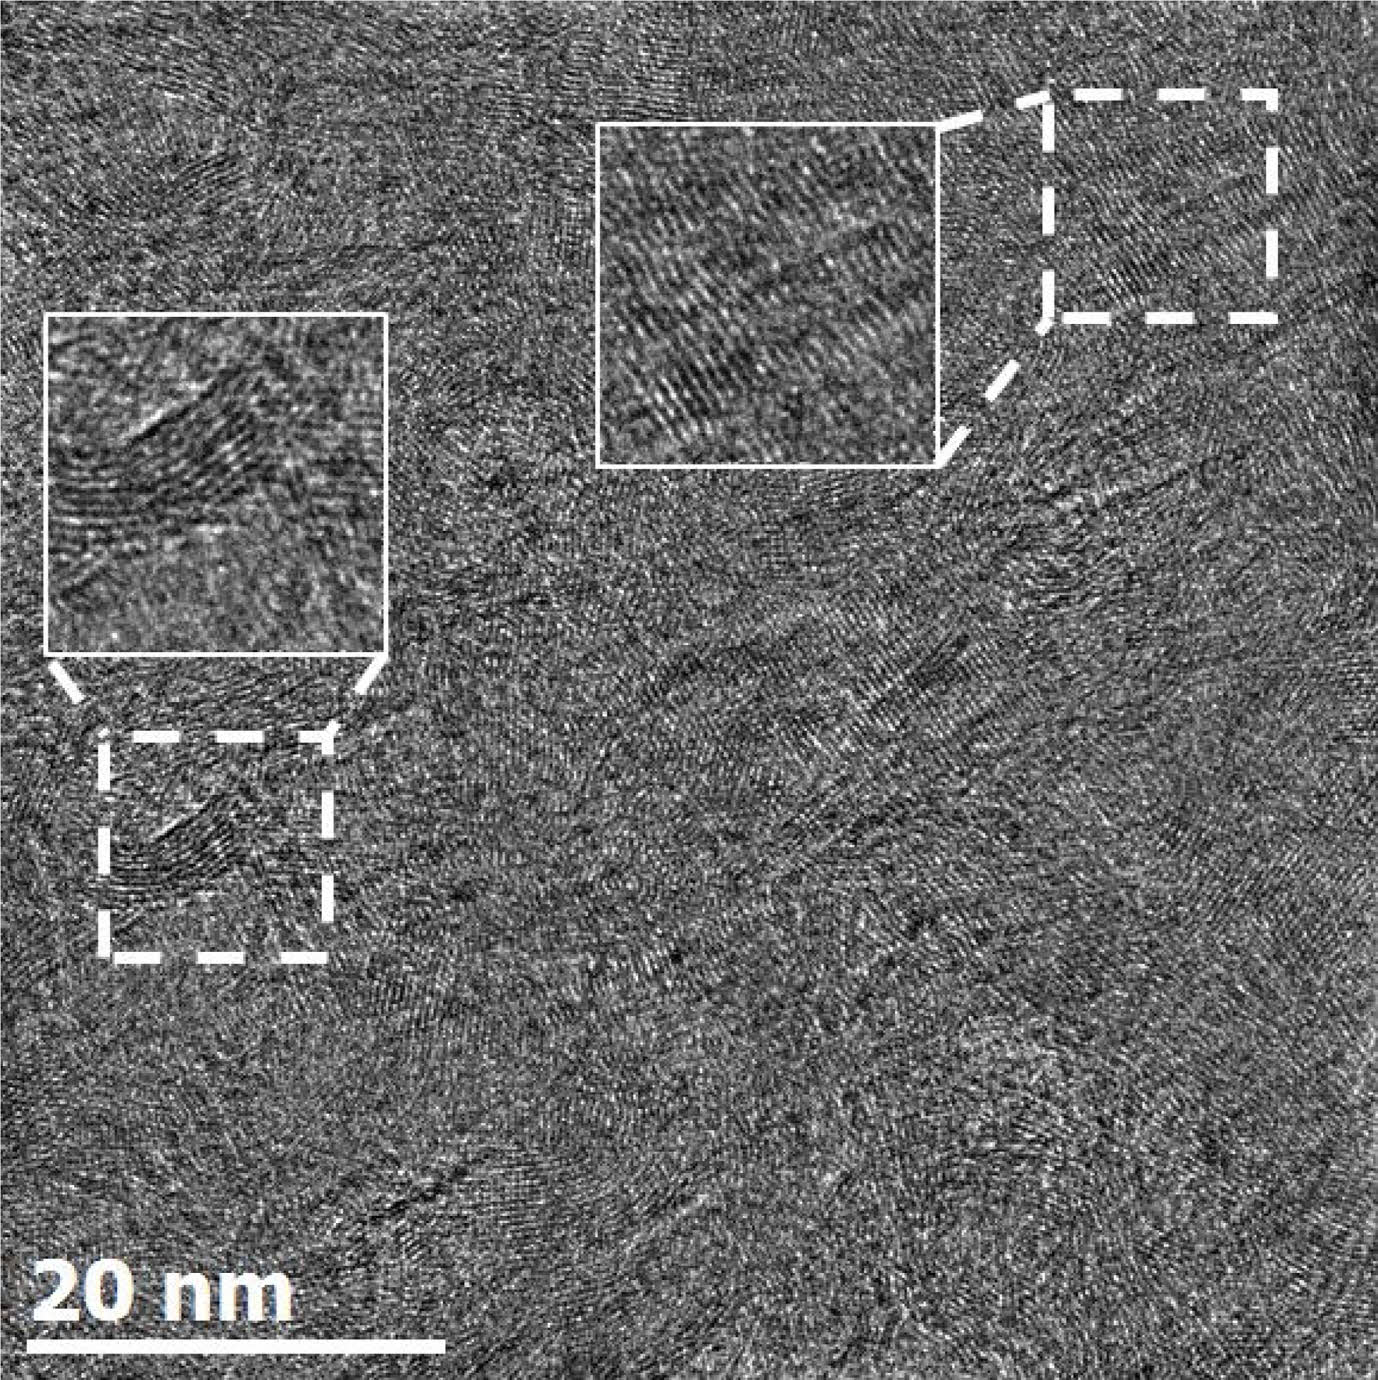
HRTEM can observe the atomic unit structure by phase contrast. The phase contrast is caused by the interference of the transmitted beam and diffracted beam passing through a thin specimen, thereby forming lattice fringes (Fig. 8). Lattice fringe images allow for the proper identification of the local crystallization of turbostratic structures. These structural properties of the turbostratic are quantified using digital image processing [63-66].
The lattice fringe image contains information about stacking faults or amorphous regions. Unnecessary information for quantification should be removed by digital image processing. Palotás et al. [67] has developed an algorithm that automatically analyzes lattice fringe images and has successfully quantified soot nanostructures. Various digital image processing algorithms such as frequency domain filtering, binarization, and grayscale have been developed based on the algorithm of Palotás et al. [68-70]. Normalization, binarization, and skeletonization images can be obtained using various algorithms (Fig. 9). These methods simplify the processing of lattice fringe images containing unnecessary information. They can extract the lattice length, fringe length, and fringe tortuosity from these simplified images. However, the matching rate between the simplified image and the actual image can differ depending on the variable value set during the filtering process, lowering reliability. Recently, an algorithm with a high matching rate has been developed and quantification has been performed for various turbostratic structures [71].
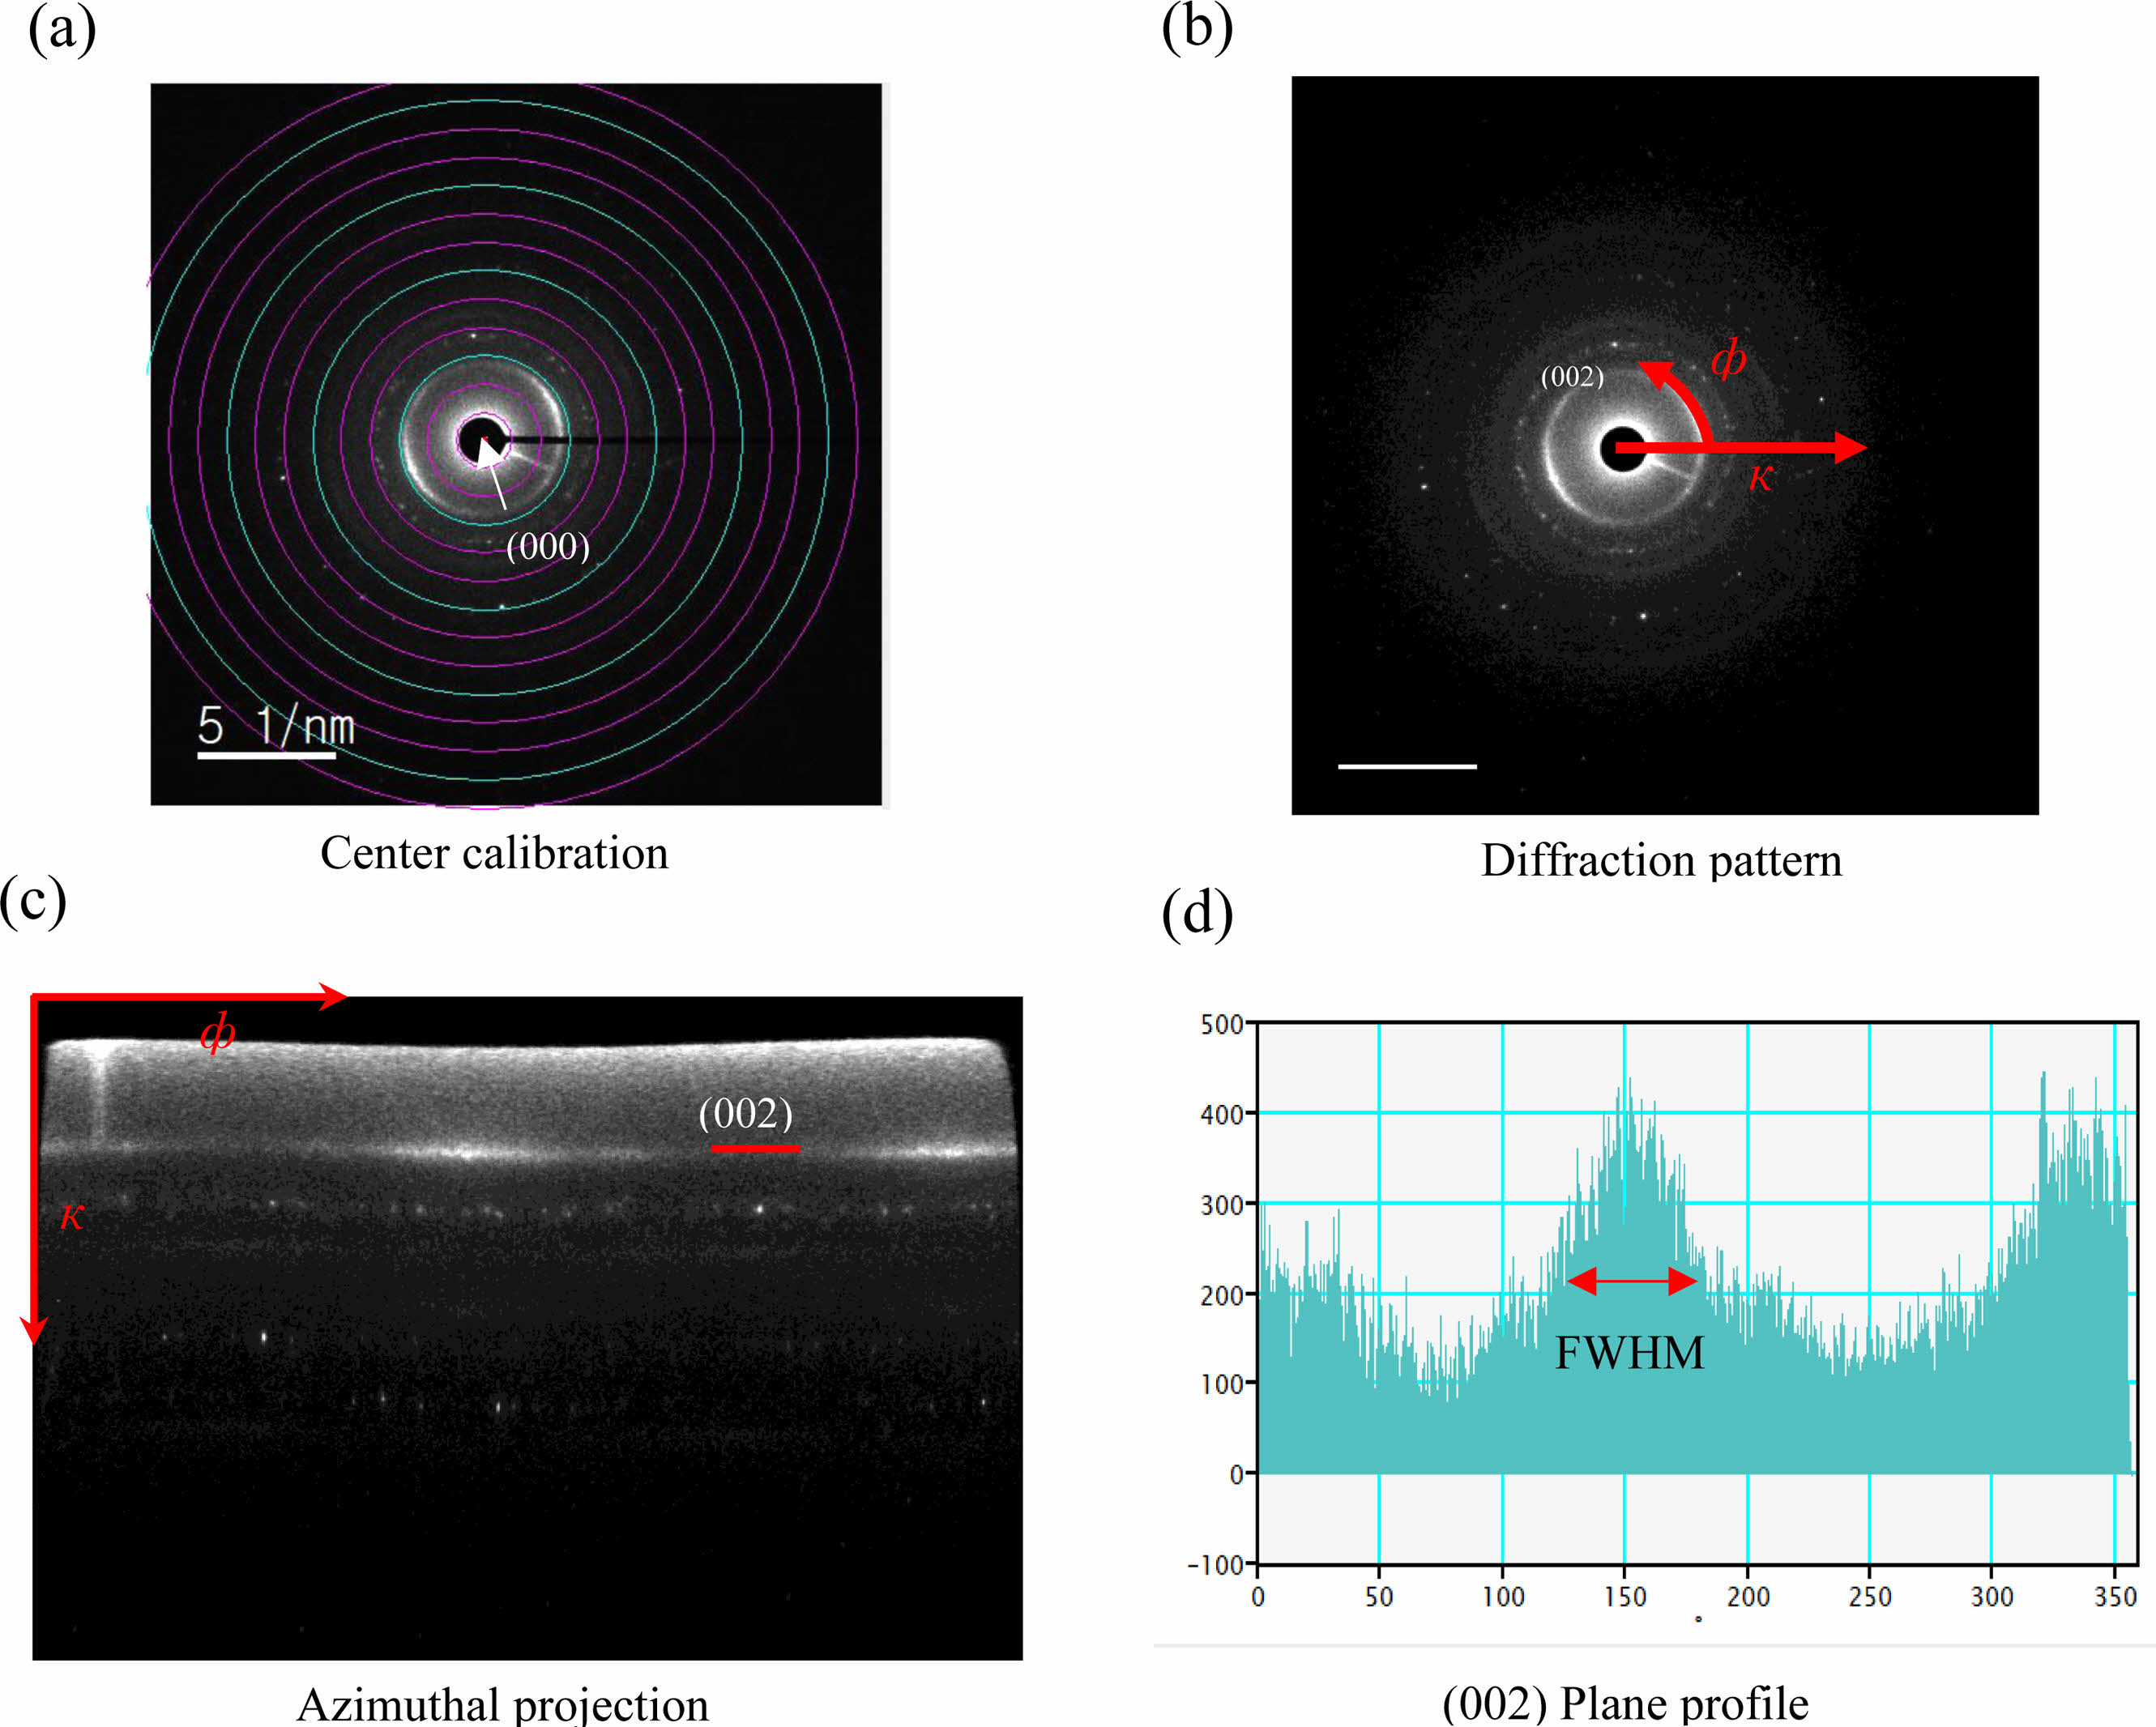
The diffraction pattern of the interphase can be obtained by SAED, and the crystal structure of the material analyzed. The SAED pattern of a turbostratic structure has an azimuthal distribution intensity of (002) diffraction points along the Debye-Sherrer circle due to the randomly stacked nanodomains [72]. In the reciprocal space, an arc-shaped pattern occurs at a distance of 1/L002 from the origin. The crystallization of the interphase can be quantified from the azimuthal distribution intensity obtained by the SAED pattern. Bourrat et al. [73] has quantified the degree of anisotropy for the first time using the azimuthal distribution intensity extracted from PyC and expressed the value as an orientation angle. Seyring et al. [74] has successfully calculated the orientation angle and L002 of carbon fibers by extracting the radial and azimuthal profiles, using an extended quantitative analysis method.
Fig. 10 provides the procedure for extracting the orientation angle (OA) of PyC from SAED. In order to extract the orientation angle, the origin of the SAED pattern is determined, and then the radial coordinates ф and к are set in the reciprocal lattice. ф and к represent the azimuthal angle and a diffraction vector, respectively. к is denoted counterclockwise direction with respect to the origin of the beam. The azimuthal projection image can then be obtained by converting the coordinate axis of ф and к. In the azimuthal projection image, the average radial intensity profiles can be extracted from к = 2.99 nm-1 corresponding to the (002) plane, and Gaussian fitting is applied to obtain the orientation angle. The turbostratic structure is classified into LT (80°

|
Fig. 7 (a) Crystal structure of the turbostratic structure and (b) classification of crystallization by alignment degree of nanodomains. |
|
Fig. 8 HRTEM lattice-fringe image of the turbostratic structure. |

|
Fig. 9 (a) A normalized image obtained by a combination of low pass filter and grayscale (b) the binarized image where white represents the detected lattice fringe and black represents the background. (c) a skeletonized image of each lattice fringe (d) Image overlaid with skeletonized lattice fringe. |
|
Fig. 10 Quantitative evaluation process of the diffraction of reciprocal space information of PyC interphase (a) center calibration, (b) diffraction pattern, (c) azimuthal projection, (d) (002) plane profile. |
This paper has reviewed the effect of interfacial properties between fiber and matrix on the mechanical properties of SiCf/SiC composites. The interfacial properties are determined by the thickness of the interphase, crystallization, and the roughness of the SiC fibers. The mechanical properties of SiCf/SiC composites were maximized when interphase thickness is 150 nm, and the strength and toughness properties were improved in the SiCf/SiC composites by a highly oriented interphase which provided multiple crack deflection. Accordingly, a highly oriented interphase must be formed to improve the performance of SiCf/SiC composites. LPCVD is mainly used to form a high-quality interphase. By adjusting process conditions, it is capable of controlling the thickness and crystallization of interphase. The crystallization of the formed interphase can then be quantified using XRD, Raman spectroscopy, HRTEM, and SAED. It is expected that this review will help in making improved SiCf/SiC composites.
This work was supported by the Materials/Components Technology Development Program of the Korea Evaluation Institute of Industrial Technology (KEIT) funded by the Ministry of Trade, Industry and Energy (MOTIE) (grant code: 10065691).
- 1. Y. Zhou, T. Ye, L. Ma, Z. Lu, Z. Yang, and S. Liu, Materials 12[4] (2019) 679.
-

- 2. Q. Hu, X. Zhou, Y. Tu, X. Lu, J. Huang, J. Jiang, L. Deng, S. Dong, and X. Cao, Ceram. Int. 47[21] (2021) 30012-30019.
-

- 3. P.L.N. Murthy, N.N. Nemeth, D.N. Brewer, and S. Mital, Composites Part B 39[4] (2008) 694-703.
-

- 4. W. Maktouf, K. Ammar, I. Ben Naceur, and K. Saï, Int. J. Fatigue 92 (2016) 25-35.
-

- 5. J. Kimmel, N. Miriyala, J. Price, K. More, P. Tortorelli, H. Eaton, G. Linsey, and E. Sun, J. Eur. Ceram. Soc. 22[14-15] (2002) 2769-2775.
-

- 6. R.K. Goldberg, A.S. Almansour, and R.M. Sullivan, J. Eur. Ceram. Soc. 42[15] (2022) 6846-6864.
-

- 7. A.G. Evans and D.B. Marshall, Acta Metall. 37[10] (1989) 2567-2583.
-

- 8. J.H. Choi, S.Y. Kim, S.-H. Kim, I.-S. Han, Y.-H. Seong, and H.J. Bang, J. Ceram. Process. Res. 20[1] (2019) 48-53.
-

- 9. A. Noviyanto and D.-H. Yoon, J. Ceram. Process. Res. 13[4] (2012) 392-397.
-

- 10. W. Guo and Y. Gao, J. Ceram. Process. Res. 24[2] (2023) 379-389.
-

- 11. K.W. Nam, C.K. Moon, and I.S. Seo, J. Ceram. Process. Res. 12[6] (2011) 646-649.
-

- 12. R.R. Naslain, Composites Part A 29[9-10] (1998) 1145-1155.
-

- 13. F. Rebillat, J. Lamon, and A. Guette, Acta Mater. 48[18-19] (2000) 4609-4618.
-

- 14. Y. Katoh, K. Ozawa, C. Shih, T. Nozawa, R.J. Shinavski, A. Hasegawa, and L.L. Snead, J. Nucl. Mater. 448[1-3] (2014) 448-476.
-

- 15. L. Zhang, C. Ren, C. Zhou, H. Xu, and X. Jin, Appl. Surf. Sci. 357 (2015) 1427-1433.
-

- 16. W. Yang, H. Araki, A. Kohyama, H. Suzuki, and T. Noda, Ceram. Int. 31[4] (2005) 525-531.
-

- 17. W. Yang, A. Kohyama, T. Noda, Y. Katoh, T. Hinoki, H. Araki, and J. Yu, J. Nucl. Mater. 307-311 (2002) 1088-1092.
-

- 18. W. Yang, T. Noda, H. Araki, J. Yu, and A. Kohyama, Mater. Sci. Eng. A 345[1-2] (2003) 28-35.
-

- 19. W. Yang, H. Araki, A. Kohyama, Y. Katoh, Q. Hu, H. Suzuki, and T. Noda, Mater. Trans. 43[10] (2002) 2574-2577.
-

- 20. N.P. Bansal, and J. Lamon, in “Ceramic matrix composites: materials, modeling and technology” (John Wiley & Sons. Press, 2014) p. 40-64.
-

- 21. C. Fellah, J. Braun, C. Sauder, F. Sirotti, and M.H. Berger, Compos. Part A Appl. Sci. Manuf. 133 (2020) 105867.
-

- 22. C. Fellah, J. Braun, C. Sauder, F. Sirotti, and M.-H. Berger, Composites Part A 133 (2020) 105867.
-

- 23. E. Buet, C. Sauder, D. Sornin, S. Poissonnet, J.-N. Rouzaud, and C. Vix-Guterl, J. Eur. Ceram. Soc. 34[2] (2014) 179-188.
-

- 24. J. Kabel, Y. Yang, M. Balooch, C. Howard, T. Koyanagi, K.A. Terrani, Y. Katoh, and P. Hosemann, Composites Part B 131 (2017) 173-183.
-

- 25. C. Sauder, A. Brusson, and J. Lamon, Int. J. Appl. Ceram. Technol. 7[3] (2010) 291-303.
-

- 26. O. Karakoc, T. Koyanagi, T. Nozawa, and Y. Katoh, Composites Part B 224 (2021) 109189.
-

- 27. J. Braun and C. Sauder, J. Nucl. Mater. 558 (2022) 153367.
-

- 28. T. Hinoki, E. Lara-Curzio, and L.L. Snead, Fusion Sci. Technol. 44[1] (2003) 211-218.
-

- 29. T. Wang, H. Li, Q. Shen, K. Li, W. Li, Q. Song, and S. Zhang, Composites Part B 192 (2020) 107982.
-

- 30. H. Duan, Z. Zhang, L. Li, and W. Li, J. Am. Ceram. Soc. 105[3] (2022) 2171-2181.
-

- 31. Y. Kaburagi, A. Yoshida, and Y. Hishiyama, in “Materials Science and Engineering of Carbon” (Butterworth-Heinemann Press, 2016) p. 125-152.
-

- 32. J.-F. Després and M. Monthioux, J. Eur. Ceram. Soc. 15[3] (1995) 209-224.
-

- 33. S. Jacques, A. Lopez-Marure, C. Vincent, H. Vincent, and J. Bouix, J. Eur. Ceram. Soc. 20[12] (2000) 1929-1938.
-

- 34. J. Liu, S. Wang, P. Li, M. Feng, and X. Yang, Surf. Coat. Technol. 286 (2016) 57-63.
-

- 35. M. Chen, L. Pan, X. Xia, W. Zhou, and Y. Li, Ceram. Int. 48[23] (2022) 34107-34127.
-

- 36. W.G. Zhang, Z.J. Hu, and K.J. Hüttinger, Carbon 40[14] (2002) 2529-2545.
-

- 37. Y.-S. Jeong, K. Choi, and H.G. Yoon, J. Korean Ceram. Soc. 56[3] (2019) 291-297.
-

- 38. S. Bammidipati, G.D. Stewart, J.R. Elliott Jr, S.A. Gokoglu, and M.J. Purdy, AIChE J. 42[11] (1996) 3123-3132.
-

- 39. G.L. Dong and K.J. Hüttinger, Carbon 40[14] (2002) 2515-2528.
-

- 40. X. Bourrat, A. Fillion, R. Naslain, G. Chollon, and M. Brendlé, Carbon 40[15] (2002) 2931-2945.
-

- 41. H. Hannache, R. Naslain, and C. Bernard, J. less-common met. 95[2] (1983) 221-246.
-

- 42. F. Rebillat, A. Guette, and C.R. Brosse, Acta Mater. 47[5] (1999) 1685-1696.
-

- 43. M. Leparoux, L. Vandenbulcke, and C. Clinard, J. Am. Ceram. Soc. 82[5] (1999) 1187-1195.
-

- 44. E.K. Nyutu and S.L. Suib, Surf. Coat. Technol. 201[6] (2006) 2741-2748.
-

- 45. W.Y. Lee, W.J. Lackey, and P.K. Agrawal, J. Am. Ceram. Soc. 74[10] (1991) 2642-2648.
-

- 46. Y. Cheng, X. Yin, Y. Liu, S. Li, L. Cheng, and L. Zhang, Surf. Coat. Technol. 204[16-17] (2010) 2797-2802.
-

- 47. S. Le Gallet, G. Chollon, F. Rebillat, A. Guette, X. Bourrat, R. Naslain, M. Couzi, and J.L. Bruneel, J. Eur. Ceram. Soc. 24[1] (2004) 33-44.
-

- 48. J. Thomas, N.E. Weston, and T.E. O'Connor, J. Am. Chem. Soc. 84[24] (1962) 4619-4622.
-

- 49. S. Alkoy, C. Toy, T. Gönül, and A. Tekin, J. Eur. Ceram. Soc. 17[12] (1997) 1415-1422.
-

- 50. J. Dai, Y. Wang, Z. Xu, R. Mu, and L. He, Ceram. Int. 46[9] (2020) 13073-13081.
-

- 51. P. Carminati, T. Buffeteau, N. Daugey, G. Chollon, F. Rebillat, and S. Jacques, Thin Solid Films 664 (2018) 106-114.
-

- 52. P. Ruz, S. Banerjee, M. Pandey, V. Sudarsan, P.U. Sastry, and R.J. Kshirsagar, Solid State Sci. 62 (2016) 105-111.
-

- 53. Q. Zhang, L. Cheng, L. Zhang, and N. Dong, J. Ceram. Process. Res. 14[2] (2013) 247-250.
-

- 54. M. V. Qanati, and A. Rasooli, Diam. Relat. Mater. 109 (2020) 108097.
-

- 55. T. Matsuda, N. Uno, H. Nakae, and T. Hirai, J. Mater. Sci. 21 (1986) 649-658.
-

- 56. H. Wu, M. Chen, X. Wei, M. Ge, and W. Zhang, Appl. Surf. Sci. 257[4] (2010) 1276-1281.
-

- 57. Z. Qi, X. Lv, W. Zhao, S. Zhu, and J. Jiao, in Proceedings of the 11th International Conference on High-Performance Ceramics, May 2019, edited by W. Pan and J. Gong (IOP Publishing, 2019) p. 1-6.
-

- 58. S.G. Nair, K.J. Sreejith, S. Packirisamy, T.G. Babu, and R. Devasia, Mater. Chem. Phys. 204 (2018) 179-186.
-

- 59. R. Sharma, N. Chadha, and P. Saini, IJPAP. 55[9] (2017) 625-629.
- 60. P. Poncharal, A. Ayari, T. Michel, and J.L. Sauvajol, Phys. Rev. B. 79 (2009) 195417.
-

- 61. M.S. Dresselhaus, A. Jorio, A.G. Souza Filho, and R. Saito, Philos. Trans. Royal Soc. 368[1932] (2010) 5355-5377.
-

- 62. R.J. Young, A.B.L. Broadbridge, and C.L. So, J. Microsc. 196[2] (1999) 257-265.
-

- 63. J.P. Da Costa, P. Weisbecker, B. Farbos, J.M. Leyssale, G.L. Vignoles, and C. Germain, Carbon 84 (2015) 160-173.
-

- 64. B. Neupane, Y. Ju, B.R. Silwal, P.K. Singh, and C. Huang, Energy Explor. Exploit. 35[6] (2017) 713-733.
-

- 65. X. Zhang, Q. Yan, W. Leng, J. Li, J. Zhang, Z. Cai, and E.B. Hassan, Materials 10[8] (2017) 975.
-

- 66. S.A. Pfau, A. La Rocca, E. Haffner-Staton, G.A. Rance, M.W. Fay, R.J. Brough, and S. Malizia, Carbon 139 (2018) 342-352.
-

- 67. Á.B. Palotás, L.C. Rainey, C.J. Feldermann, A.F. Sarofim, and J.B. Vander Sande, Microsc. Res. Tech. 33[3] (1996) 266-278.
-

- 68. K. Yehliu, R.L. Vander Wal, and A.L. Boehman, Combust. Flame. 158[9] (2011) 1837-1851.
-

- 69. P. Toth, A.B. Palotas, E.G. Eddings, R.T. Whitaker, and J.S. Lighty, Combust. Flame 160[5] (2013) 909-919.
-

- 70. C. Wang, T. Huddle, E.H. Lester, and J.P. Mathews, Energy Fuels 30[4] (2016) 2694-2704.
-

- 71. P. Toth, Carbon 178 (2021) 688-707.
-

- 72. A. Oberlin, Carbon 17[1] (1979) 7-20.
-

- 73. X. Bourrat, B. Trouvat, G. Limousin, G. Vignoles, and F. Doux, J. Mater. Res. 15[1] (2000) 92-101.
-

- 74. M. Seyring, A. Simon, I. Voigt, U. Ritter, and M. Rettenmayr, Carbon 116 (2017) 347-355.
-

- 75. E. López-Honorato, P.J. Meadows, and P. Xiao, Carbon 47[2] (2009) 396-410.
-

 This Article
-
2023; 24(5): 841-849
Published on Oct 31, 2023
- 10.36410/jcpr.2023.24.5.841
- Received on Jul 17, 2023
- Revised on Aug 10, 2023
- Accepted on Sep 13, 2023
 Services
- Abstract
introduction
crack behaviors at the interfaces between matrix and fiber
methodology of interphase
characterization of interphase
conclusions
- Acknowledgements
- References
- Full Text PDF
Shared
 Correspondence to
- Kyoon Choi
-
Icheon Branch, Korea Institute of Ceramic Engineering and Technology, Icheon 17303, Korea
Tel : +82-31-645-1456 Fax: +82-31-645-1493 - E-mail: knchoi@kicet.re.kr


 Copyright 2019 International Orgranization for Ceramic Processing. All rights reserved.