- Coloring mechanism of celadon glazes from Yaozhou kiln
Zhen Sanga,b,*, Fen Wanga, Xiaojuan Yuanc, Shurui Shenb, Jing Wangd and Xiaohong Weia,b
aSchool of Materials Science and Engineering, Shaanxi Key Laboratory of Green Preparation and Functionalization for Inorganic Materials, Shaanxi University of Science and Technology, Xi'an 710021, PR China
bCollege of Art and Design, Shaanxi University of Science & Technology, Xi'an 710021, PR China
cCollege of Science, Shaanxi University of Science & Technology, Xi'an 710021, PR China
dCollege of Art and Design, Xuchang University, Xuchang 461000, PR ChinaThis article is an open access article distributed under the terms of the Creative Commons Attribution Non-Commercial License (http://creativecommons.org/licenses/by-nc/4.0) which permits unrestricted non-commercial use, distribution, and reproduction in any medium, provided the original work is properly cited.
The Five Dynasty sky-green, Song dynasty olive-green and Jin dynasty moon-white glazes are three typical glazes of the Yaozhou celadon. In this work, the coloring mechanism of the three celadon glazes were compared and analyzed by using colorimeter, EDXRF, XRD, XPS and Raman spectrometer. The results indicate that the content of Fe2O3 is proportional to the depth of the glaze colors. The Raman Ip value indicates that the firing temperature of the Song dynasty olive-green glaze was the highest, followed by the Five Dynasty, and then the Jin dynasty. The lower firing temperature and dense bubbles are important causes of the high opacification of the Jin moon-white glaze. The ratio of Fe2+ to Fe3+ in the glaze is directly proportional to the b* value, which is the main reason for why the Yao celadon glaze colors are yellow-green in Song, but bluish in the Five Dynasty and Jin dynasty
Keywords: Yaozhou celadon, Five Dynasty sky-green, Song dynasty olive-green, Jin dynasty moon-white porcelains, coloring mechanism
Celadon, originated in China and is representative of its ancient ceramic culture. From the beginning of the middle period of the Shang dynasty, many famous celadon kilns in China were built [1]. Southern celadon is famous for kilns such as Longquan and Yue kiln, while northern celadon is represented by Yaozhou kiln with a long history, rich categories, and excellent quality. The Yaozhou Kiln, located in Huangpu Town, Tongchuan City, Shaanxi Province, has gone through many dynasties such as the Tang, Five Dynasty, Song, Jin, and Ming dynasties. Porcelain, especially celadon, have various types and distinctive features. Among them, the Five Dynasty sky-green, the Song dynasty olive-green, and the Jin dynasty moon-white wares are the most typical.
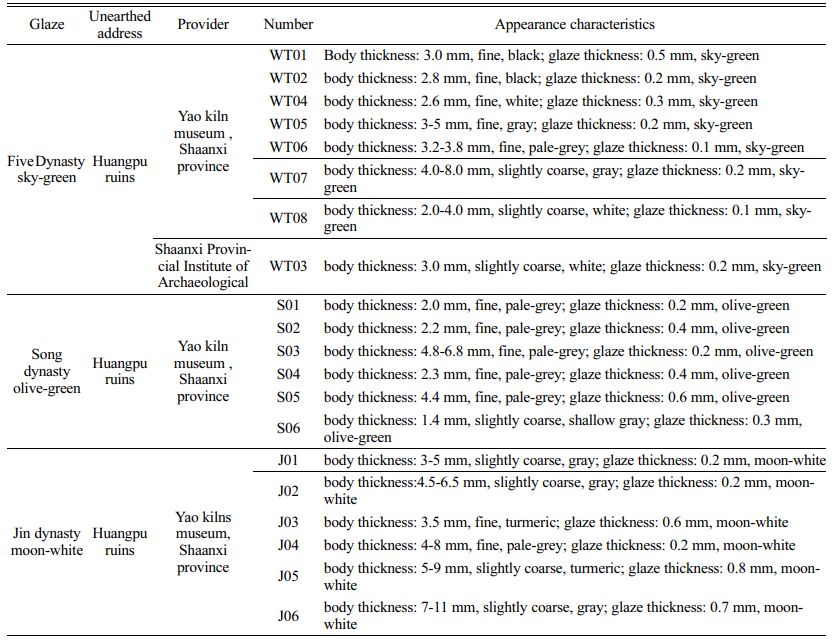
The Five Dynasty Yaozhou kiln is based on the porcelain making process of the Tang dynasty and the sky-green ware is fired with black or white bodies [2, 3]. The sky-green ware is mirror-like bright and paper thin and produces chime-like sound [4, 5]. The Song dynasty uses olive-green ware, with gray and fine bodies, pure glaze color, rich glass texture, is as beautiful as jade and uses the best Yaozhou celadon [6]. Entering the Jin dynasty, the moon-white ware was fired for the first time in Yaozhou kiln. Its glaze color is milk white with green hues. The glaze is thick, opalescent, gentle, and jade-like. Since it is like a bright moon in the autumn night, quiet and gentle, it is called a “moon-white glaze” [7, 8]. In recent times, researches have been performed on Yaozhou celadon in different eras but are generally concentrated on the characteristics of kilns, celadon materials, and firing technology. In-depth, comprehensive research is rare, especially comparative studies on the relationships between coloring mechanism and colorimetric values.
Based on the above, some test samples of Yaozhou celadon from the Yaozhou Kiln Museum and Shaanxi Provincial Institute of Archaeological and a comparative analysis of the chemical composition, phase, and chemical state of the Five Dynasty sky-green, the Song dynasty olive-green, and the Jin dynasty moon-white glaze has determined the relationship between the coloring mechanism and color value of the three period celadon of the Yaozhou Kiln, and root cause of the color difference has been studied. It provides theoretical support for the source and generation archaeology of Yaozhou celadon, research on the firing process, and research on complex imitation and innovative development.
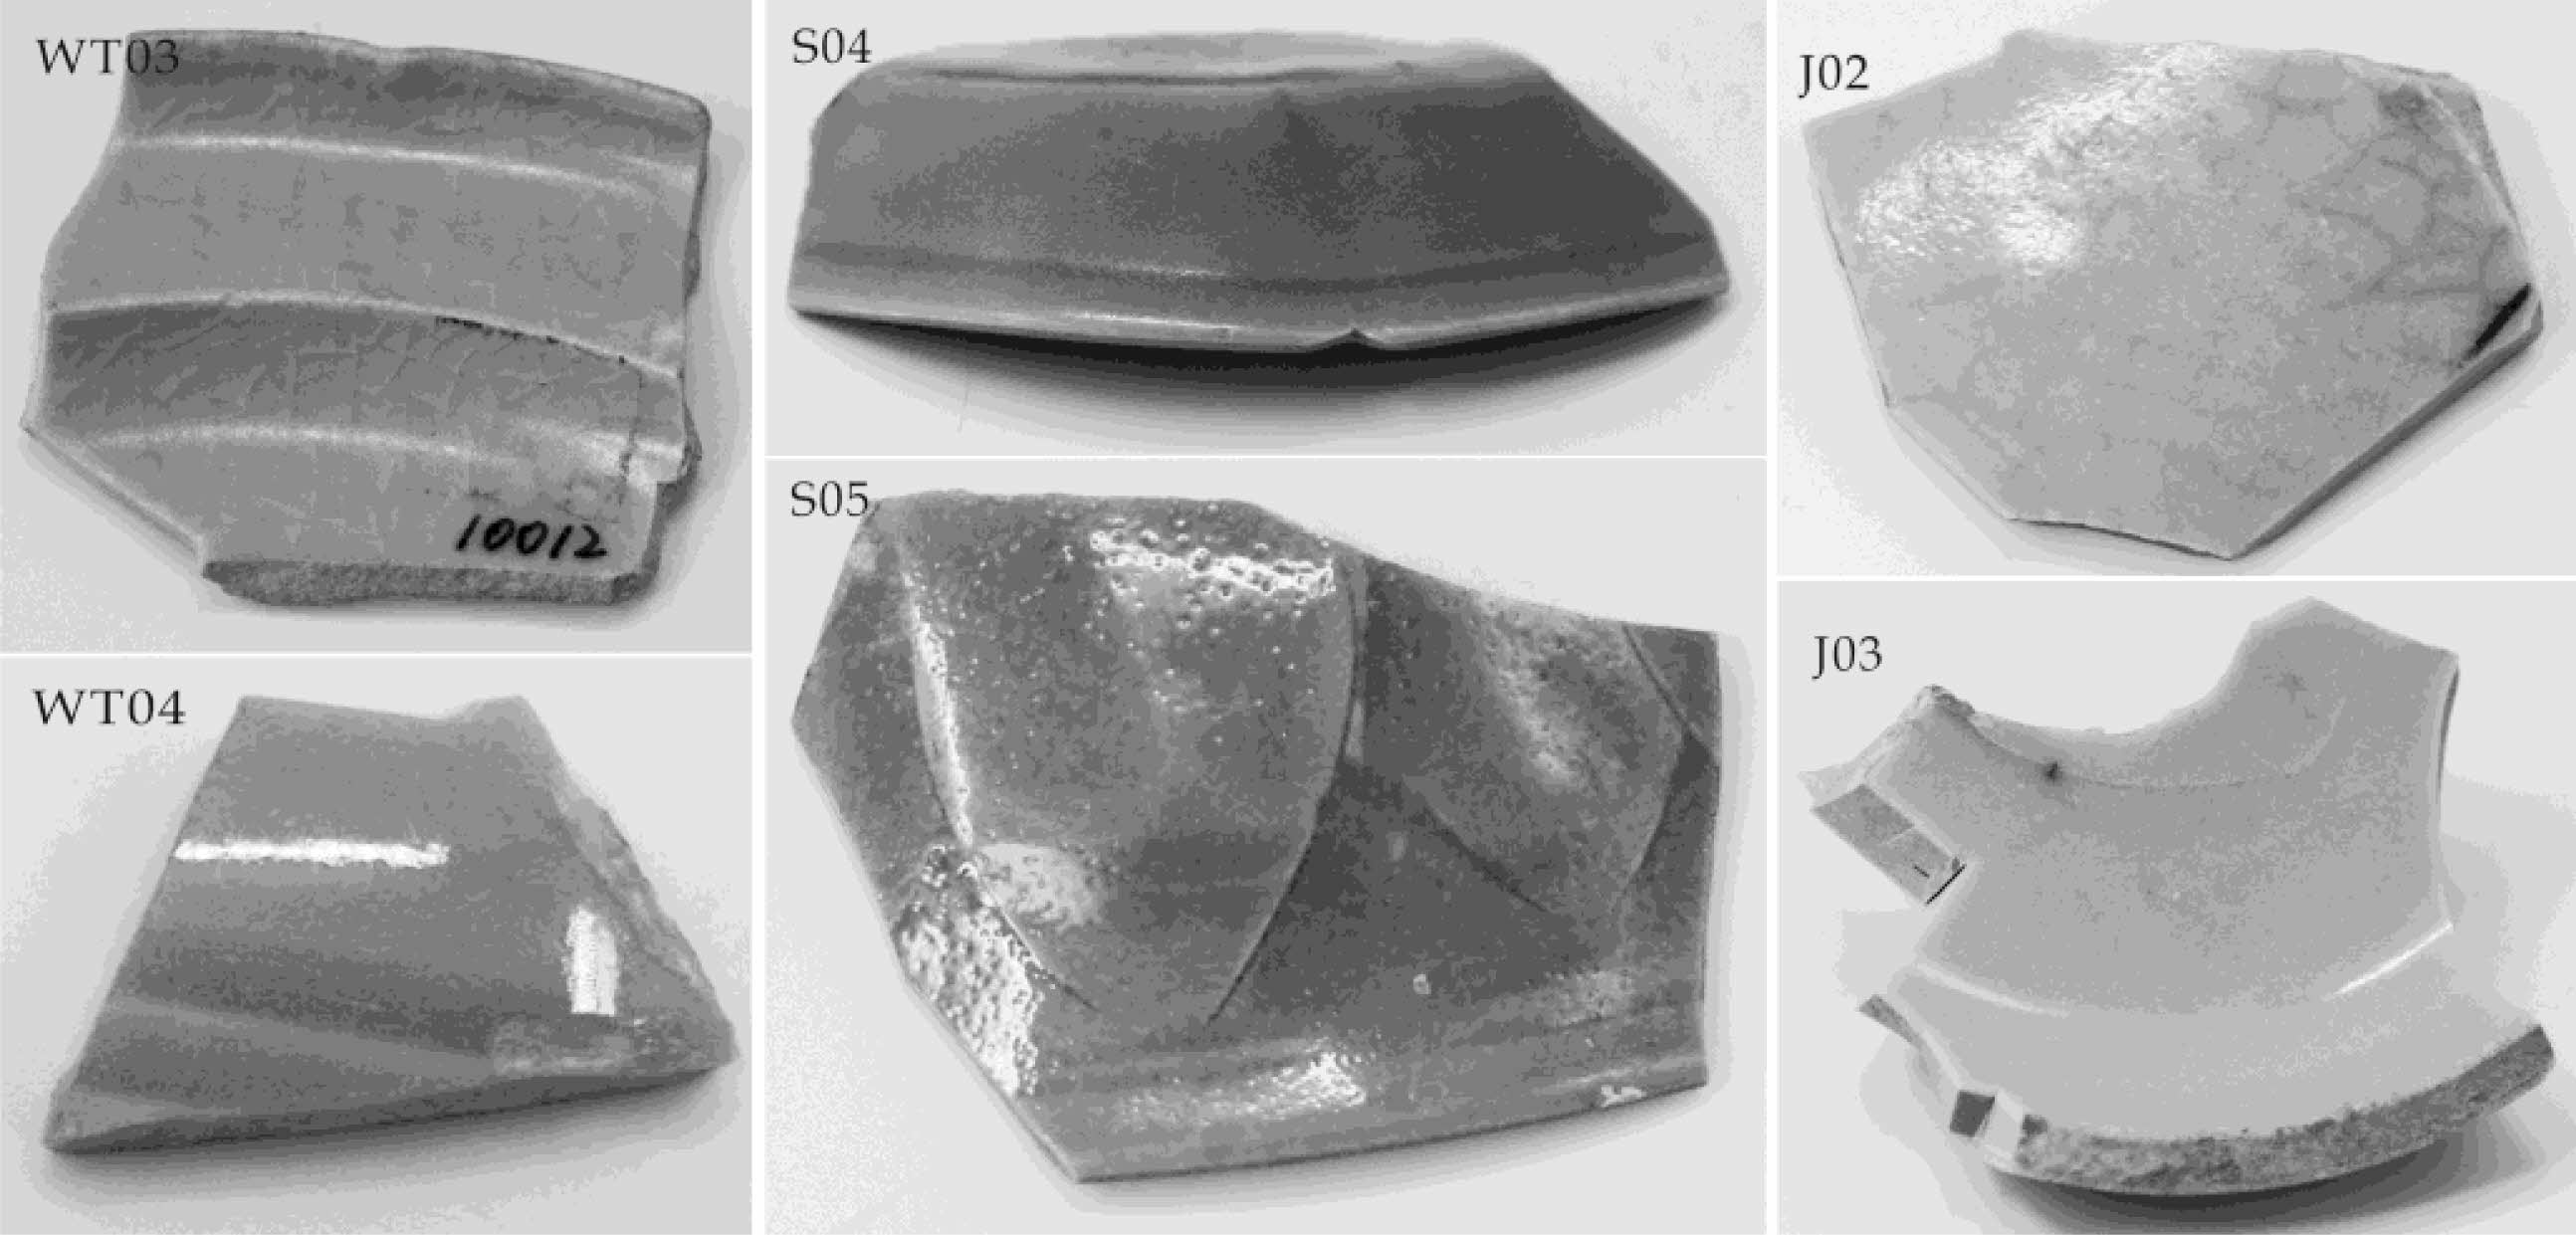
The Five Dynasty, Song, and Jin dynasty celadon shards of Yaozhou kiln were adopted as test samples. The unearthed addresses, providers, and external characteristics of the samples are listed in Table 1. The digital photos of some samples are shown in Fig. 1.
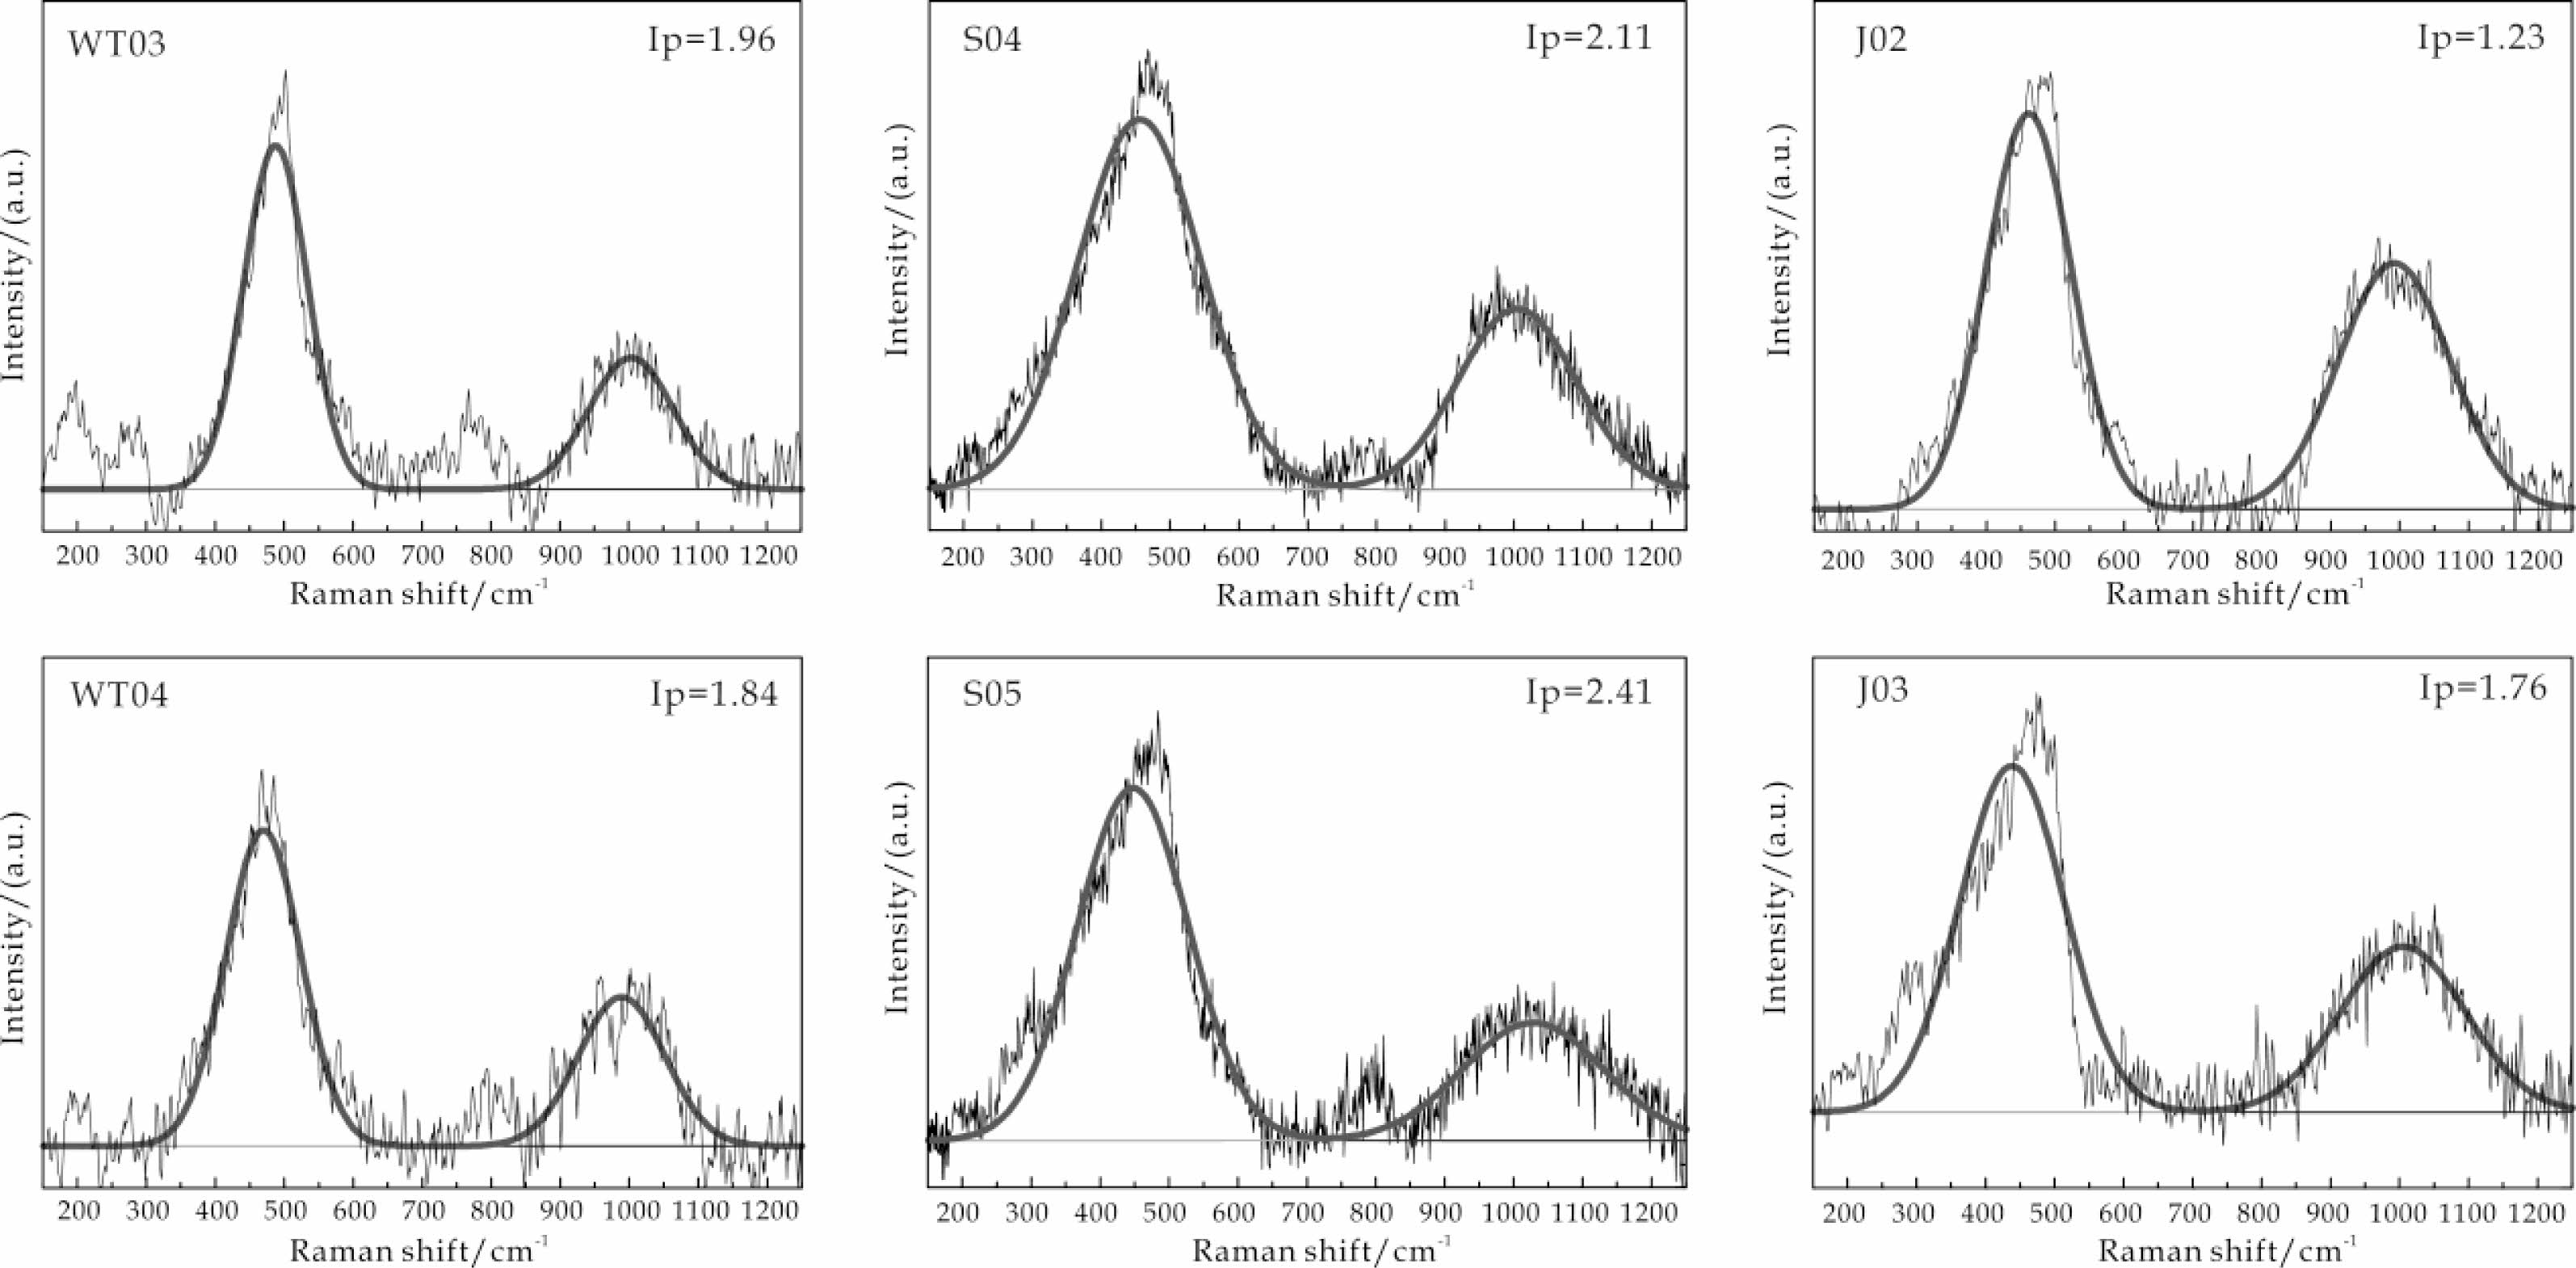
A colorimeter (X-Rite Ci7800, USA) was used to test the colorimetric values, L* (L* indicates brightness, where 0 is black, and100 is white), a* (The a* value indicates color variation ranges from red to green, where a positive value denotes red, and a negative value denotes green), and b* (The b* value indicates the change in color range from yellow to blue, with a positive value associated with yellow, and a negative value associated with blue), of the samples. The chemical compositions of celadon shards were determined by X-ray fluorescence (EDXRF, XGT-7200V, Japan). The phase compositions of the test pieces were identified by X-ray diffraction (XRD, D/max 2200PC, Japan) with Cu Kα radiation (λ=1.5406 Å) and scanning from 10° to 80° under 40 kV and 100 mA. The molecular structure of the sample was analyzed by a micro-confocal laser Raman spectrometer (Raman, Renishaw-invia, UK), and the firing temperature of the celadon was calculated according to the Ip value (Ip = A500/A1000, which is the ratio of the peak area of the Raman spectrum at approximately 500 cm-1 and 1000 cm-1). The chemical analysis was performed on an ESCALAB MKII X-ray photoelectron spectrometer (XPS, VG Scientific, UK) using Al K α radiation. The optical spectra of the samples were measured with a spectrophotometer (Cary 5000, USA).
|
Fig. 1 Celadon shards of Song dynasty,Five Dynasty and Jin dynasty from Yaozhou kiln. |
|
Table 1 Introduction to the sources and characteristics of Five Dynasty sky-green, Song dynasty olive-green and Jin dynasty moon-white porcelains from Yaozhou kiln. |
Chromaticity and chemical composition of sample glazes
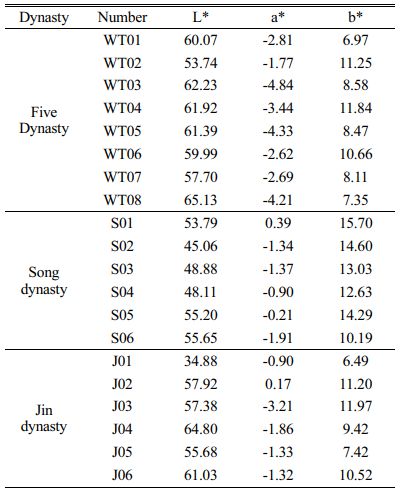
Table 2 and Figure 2 are the distribution maps of the L*, a*, and b* values of the celadon shards of the Five Dynasty, Song, and Jin dynasty of Yaozhou kiln, respectively. The L* value of the Five Dynasty sky-green wares in Yaozhou kiln is generally the most concentrated and highest (53-66); the lightness value of the Song dynasty olive-green glaze is generally the lowest but relatively scattered; and the L* value of the Jin dynasty moon-white glaze is between the Five Dynasty and the Song dynasty, close to the Five Dynasty celadon. It can be seen from the a* value radar distribution diagram in Fig. 2(b) that the glaze color of the Five Dynasty sky-green enamel is the greenest, followed by the Jin dynasty moon-white glaze, and then the Song dynasty olive-green glaze. Fig. 2(c) shows that the glaze color of the Five Dynasty samples is the bluest, the Song dynasty is yellowish, and the Jin dynasty is between the two. This is consistent with the previous research results of Zhen Sang et al. [9]. The L*, a*, and b* values of the celadon are related to the chemical compositions of the celadon glaze, the content, and the valence state of iron ions.
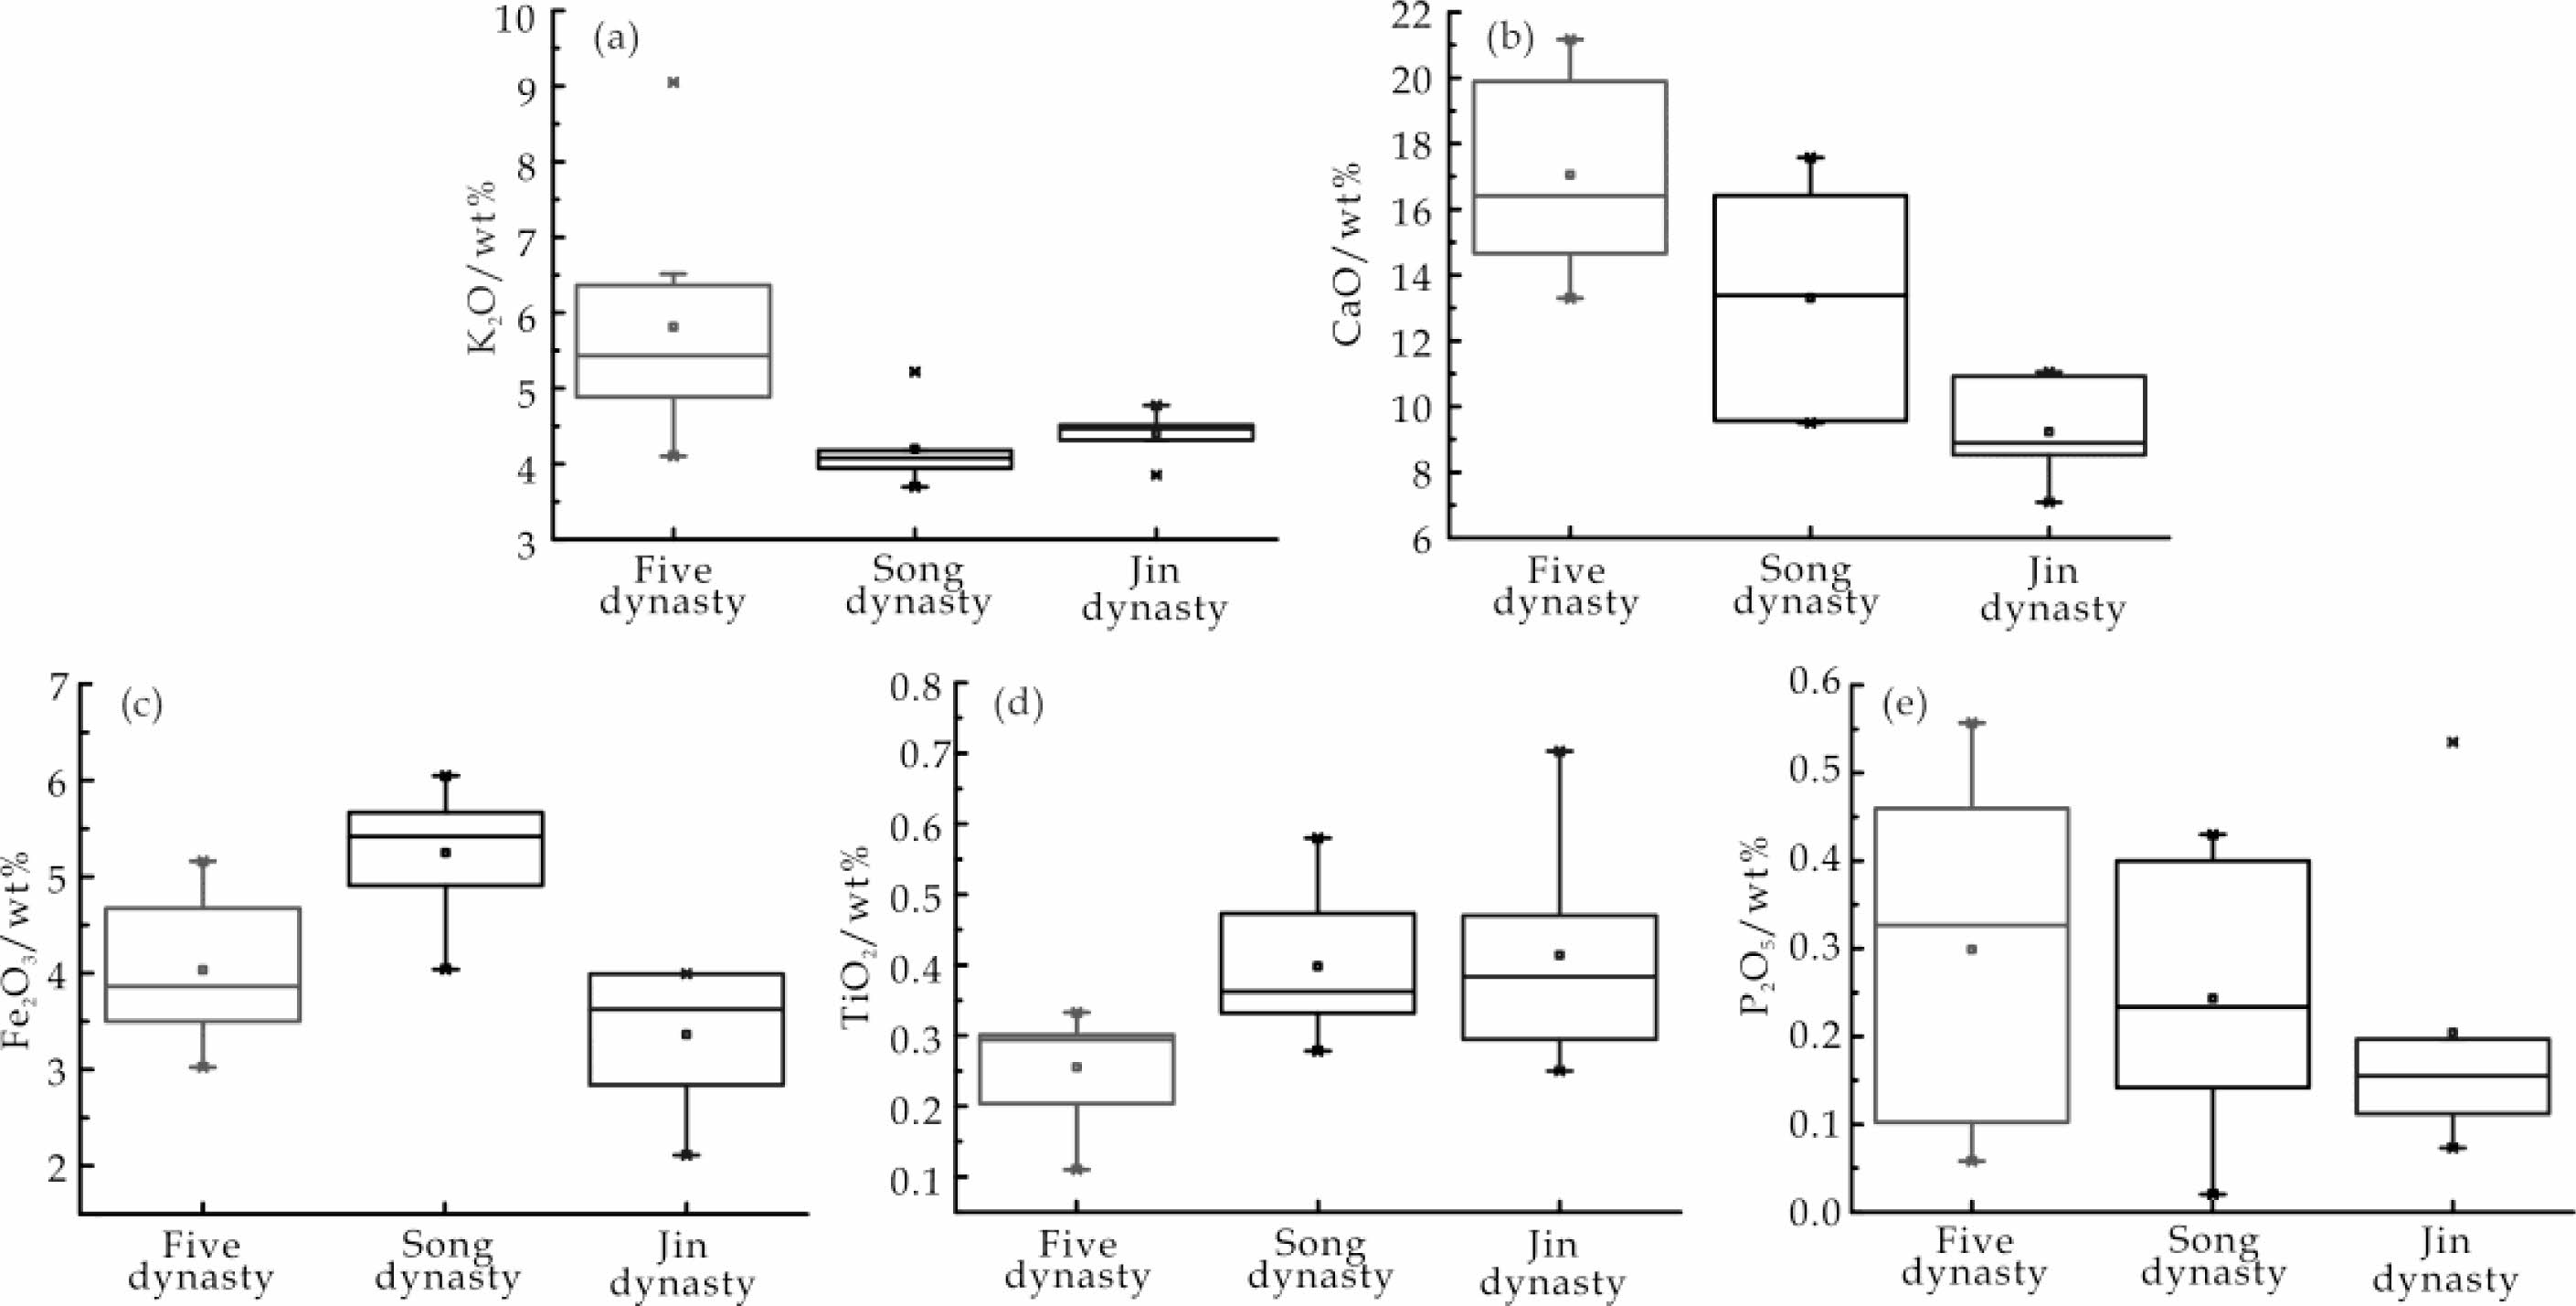
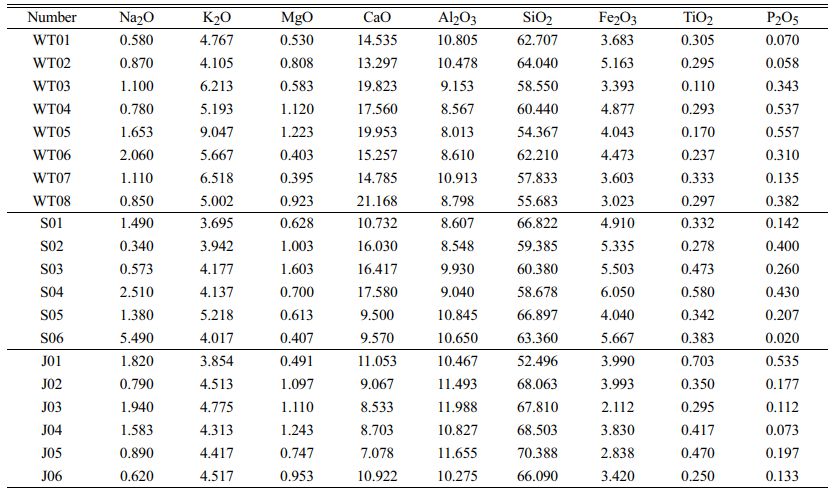
Table 3 shows the chemical composition of the Song dynasty olive-green, the Five Dynasty sky-green, and the Jin dynasty moon-white glazes of Yaozhou kiln. It was found from Fig. 3 and Table 3 that the Five Dynasty celadon glaze of Yaozhou kiln has the highest K2O content, and the CaO content is much higher than that of the Song and the Jin dynasties. K2O can contribute to the greenish-blue color of the glaze, and CaO acts as a flux for the glaze during the firing process, which can improve both the fluidity of the glaze melt and the gloss of the glaze player surface. Therefore, the glaze color of the Five Dynasty sky-green glaze is greenish blue, and the transparency and gloss of the glaze layer are high [10, 11]. The order of Fe2O3 content in the samples from greatest to least is Song, Five Dynasty, and Jin, and the same order of P2O5 content is Five Dynasty, Song, and Jin, respectively. P2O5 can promote the phase separation of celadon glaze, leading to the segregation of Fe, which has a deepening effect on the greenish-blue tone of the celadon glaze [12]. However, due to the weak reducing atmosphere used in the firing of olive-green glaze porcelain in the Song dynasty, the glaze color is yellowish green instead of blue [13], while the Five Dynasty sky-green glaze is more bluish due to the higher content of Fe2O3 and P2O5 than that of the Jin dynasty moon-white glaze. The base glazes of the three dynasties celadon are similar to each other, but the gaps in TiO2 and Fe2O3 content are relatively large, which is the same as that of CaO. The content of TiO2 in the celadon of the Song dynasty is not the highest while the content of Fe2O3 is the highest, so the color of the celadon glaze is darker than that of the Five Dynasty and the Jin dynasty, and the color of the Jin dynasty celadon glaze is the lightest. However, according to the L* data in Fig. 1(a), the brightness of the Jin dynasty moon-white glaze is lower than that of the Five Dynasty sky-green glaze, which may be caused by the thinner layer and lower opacity of the Five Dynasty sky-green glaze, resulting in less absorption of light. In addition, according to the data in Table 3, the discriminant coefficient b* values of the calcium glazes of the Five Dynasty, Song, and Jin dynasty celadon glazes of Yaozhou kiln were calculated, that is, RO/ (RO + R2O), and the average values were 0.80, 0.77, and 0.73, which indicate that the celadon glazes of the Five Dynasty and the Song dynasty belong to calcium glaze, while the samples of the Jin dynasty belong to the calcium-alkali glaze [14, 15]. However, according to silicate dictionary, the weight percentage of CaO wt% ≥ 8 is considered as the standard of the calcium glaze [16]; thus, the celadon glazes of the three periods of Yaozhou kiln belong to the calcium glaze. This is in agreement with previous research of Zhu et al. [17].
Phase and molecular structure analysis
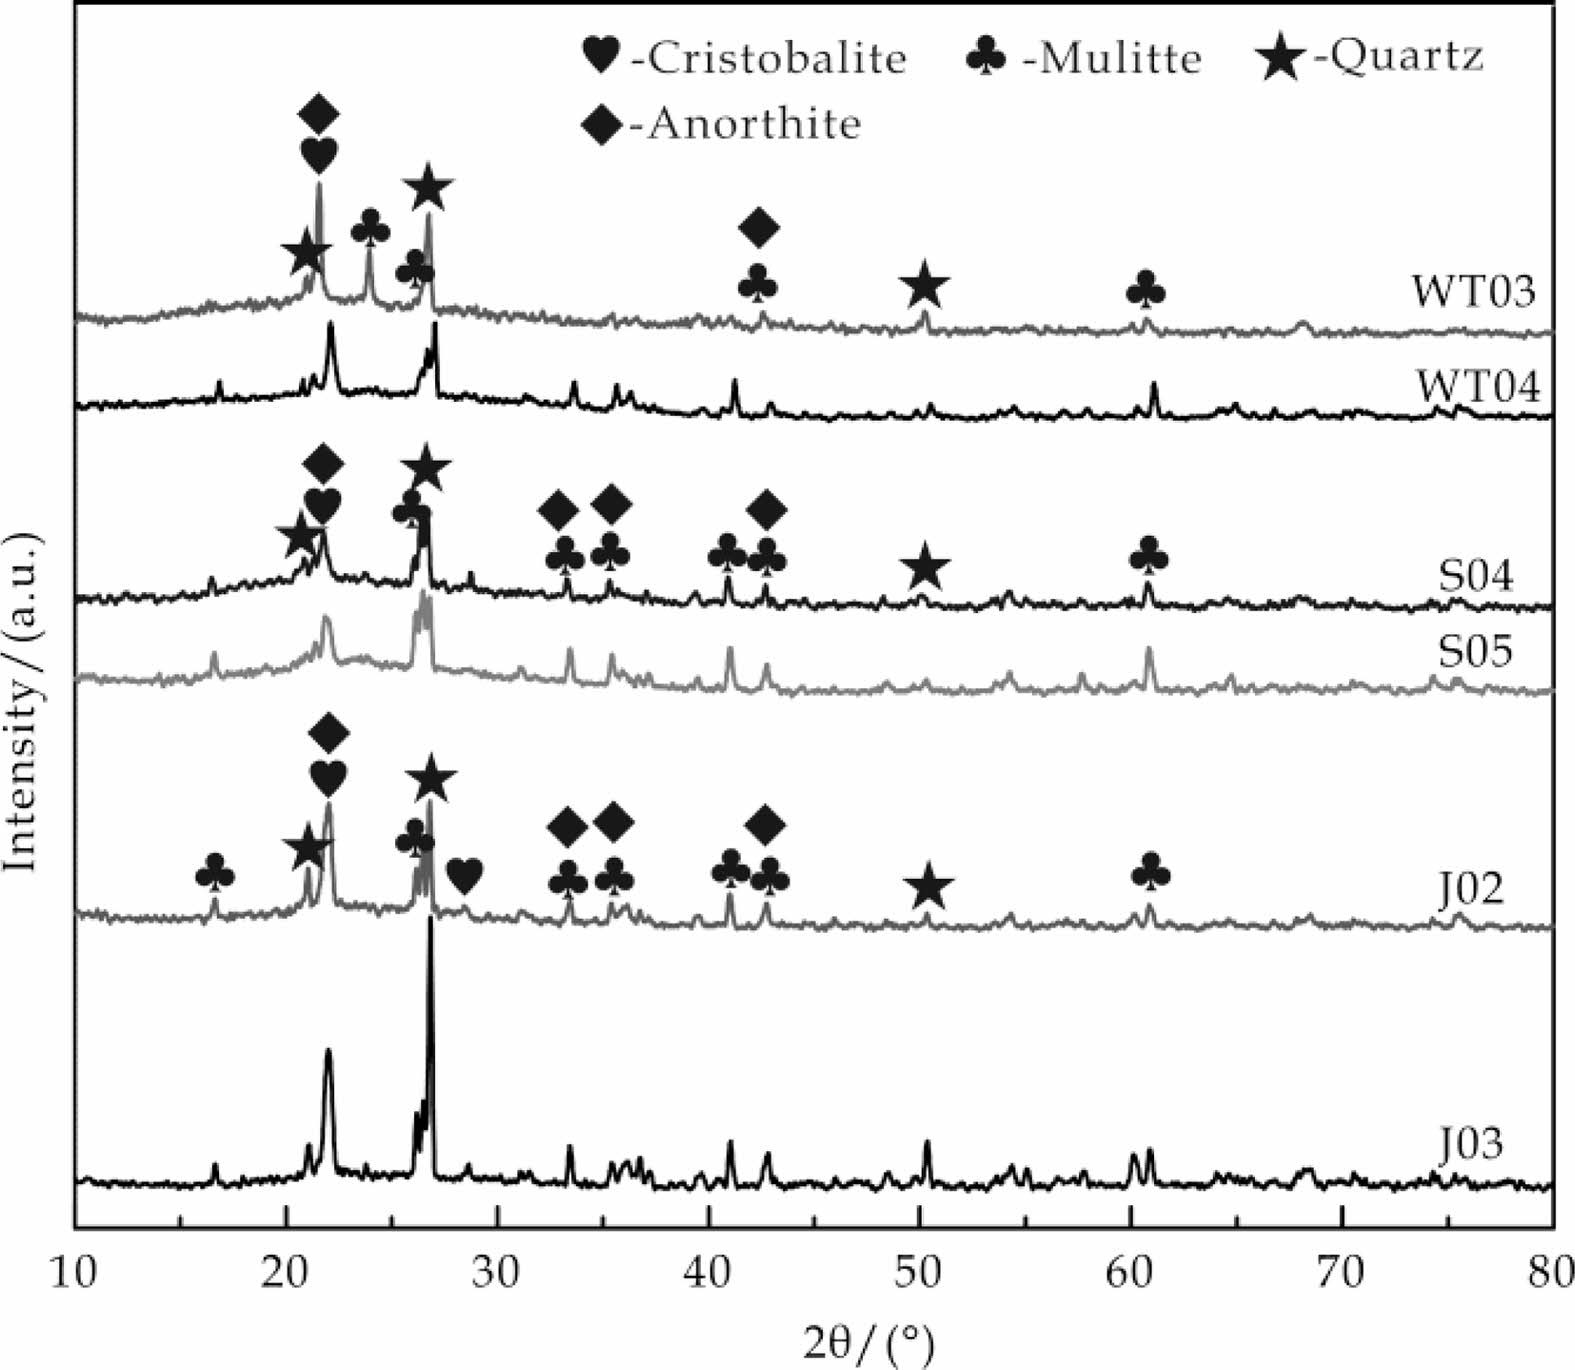
Fig. 4 shows the XRD patterns of WT03, WT04, S04, S05, J02, and J03 glazes. The characteristics of the amorphous hump can be seen within the 2θ≈15-35°range in all samples, which are associated with a large amount of aluminosilicate glass [18], where S05 and WT03 are the most obvious. In addition, all samples have different intensities of crystalline diffraction peaks, where the most intensive is from the Jin dynasty, followed by the Five Dynasty, and the weakest is in the Song dynasty. The anorthite content of the celadon glazes of the three dynasties is high, which is related to the content of CaO in the glaze (as shown in Table 3) .The content of CaO in the glaze of the three periods is strong relatively, which has a greater contribution to the precipitation of anorthite crystals and makes the content of anorthite crystals increased. This is because the chemical composition of the ceramic glaze determines its crystallinity [19].The compositions of the base glaze from the three dynasties are relatively close to each other, and the crystal types are basically the same. Among the three samples, the crystalline content in Jin dynasty sample was relatively high, likely due to its firing temperature.
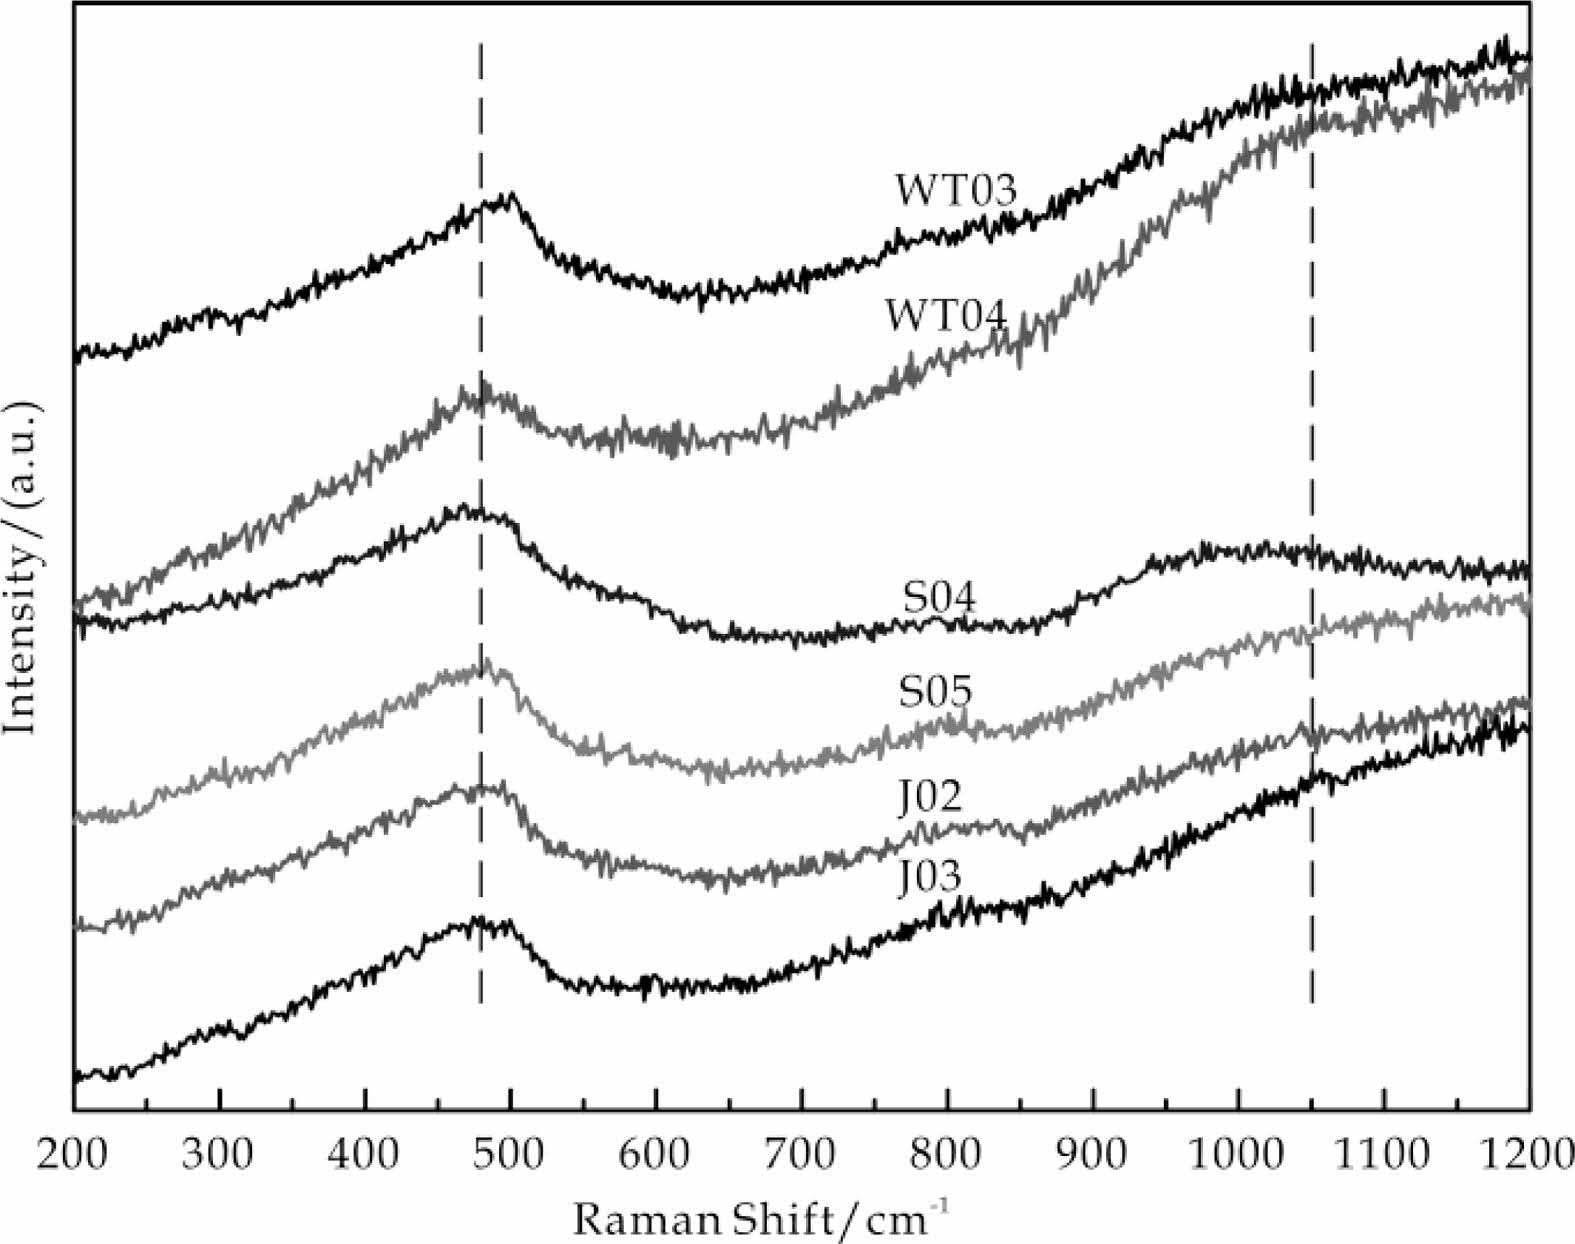
Figure 5 shows the Raman spectrum of the glaze of WT03, WT04, S04, S05, J02, and J03 samples. It can be seen that all samples have two strong Raman peaks at 480.53 cm-1 and 1050.62 cm-1, which are the bending and stretching vibration peaks of the Si-O bond in the [SiO4] tetrahedron [20, 21]. According to the research of Colomban et al. [20], the bending vibration peak and stretching vibration peak of the Si-O bond in the sample [SiO4] tetrahedron were Gaussian fitted, and their respective Ip values were calculated (as shown in Fig. 6). The order of their Ip values is S05 > S04 > WT03 > WT04 > J03 > J02. Accordingly, the firing temperature of the Song dynasty olive-green glaze of the Yaozhou kiln is the highest, followed by the Five Dynasty sky-green glaze, and the Jin dynasty moon-white glaze is the lowest. This is consistent with the results of previous studies [13, 22].
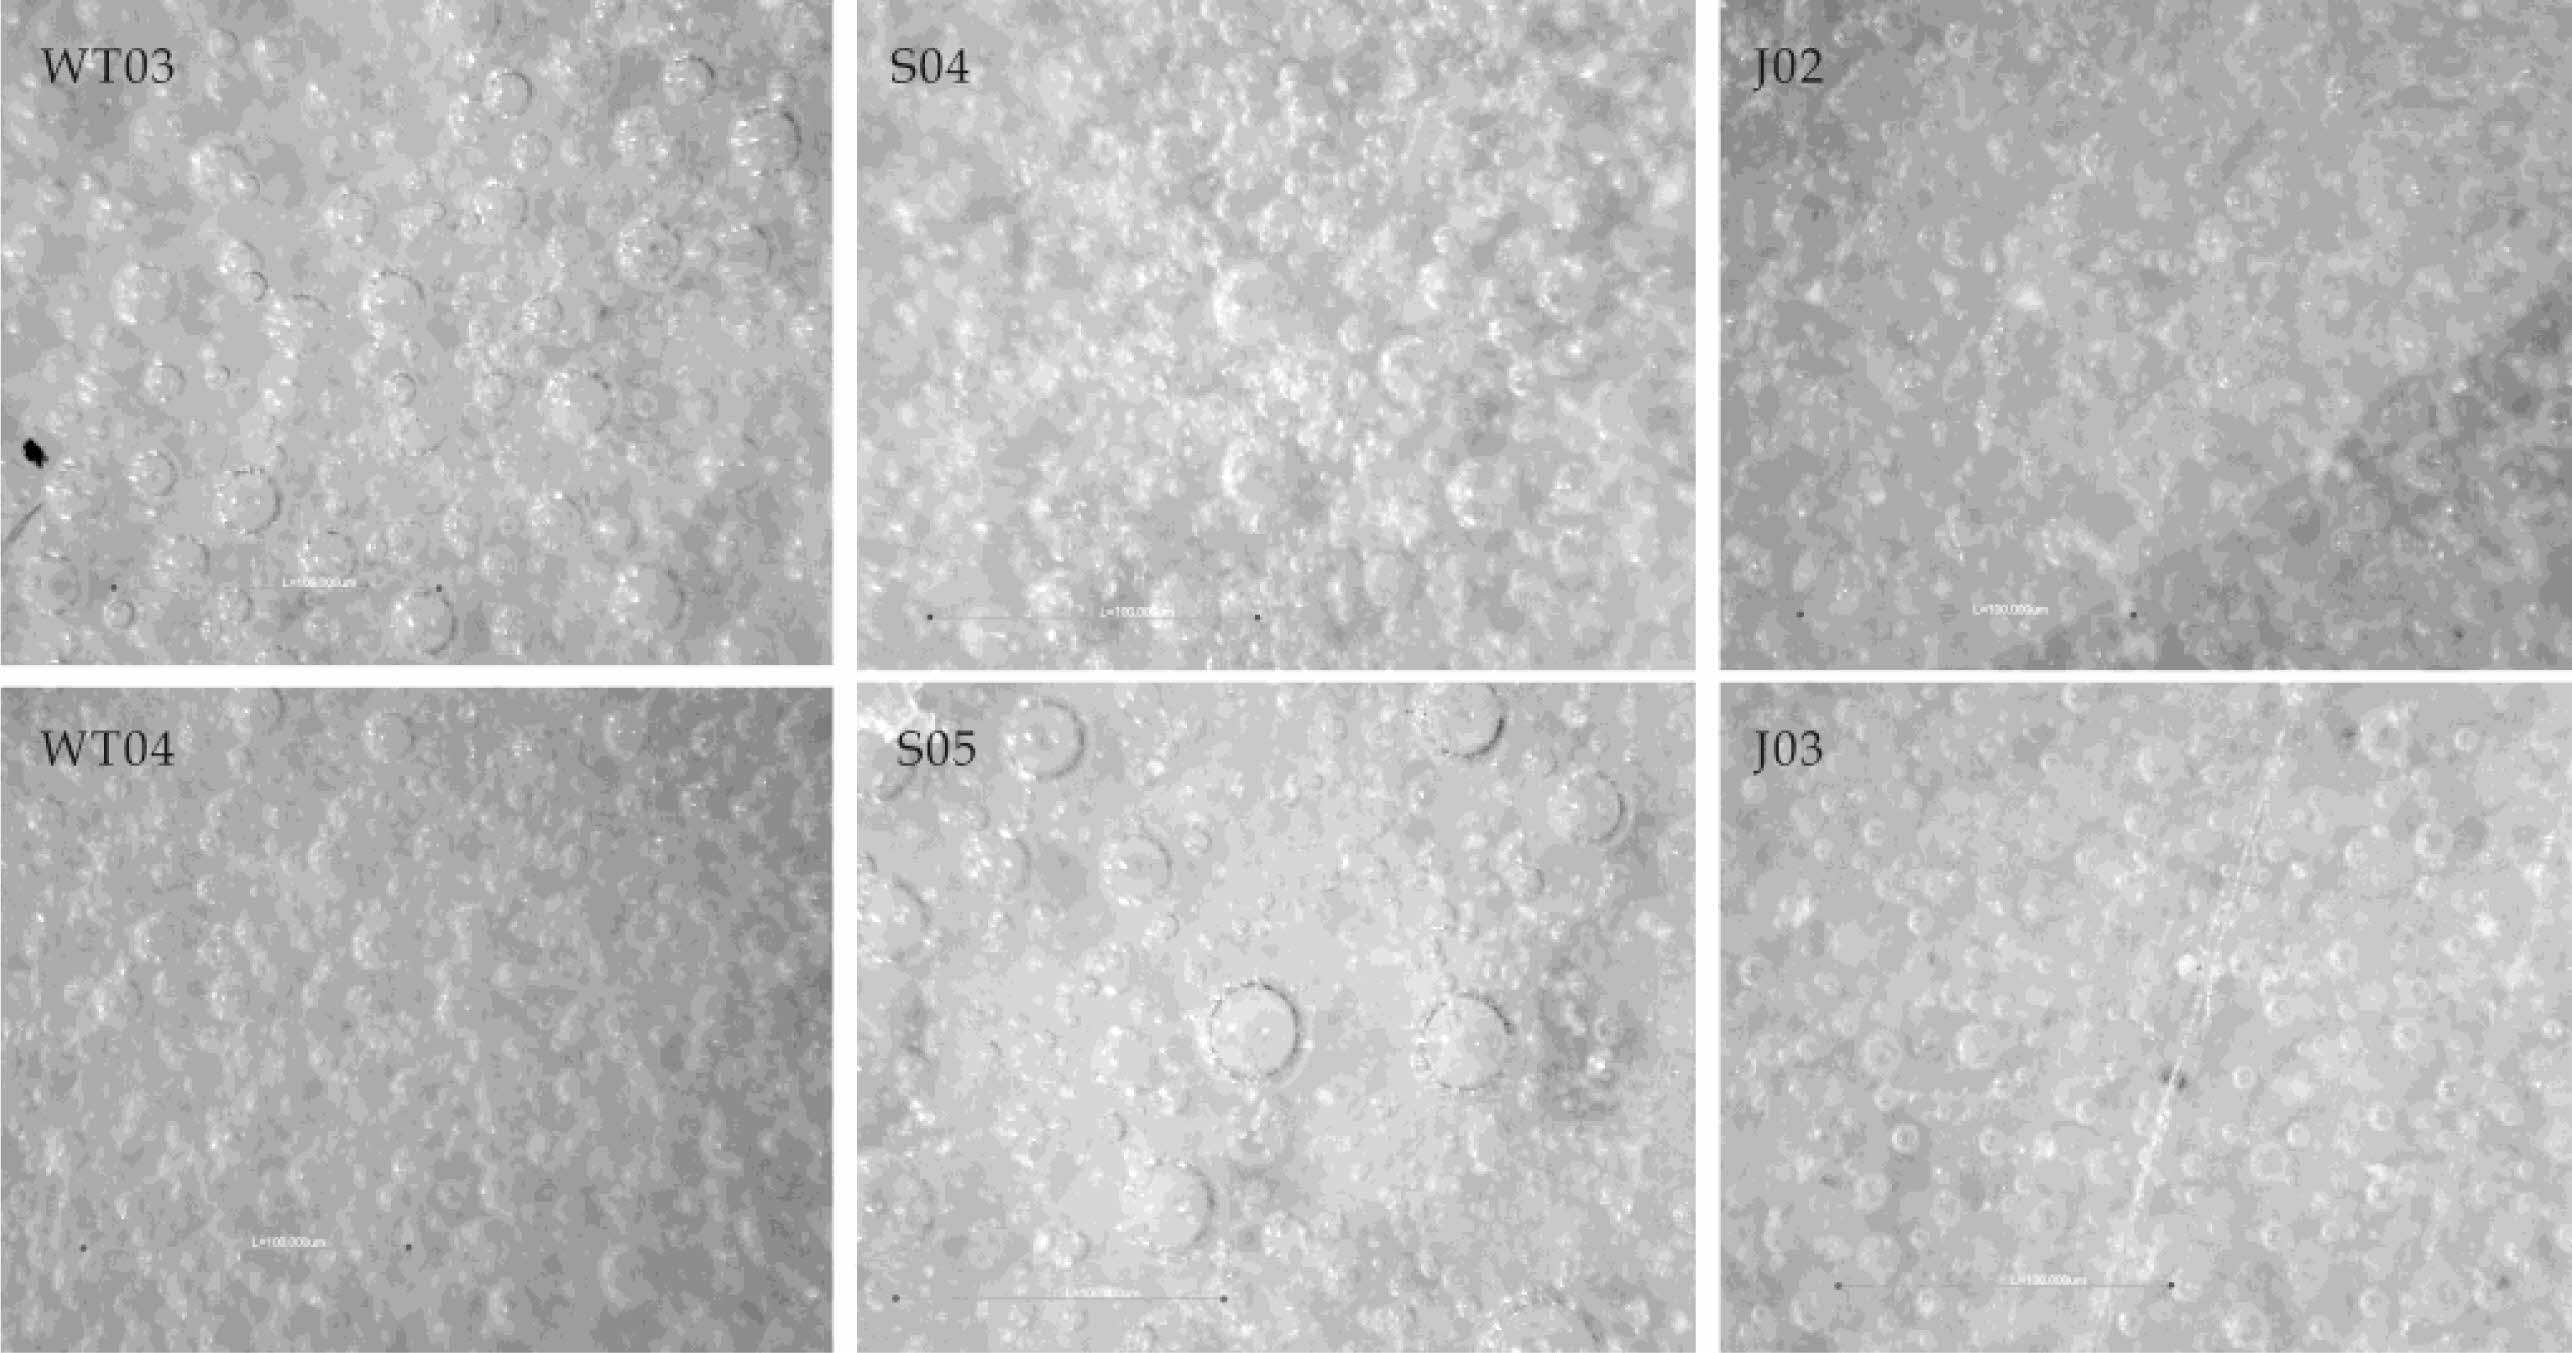
Figure 7 is an optical photograph of the sample glaze surface. By comparison, the bubbles of the Jin dynasty moon-white glaze in Yaozhou kiln are the smallest and densest. The bubbles can generate strong scattering on incident light, so the opaqueness of the glaze of the Jin dynasty samples is the highest, thereby greatly improving the jade effect of the glaze. The bubbles in the Song dynasty samples are relatively low in density and large in size, so the surface of the glaze is smooth and the glaze layer is transparent; the density and size of the bubbles in the Five Dynasty samples are in the middle, and the opacification effect is formed by the crystals and bubbles in the glaze. During the firing of ceramics, the partial pressure of the gas in the bubble is related to the supersaturation of the dissolved gas in the glaze melt. The greater the supersaturation, the lower the partial pressure of the gas in the bubble, which makes it easier for the gas to enter the bubble from the melt. As the volume of the bubble increases, its rising speed gradually accelerates, and then rapidly floats on the surface of the glaze [23]. According to the differences in density and bubble size in the sample glazes of different periods, the supersaturation of the dissolved gas in the Song dynasty olive-green glaze of Yaozhou kiln is the highest, followed by the Five Dynasty sky-green glaze and the Jin dynasty moon-white glaze. It was also determined that the higher the viscosity of the glaze melt, the lower the supersaturation. The lower the firing temperature of the ceramic or the higher the SiO2 content in the chemical composition of the glaze, the greater the melt viscosity, and the lower the supersaturation. As firing temperature of the glaze increases, the chemical composition of the alkali metal and alkaline earth metal in the chemical composition increases. The higher the content, the lower the viscosity of the melt, which leads to higher supersaturation [23]. The samples in the Song dynasty have higher alkali metal and alkaline earth metal contents and firing temperatures, thus the size of the bubbles in the glaze is larger and the transparency of the glaze layer is higher, while the celadon glaze in the Jin dynasty sample has the highest SiO2 content and the lowest firing temperature, so it is difficult for bubbles to be expelled, accumulating densely on the glaze.
Relationship between Fe ion chemical state and glaze color
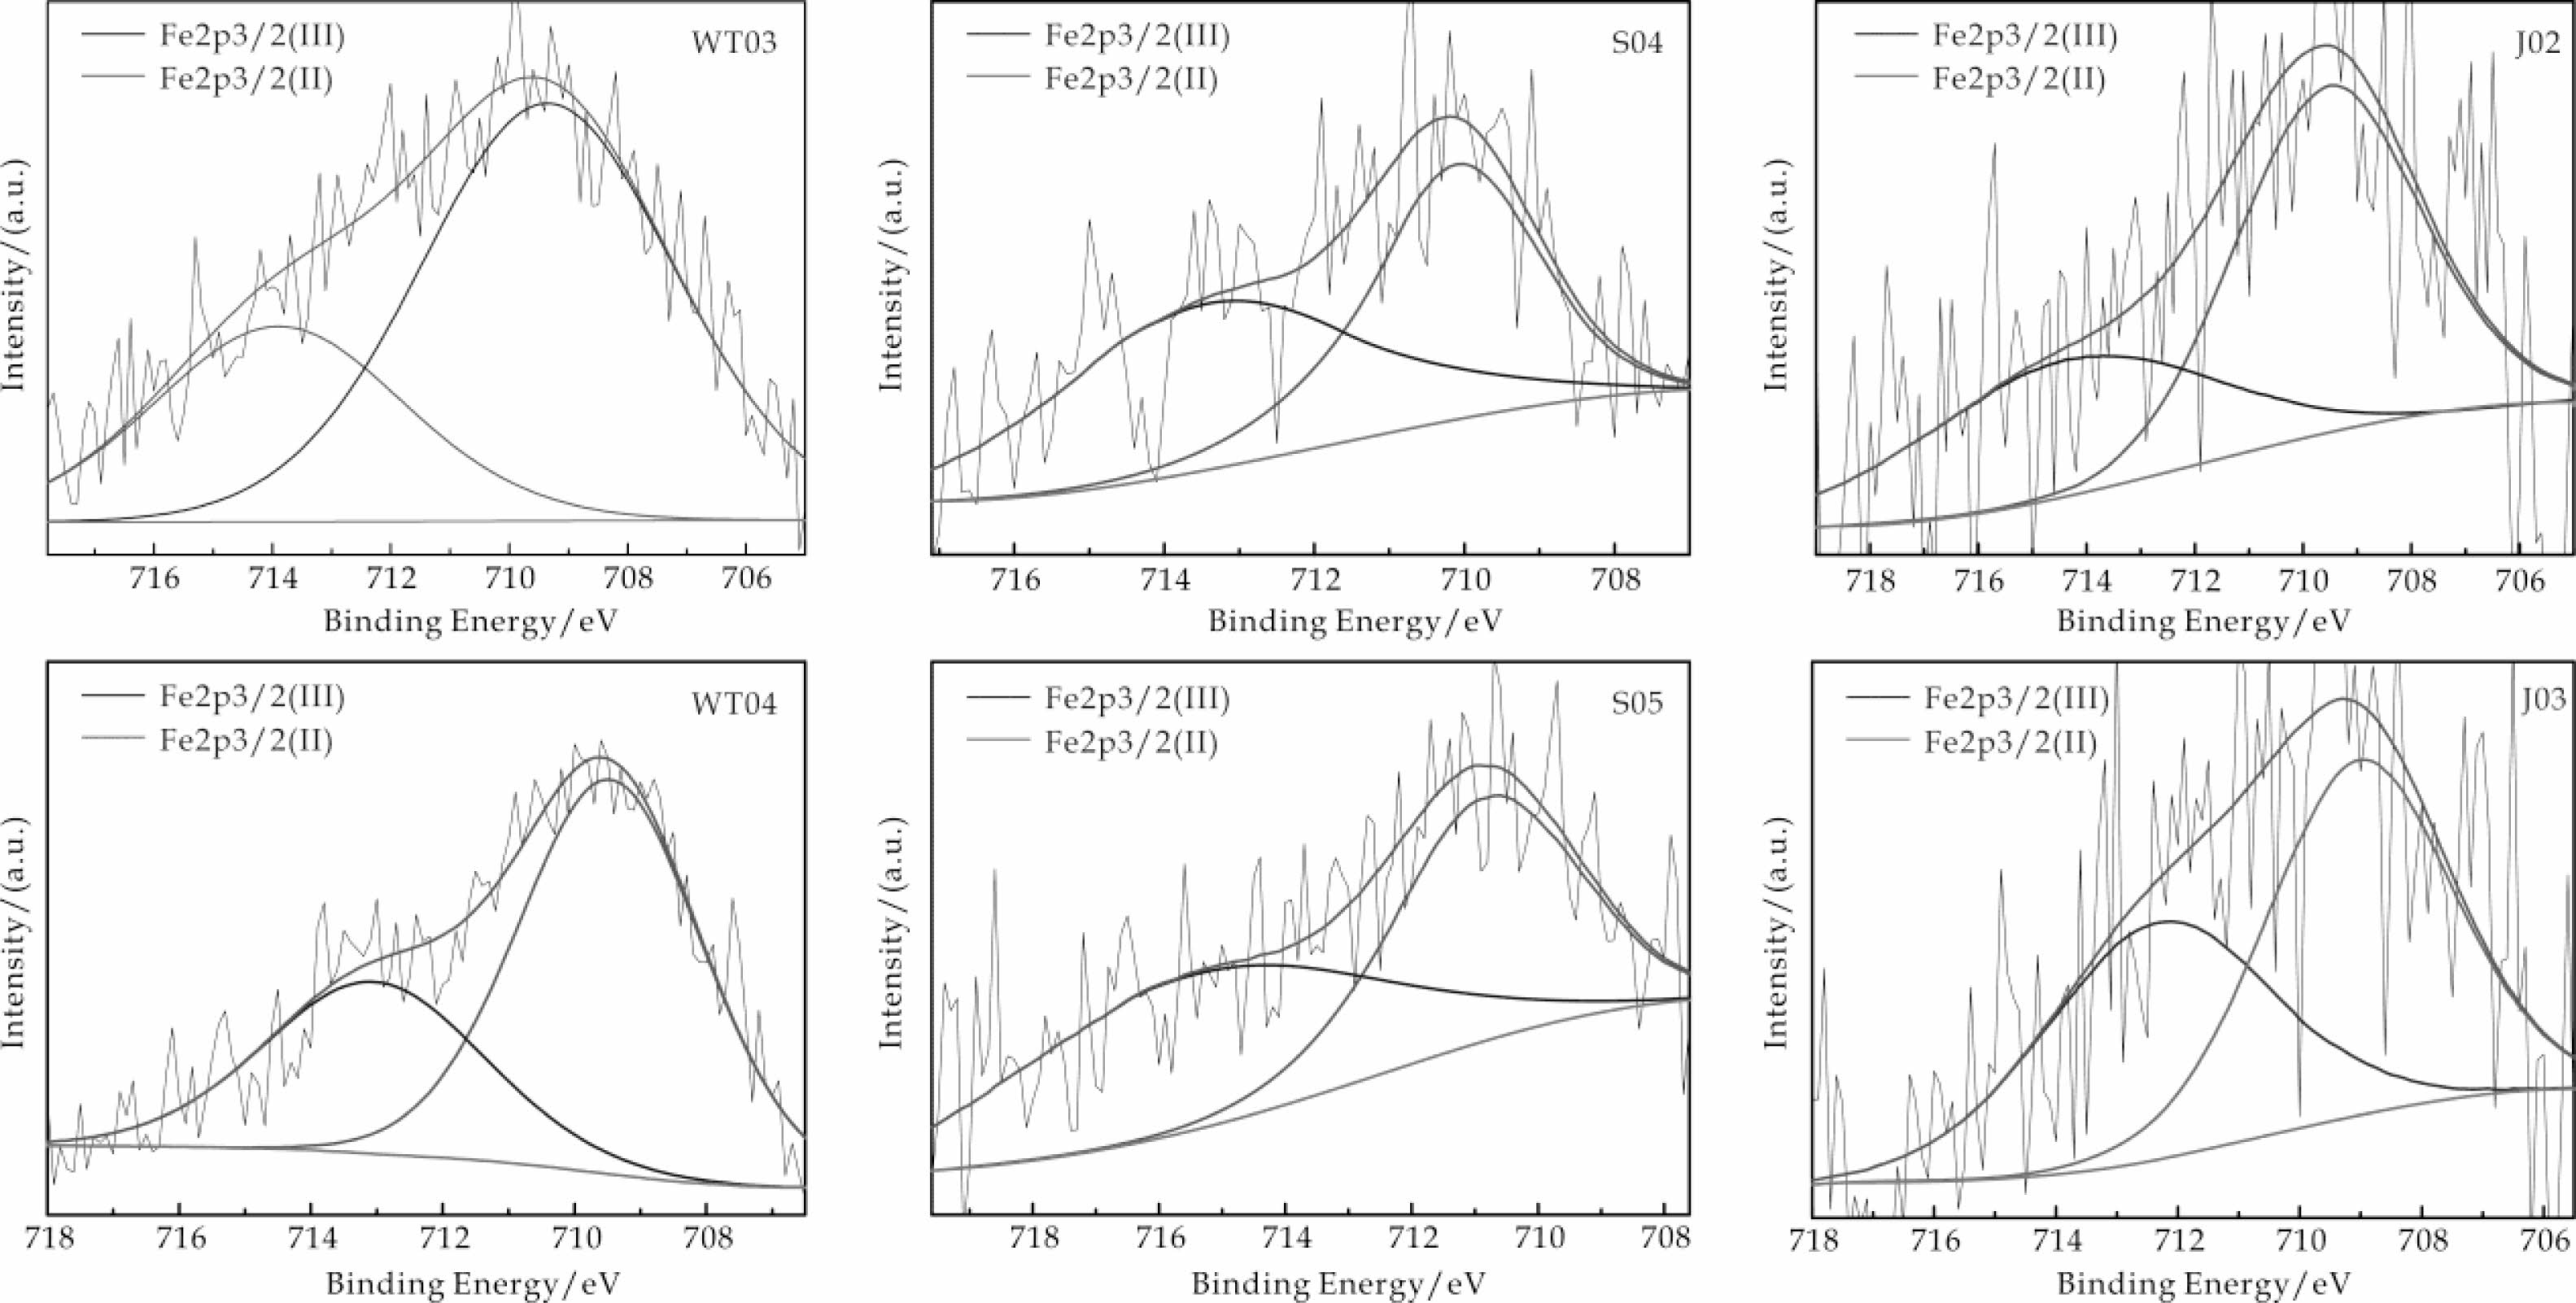
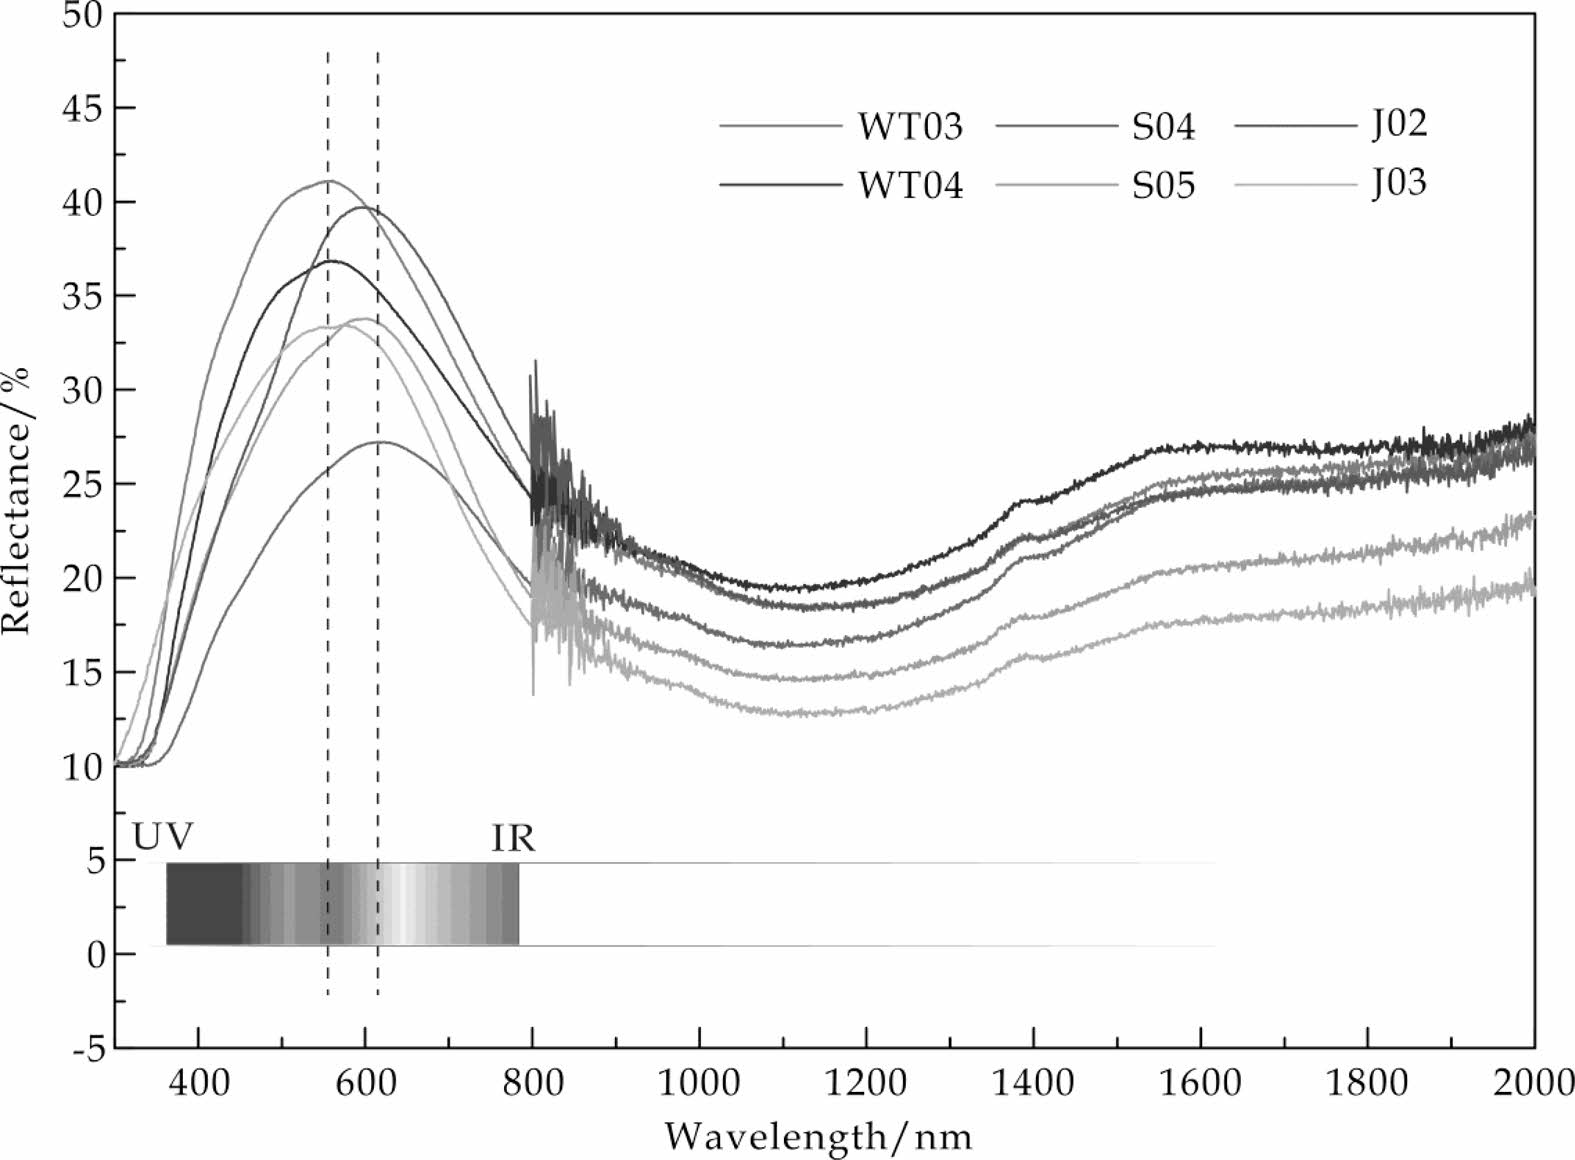
The color of celadon glaze is mainly determined by the chemical color produced by the Fe ion coloring group. To accurately analyze the relationships between the coloration and the chemical state of the Fe element of the Yaozhou Five Dynasty sky-green, the Song dynasty olive-green and the Jin dynasty moon-white glazes, two samples close to the average value of each dynasty were selected according to the L*, a*, and b* values by Casa XPS software to perform peak-split fitting processing on its Fe 2p3/2 energy spectrum curve. It was found from the fitting diagram in Figure 8 that the electron binding energies of Fe2p3/2 (III) and Fe2p3/2 (II) are 712.02-714.83 eV and 708.44-710.78 eV, respectively [20]. According to the area of each peak, the ratios of Fe3+and Fe2+ in samples WT03, WT04, S04, S05, J02, and J03 are 31.55/68.45, 34.15/65.85, 55.22/44.78, 51.51/48.49, 39.03/60.97, and 44.94/55.06, which is consistent with the results of the UV-vis-NIR reflection spectra in Figure 9. Generally, the sample color of the Five Dynasty sky-green glaze is relatively blue, the Song dynasty olive green glaze is yellowish green, and the Jin dynasty moon-white glaze is between the two but closer to that of the Five Dynasty. The greater the ratio of Fe3+ to Fe2+, the greater the b* value of the glaze [24], which is generally consistent with the b* values of the samples in Table 2.

|
Fig. 2 Scatter diagrams of L*, a* and b*of glaze surfaces in celadon samples. |
|
Fig. 3 Distribution map of K2O, CaO and Fe2O3 contents in celadon glazes of Five, Song and Jin dynasty of Yaozhou kiln. |
|
Fig. 4 XRD patterns on glaze surfaces of samples. |
|
Fig. 5 Raman spectra on glaze surfaces of samples. |
|
Fig. 6 Fitting Raman spectra of samples. |
|
Fig. 7 Optical images on glaze surfaces of samples. |
|
Fig. 8 Fitting XPS spectra of Fe 2p3/2 for glaze of samples. |
|
Fig. 9 Reflection spectrum of samples |
(1) The content of Fe2O3 in the Song dynasty olive-green, the Five Dynasty sky-green, and the Jin dynasty moon-white glazes of Yaozhou kiln successively decreased, which is the main reason for the gradual fading of their glaze colors. The higher content of K2O, CaO, and P2O5 in the Five Dynasty sky-green glaze is the main factor for its deep greenish-blue color.
(2) The Raman Ip value of Yaozhou celadon in the Song, Five Dynasty and Jin dynasty decreased successively, indicating that the firing temperature was the highest in the Song dynasty. Lower firing temperatures are one of the main reasons for the smallest and densest bubbles in the glaze layer of the Jin dynasty moon-white ware, which is also an important reason for its highest opacity.
(3) The order of the ratio of Fe3+ to Fe2+ in the celadon glaze of the three dynasties of Yaozhou kiln is Song > Jin > Five Dynasty. This ratio of iron ions is the root cause of the successive color decrease of the greenish-blue for the Five Dynasty sky-green glaze, the Jin dynasty moon-white and for the Song dynasty olive-green glaze.
This work was supported by the National Natural Science Foundation of China (51972201) and Project from the Chinese Ministry of Science and Technology Grants (2019YFC1520200) and the Key Science & Technology Program of Shaanxi Province, China (2022GY-340).
- 1. X.M. Feng, in “Ancient Chinese Ceramics Map” (Cultural Relics Press, 1998) p. 198-206.
- 2. P. Shi, F. Wang, J. Zhu, B. Zhang, T. Zhao, Y. Wang, Y. Qin, Ceram. Int. 43[3] (2017) 2943-2949.
-

- 3. P. Shi, F. Wang, Y. Wang, J. Zhu, B. Zhang, Y. Fang, Ceram. Int. 43[15] (2017) 11616-11622.
-

- 4. X.M. Wang, Collection World. 11 (2010) 53-57.
- 5. Z.X. Zhuo, Collectors. 8 (2001) 2-9.
- 6. The Institute of Archaeology, Shaanxi Provincial and Yaozhou Kilns Museum, in “Yaozhou kiln site of the Song period” (Cultural Relics Publishing House, 1998) p. 550-553.
- 7. J.P. Julian, K.H. Tonge, Thermochim. Acta. 340-341 (1999) 395-405.
-

- 8. D.X. Xue, in “History of Yaozhou kiln” (Forbidden City Press, 1992) p. 6-8.
- 9. Z. Sang, F. Wang, X. Duan, T. Mu, Z. Ren, X. Wei, X. Yuan, Y. Jiao, Ceram. Int. 45[17] (2019) 22215-22225.
-

- 10. Y.Y. Guo, G.Z. Li, J. Chin. Ceram. Soc. 2 (1984) 98-107, 136.
- 11. T.C. Ma, in “Ceramic technology” (China Light Industry Press, 2011) p. 116-121.
- 12. C.A. Yang, in “Research on phase separative-phase glaze and its structural color” (Shaanxi University of Science and Technology, 2016).
- 13. Z.T. Yang, Z.X. Zhuo, B.R. Du, Research on the Microstructure of Celadon in Yaozhou Kilns and the Development of Ancient Porcelain Manufacturing Technology, Chinese Academy of Geological Sciences 32 (1991) p. 77-83.
- 14. H.J. Luo, in “Chinese ancient ceramics and multivariate statistical analysis” (China Light Industry Press, 1997) p. 146-152.
- 15. H.J. Luo, J.Z. Li, L.M. Gao, Bull. Chin. Ceram. Soc. 2 (1995) 50-53.
- 16. Edited by the China Silicate Society, in “Silicate Dictionar” (China Architecture & Building Press, 1984) p. 56-60.
- 17. T. Zhu, H. Huang, H. Wang, L. Hu, X. Yi, J. Archaeol. Sci. 38[11] (2011) 3134-3140.
-

- 18. X. Cheng, S. Ke, Q. Wang, H. Wang, A. Shui, P. Liu, Ceram. Int. 38[6] (2012) 4901-4908.
-

- 19. J. Qin, C. Cui, X.Y. Cui, J. Synth. Cryst. 45[5] (2016), pp. 1153-1157.
- 20. P. Colomban, O. Paulsen, J. Am. Ceram. Soc. 2 (2005) 390-395.
-

- 21. Hangzhou University, in “Handbook of Analytical Chemistry, Volume 3, Electrochemical and Optical Analysis” (Chemical Industry Press, 1983) p. 95-100.
- 22. F. Wang, in “Pottery and Porcelain of Yaozhou Kiln” (Shaanxi Science and Technology Press, 2000) p. 103-111.
- 23. Y.Z. Zhao, Hairong Yin, in“Glass Technology” (Chemical Industry Press, 2006) p. 35-42.
- 24. J.-Y. Kim, H. No, A.Y. Jeon, U. Kim, J.-H. Pee, W.-S. Cho, K.J. Kim, C.M. Kim, C.S. Kim, Ceram. Int. 37[8] (2011) 3389-3395.
-

 This Article
-
2022; 23(6): 758-765
Published on Dec 31, 2022
- 10.36410/jcpr.2022.23.6.758
- Received on Jul 31, 2020
- Revised on Oct 12, 2020
- Accepted on Oct 23, 2020
 Services
- Abstract
introduction
experimental procedure
results and discussion
conclusion
- Acknowledgements
- References
- Full Text PDF
Shared
 Correspondence to
- Zhen Sang
-
aSchool of Materials Science and Engineering, Shaanxi Key Laboratory of Green Preparation and Functionalization for Inorganic Materials, Shaanxi University of Science and Technology, Xi'an 710021, PR China
bCollege of Art and Design, Shaanxi University of Science & Technology, Xi'an 710021, PR China
Tel : +86-029-86168815 - E-mail: sangzhen@sust.edu.cn


 Copyright 2019 International Orgranization for Ceramic Processing. All rights reserved.