- Structural investigation and improvement of microwave dielectric properties in Ca1-xBaxTiO3, low loss ceramics
Sarir Uddina,†, Abid Zamanb,†,*, Imtiaz Rasoolc, Sadiq Akbarc, Muhammad Kamranc, Nasir Mehboobb, Asad Alib, Abid Ahmadb, Muhammad Farooq Nasirb and Zafar Iqbalb
aDepartment of Physics, Government College Hayatabad, Peshawar 25000, Pakistan
bDepartment of Physics, Riphah International University, Islamabad 44000, Pakistan
cDepartment of Electronics, University of Peshawar, 25120, Pakistan
The effects of Ba substitution
on the phase analysis, microstructure and microwave dielectric properties of Ca1-xBaxTiO3
ceramics were prepared through conventional solid state reaction route.
The X-ray diffraction analysis of the samples showed that the specimens Ca1-xBaxTiO3
presented single phase compound with orthorhombic structure in the range of
x=0.0 to 0.7 when sintered at 1300oC for 3hrs in air. From the
morphological point of view, it consists of round and rod shaped grains with
porous microstructure. The substitution of Ba2+ ions over Ca2+,
the microwave dielectric constant (εr) diminishes from 145 to 52
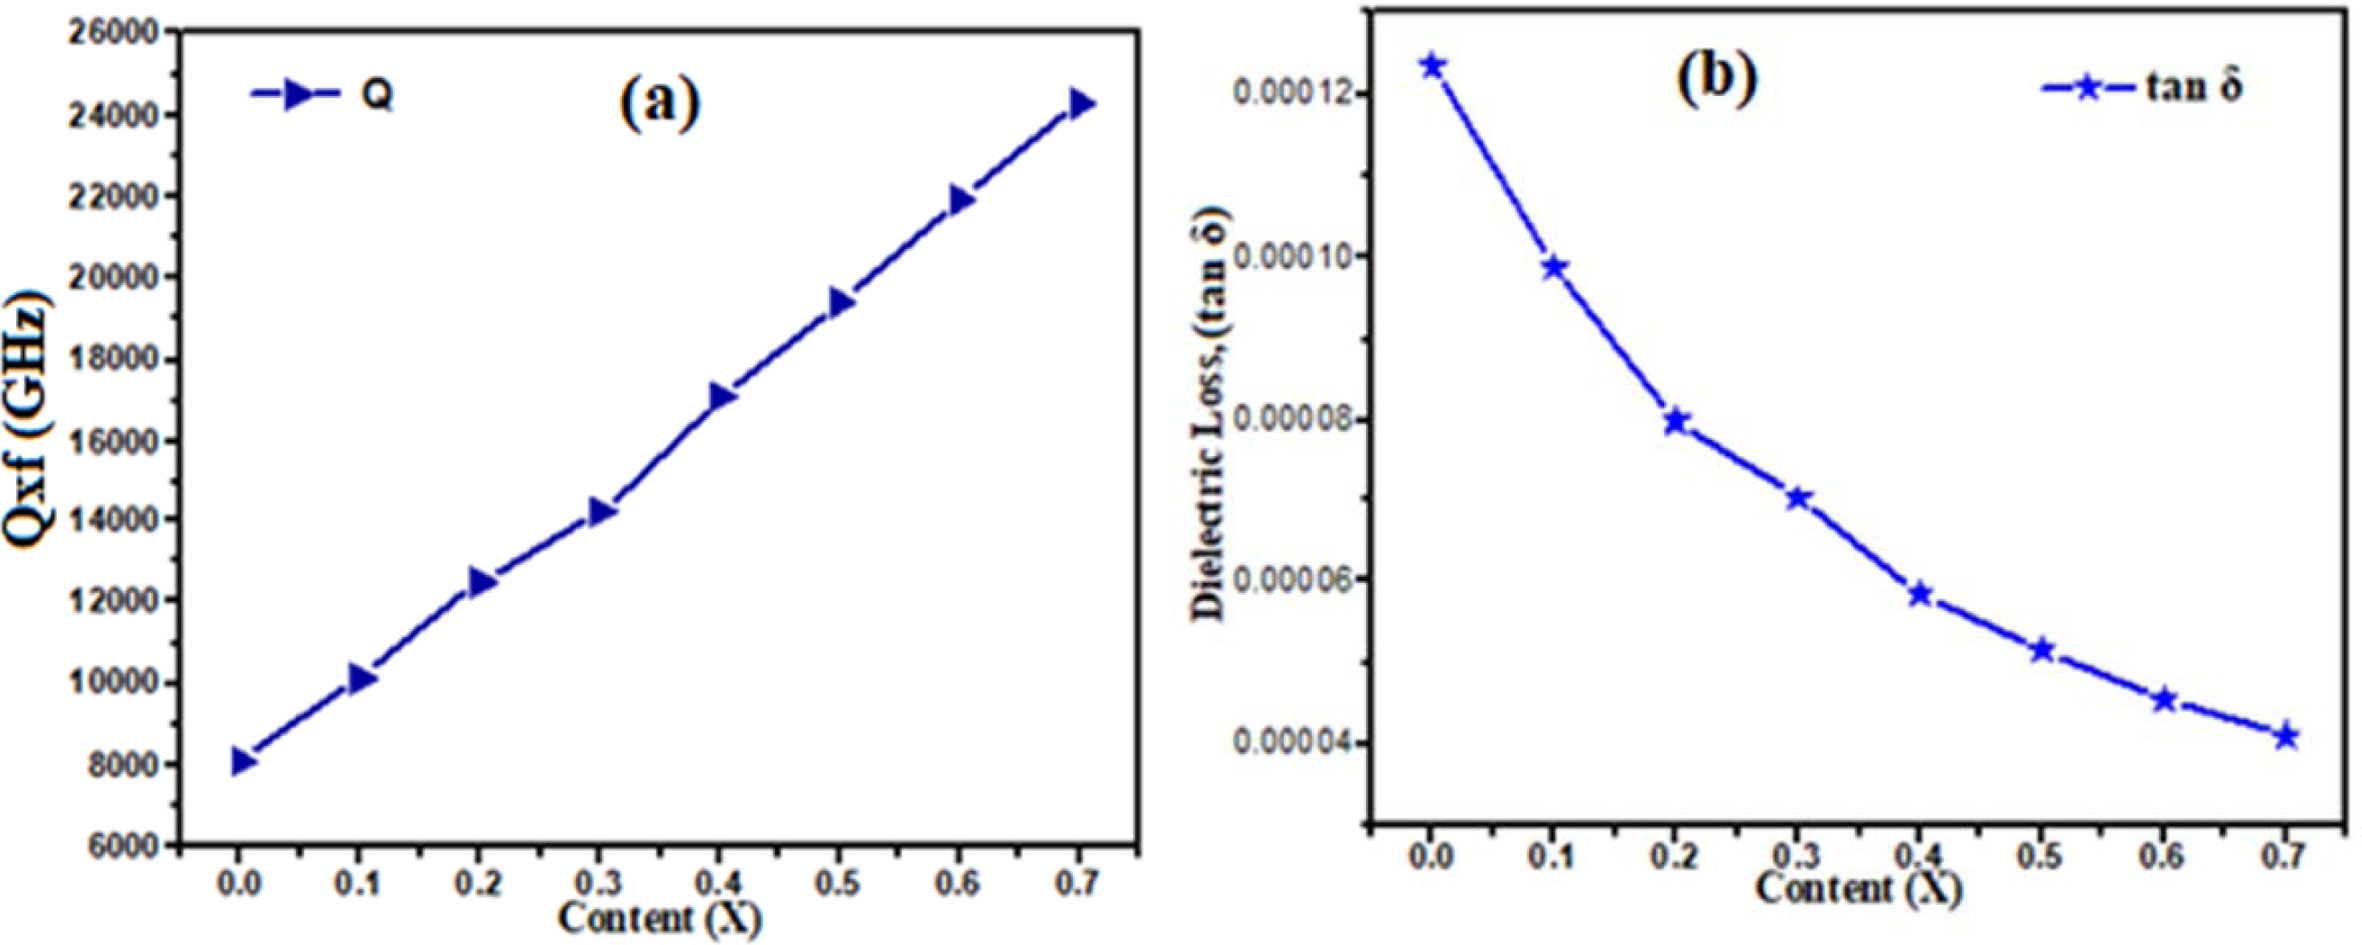
whereas the quality factor (Qxf) will increases from 8105 to 24305 GHz and
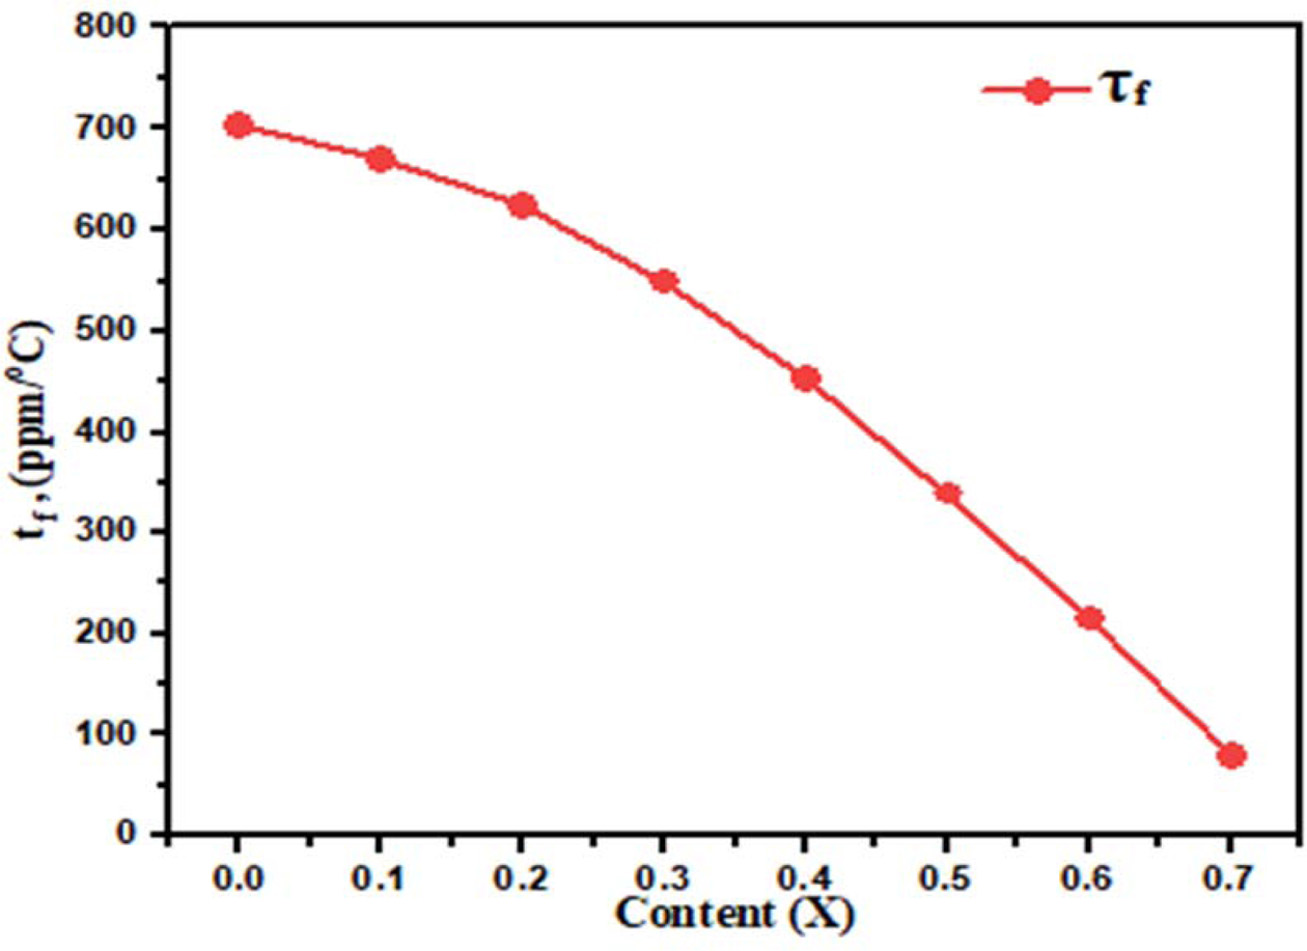
temperature coefficient of resonant frequency decreases from 705 to 80 ppm/oC
(at 3 GHz).
Keywords: CaTiO3, Solid State Reaction Route, Crystal structure, Microstructure, Dielectric Properties
The last couple of decades, the rapid developments of
microwave communication technology such as several different
wireless communication, rapid production of low-cost, lightweight, television
receiver only (TVRO, 2-5 GHz), direct broadcasting (DBS, 11 GHz to 13 GHz) and
high reliable devices [1, 2]. The necessity for miniature low loss microwave
devices has led to the dielectric material loading of cavity resonator, using
dielectric resonators [3, 4]. These dielectric resonators should
satisfy three foremost criteria; viz a high dielectric constant for
size miniaturization, a low dielectric loss for good selectivity and temperature
coefficient of resonant frequency is close to zero for stable frequency
stability [5].
Calcium titanium oxide CaTiO3 (CT) is an
excellent ceramic for microwave (MW) dielectric since it has a large
permittivity er = 160
and an allowable quality factor, Q = 8,000 at 1.5 GHz. But
unfortunately its feature is a high positive temperature co-efficient of the
resonant frequency tf = +850 ppm K-1 [6, 7]. The dielectric properties of CaTiO3 ceramics will be further improved by
introducing isovalent substitution like Sr+2, Mg+2 or Ba+2
at A-site of ABO3 perovskite-structured CaTiO3 [8].
An alternative MgTiO3 ceramics material has
attracted enormous contemplation because of its
good microwave dielectric properties and far low cost. The
dielectric constant ϵr = 17, quality factor Q × f
= 160,000 GHz and temperature coefficient of resonant frequency tf =
-50ppm/oC are achieve for MgTiO3 ceramics [9]. The doping
A-site, with elements like Ni, Co and Zn led to enrichment within the Q × f
value of MgTiO3(180,000 GHz to 364,000 GHz), ϵr =
17.2 and tf ~ -45
ppm/oC [10, 11].
Another promising example of advanced ceramics (1-x)CaTiO3–xLaAlO3
(0 ≤ x ≤ 1) solid solution. The dielectric
constant “ϵr” decrease from 47.83 to 28.25, Q × f
increase from 30,000 to 42,000GHz and the value of temperature co-efficient of
the resonant frequency “tf”
decreases from 17.77 to -20.42 ppm/oC because the LaAlO3 contented
within the CTLA ceramics increased and the polarizability alteration decreases
from 1.74 to 5.0% by the increase of LaAlO3 [12]. The others
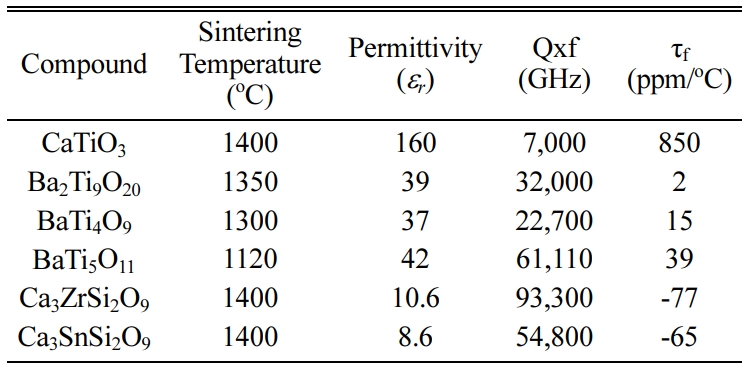
compounds with microwave dielectric properties are shown in Table 1.
A few approaches are received for the synthesis of CaTiO3
either by soft chemistry like Sol-gel or by hydrothermal
or solvothermal methods, co-precipitation, or
organic-inorganic solution [14-17]. High temperature solid state
synthesis of CaTiO3 has been conducted utilizing the mixtures of
calcium carbonate (CaCO3) and titanium dioxide (TiO2)
[18-20].
In the present work, the results on the microstructure improvement
and dielectric properties of CaTiO3 ceramics is
reported. The results prove that the dielectric properties
especially the temperature coefficient of resonant
frequency of the CaTiO3 materials are improved
noticeably.
The samples were arranged through mixed compound
solid state technique as a result it’s the only, the best and
economically route utilized in industries. According to
the formula Ca1-xBaxTiO3 (0 ≤ x ≤ 0.7) with
the highly pure materials of CaCO3 (SIGMA-ALDRICH), BaCO3
(SIGMA-ALDRICH) and TiO2 (SIGMA-ALDRICH) with purity ≥ 99.5%.
The powders were horizontal ball milled in polymer bottle with distilled water
and zirconia balls for 12 h. After the drying method (90 oC for
24 h), the powder were grinded and then calcined at 950 oC
for the composition with x = 0 and 1,000 oC for
the compositions with (0 ≤ x ≤ 0.7) for 3 h at a heating/cooling rate of 5 oC/min.
At that point calcined fine powders (0.5-0.7 g) within the size of 10 mm
diameter and in the thickness 3-4 mm pellets, under the pressure of 100 MPa
with a stainless steel dye during a Carver Manual Uniaxial press. The pellets
were placed on ceramic foil and sintering at 1,300 oC for
3 h at heating/cooling rate of 5 oC/min.
The phase analyses of the samples were carried out via
X-rays diffractometer (XRD) (JDX-3532, JEOL Japan) with
Cu-Kα radiations (λ = 1.540598 Å), operated
at 45 kV and 40 mA was utilize for identification of phases. A step size 0.05º,
a scan rate of 0.5º/min and scan ranges of 10.015-70.015º were embraced. The
microstructures of the sample were analyzed by scanning
electron microscopy (SEM) (JDX-5910, JEOL Japan). For
SEM, samples were polished and thermally etched at temperatures 10% less than
their sintering temperatures for 1 h. The apparent bulk densities of sintered
samples were measured by Archimedes method using
densitometer (MD 300s). The microwave dielectric properties
of the fabricated ceramic pellets were measured by Vector Network Analyzer
(Agilent-R3767CH).
Phase
formation analysis
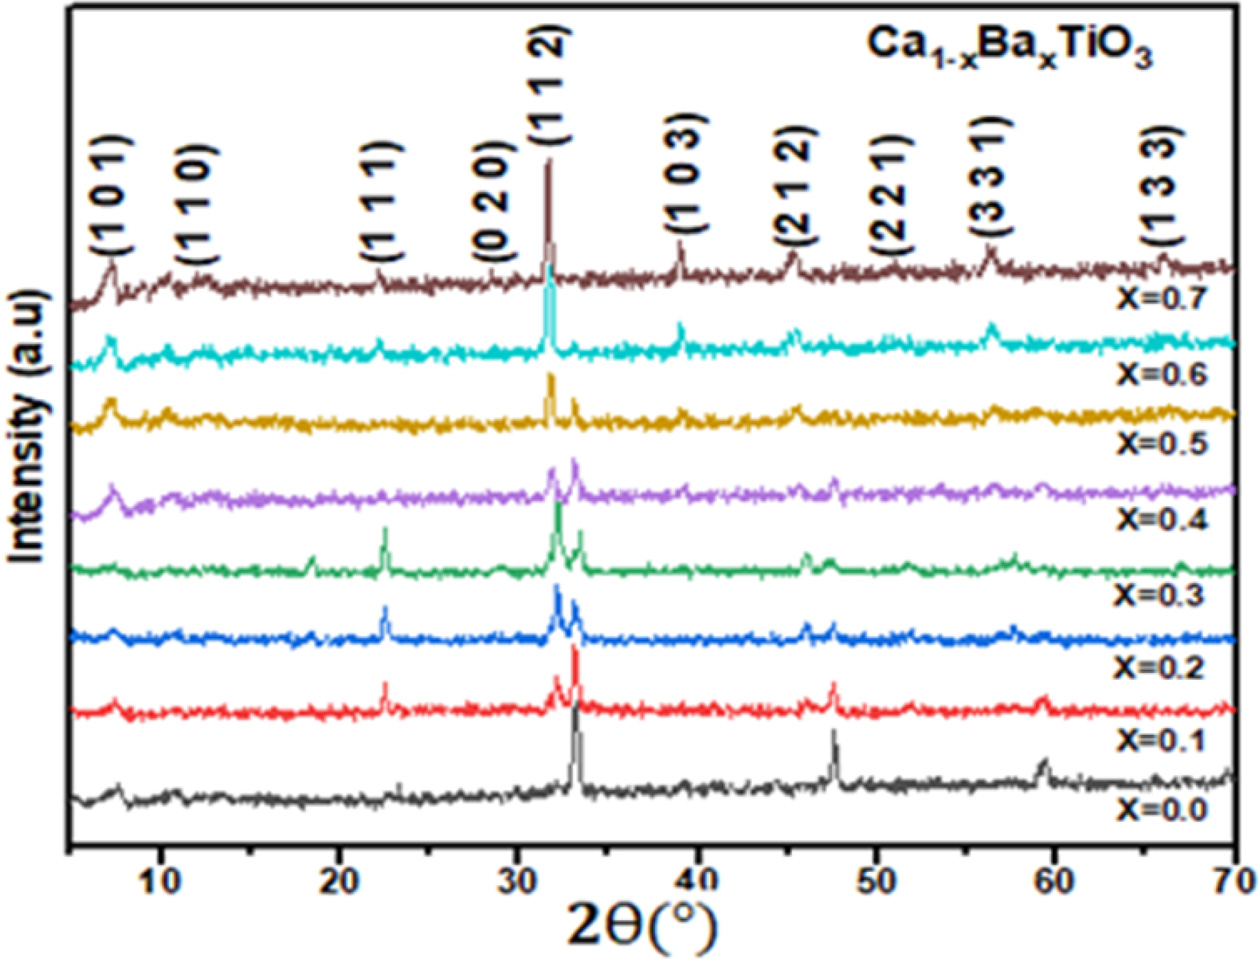
Fig. 1 shows the XRD patterns of Ca1-xBaxTiO3
ceramics sintered at 1,300 oC for 3 h in air where
x = 0.0, 0.1, 0.2, 0.3, 0.4, 0.5, 0.6 and 0.7. At this sintering temperature,
all the samples well developed orthorhombic phase
structures was detected for Ca1-xBaxTiO3 (0 ≤
x ≤ 0.4) but in Ca1-xBaxTiO3 (x ≥ 0.5) the
orthorhombic phase was found. It was observed that the crystal structure of the
synthesized ceramic samples changed from orthorhombic space group
(Pbnm) to orthorhombic space group (Pnab) with the variation
of barium concentration [21,
22]. Besides, with the increasing of “x” the peaks in XRD spectra slowly
shifted to lower angle. It’s because of that ionic radii of Ba2+
ions (r = 1.61 Å) are larger than that of Ca2+ ions
(r = 1.34 Å) [23]. The diffraction peaks in the XRD patterns can be
indexed that belonged to the space group (Pnma) and (Pbnm) matching with pdf
card # (22-153) and (78-1013) respectively. With increasing x from 0 to 0.7,
the lattice parameters ‘a’, ‘b’ and ‘c’ changes almost linearly CaTiO3 to
Ca1-xBaxTiO3. The variation in the lattice
parameters ‘a’, ‘b’ and ‘c’ of the Ca1-xBaxTiO3
ceramics with the increase in Ba2+ content is shown in Table 2. The
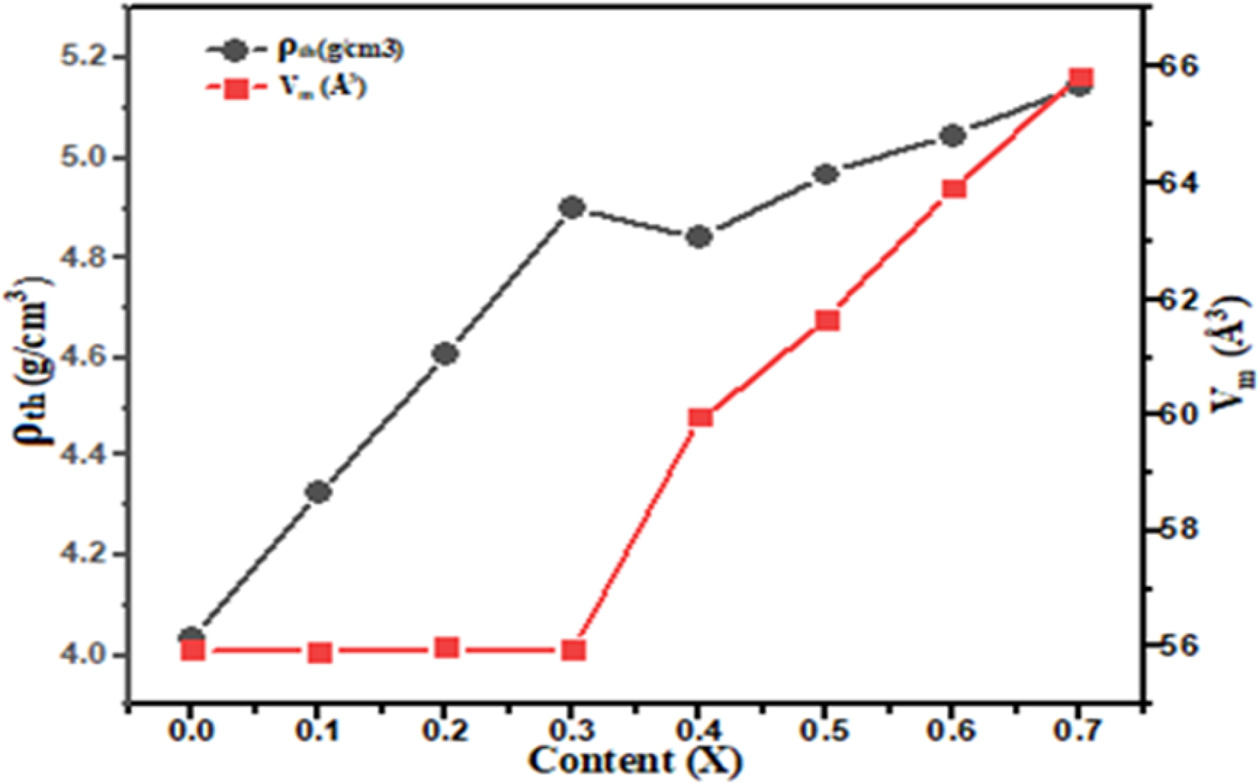
variation of theoretical density (ρth) and molar volume (Vm)
as a function of x is shown in Fig. 2. The theoretical density (ρth)
increases due to the replacement of lighter atomic mass Ca+2 ions
unit cell for the higher atomic mass Ba+2 ions.
Microstructural
analysis
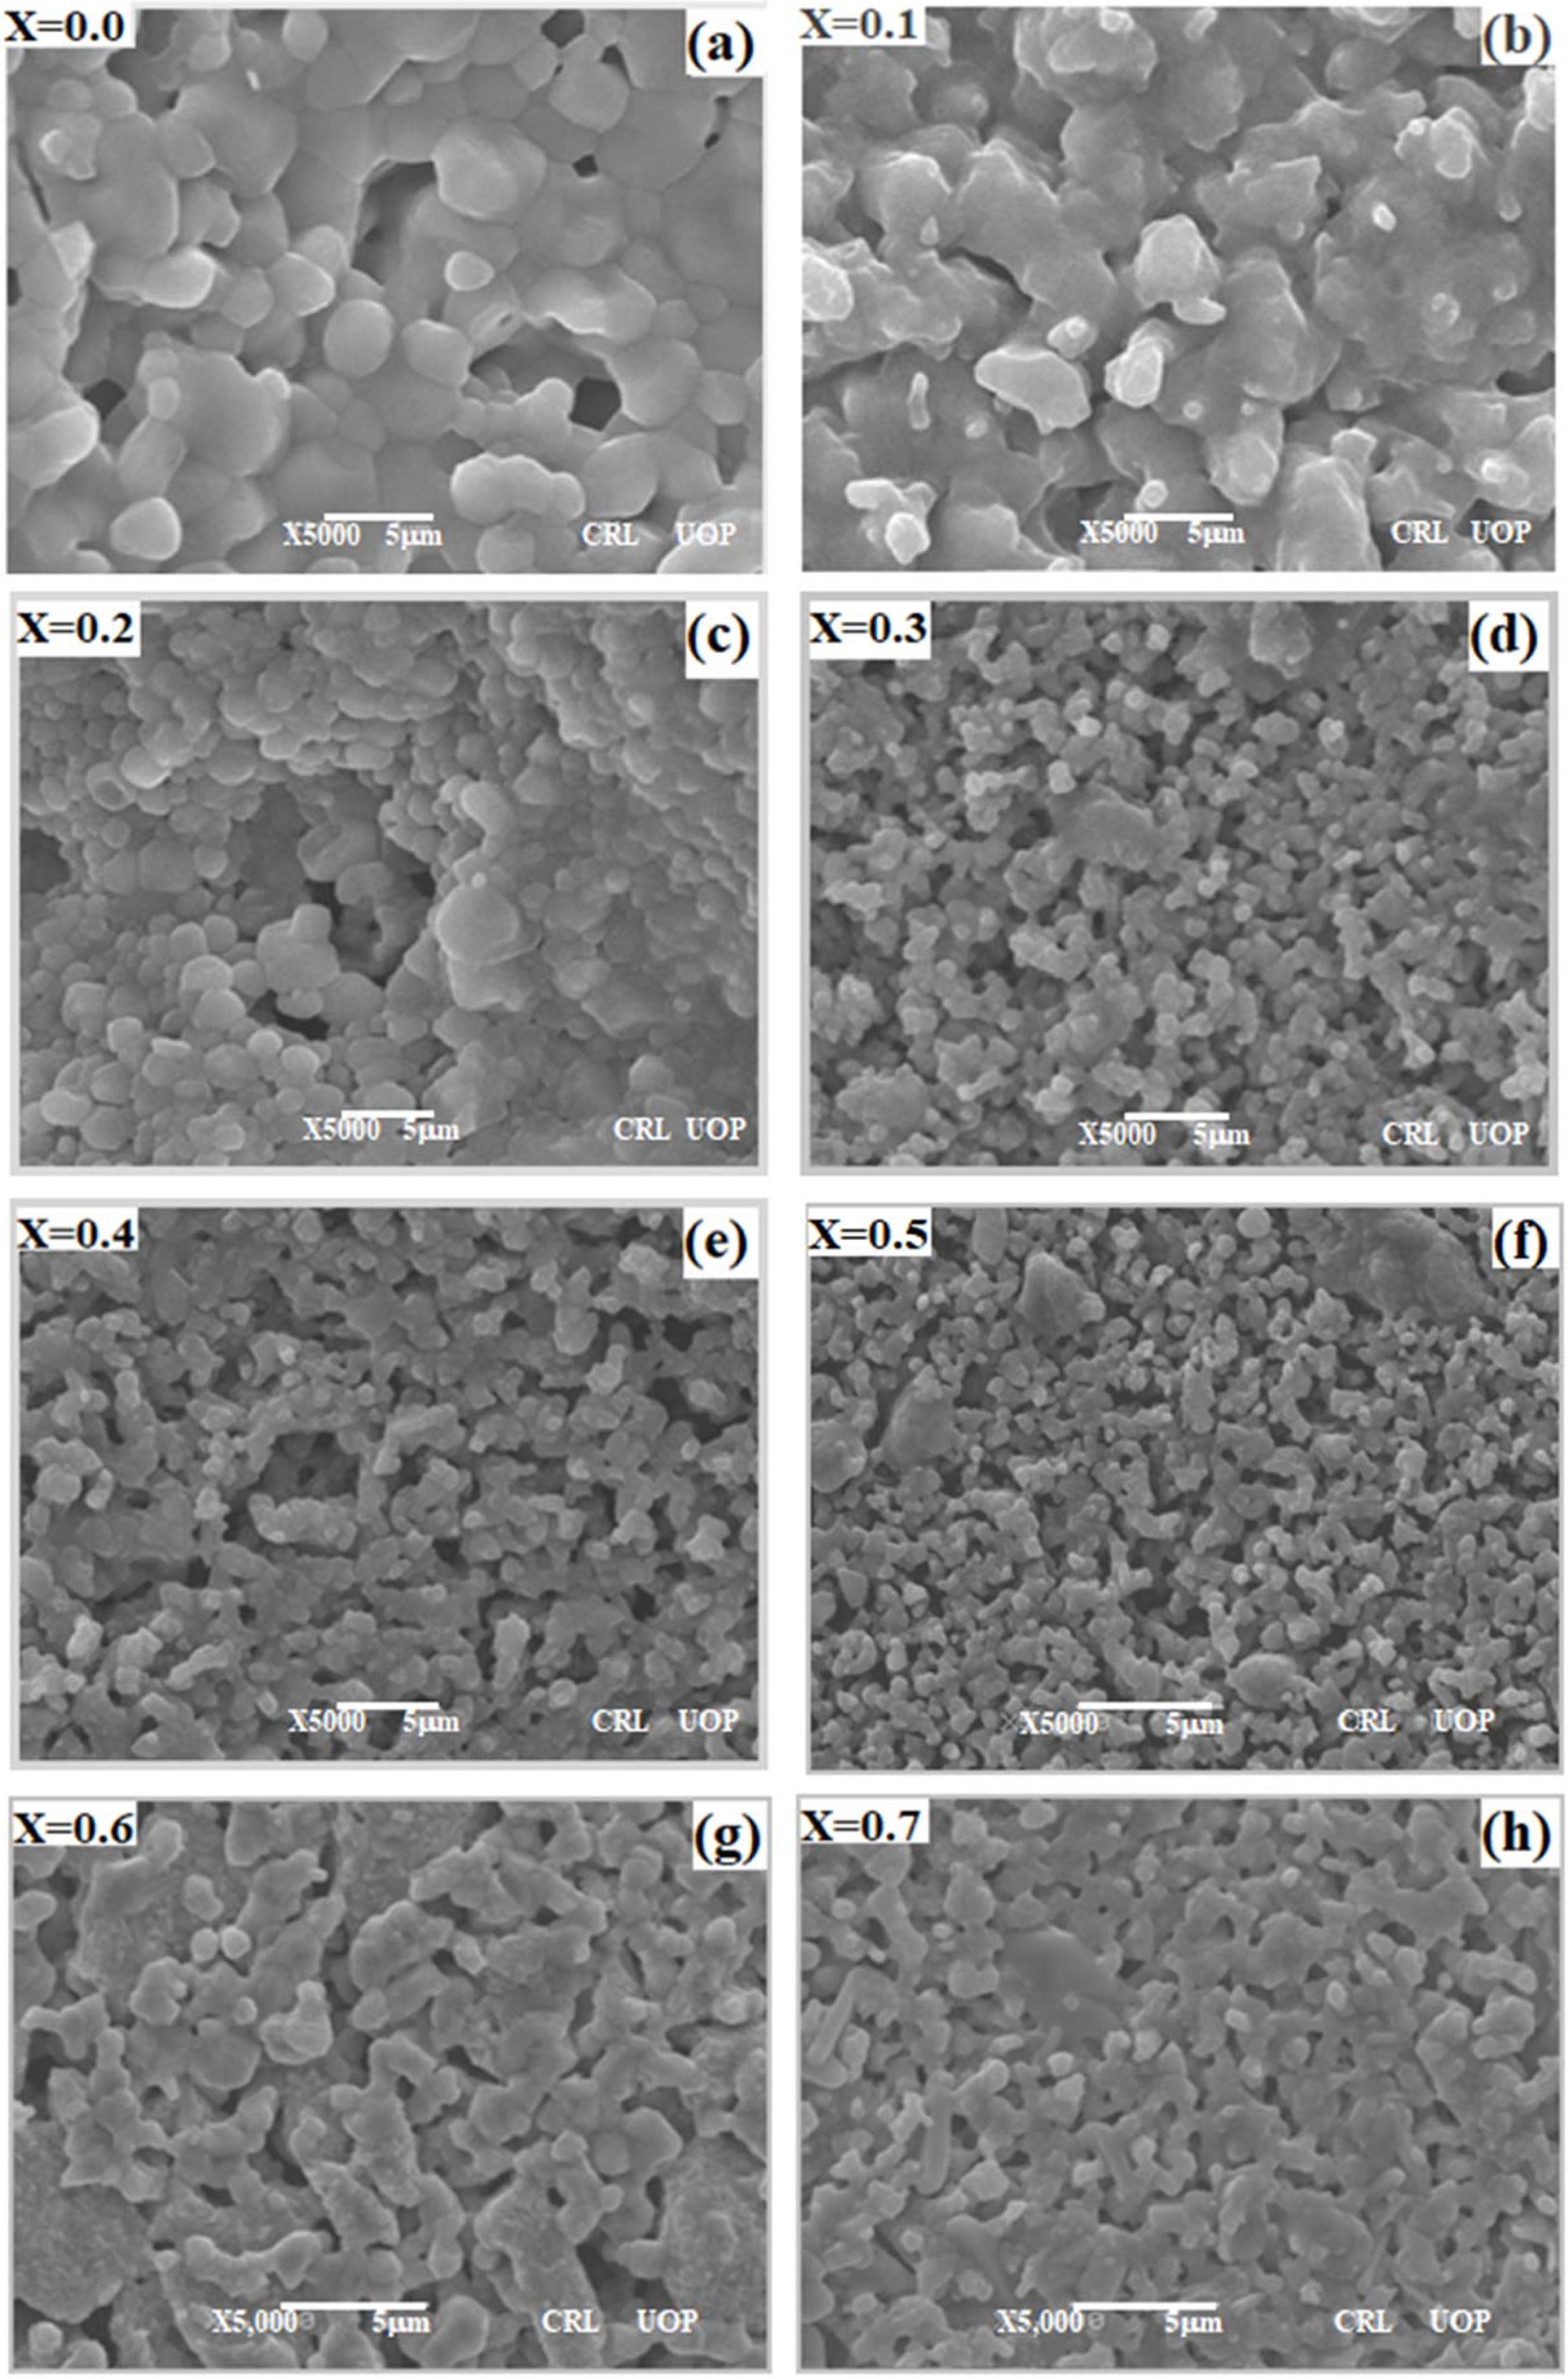
Fig. 3 represents the surface morphology of CBT at
different barium content (x) where (x = 0.0, 0.1, 0.2, 0.3, 0.4, 0.5, 0.6, and
0.7) for the prepared samples by mixed oxide solid state reaction route
sintered at 1,300 oC for 3 h in air. In Fig. 3 the SEM images
have show that microstructure consists of round-like and rod shaped grains with
little pores microstructure in the range of 1 x 1 µm2
to 3 x 3 µm2
sizes. The grains are homogeneous and the surface is smooth in the range x = 0.3
and 0.5 as shown in Fig. 3(d, e, f). The presence of some
bigger grains are often observed within the Fig. 3(a, b, c) sintered at
1,300 oC which may be due to calcium titanate attempting to
diminish the internal energy by reducing the full area of grain boundary,
resulting in the subsequent grain growth [24]. This implies that the
substitution of Ba2+ over Ca2+ in perovskite lattice can
demote the grain growth as shown in Fig. 3(g, h). This type of morphology has
been previously reported for CaTiO3 ceramics [25].
Microwave
dielectric analysis
The microwave dielectric properties of Ca1-xBaxTiO3
(0 ≤ x ≤ 0.7) ceramics sintered at 1,300 oC for
3 h was measured with an operating frequency of 3 GHz compared
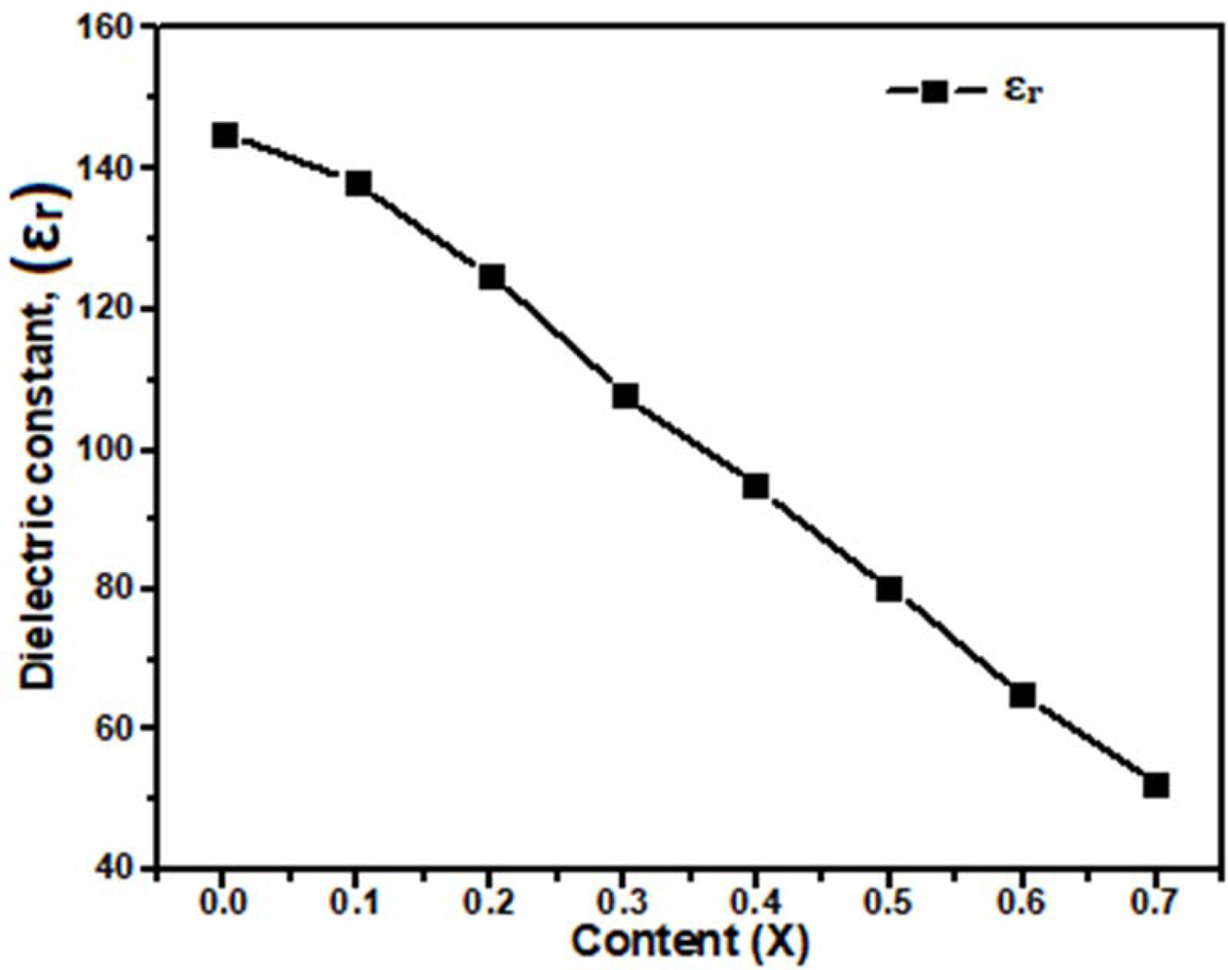
with Table 3. The obtained dielectric constant (εr) for Ca1-xBaxTiO3
where (x= 0.0, 0.1, 0.2, 0.3, 0.4, 0.5, 0.6, and 0.7) decreases from 145 to 52
at 3 GHz frequency are shown in Fig. 4. This indicated that a small amount of
barium doping decreased the dielectric constant value of ceramic. In Fig. 5(a)
shows the quality factor (Q ´ f)
of Ca1-xBaxTiO3 ceramics with different
content x. The quality factor (Qxf) increases from 8105 to 24305 GHz with
increase in barium concentration. The maximum value of Qxf as 24,305 GHz was
obtained for the Ca0.3Ba0.7TiO3 ceramics
sintered at 1,300 oC for 3hrs. In Fig. 5(b) shown the
temperature coefficient of resonant frequency (τf) decrease from 705
to 80 ppm/ oC, with increase in Ba2+ concentration,
assume that due to the lower ionic polarizability of Ca+2 (3.16 Å3)
compared with Ba+2 (6.40 Å3) [26]. In Fig. 4 the
dielectric constant was observed to follow the relative density and (εr)
~ 52 was obtained for the ~ 97.76%
dense ceramics with x = 0.7. In general, Q x f increases when smaller cations are
replaced by larger cations because larger cations cause a rise
within the movement of A-site cations resulting to an increase in
dielectric losses and therefore a decrease in Qxf [27]. Fig. 6
|
Fig. 1 XRD patterns of the Ca1-xBaxTiO3 (0 ≤ x ≤ 0.7) ceramics
sintered at 1,300 o
C in air. |
|
Fig. 2 Plot of theoretical density (ρth) and Molar volume (Vm) with
different concentration Ba2+ content “x”. |
|
Fig. 3 SEM micrograph of the Ca1-xBaxTiO3 0 ≤ x ≤ 0.7) ceramics sintered at 1300 °C for 3hrs in air; (a) x = 0.0, (b) x = 0.1, (c) x = 0.2,
(d) x = 0.3, (e) x = 0.4, (f) x=0.5, (g) x=0.6, (h) x=0.7; indicating a slight change in grain sizes with increase in x. |
|
Fig. 4 Plot of dielectric constant (εr) versus Ba2+ content (x) for
Ca1-xBaxTiO3 (0 ≤ x ≤ 0.7). |
|
Fig. 5 Comparison of (a) Quality factor and (b) Dielectric loss with different concentration Ba2+ Content (x) |
|
Fig. 6 Plot of Temperature coefficient of resonant frequency with
different concentration Ba2+ content (x). |
|
Table 2 Structural Data of Ca1-xBaxTiO3
ceramics from XRD Analysis sintered at 1,300 oC. |

X = Ba2+ content, Z
= No. of atom per unit cell, S.G = Space group, Vunit = Volume of
unit cell, Vm = Molar volume, a, b & c = Lattice Parameters |
|
Table 3 MW dielectric properties of
the fabricated Ca1-xBaxTiO3 samples sintered
at 1,300 oC. |

X = Ba2+ content,
S.T = Sintering Temperature, ρexp = Experimental density, ρth =
Theoretically density, ρrel = Relative density |
Ca1-xBaxTiO3 (0 ≤ x ≤ 0.7)
was successfully synthesized by
mixed oxide solid state method. Microstructure and
microwave dielectric properties of Ca1-xBaxTiO3
system have been studied for the composition variation (0 ≤ x ≤ 0.7).
A single phase was obtained of Ca1-xBaxTiO3
(0 ≤ x ≤ 0.7) ceramic sintering at 1,300 oC
for 3 h in air. The SEM morphology it
consists of round and rod shaped grains with porous
microstructure. The ceramics samples
sintered at 1,300 oC
for 3 h exhibited a maximum density of 5.146 g/cm3.
The dielectric constant (εr) decreases
from 145 for x = 0.0 to 52 for x = 0.7. The near
zero (tf)
value decreases from 705 to 80 ppm/oC (at 3 GHz) with an increase in
Ba2+ concentration from 0.0 to 0.7.
The authors gratefully acknowledged to the staff of
Materials research laboratory (MRL) and Centralized resource laboratory (CRL),
Department of Physics, University of Peshawar for the
technical support provided.
- 1. R.C Kell, A.C Greenham, and G.C.E Olds, Chem. Inform. 4[38] (1973) 352-354
-

- 2. D. Suvorov, M. Valant, B. Jancar, and S.D. Skapin. Acta Chimica Slovenica 48[1] (2001) 87-99.
- 3. T. Ishizaki, M. Fujita, H. Kagata, T. Uwano and H. Miyake, Microwave theory Tech. 42[11] (1994) 2017-2022.
-

- 4. I.M. Reaney and D. Iddles, J. Am. Ceram. Soc. 89[7] (2006) 2063-2072.
-

- 5. C.L. Huang, C.F. Tseng, W.R. Yang, and T.J. Yang, J. Am. Ceram. Soc. 91[7] (2008) 2201-2204.
-

- 6. C.L Huang, C.L Pan, and S.J Shium, Mater. Chem. Phys. 78[1] (2003) 111-115.
-

- 7. R.D. Shennon, Acta crystallographica A. 32[5] (1976) 751-767.
-

- 8. A. Zaman, S., Uddin, and N. Mehboob, Iranian J. of Sci. and Tech. Tranc. A: Science (2020) 1-5.
-

- 9. K. Wakino, Ferroelectrics 91[1] (1989) 69-86.
-

- 10. E.S. Kim and C.J. Jeon. J. of the Eup. Cerm. Soci. 30[2] (2010) 341-346.
-

- 11. C.L. Huang and S.S. Liu. Jap. J. of app. Phy. 46[1] (2007) 283-285.
-

- 12. Z. Dou, G. Wang, J. Jiang, F. Zhang, and T. Zhang J. of Adv. Cerm. 6[1] (2017) 20-26.
-

- 13. J. Kumar and N. Gupta. Wireless Personal Communi-Cations 75[2] (2014) 1029-1049.
-

- 14. P. K. Mallik, G. Biswal, S.C. Patnaik, and S. K. Senapati, IOP Conference Series Materials Science and Engineering 75 (2015) 012005.
-

- 15. S. Holliday and A. Stanishevsky, Surf. Coat. Technol. 188-189 (2004) 741-744.
-

- 16. D. Wang, Z. Guo, Y. Chen, J. Hao, and W. Liu, Inorganic Chem. 46[19] (2007) 7707-7709.
-

- 17. W. Dong, G. Zhao, Q. Bao, and X. Gu, Materials Sci. 21[4] (2015) 583-585.
-

- 18. G. Gralik, C. Zanelli, F. Raupp-Pereira, M. Dondi, and D. Hotza, in proceeding of 21 Congresso Brasileiro de Engenharia Materiais, October 2014, p.504-510.
- 19. M. Sh. Khali and F.F. Hammad, Egypt. J. Solid. 25[2] (2002) 175-183.
- 20. G. Gralik, A. Thomson, C. Moreas, F. Raupp-Pereira, and D. Hotza, Proc. Appl. Ceram. 8[2] (2014) 53-57.
-

- 21. J. Guevarra, A. Schonleber, S.V Smaalen, and F. Lichtenberg, Acta Cryst. B. 63[2] (2007) 183-189.
-

- 22. A.R. Drews, W. Wong-Ng, R.S. Roth, and T.A. Vanderah, Mater. Res. Bull. 31[2] (1996) 153-162.
-

- 23. P.L. Wise, I.M. Reaney, W.E. Lee, T.J. Price, D.M. Iddles, and D.S. Cannell, Euro. J. Ceram. Soc. 21[10-11] (2001) 1723-1726.
-

- 24. J. Varghese, T. Joseph, K. P. Surendran, T. P. D. Rajan, and M. T. Sebastian, D. Trans, Royal Society of Chem. 44[11] (2015) 5146-5152.
-

- 25. R.D. Shannon, J. Appl. Phys. 73[1] (1993) 348-366.
-

- 26. J. Mitroy, M.S. Safronova, and C. W. Clark, J. of Phys. B Atomic Molecular and Optical Phys. 43[20] (2010) 202001.
-

- 27. Y. Tohdo, K. Kakimoto, H. Ohsato, H. Yamada, and T. Okawa, J. Eur. Cerm. Soc. 26[10-11] (2006) 2039-2043.
-

 This Article
-
2020; 21(6): 745-750
Published on Dec 31, 2020
- 10.36410/jcpr.2020.21.6.745
- Received on Sep 11, 2020
- Revised on Oct 30, 2020
- Accepted on Nov 11, 2020
 Services
- Abstract
introduction
experimental procedure
results and discussion
conclusions
- Acknowledgements
- References
- Full Text PDF
Shared
 Correspondence to
- Abid Zaman
-
Department of Physics, Riphah International University, Islamabad 44000, Pakistan
Tel : + 00923348257783 - E-mail: zaman.abid87@gmail.com


 Copyright 2019 International Orgranization for Ceramic Processing. All rights reserved.