- 3D reconstruction and visualization from 2D X-ray CT images in the study of ceramic membrane microstructure
Thomasová Barboraa,b, Thomas Janb, Souček Kamilb,c, Michálek Ondřejb and Gembalová Lucieb *
aNanotechnology Centre, VŠB-Technical University of Ostrava, 17. listopadu 2172/15, Ostrava – Poruba, 708 00, Czech Republic
bInstitute of Clean Technologies of Extraction and Utilization of Energy Resources, Faculty of Mining and Geology VŠB-Technical University of Ostrava, 17.listopadu 2172/15, Ostrava – Poruba, 708 00 Czech Republic
cInstitute of Geonics of the CAS, Studentská 1768, Ostrava – Poruba, 708 00 Czech Republic
In the presented study, X-ray
computed tomography (CT) technique was used to visualize the three-dimensional
(3D) microstructure of ceramic membrane support made of alternative material -
fly ash, kaolin and shale. Standard computed tomography output formats provide
usually two-dimensional (2D) information about the object being studied in the
form of image data set. However, to understand the material internal structure
and its mechanical, physicochemical and hydraulic properties 3D visualization
is needed. Our work shows that 3D image data reconstruction can be done with
freely available DREAM.3D and ParaView software instead of costly commercial
ones allowing wider community data sharing and greater freedom in processing.
The resulting 3D model was suitable for quantitative pore space analysis and
fluid dynamics modelling and provided important morphological information such
as pore and mass shape, cracks, spatial distribution and the connectivity of
the solid matrix.
Keywords: X-ray CT, 3D model, ceramic, DREAM.3D, ParaView
Ceramic membranes systems used for industrial wastewater
treatment, recovery and reuse represent one of the most important technologies
that have gained popularity over past two decades. Ceramic membranes for
industrial effluent filtration usually consist of three filtration layers,
porous support, interlayer and a top layer with different densities and
decreasing thickness. All layers can be made of the same or
different material. Porosity values of supports and filtration layers
depend on the sintering temperature and material used [1-3,] and could be up
enhanced by pore forming agents up to 60% [4] Generally, membrane supports have
a total porosity ratio of about 40% [2]. Ceramic membranes for the purpose of
wastewater treatment belong to the oxide ceramic membranes that are mainly made
of Al, Si, Ti or Zr oxides, and silicon carbide [5]. Membranes made of these
materials are characterized by high durability, chemical, mechanical and
thermal stability, bacteria resistance, and ability of back flushing and ease
of cleaning and sterilization [6]. However, their preparation and production is
too expensive and therefore a significant effort has been devoted to
finding alternative low cost materials, usually based on natural
or waste products [7-10]. Reduction of ceramic mem- branes fabrication cost is one of the
basic parameters enabling wider application in various industrial wastewater treatment plants.
Considering the ceramic membranes costs and with respect
to the sustainability of natural resources, tubular geopolymer
support made by fly ash from energy coal combustion, kaolin and shale was
prepared in this work.
When creating new filtering materials, not only ceramic,
the knowledge of the structure of the material plays a significant role. It is
well known that the microstructure
of the resultant porous material such as porosity, pore size
distribution, tortuosity and subsequently the mass transport properties (liquid
permeability or fluid distribution) are key parameters for good filtration
function [11-13].
Conventionally, microstructural visualization is predominantly
based on 2D imaging techniques such as SEM (scanning electron microscopy) and
TEM (transmission electron microscopy) however these
techniques do not enable access to the actual spatial distribution of pores,
their shape, connectivity and inner structure of material.
The X-ray computed tomography (CT) seems to be the most
convenient technique that provides all of above-mentioned information. CT is a
non-destructive technique that offers three-dimensional characterization and
visualisation of the internal structure of the material by 2D image
data reconstruction to form a virtual 3D model. X-ray
CT relies on measurement of the attenuation of
X-ray passing through a specimen, thereby generating
high-resolution radiographs. The magnitude of linear attenuation
is dependent on physical density and chemical composition
of the material as well as on the X-ray energy [14]. Output CT data is volume
discrete data characterizing the structure of the material in the
sample. Because the acquired image data does not distinguish
individual objects in the scanned sample, it is necessary to proceed with the
mathematical analysis of the image data. A number of authors
dealt with methods of mathematical
analysis of the image data and the creation of a 3D model [14-17]. However,
there are not many papers dealing with 3D visualization of the
membrane structure. Several works have been devoted to
X-ray CT microstructure
characterization of inorganic materials such as ceramic fibres,
minerals or rocks [18-20].
Nowadays the 3D model reconstruction from 2D image
data is usually done with costly specialized commercial software that is
closely connected with the specific type of tomograph. This fact limits the
possibilities for individual use, freedom in data processing and data sharing
in a wider community of users.
One
of main aim of this work was an introduction of the methodology for 3D model
creation based on utilization of ParaView and DREAM.3D open source software. The whole process of 2D image data
processing into 3D model is outlined in the work including application of several mathematical algorithms such as
noise reduction, thresholding and region growing method up to final 3D model
creation by vectorization, smoothing and decimation. By creating 3D object it
was possible to describe the internal structure
of ceramic material, its porosity or the defects and failures creating during
support preparation. The 3D geometric model also served to assess
homogenization of individual
components by tracking the size and distribution of particles with a specific
property. Fluid dynamics simulation within porous material has been also
outlined as other possibility of using 3D geometric model.
Input
material characterization
Three powder materials were used for ceramic support
preparation, fly ash from the combustion of energy coal, kaolin as a
plasticizer and refractory claystone with its excellent thermal stability and
high content of Al2O3 and plastic binding
ability in ceramics. The temperature of combustion process
of fly ash was in range of 800 oC. Chemical composition of
input materials were characterized by energy-dispersive X-ray fluorescence
spectrometry (Spectro XEPOS). For particle size analysis the
Partica LA-950 Laser Diffraction Particle Size Distribution Analyzer
HORIBA LA-950 was used.
Support
preparation
Raw input powder materials were mixed together in ratio
2:2:1. Paste suitable for extrusion was made by addition of 5M NaOH.
One-channel tubes 150 mm long and 15 mm wide were prepared by manual extruder.
Tubes were dried at room temperature for 48 h and then sintered at 1,000 oC
for 2 h. In this way, supports suitable for microfiltration were prepared.
Support
characterization methods
Prepared
support was characterized by various tech- niques
including scanning electron microscopy (SEM), X-ray diffractometry (XRD) and
Mercury porosimetry. SEM images were taken with Scanning Electron Microscope
FEI Quanta FEG equipped with electron backscatter diffraction detector (EBSD).
For phase identification Bruker Advance D8 was used. Pore size distribution and
porosity evaluation was performed using mercury porosimeter Autopore IV 9500.
X-ray
CT measurement
Computed tomography was performed using X-ray micro-CT
scanner XTH 225 ST made by NIKON Metrology NV. Microfocus X-ray source is
equipped with a 225 kV/225 W reflection target with 3 μm focal spot size up to
7 W of power and with a 180 kV/20 W transmission target with 1 μm focal spot
size up to 3 W of power.
Transmission target at 150 kV/3.5 W was used for CT
scanning of the ceramic material. Instrument is configured with flat detector
Perkin Elmer 1,620 with 2,000 ´ 2,000
active pixels (pixel size 200 μm, 4 mil. pixels). The ceramic fragment sample
was cube of approximate edge length of 5 mm.
For reconstruction of the CT volume of the investigated
sample, we acquired 3 141 2D radiographic projections (images) at a known
rotational angle during one full sample turn (360o). The exposition
time of the one radiographic projection was 4,000 ms consisting of two
radiographic frames (2,000 ms). The scanning and reconstruction process of one
ceramic porous sample takes approximately five hours and resulting resolution of
the individual cubic voxels in CT volume is represented by
value of approx. 2.7 µm. (the voxel resolution is directly proportional to the
geometrical magnification of the sample on the flat panel X-ray detector). For
the primary CT data visualization and preparation of the stack of 2D
tomographic slices for following analysis, we used software VG Studio
Max v. 2.2. (VGS).
Reconstruction
of 3D model using ParaView and DREAM.3D software
Two software namely ParaView and DREAM.3D, were used for
3D model reconstruction from 2D CT data (slices). Both are an open-source
multi-platform data analysis and visualization applications.
ParaView allows you to quickly create visualizations for
user data analysis using qualitative and quantitative techniques.
The data exploration can be done interactively in 3D or
programmatically using ParaView’s batch processing
capabilities. ParaView supports distributed computation models to process large
data sets and also develops an extensible architecture based on open standards
[21].
DREAM.3D consists of data analysis tools (filters)
that allow for the construction of customized workflows (Pipelines) to
analyse data. DREAM.3D provides a flexible and extensible data structure that
eases data transport between collaborators by storing data in a non-proprietary
format. The reconstructions can utilize an array of alignment, cleaning,
segmentation algorithms and colouring algorithms. Many algorithms are available
to extract various statistics about received data [22].
Mathematical filters (algorithms) of DREAM.3D software
were used to process 2D data from X-ray CT. In order to create a
three-dimensional model obtained by converting a discrete description
of the data obtained by mathematical analysis of 2D image data by
DREAM.3D application, both software DREAM.3D and Paraview were used.
X-ray
fluorescence spectrometry
The elemental composition for materials used is given in
Table 1. It evident that the major components in fly ash, kaolin and shale were
SiO2 and Al2O3.
High content of Al and Si ions in raw samples made the
mixture suitable for geopolymerization process described by Davidovits [23].
During this process reorganization (destructruction) of solid aluminosilicates
oxides due to attack of alkali ions occurs, consequently complicated process
including precipitation, gel formation, polymeriz- ation, hardening and new material
formation takes place.
Particle
size distribution
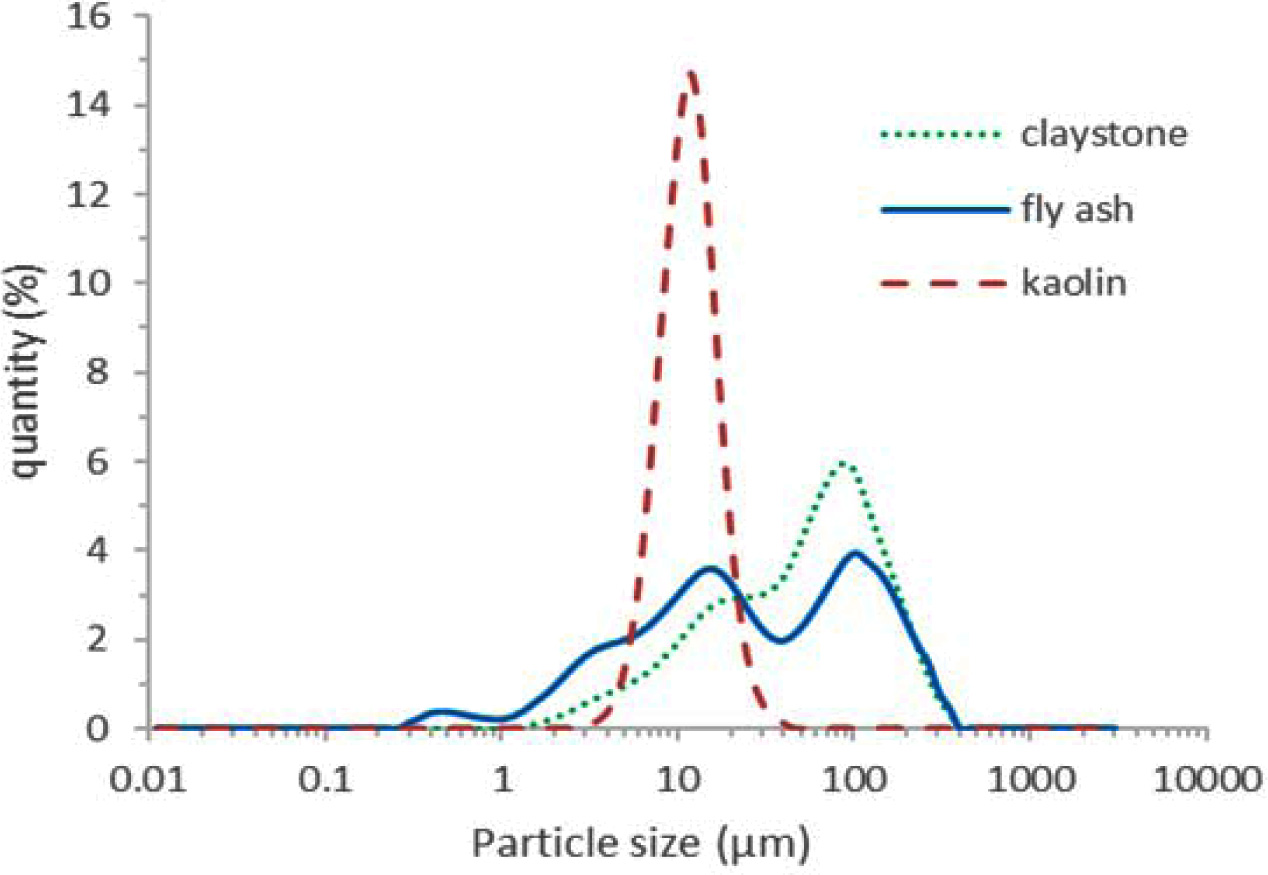
The Fig. 1 shows the particle size distribution of raw
input materials. It is evident that except of kaolin whose particle size
distribution is within a very narrow range, the particle size distribution of
fly ash and shale is in the range of units to hundreds of μm.
Economic efficiency was the main goal of preparing ceramic
support based on waste and natural materials and therefore no reduction in
particle size (milling) of input materials was intended.
Scanning
electron microscopy
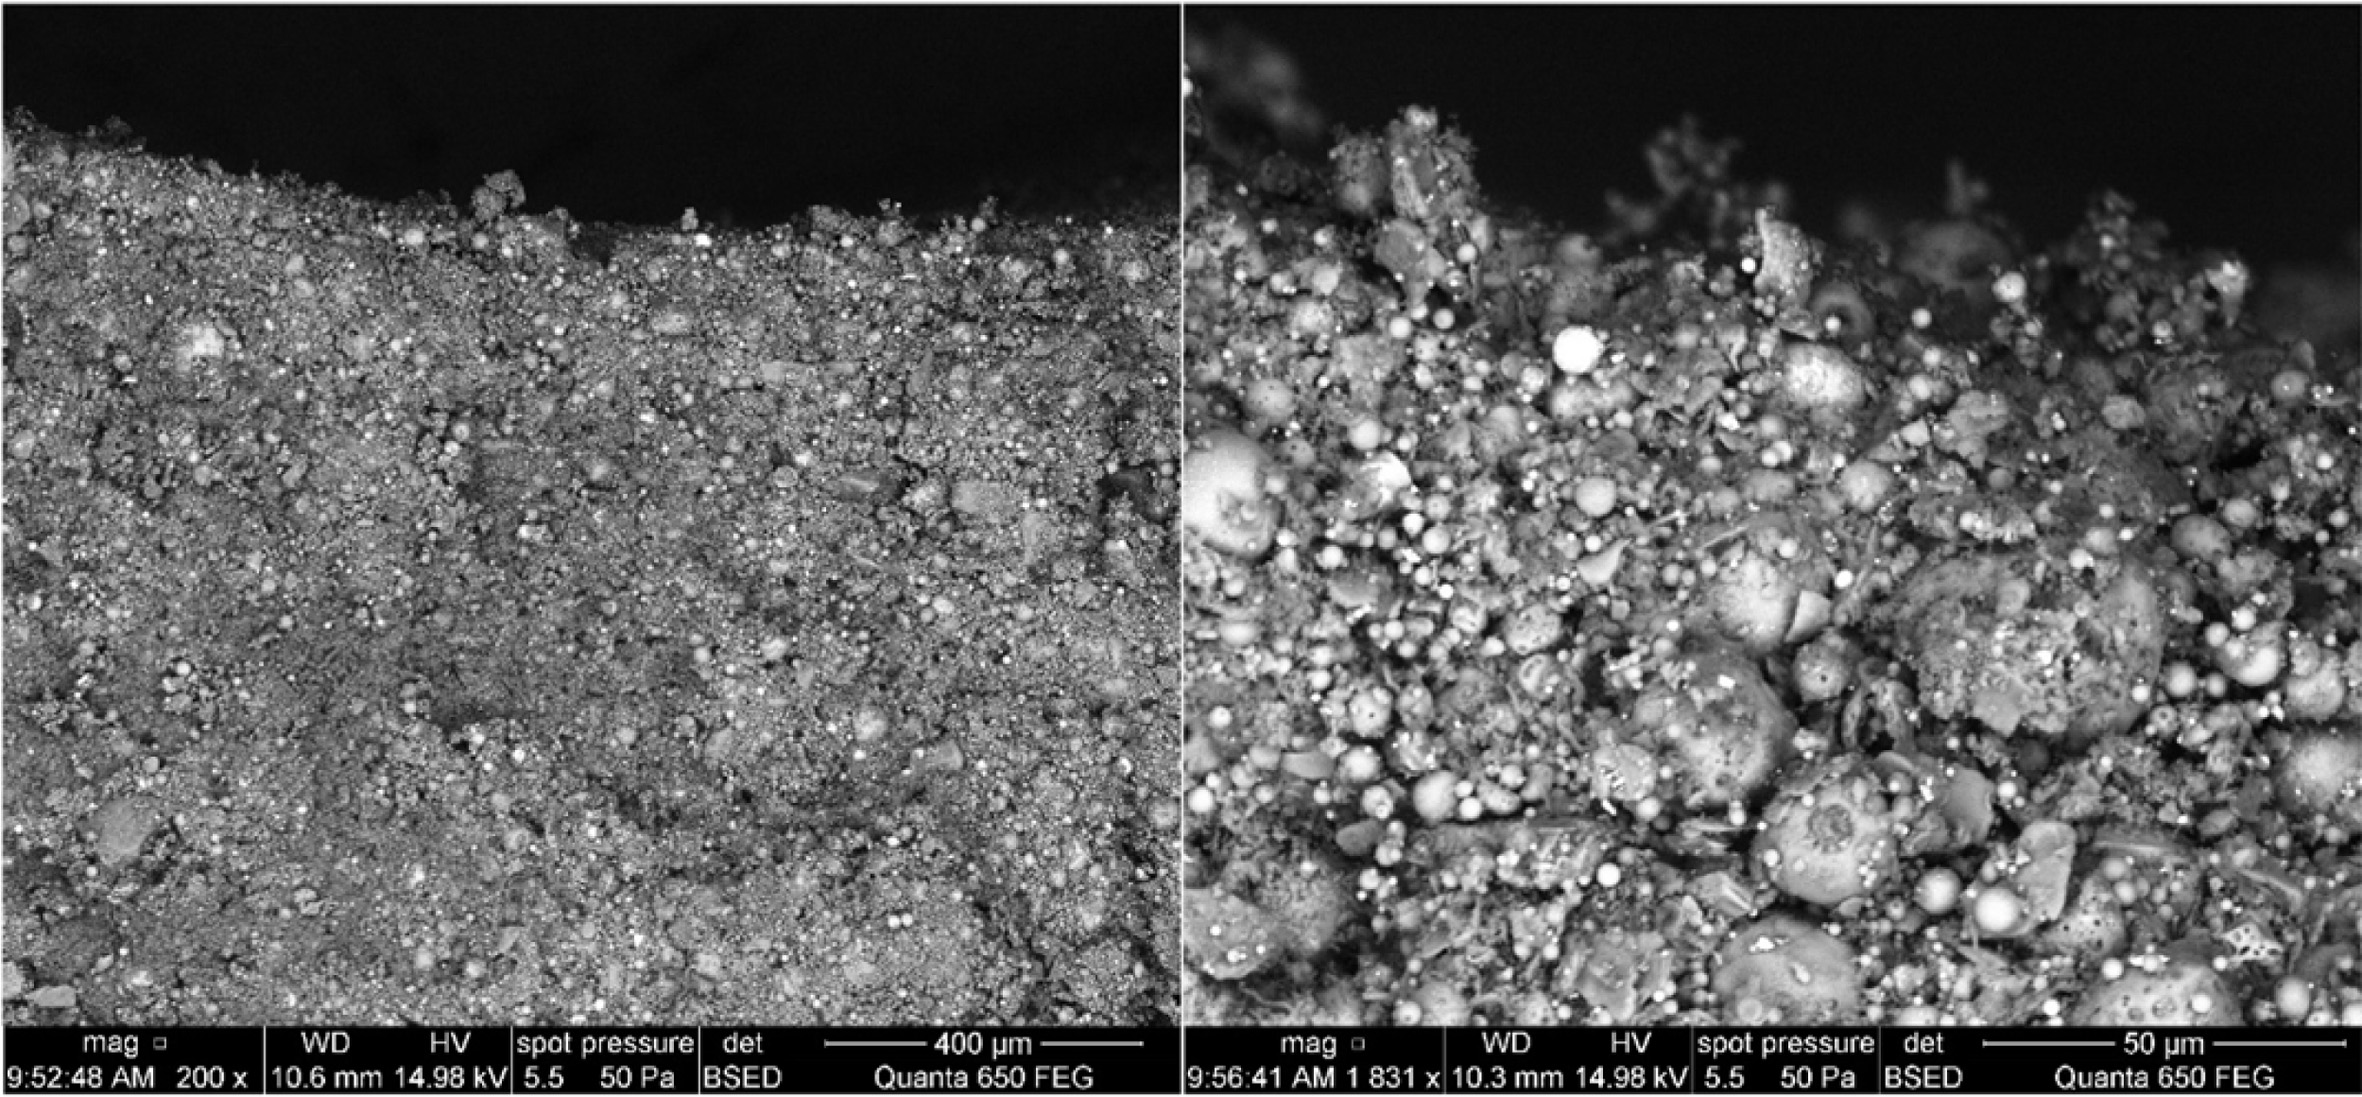
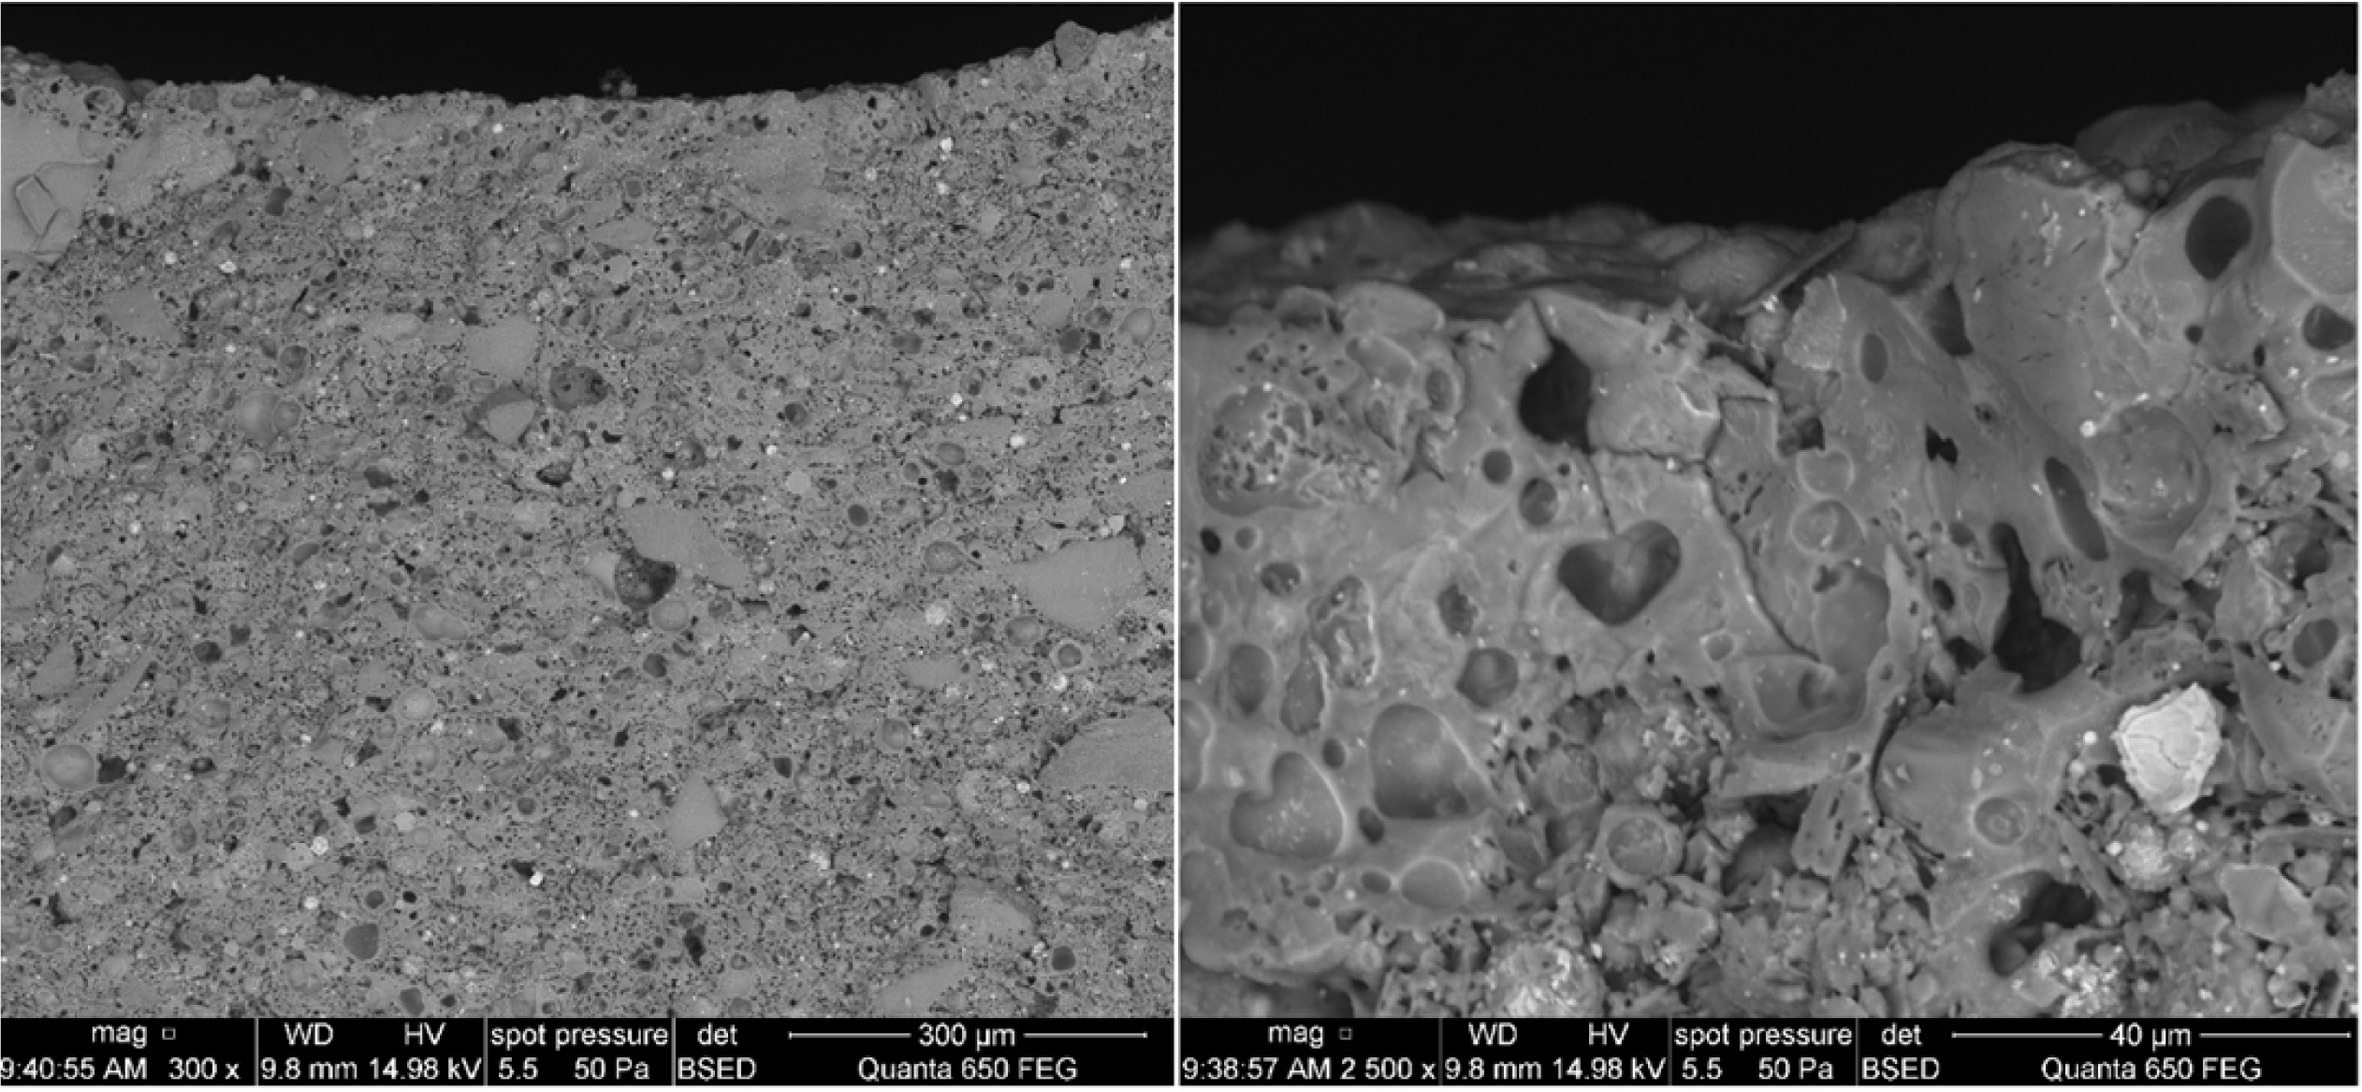
The scanning electron microscope (SEM) images of inner
profile of extruded tube before and after sintering are depicted in Fig. 2 and
3. In Fig. 2. are visible ball shaped grains ideal for the preparation of ceramic
membrane. After sintering at 1,000 oC the individual grains
melted and become fused to one another forming porous structure (Fig. 3).
Phase
identification
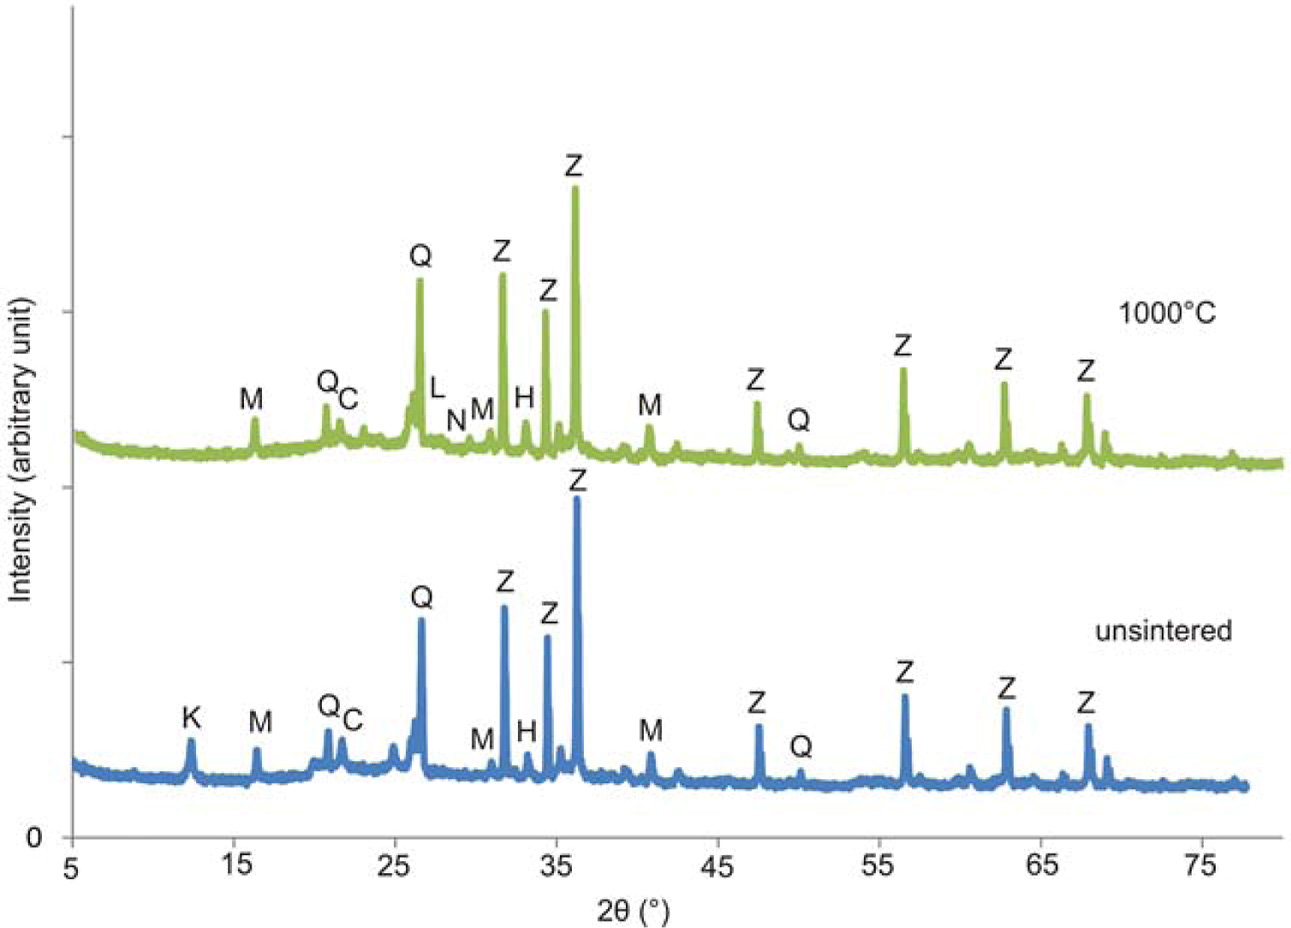
Phase identification was determined using and X-ray
diffraction. XRD data for the sintered and unsintered sample are
shown in Fig. 4. Semiquantitative composition of input
materials was determined by the standard ZnO (Zincite) addition. In unsitered
sample the major phases identified was amorphous (49%). The major crystalline phases
were in the following order mullite (3Al2O3·2SiO2), quartz
(SiO2), kaolinite (Al2Si2O5(OH)4,
magnetite (Fe3O4) and hematite (Fe2O3).
After sintering the sample became more amorphous (55%),
kaolinite transformed to mullite (silicate with isolated SiO4
tetrahedrons) whose content increased, and other silicate phases –
tectosilicates (tetrahedral bounds to a spatial network) nepheline and
labradorite were identified. In addition, content of cristobalite (high
temperature form of SiO2) increased. These changes led to creation
of a solid porous structure.
Mercury
porosimetry
Mercury (Hg) porosimetry is the basic characterization
technique for permeability study and therefore was used to describe the
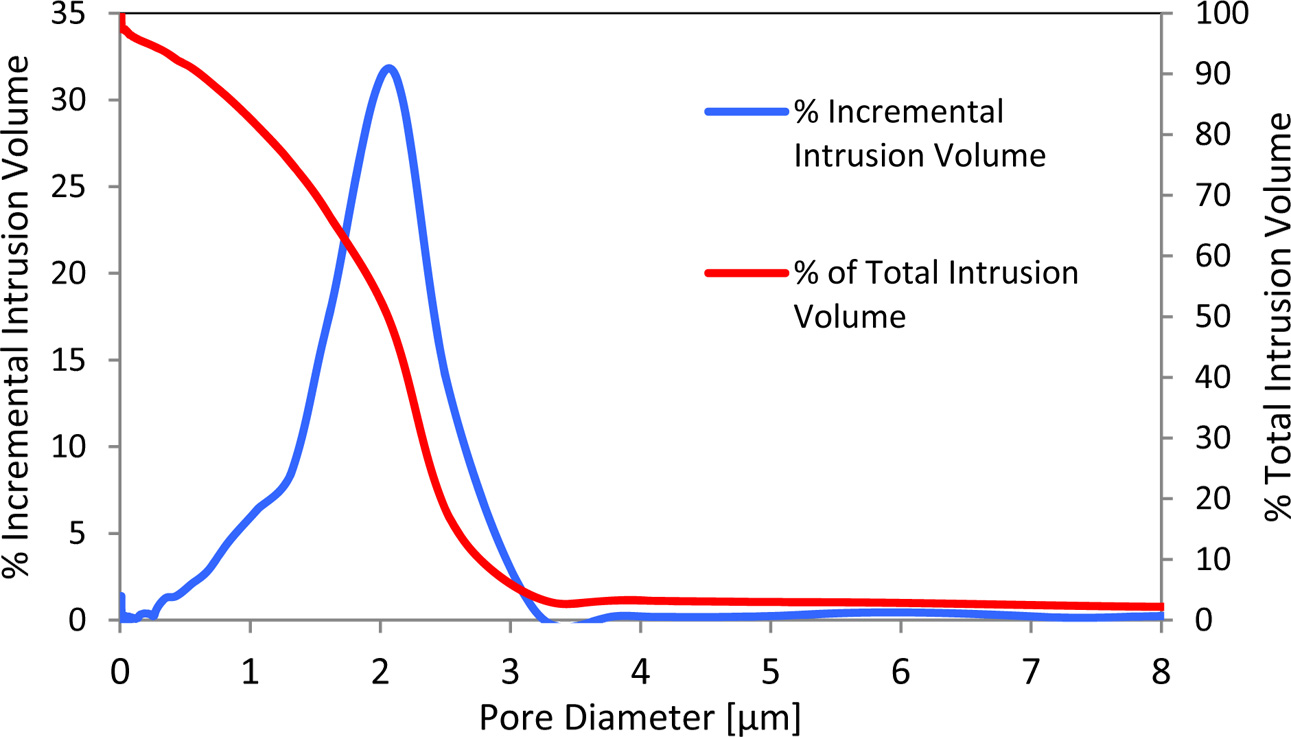
porosity and pore size distribution of the ceramic support. Fig. 5. shows the
pore size distribution of the fly ash based support. The median pore diameter
of the support was 2.1 μm with an open porosity of 33%.
X-ray
CT data processing
The default data for the 3D model of the microstruc- ture is the series-sized 2D images of
the studied ceramic support segment with the same size and the same starting
point of the coordinate system. This data discretely describes the physical
properties of the internal structure of the material of the scanned sample
without distinction of individual objects. Imported digital monochrome 8-bit
images are at resolution of 1,096 ´ 1,096
pixels. The size of one pixel corresponds to a square of 2.7 μm side length.
Imported 2D images are placed vertically with a 2.7 μm layer spacing and then
converted to 3D so that each 2D pixel image is converted to a cubic voxel with
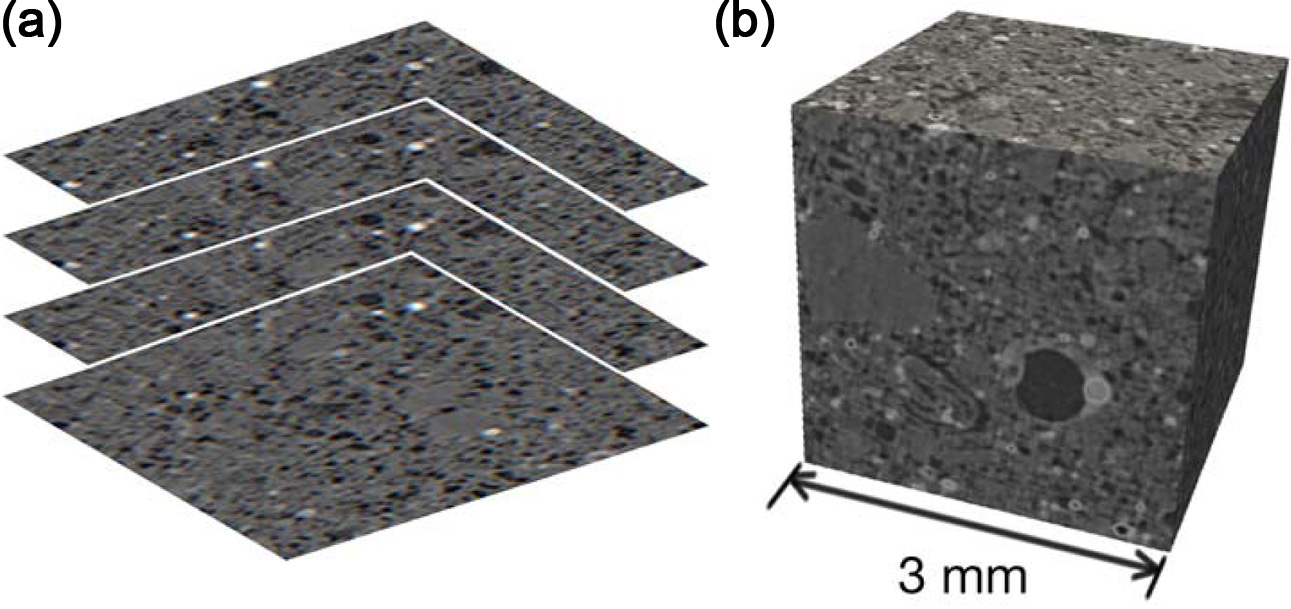
a side length of 2.7 μm. The total number of pictures taken is 1096. The part
of the material segment used then corresponds to a 27 mm3 cube (Fig.
6).
Image histogram of processed 2D X-ray CT data
Mathematical filter / Software: “Crop Geometry” / DREAM3D
Imported X-ray CT images were subjected to mathematical
analysis of the porous structure. The processing and analysis of digital images
is done by mathematical operations common in the field of digital photography
processing.
Firstly, it is necessary to perform so-called
pre-processing consisting of sorting 2D CT images and cropping them on the area
of interest. Cropping is necessary due to the microstructure spatial complexity
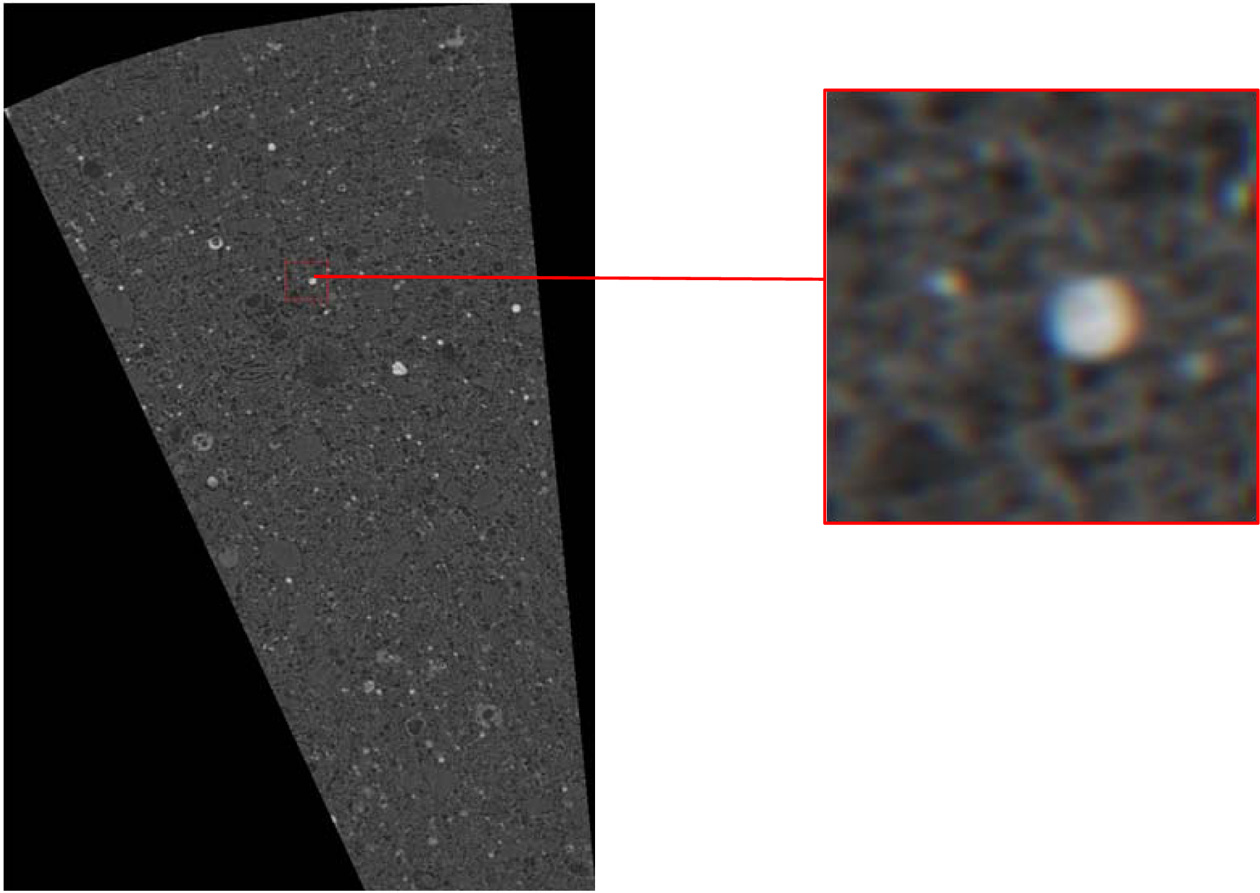
and the large amount of input data. Images were cropped on a 50 ´ 50 pixels (0.135 ´ 0.135 ´ 0.135 mm) cube in a randomly
selected region of interest (ROI). See Fig. 7.
Sorted digital 2D images represent a three-dimensional
matrix in which each point (pixel) with coordinates x, y is assigned the
function value ƒ. Functions ƒ, resp. intensity of brightness corresponds to the
gray scale information in the digital CT image. Depending on the color depth
used, the function ƒ values take the interval ƒ <0, 1, .., n>. When using
an 8-bit resolution in a processed image, the luminance intensity functions are
ƒ <0, 255> with 0 being black and 255 white.
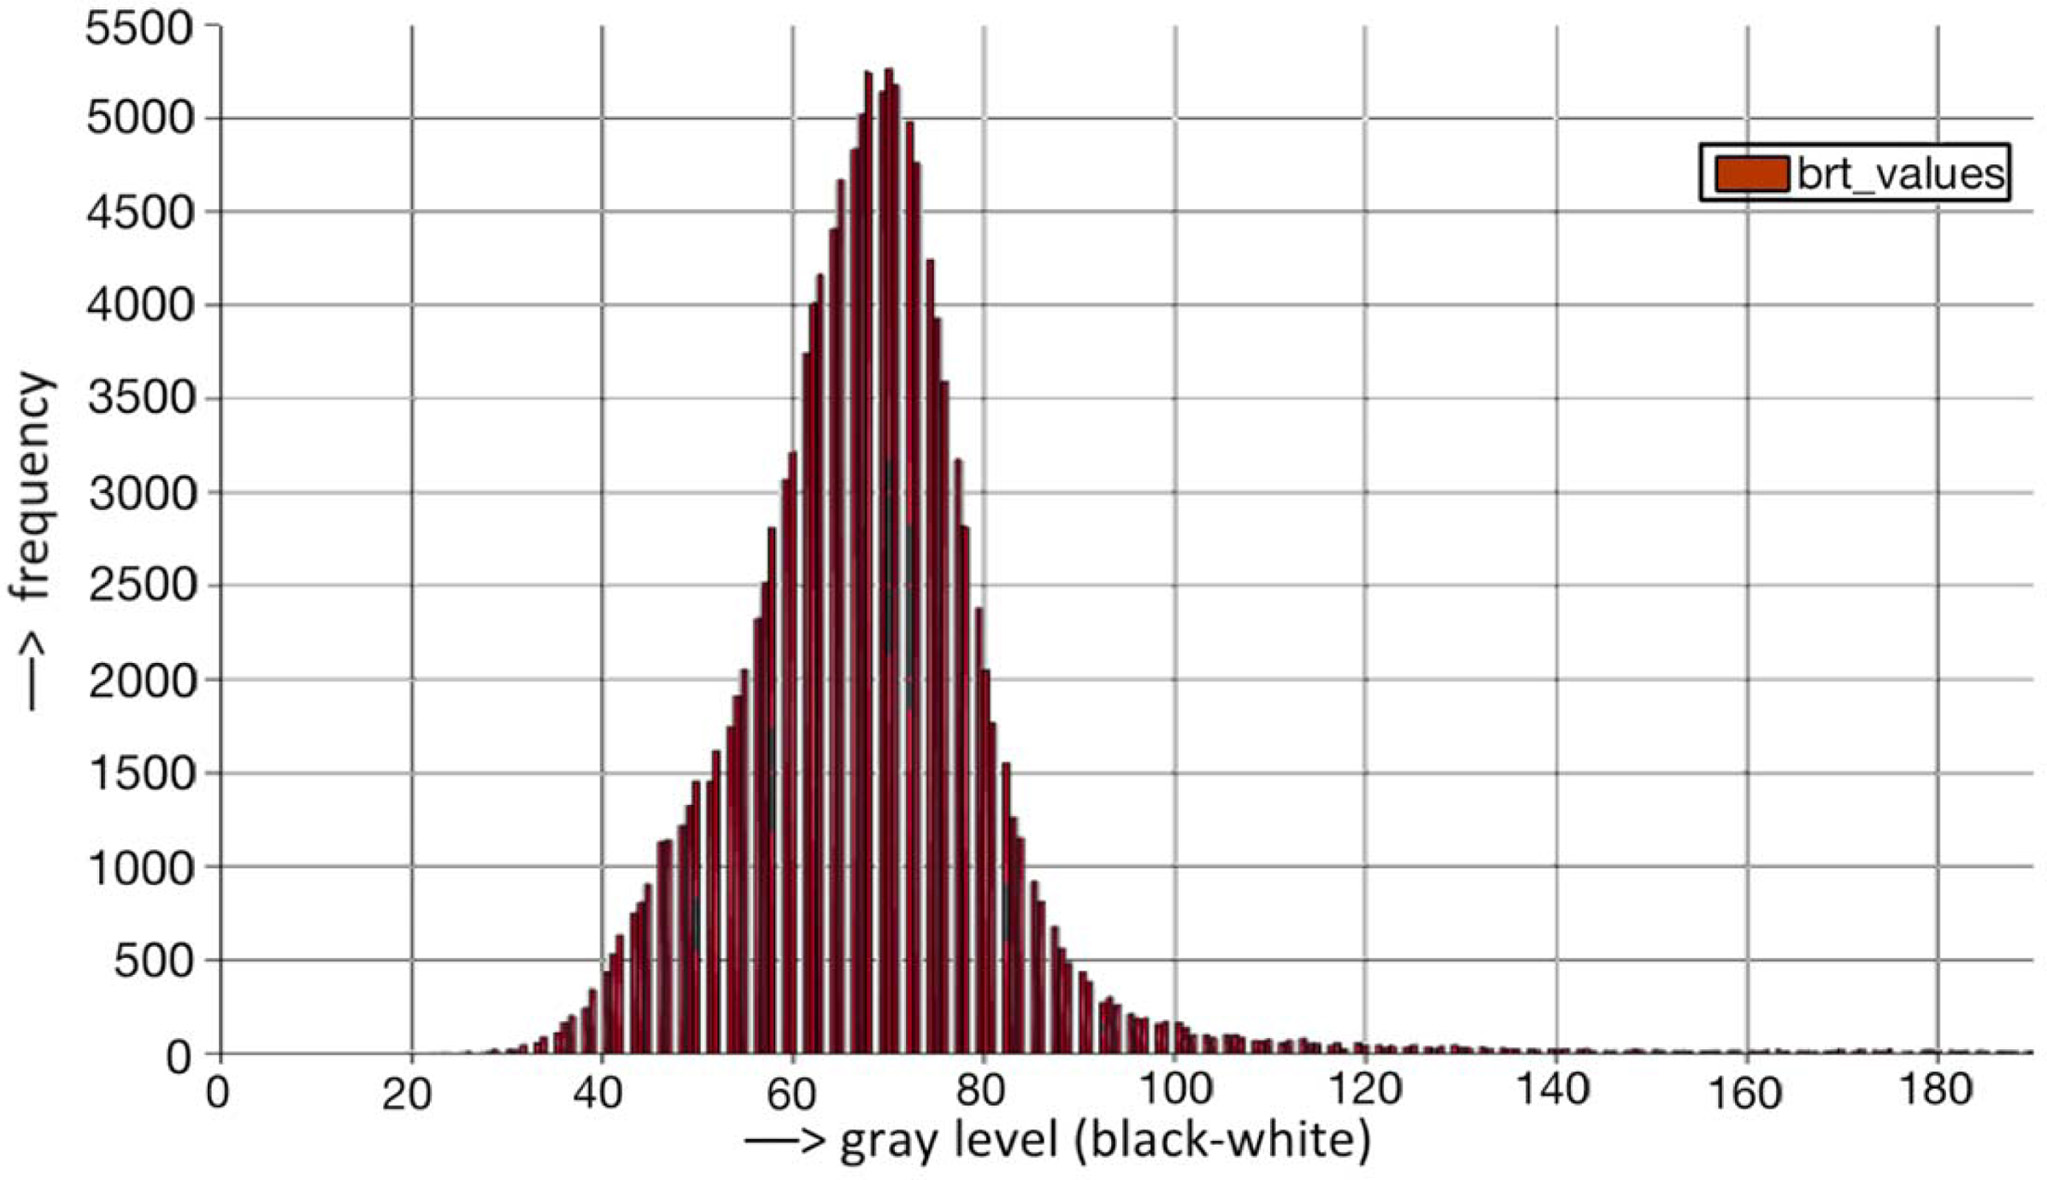
The standard histogram, shown in Fig. 8, represents the
layout of brightness level in a digital array matrix resulting from sorting and
cropping a 2D CT image set. The histogram is a discreet function. The brightness
intensities of each studied 2D image are in the interval <0, L-1>, the L
value being the highest grayscale value in a particular image. The discrete
function then can be written as:

where ƒk are grayscale
levels <0, L-1>, and nk is the pixel count with the brightness
level of the ƒk function.
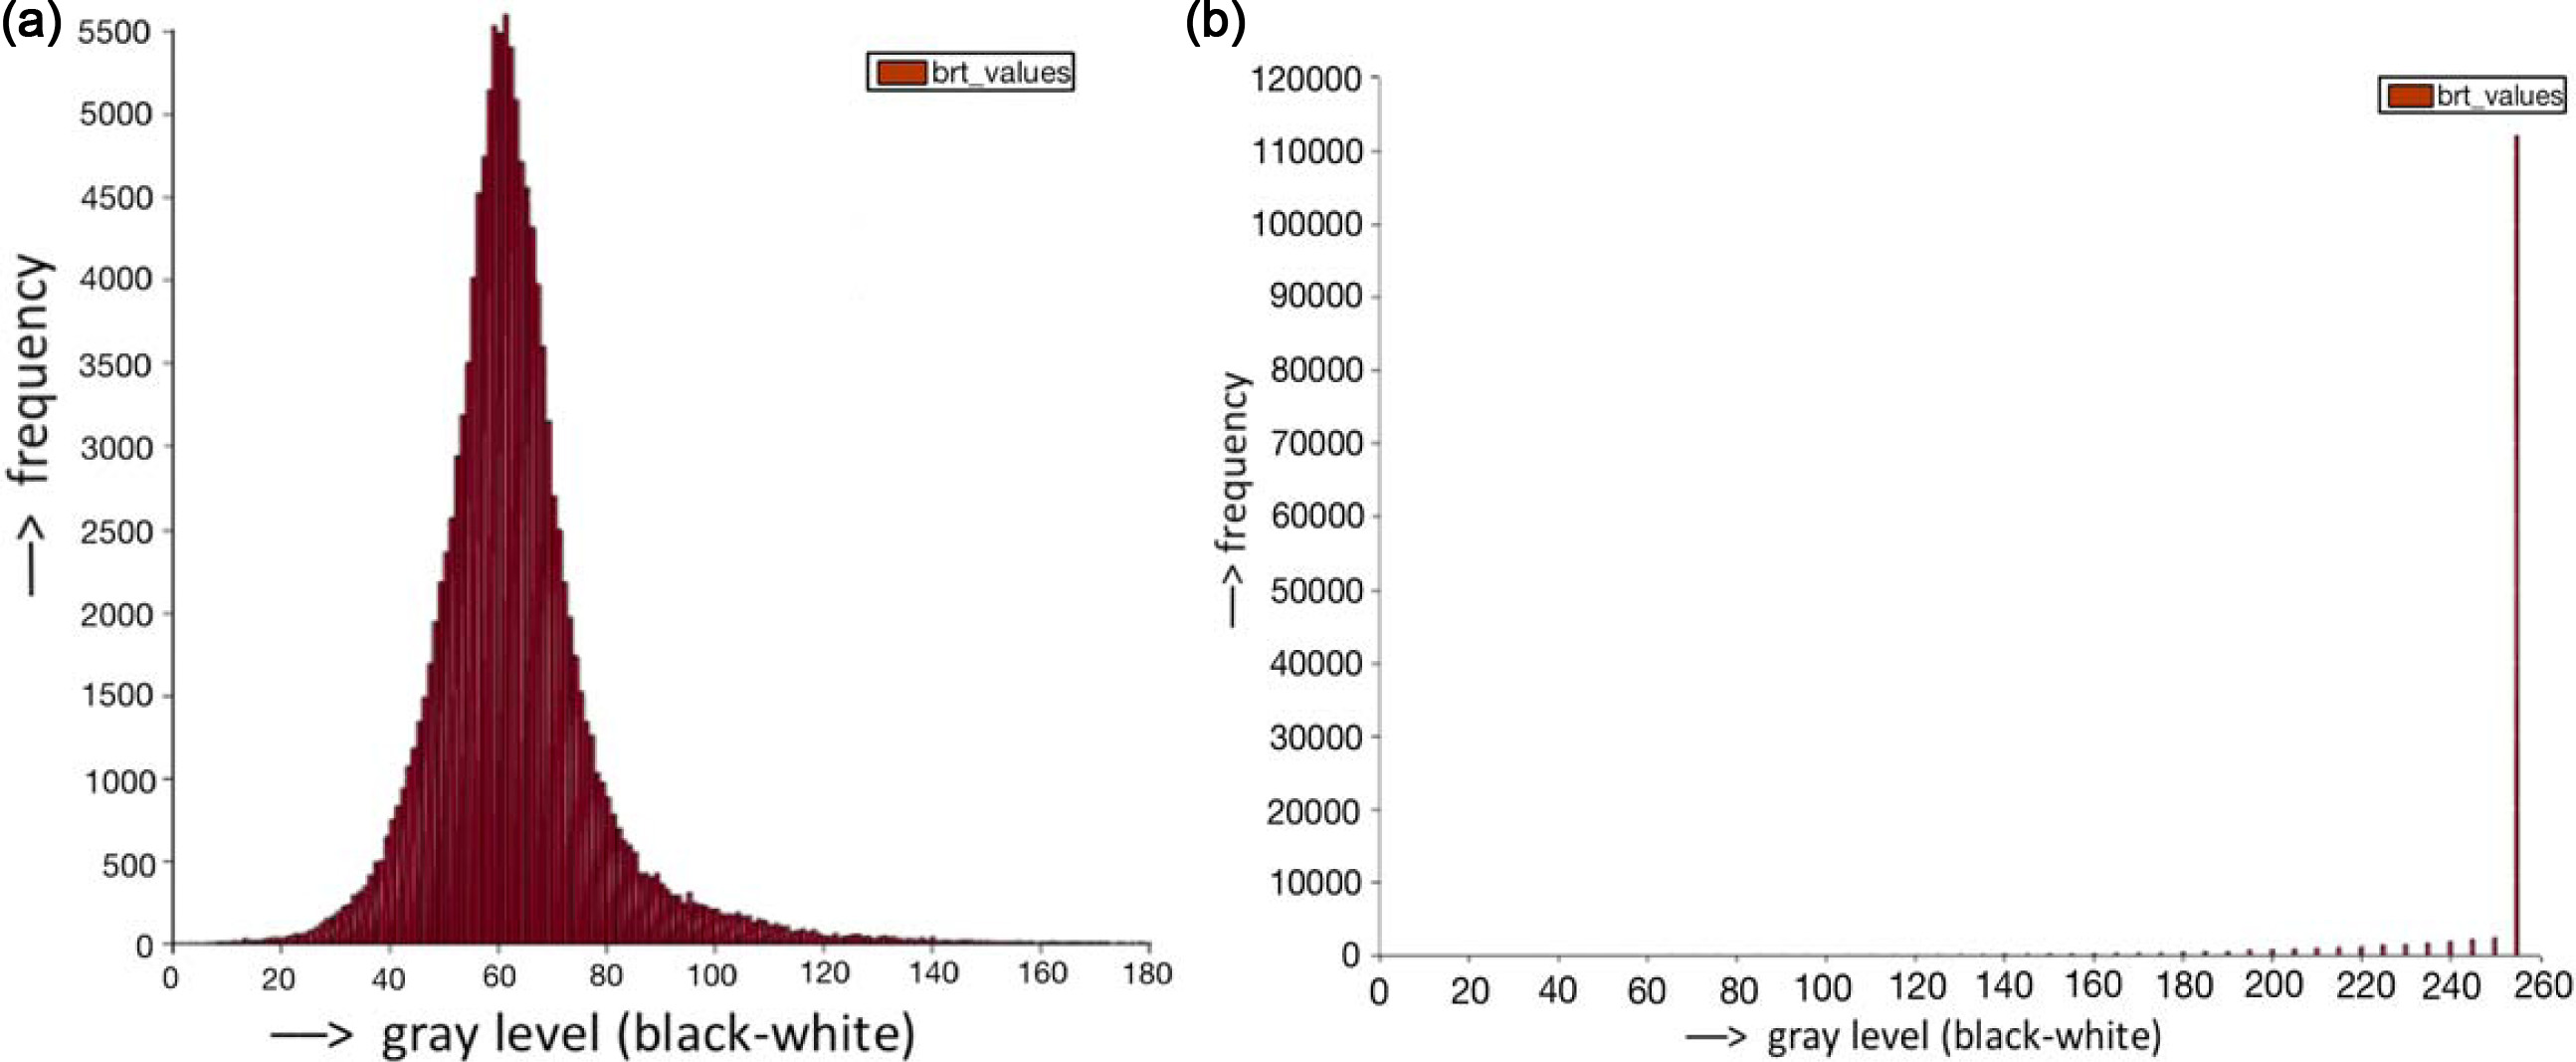
The histogram, shown in Fig. 8, shows the frequency of the
representation of the individual intensities in the three-dimensional sector
processed. This histogram does not allow object and background distinction.
This is due to the complex microstructure of the scanned sample from different
pore depths, image artifacts and non-homogeneous composition of the material.
The goal of the following math operations is to create a sharp interface
between the objects and the background in the image.
Filtration of noise by linear averaging
Mathematical filter / Software: “Mean (Kernel), Image
Math” / DREAM3D
Noise filtration is based on transforming an image by
changing the brightness of the pixel of the input image to the brightness of
the output image in order to highlight or suppress some of its properties. In
the case of digital image processing of an irregular and complex material
microstructure, this method is suitable for suppressing very small objects in
the digital image, which have little effect on the resulting structural
properties, and on the other hand highlighting large objects in the digital
image.
The used image linear noise filtration gives satisfactory
results when compared, for example, to a median or Gaussian filter. Using
simple averaging filter involves assigning a new brightness value of function ƒ
at point x, y, z given by the arithmetic average of the brightness of the
points in its vicinity. In the studied case, a ROI 50 ´ 50 pixels was used. Linear
filtering of noise suppresses image artifacts, but at the same time blurs the
image, so the magnitude of the x, y, z diameter of the point should be less
than the smallest detail studied in the scanned image. The new brightness
function of each point in the three-dimensional image of the scanned sample can
be written as:

where m corresponds to the
number of points in the matrix, the function ƒ the new value of the
brightness of points in the matrix, and S
functions g the sum of the brightness intensity values of the points in
the original three-dimensional matrix. In this particular case, the noise
removal using averaging filter needs to be done several times in succession,
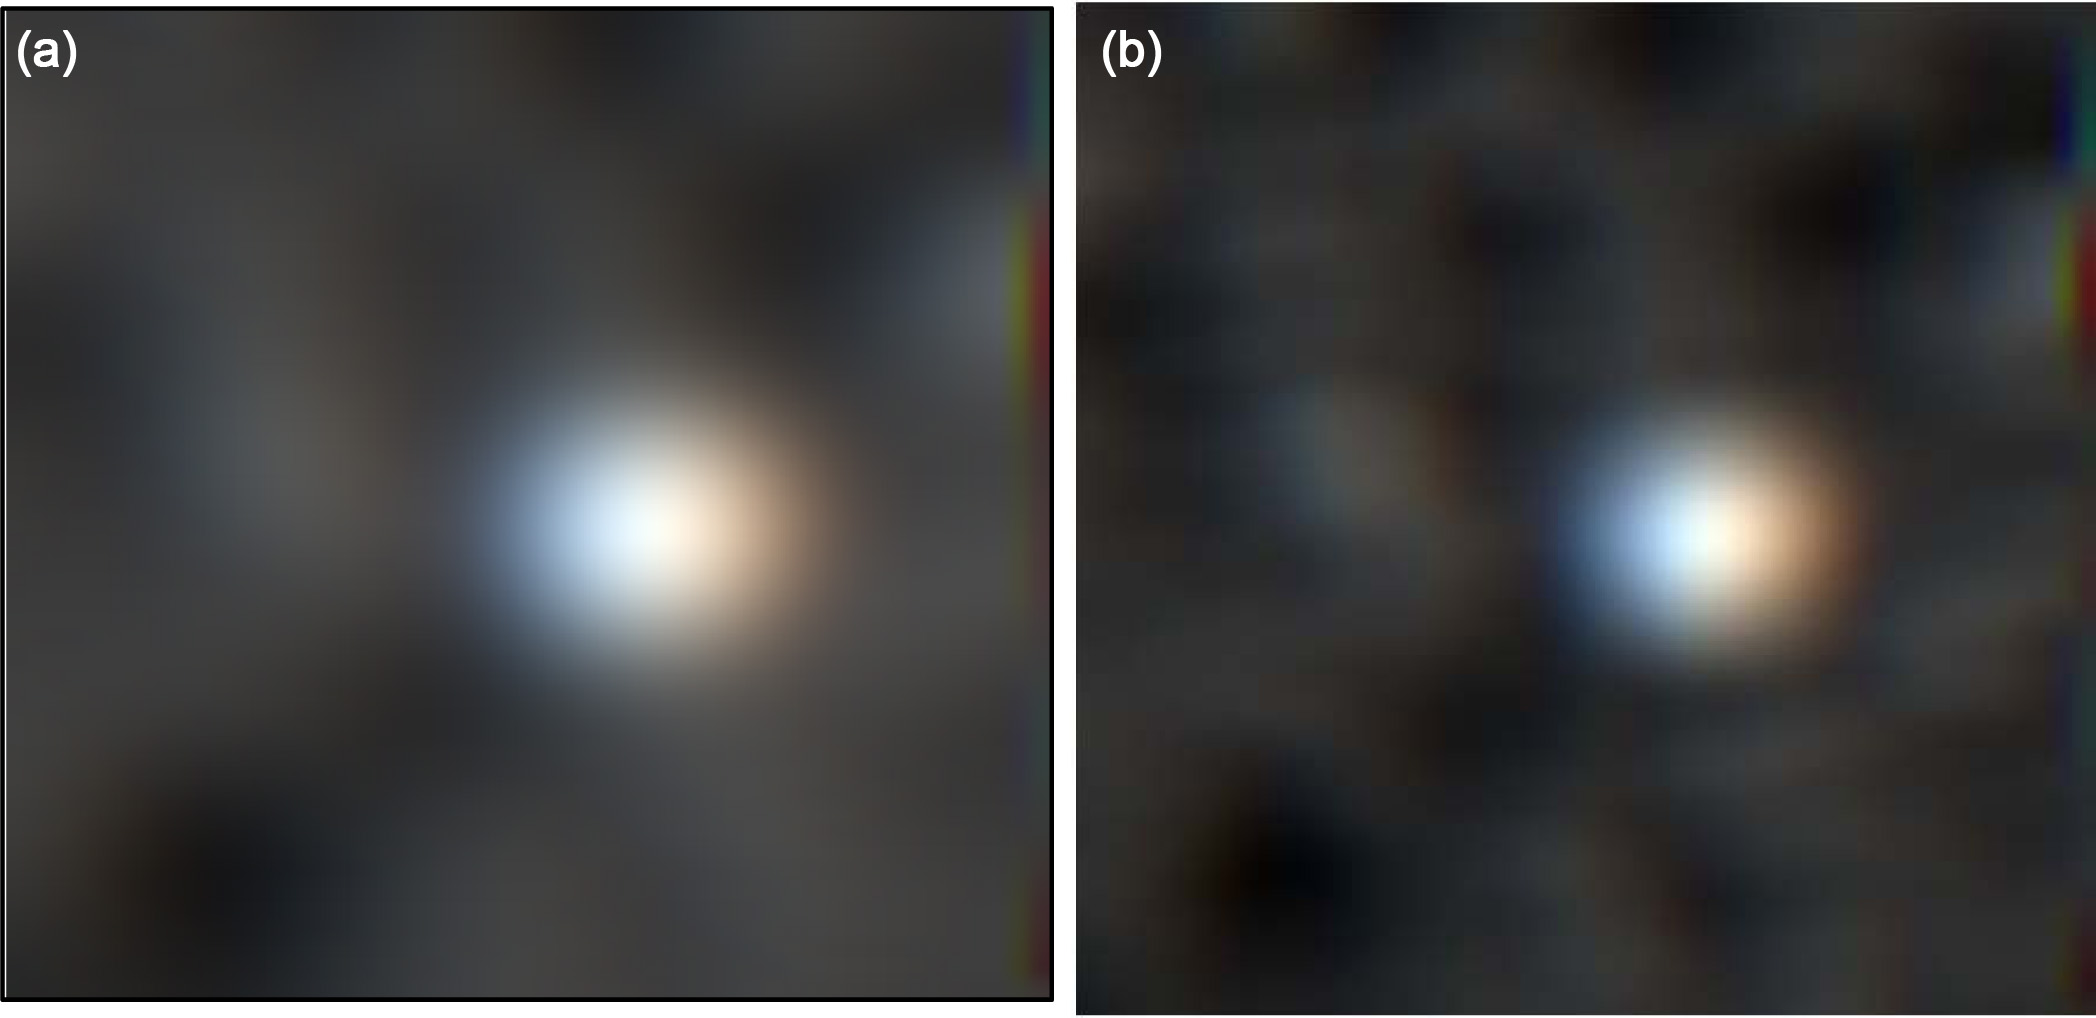
depending on the structure of the sample material being scanned (Fig. 9). For
each processed segment of the scanned sample, it is necessary to approach each
processing point individually depending on
the local structure.
In Fig. 9(a) and (b) is shown a homogenization of the
brightness intensity values in the image after noise filtration, making
impossible to distinguish objects from the background in the histogram, or
rather matter and pores in the material. It is therefore necessary to optimize
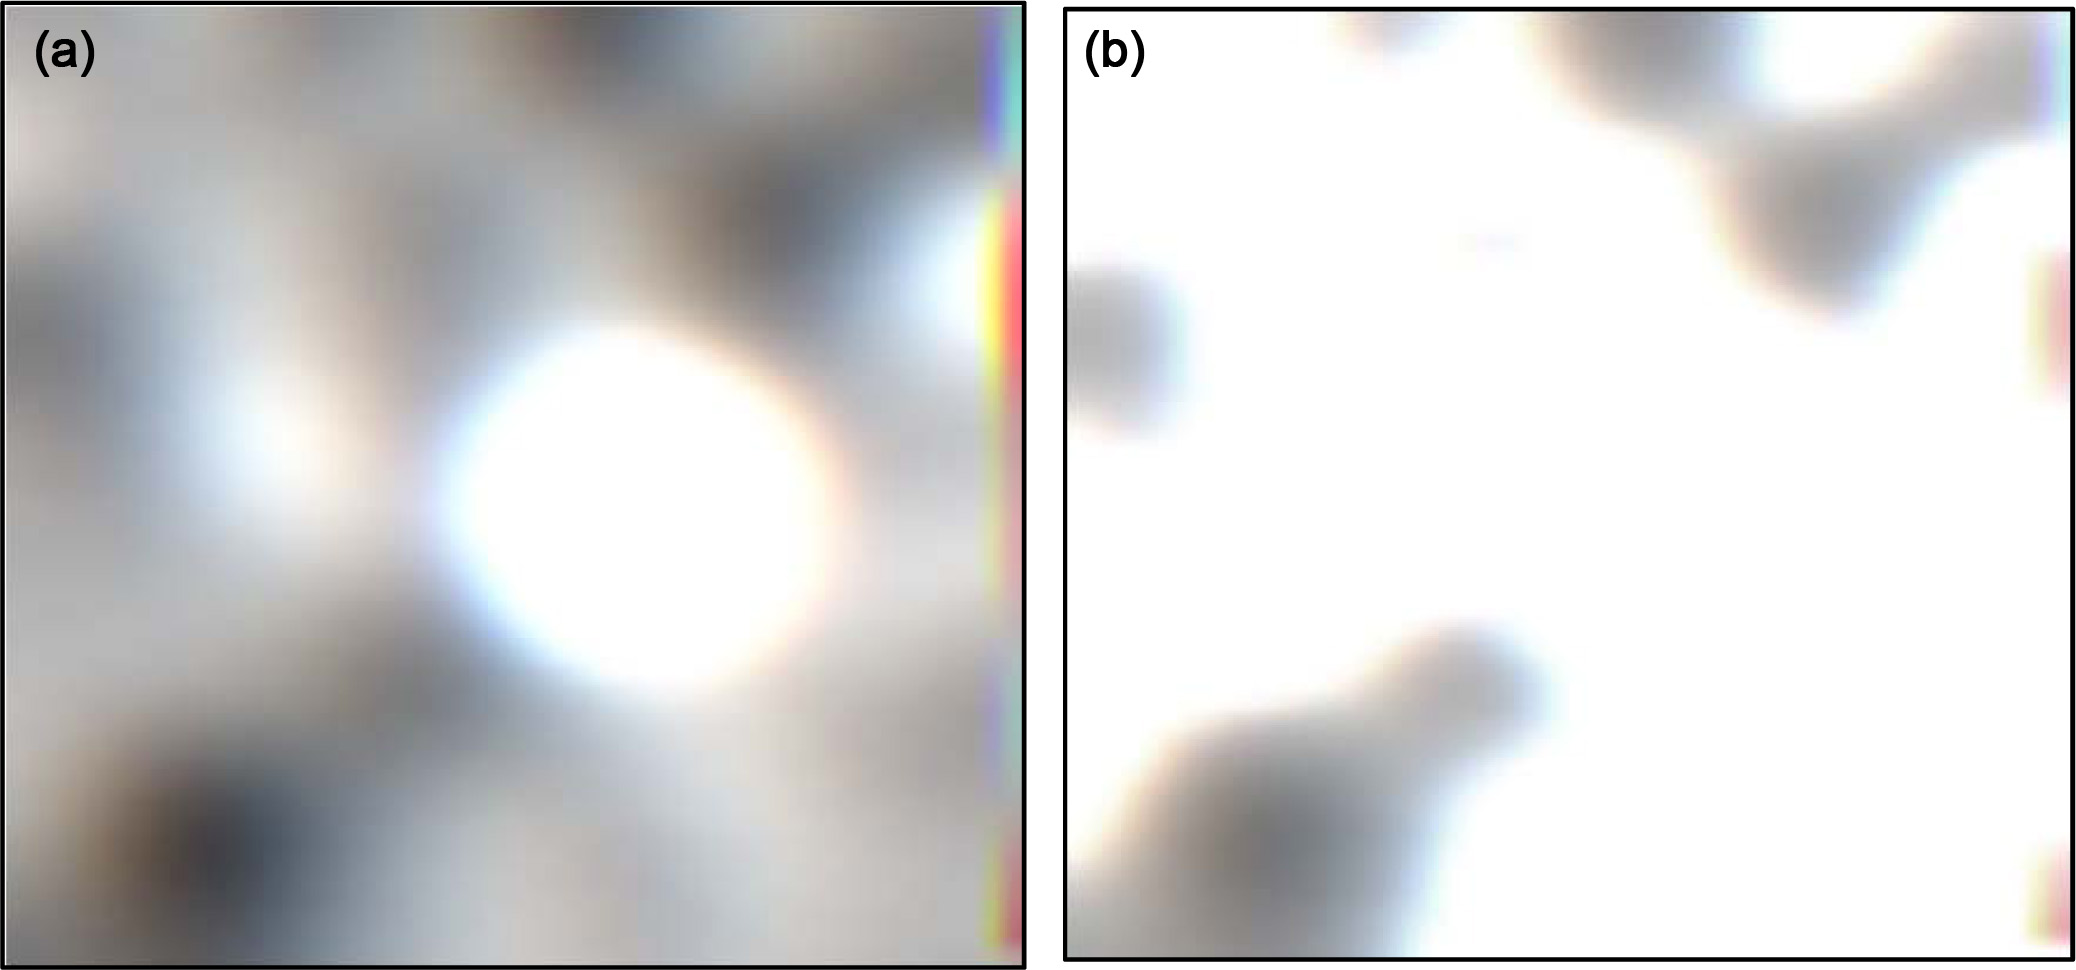
the brightness intensity of the individual points by multiplying, see Fig.
10(a) and (b).
The essence of the algorithm is that each brightness intensity
point ƒ is assigned a new value of the brightness
intensity function h, given by the multiplicity of the original value of
the function ƒ:

The resulting image sharply distinguish the objects and
the background, where the white areas represent the material of the sample
being scanned, and the areas with different levels of gray represent the
cavities in the structure.
Fig. 10(a) and (b) shows the studied section of the
scanned image at various multiplication values of the function ƒ.
It is evident from the corresponding histogram (Fig. 8)
that in this particular case, the most optimal combination of functions is
triple linear averaging combined with five times the function ƒ whose result is
represented by Fig. 11(b).
Image thresholding
Mathematical filter-Software: “Threshold Objects”/DREAM.3D
The principle of thresholding is based on the assumption
that the image has a different brightness value compared to its surroundings.
The scanned black and white 2D CT image g (x, y) consists of a group of pixels,
each pixel having an integer value of the brightness intensity function. Then
the digital image can be written as m, n matrix:

Then every point of this matrix can be written as a (m, n)
= ƒ (m, n), where ƒ is the function of the point (brightness, vector, etc.) and
m, n are the coordinates of the point in the matrix. Mathematically, the image
can be written as a matrix:

In such a matrix, we select the thresholding function T.
The function T is the so-called threshold corresponding to the
pixels with the limit value of functions ƒ, resp. intensity of brightness.
Limit value of brightness defines whether it is a pixel object or background.
In general, a threshold image can be defined as a:

The aforementioned function states that a pixel with a
brightness intensity value greater than the threshold value T belongs to an object and a
pixel with a brightness intensity value of less than or equal to the threshold
value T belongs to the background. An algorithm based on this function scans
every pixel and divides the pixels into two groups based on the thresholding function. The abovementioned approach
is called simple thresholding and is applicable to scanned digital CT images
consisting of one object and its background.
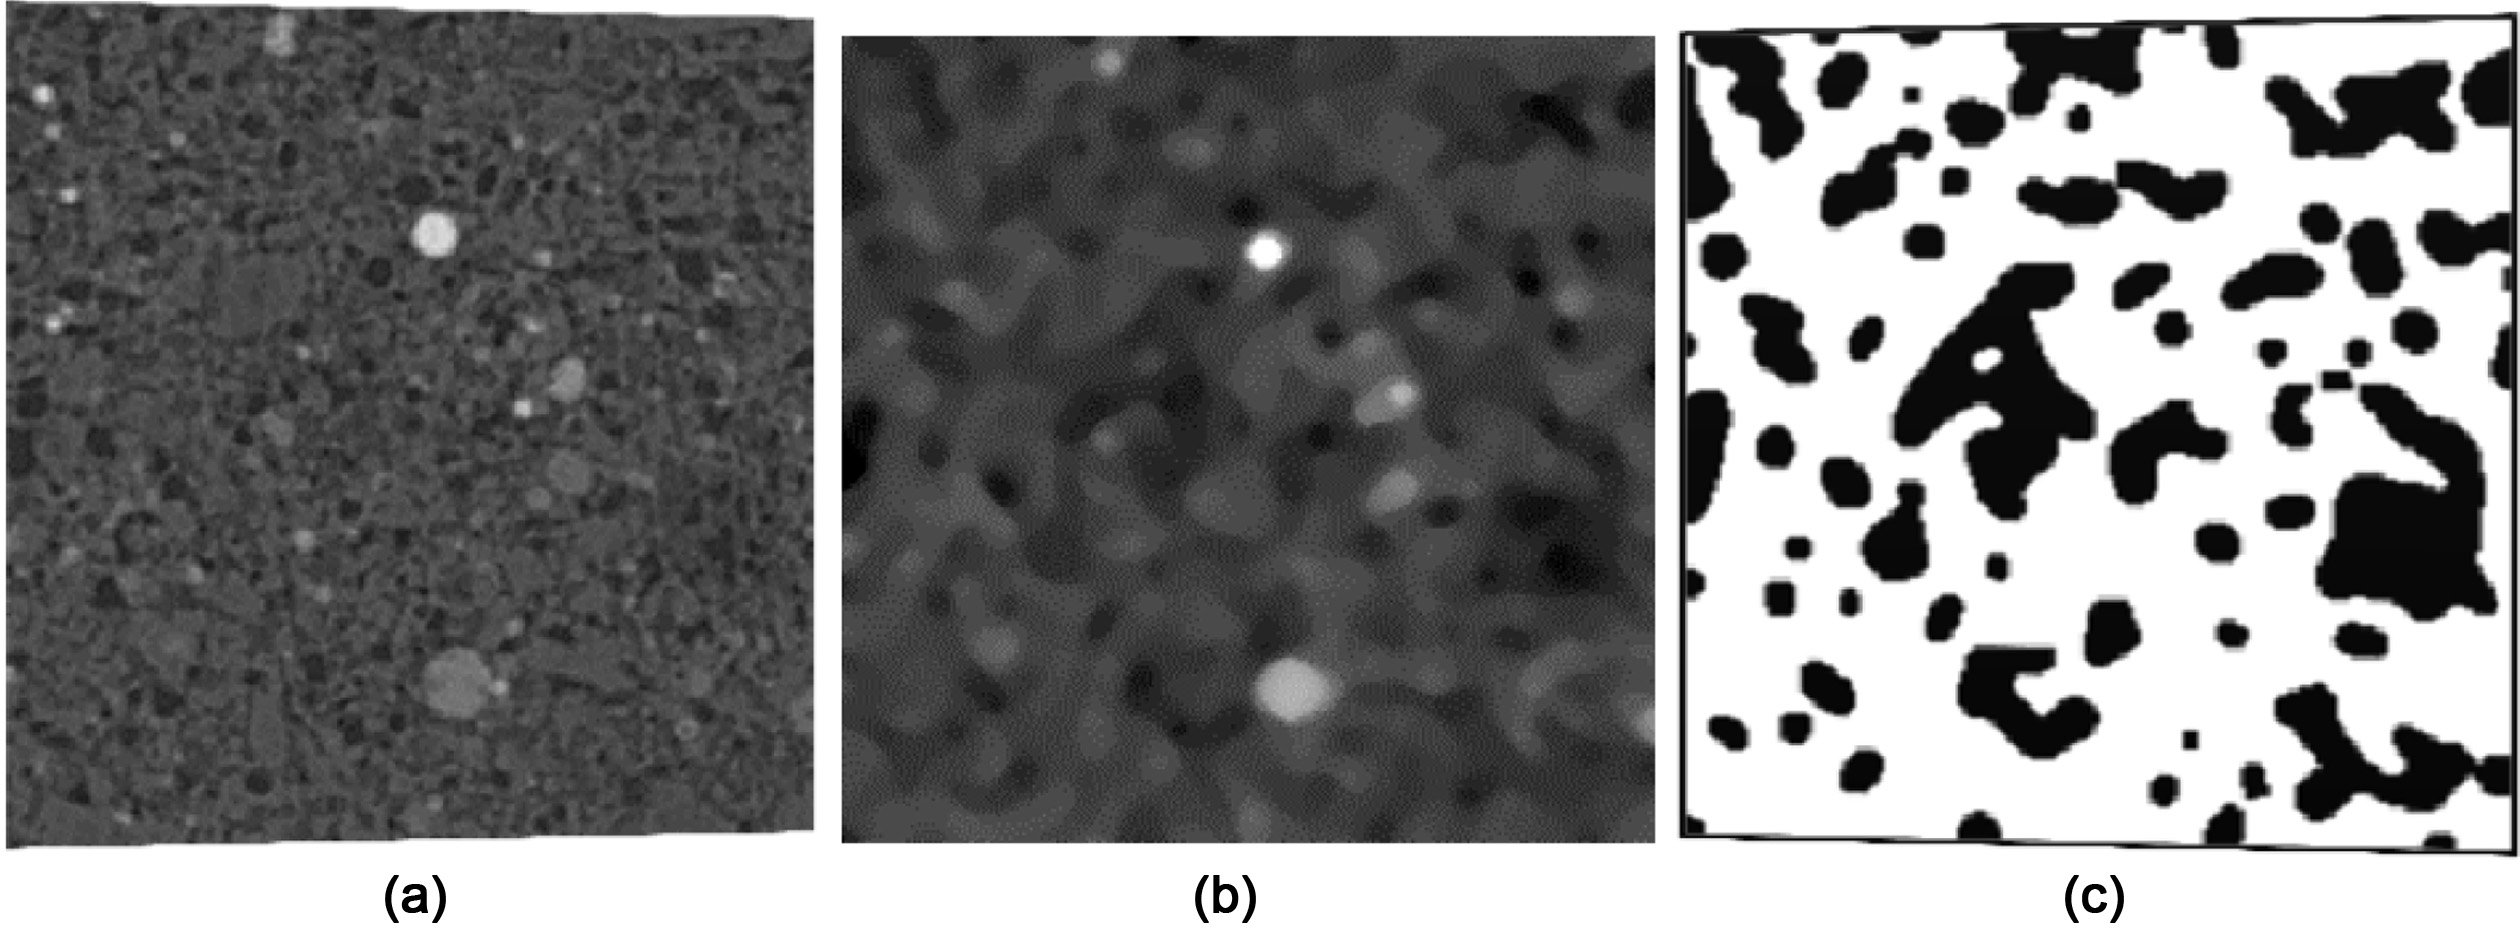
The thresholding function T according to Fig. 12(b)
corresponds to a value of T < 254.5. Figures below depict the
original X-ray-CT image of the studied ceramic material, the image after the filtering
of the noise by linear filtration and the same image after thresholding
Image segmentation
Mathematical
filter / Software “Segment Features (Scalar)”/DREAM.3D
Image segmentation is the process of assigning a label to
every pixel in an image such that pixels with the same label share certain
characteristics. Image segmentation algorithm so allows
creating single objects that can be further extracted and
processed.
The following description represents the schematic process of segmentation
algorithm. In the matrix representing the digital CT image, the default pixels
ƒ (m, n) are randomly chosen in the region formed after the thresholding. The algorithm then searches for adjacent
pixels, and based on the chosen absolute difference
of brightness intensity function ƒ of pixel m, n determines whether or not the
pixel belongs to the selected region. The pixel belongs to the region if at
least one pixel in its neighborhood acquires the absolute difference in
brightness intensity at the selected interval.
When applied to a stack of images, the resulting contours
after image segmentation can be used to create 3D reconstructions.
Three-dimensional
model processing
The principle of creating a three-dimensional model
consists of converting a discrete description of the data obtained by
mathematical analysis of 2D CT image data into vector descriptions. The vector
description describes mathematically the outer structure of the surface of the
studied object using the tetrahedral network. The modeling process consists of
three steps, namely vectorization, smoothing and decimation of the surface.
Structural vectorization
Mathematical filter / Software: “Quick Surface Mesh”
/ DREAM3D
Creating a surface mesh in DREAM.3D can currently
be accomplished by using the Quick Surface Mesh Filter. The structural
vectorization of surface created by the “marching cubes” method consists of
creating a triangular network representing the surface of the studied object.
This method is quick, because it simply draws triangles across the voxel faces
of an Image Geometry. The result is a Triangle Geometry, where the boundaries
between Features are defined by connected triangles. This means that any given
triangle is shared by two Features. The Triangle Geometry has a list of Sharp
elements, where the elements are the primary unit element of the Geometry. For
example, a Triangle Geometry has primary elements that are triangles with free
vertices, so such a Geometry has a list of triangles that are defined by
referencing the three vertex Ids of which they are composed [22]. The algorithm
creates a pair of triangles on each cell side. The result is the tetrahedral
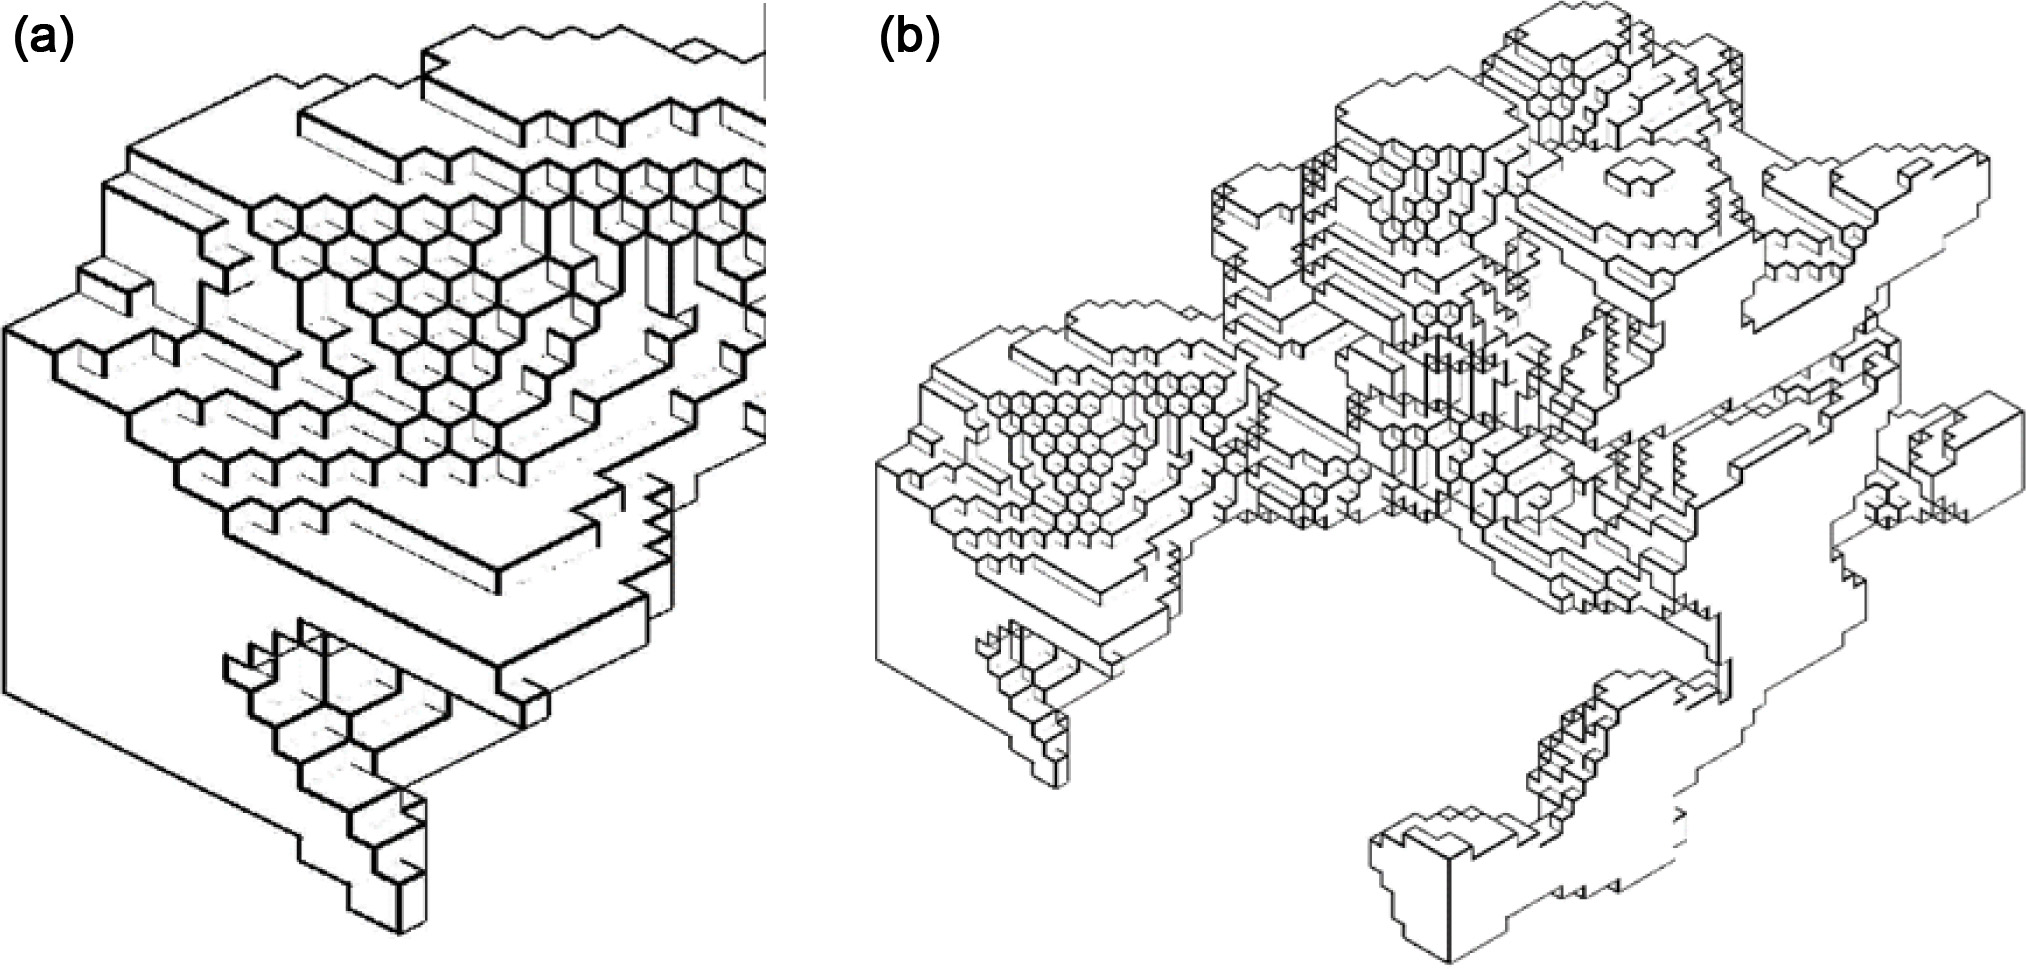
cubic surface structure of the investigated material shown in Fig. 13.
The resulting surface mesh is usually not satisfactory,
since it is remaining “blocky” from the original Image Geometry.
Surface mesh smoothing using the Laplacian Smoothing
Filter was used to solve this problem.
Laplacian smoothing
Mathematical filter / Software: “Laplacian Smoothing”
/ DREAM3D)
Laplace's smoothing serves to smooth the cubic structure
of the polygonal mesh. The algorithm's control parameter is the parameter λ,
which defines the maximum allowed triangulation network node movement
value. The factor λ is a small positive number. The Laplacian smoothing
algorithm reduces the high frequency surface information and tends to flatten
the surface. If λ is too small, one needs more iterations for smoothing and the
smoothing process becomes time-consuming. If λ is not small enough, the
smoothing process becomes unstable. In the Laplacian algorithm the λ term has a
range of 0 ≤ λ ≤ 1 and defines a relative distance that a node can move
relative to the positions of the node neighbours. A λ = 0 value effectively
stops these node types from any movement during the algorithm, so this allows
this value to be set for specific types of nodes so that shrinkage of surface
mesh can be stopped during the smoothing process [22].
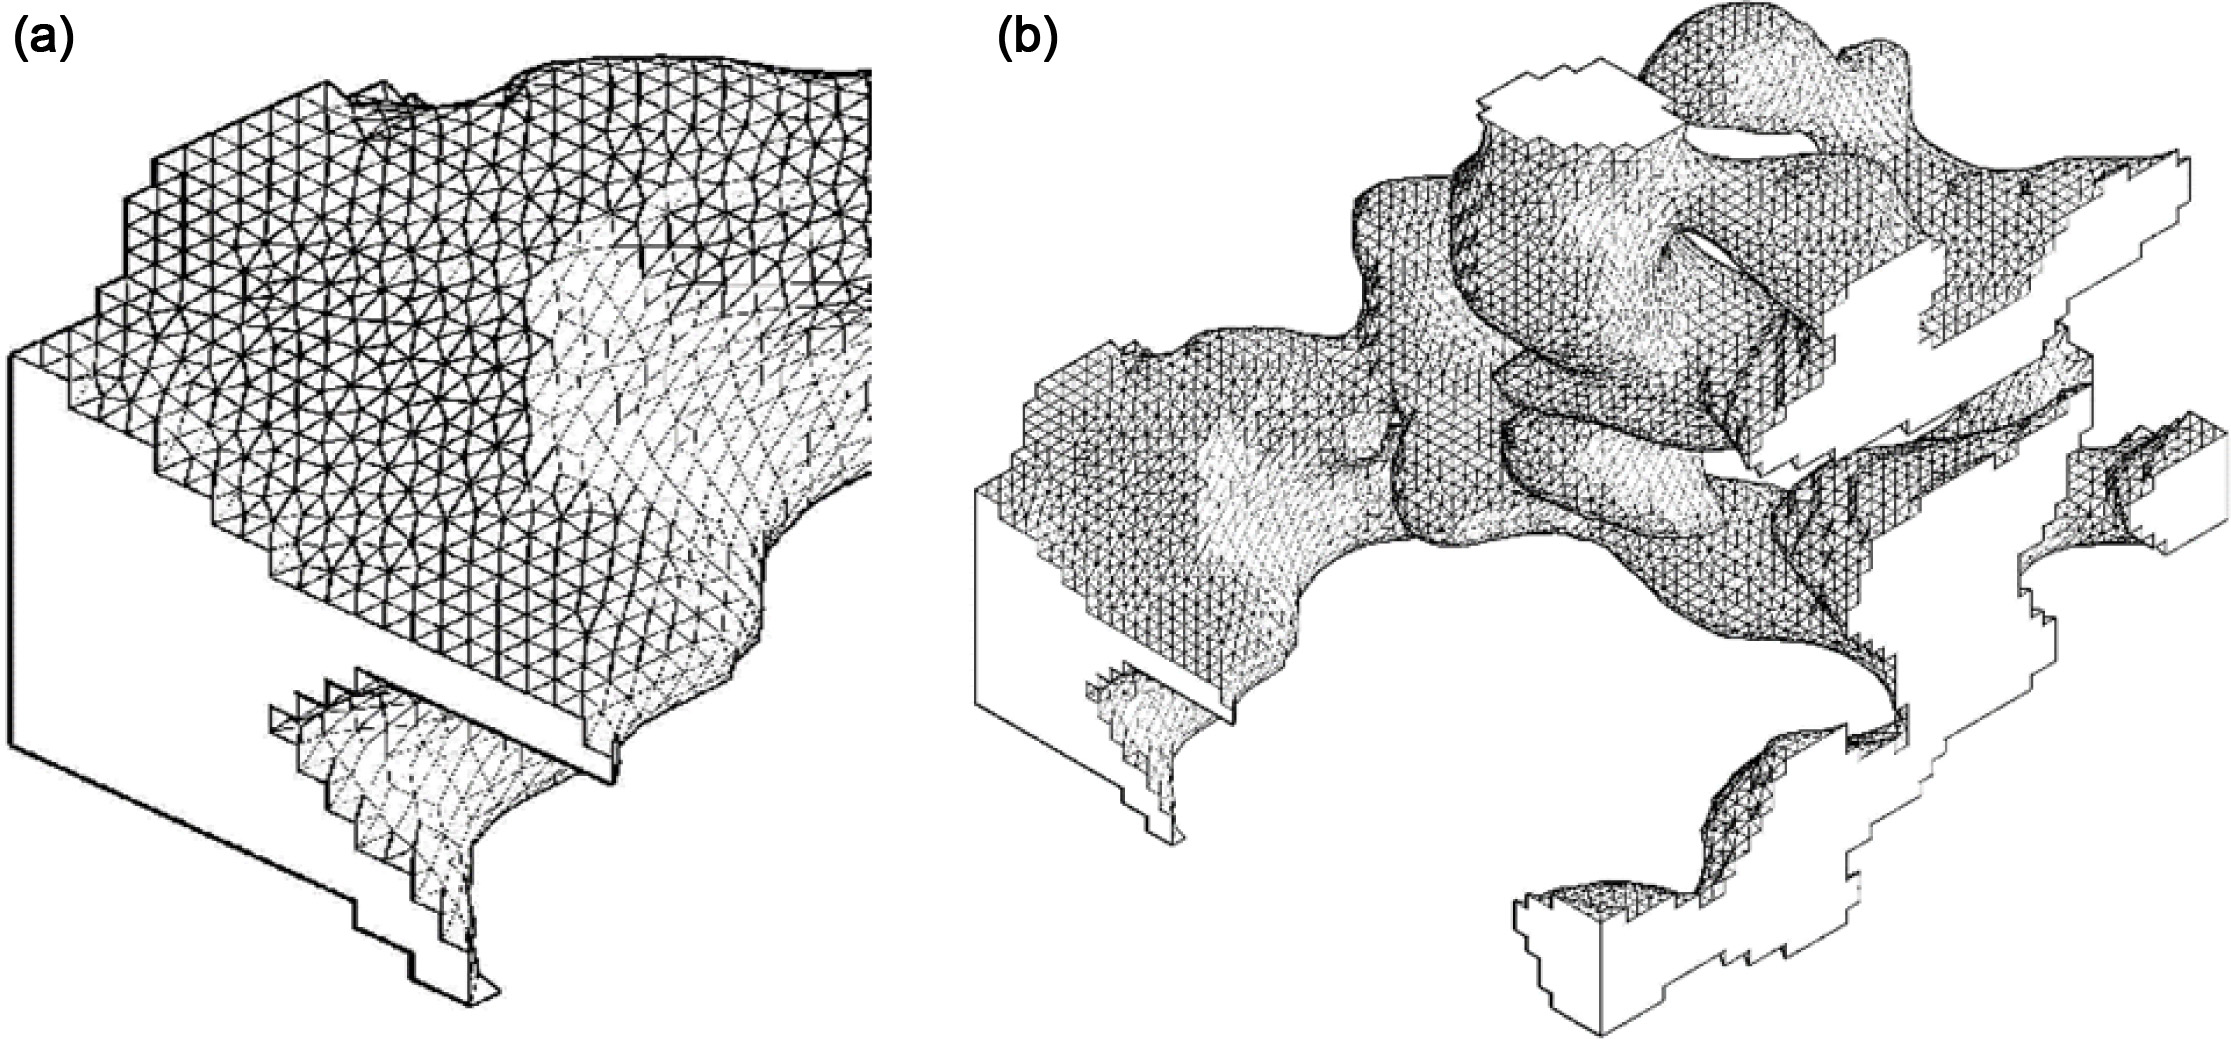
The shape and structure of the network after Laplace's
smoothing is shown in Fig. 14.
Surface decimation
Mathematical filter / Software: “Decimate” / ParaView
Smoothing the surface creates a network with a large
number of triangles. This network is a very compute-intensive and so the
decimating the surface takes place - while maintaining the shape and volume of
the object as much as possible. The principle of surface decimation
is to simplify the triangle mesh by reducing the number of triangles in such a
way that overall origin shape of the mesh will be maintained intact. The
control parameter is the percentage reduction in the number of triangles in the
mesh (TargetReduction), resulting in a geometric error of the model, which is
dependent on the mesh reduction ratio of the triangulation network. The
decision parameter of the algorithm is the size of the minimum angle between
the adjacent sides of the triangle (FeatureAngel). If this angle is equal to or
less than the specified angle, its sides are considered to be an edge function
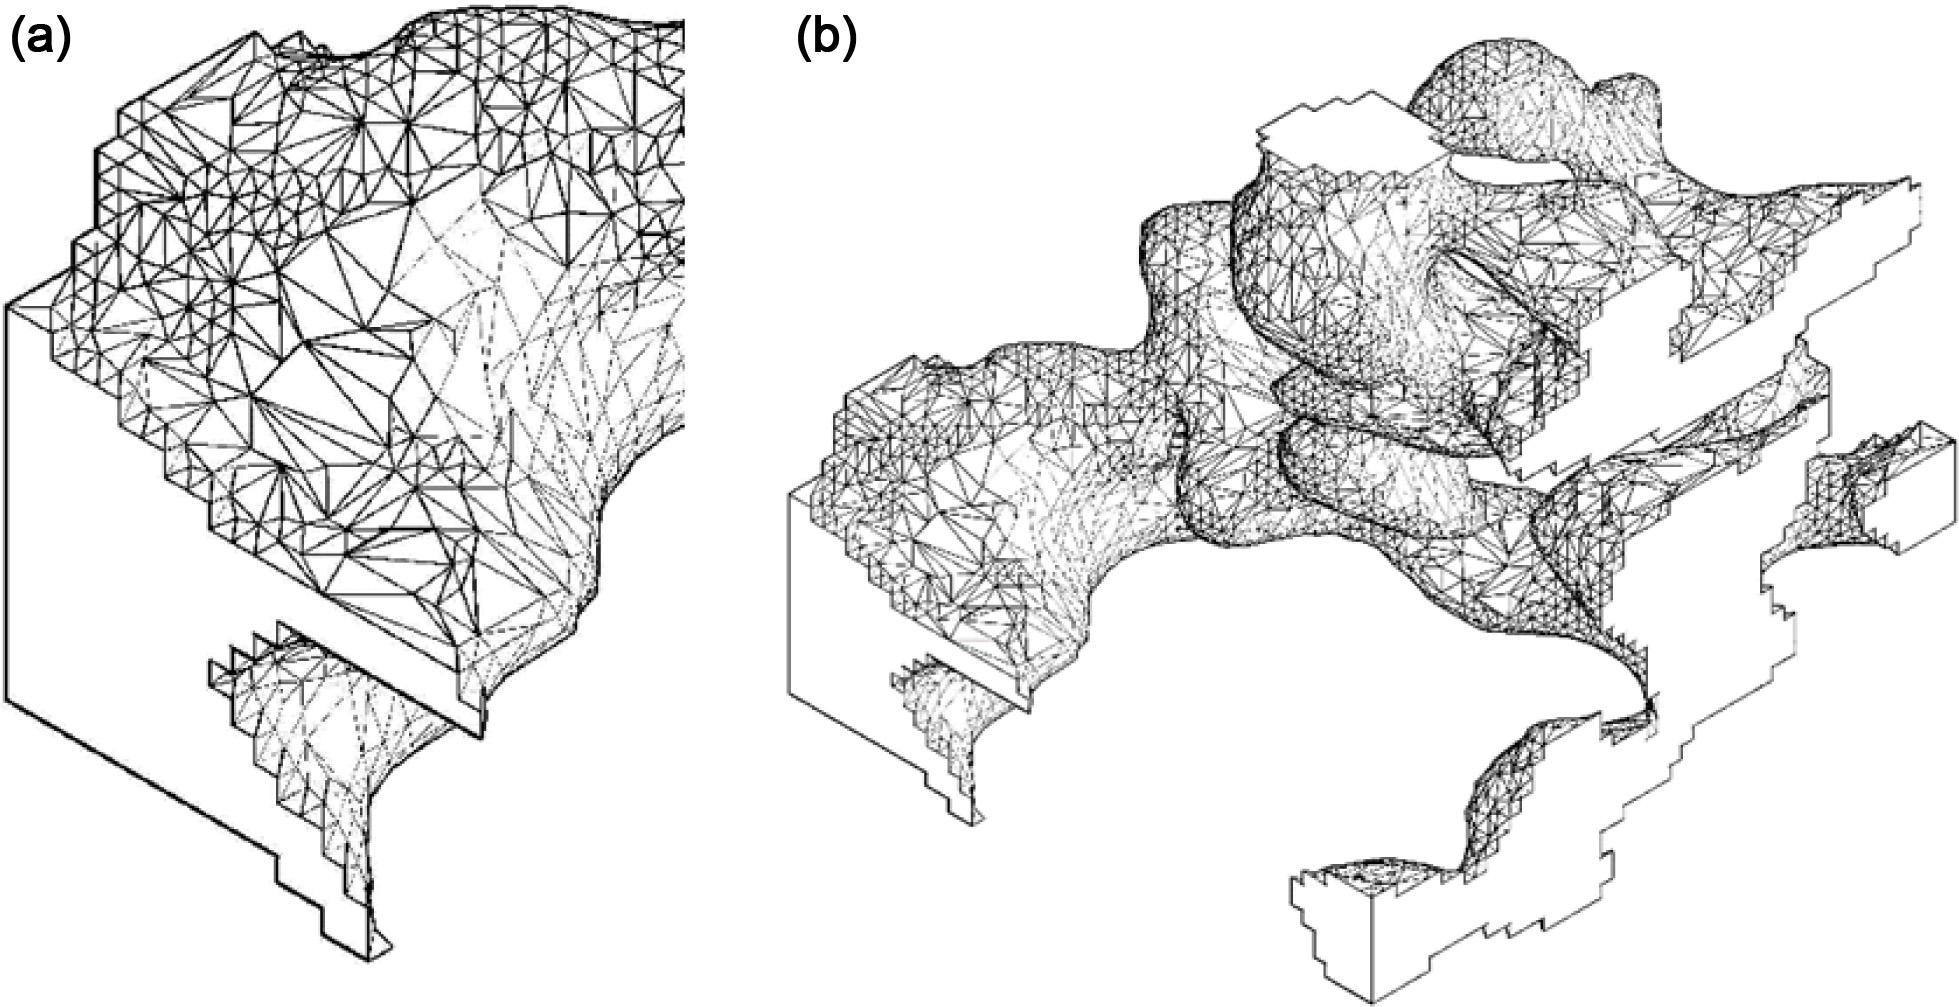
and the network is divided here. The result of decimation of the triangulation
network is shown in Fig. 15(a) and (b).
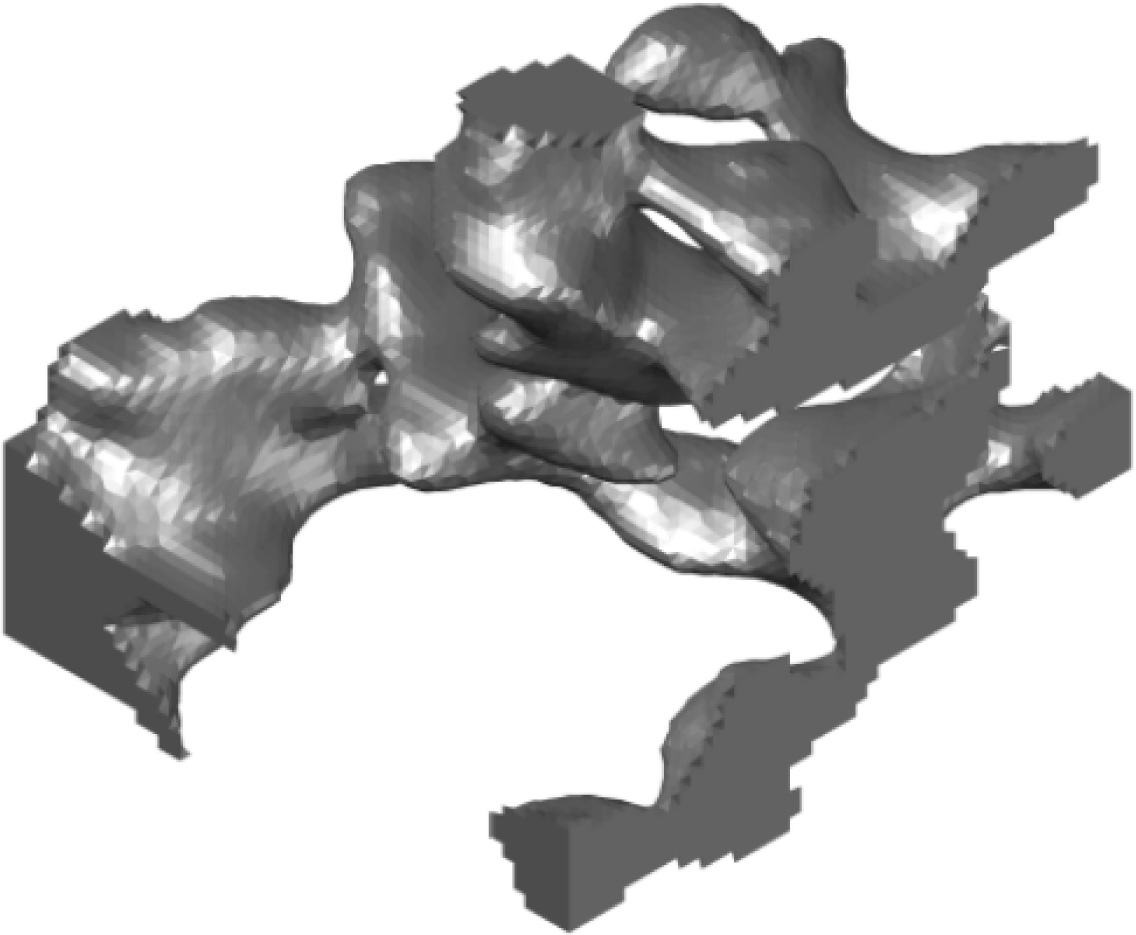
The obtained surface model was converted to a volume model
using the Autodesk Inventor a 3D CAD construction software. Example of the
resulting model suitable for analysis of material microstructure is shown in
Fig. 16.
Material
structure information obtained from the created 3D model
In sections, 3 and 4 was described 3D reconstruction
process from 2D image data from X-ray CT of the ceramic fragment. The overall
reconstructed geometric model of the studied material space (3 mm3)
done by 3D CAD software by Autodesk is shown in Fig. 17. Solid matrix of the
material is depicted in red while the pores in grey.
Construction of 3D model is based on vector representation
of fragmented data. Most common CAD softwares works with 3 types of model
describes of single entities that forms future 3D structure. In such models
could be included edge, surface or volume models. In this wark has been used
B-spline model with non-uniform racional B-spline surfaces that
represent information about each surfaces forming network of the
model. Each nod of the B-spline surface is defined by the defined weight value.
Inner nodes are not defined, models work only with surface values.
The whole process is based on utilization on B-spline
proces with focus on three specific steps. The first one is focused on
vectorization and preparation of the vector network. By the approach of
marching cubes is formed the coarse 3D surface. The used algoritmus gather
raster voxel (eight of them) into the cube/prism. The second step is focused on
spline procedure by which the algoritmus cutting the edges usually by the use
of weight average of neighbor nodes. The last third step provides reduction of
polygonal surface structure and reduce number of nodes in term of production of
the new surface with the same properties as the first coarse 3D surface between
nodes. During the reduction process are set criteria that defends against
significant changes in surface.
All that approaches has been videlly adopted in different
CAD systems. Within this work has been used methods that maximally simplifies
the whole process of 3D structure preparation.
Using the standard construction tools, it was possible to
adjust the microstructure of material by extraction, rotation or separation of
a specific object of interest. The mentioned operations were applied to the
visual 3D model and allowed to evaluate the following properties of the ceramic
support.
Porosity evaluation
Reconstructed model can be used for porosity evaluation.
In created model, porosity results from comparison of solid matrix and inner
porous space. Calculated ratio between the active porous area pores and the
ceramic-forming material corresponded to porosity of 32%. Mercury porosimetry
gives results of 33% (Section 2.1.6). If we take in account the uncertainties
of both methods, values were in very good agreement.
Evaluation of discontinuity
Industrial X-ray CT scanning usually serves for internal
inspection of scanned material such as failure analysis and flaw detection. As
for ceramic materials, typical flaws are represented by cracks. Defects in such
materials are usually formed in large compact grains of the input material due
to internal stresses during sintering and cooling process.
Created model was visually inspected and areas of interest
were separated from the object. On the Fig. 18. is depicted an
example, where segment of interest (a) and its
extracted part (b) represents cavity of dimension greater than
10 μm.
Homogeneity evaluation
Homogeneity is another parameter that can be studied
visually by tracking a certain component with a specific
characteristic. In our material, such components were
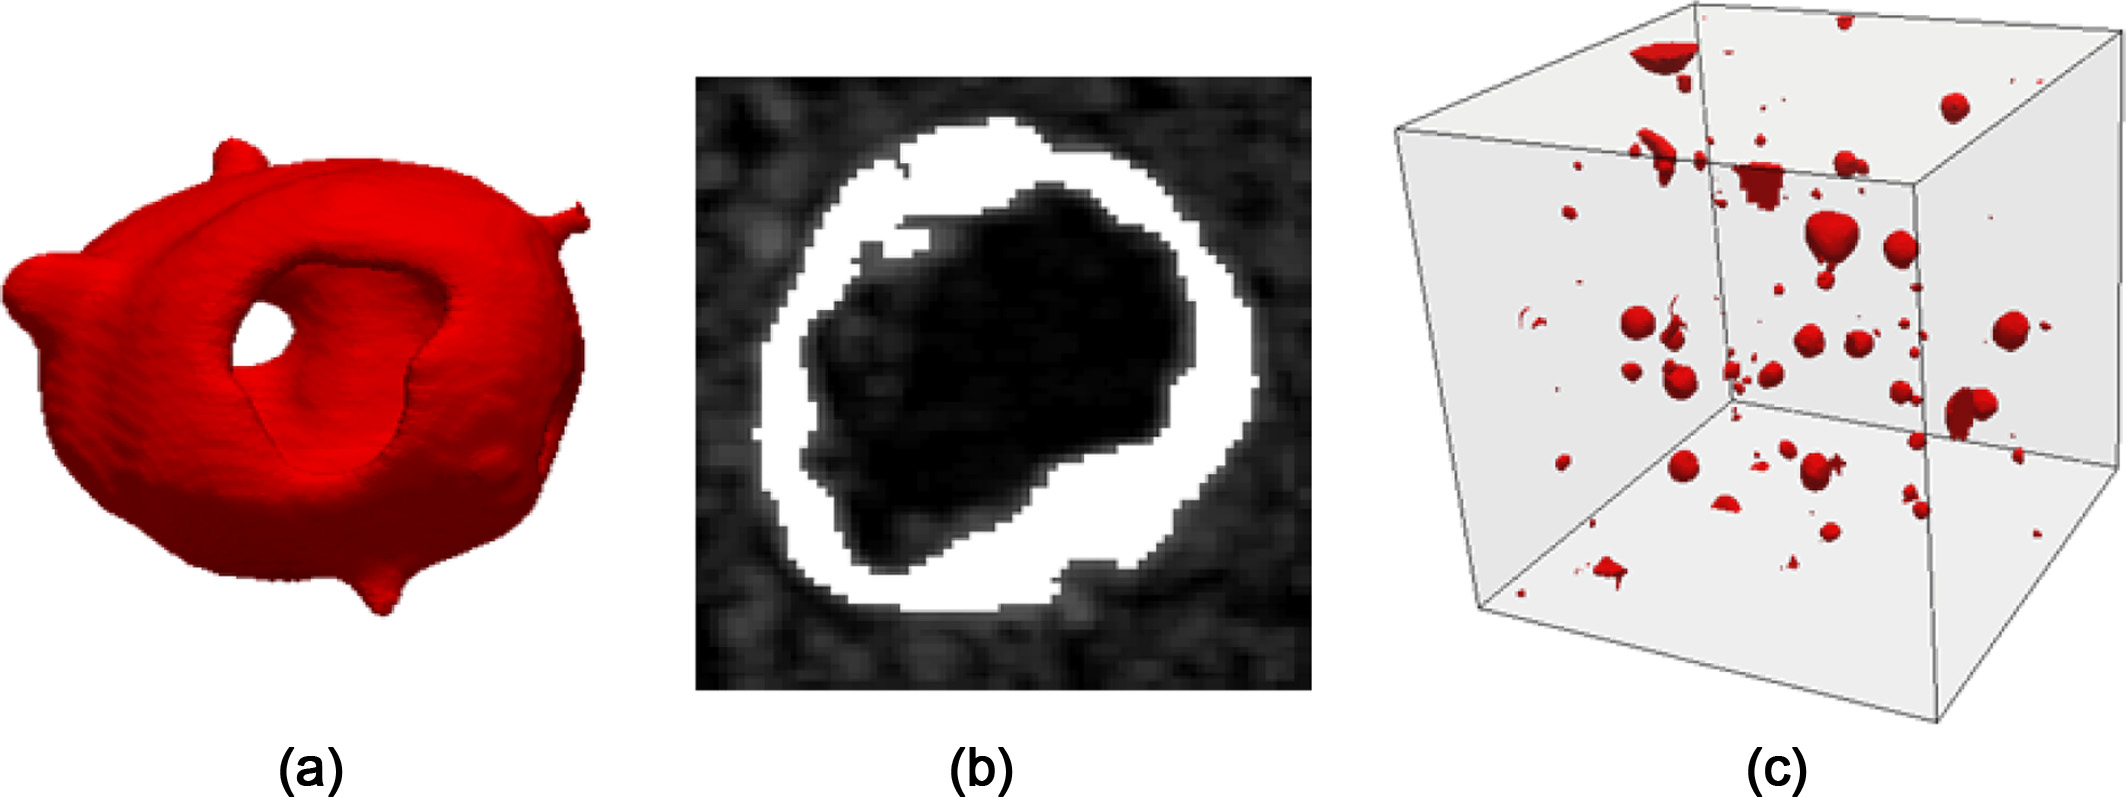
cenospheres that form part of the power fly ash [24] used in prepared ceramic
supports. The image (a) in Fig. 19. shows the 3D geometric model of silica-alumina
microsphere with typical hollow, while image (b) shows the original 2D X-ray CT
image. The 3D model (c) shows distribution of cenospheres in selected area to
control the homogenization process of prepared ceramic support.
Geometric model for numerical simulation of flow
The output geometric 3D model can also be used for
mathematical modelling of fluid transport through the structure of the material
using the CFD (computational fluid dynamics) method. Numerical simulation is
used as a tool for understanding the fluid flow mechanism and behaviour.
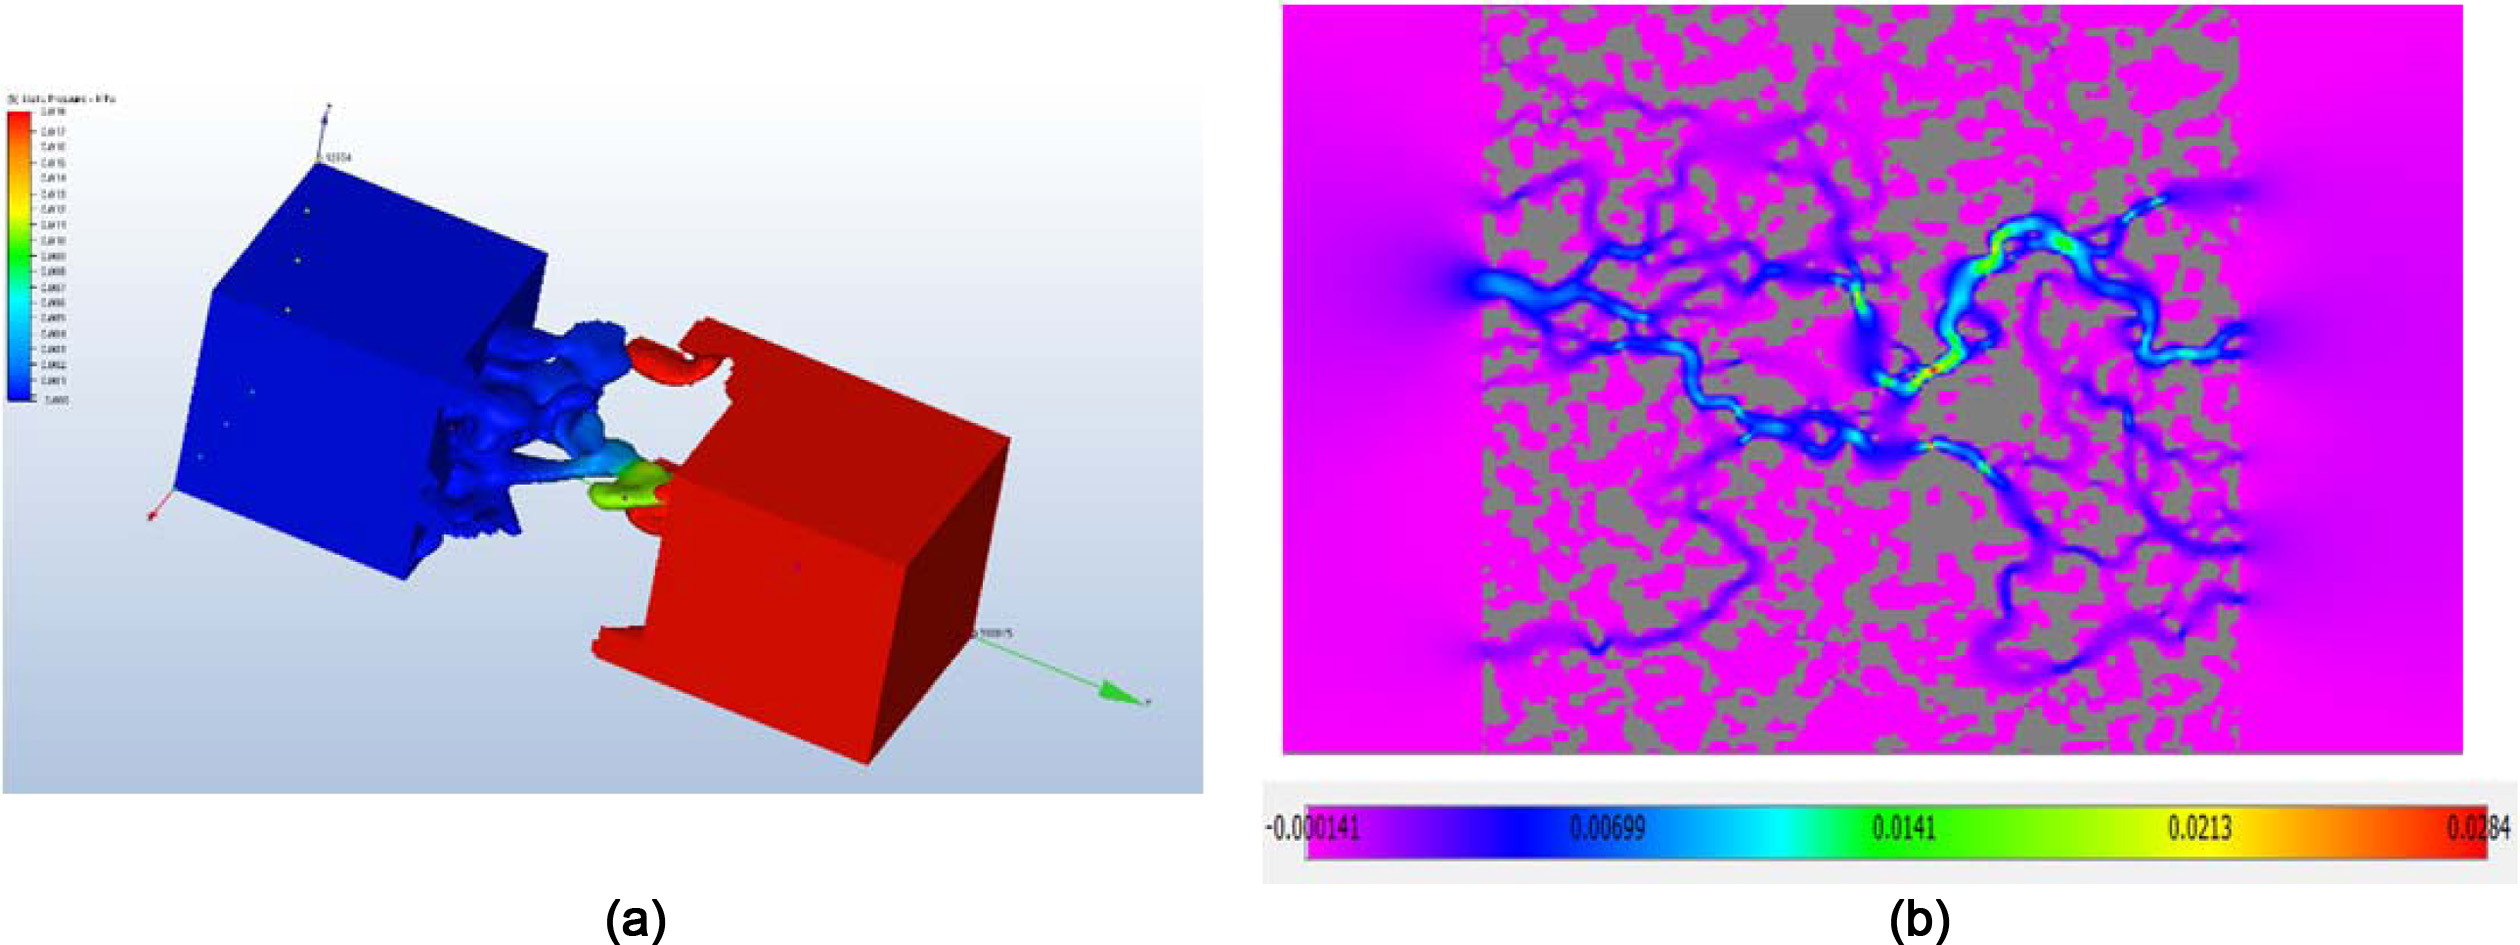
Fluid flow simulation through ceramic support
micro-channels was performed using Autodesk CFD. The 3D model served for
calculation as a medium in which liquid is introduced under specific
conditions. The Fig. 20(a) shows the distribution of pressure conditions. From
the initial state, the static pressure in and behind the channels increases due
to the reduced flow environment. The Fig. 20(b) shows the flow velocity
distribution. Due to the decreasing profile of the micro-channels, the gradient
is increased in the constricted parts, which is released at the ends of the
model. This also corresponds to the color scale.
|
Fig. 1 Particle size distribution of fly ash, kaolin and shale. |
|
Fig. 2 Inner profile of the extruded tube before sintering. |
|
Fig. 3 Inner profile of the extruded tube after sintering. |
|
Fig. 4 XRD data for unsintered and sintered support. Quartz (Q),
Zincite (Z), Mullite (M), Cristobalite (C), Hematite (H), Kaolinite
(K), Nepheline (N). |
|
Fig. 5 Pore size distribution of the fly ash based support. |
|
Fig. 6 (a) Example of the imported 2D images of the studied
sample of the ceramic filter material and (b) the voxelized sample
structure. |
|
Fig. 7 Example of detail of the processed area, ROI 50 × 50
pixels. |
|
Fig. 8 Image histogram of the brightness intensity distribution in ROI 50 × 50 pixels. |
|
Fig. 9 Noise filtration by linear averaging - ROI 50 × 50 pixels, (a) single, (b) triple. |
|
Fig. 10 Multiplication of the brightness after the three-fold linear averaging of the scanned image – ROI 50 × 50 pixels - (a) three times the
intensity of the brightness, (b) five times the intensity of the brightness. |
|
Fig. 11 Histogram of brightness intensity after noise filtration by triple linear averaging and multiplication of brightness intensity (a) three
times the intensity of brightness, (b) five times the intensity of brightness. |
|
Fig. 12 (a) The original X-ray-CT image of the studied ceramic material, (b) the image after the filtering of the noise by linear filtration, (c)
the same image after thresholding. |
|
Fig. 13 Vectorization of the surface pore structures of material created by the “marching cubes algorithm” (a) detail, (b) matrix 50 × 50 × 50
voxels. |
|
Fig. 14 Model of the pore surface structure after Laplace's smoothing (a) detail (b) matrix 50 × 50 × 50 voxels. |
|
Fig. 15 Model of the pore surface structure after the Decimation algorithm (a) detail (b) matrix 50 × 50 × 50 voxels. |
|
Fig. 16 The resulting model of pore structure created using the
“mesh feature” algorithm in Autodesk Inventor. |

|
Fig. 17 (a) Images of the geometric model of the overall microstructure of the sample, (b) material structure, (c) pore structure. Cube edge
length: 3 mm. |

|
Fig. 18 (a) typical crack in the ceramic material, (b) isolated model of the cavity formed in the grain. |
|
Fig. 19 (a) The 3D model of silica-alumina microsphere, (b) the original 2D X-ray-CT image, (c) distribution of cenospheres in selected
area. |
|
Fig. 20 Ceramic material model used for numerical simulation of flow (CFD) using the Navier Stokes equations (a) and lattice of the
Boltzmann method (b) |
|
Table 1 Chemical composition of materials used for support preparation. |

a
Loss of ignition |
The paper describes the process of creating a 3D model of
the studied material from 2D X-ray CT image data. In this study, a sample of a
newly prepared fly ash-based ceramic membrane support was examined to visualize
its internal structure. The technique of spatial reconstruction of a three
dimensional geometric model was made using the Paraview and DREAM.3D open
source software. For image data reconstruction the image contrast
adjusting algorithms, noise filtration by linear averaging, image thresholding
and image segmentation algorithms have been used. The spatial
reconstruction of the surface geometric model was performed using structural
vectorization, Laplacian smoothing and surface decimation techniques. The
surface model was then converted to a 3D model using the
construction software Autodesk Inventor. The created virtual CAD
model allows the isolation of individual objects with subsequent spatial
analyses and so provides useful information about studied sample. The
possibilities of using the 3D model for evaluation of total
porosity, discontinuities, failures and defects, spatial distribution
of specific components in the material as well as for simulation of liquids
flow were also outlined in the work.
In the summary, presented work provides operation instructions
for data processing starting with CT scanning of examined porous
ceramic material, through the mathematical analysis of 2D data and the creation
of a 3D model to the examination of specific properties of the created object.
The advantage is the visualization and spatial analysis of the internal
structure of the newly created membrane support and related
identification of weak spots and detection of various anomalies
and thus enabling timely modification of production processes
and/or input material. Using freely available software should contribute to
expanding CT techniques among wider range of users.
This work was done in connection with the Institute of
Clean Technologies for Mining and Utilization of Raw Materials
for Energy Use – sustainability programme.
Identification code: LO1406. Project is supported by the National Programme for
Sustainability I (2013-2020) financed by the state budget of the Czech Republic;
the Project MPO Trio – FV20270 “Development of composite
ceramic membranes based on recycled materials, including their application in
the field of industrial wastewater cleaning and recycling” project funded by
the state budget of the Czech Republic.
- 1. M.C. Almandoz, C.L. Pagliero, and N.A. Ochoa, J. Marchese, Ceram. Int. 41 (2015) 5621-5633.
-

- 2. F. Bouzerara, A. Harabi, S. Achour, and A. Larbot, J. Eur. Ceram. Soc. 26 (2006) 1663-1671.
-

- 3. M.M. Bazin, N. Ahmad, and Y. Nakamura, J. Asian. Ceram. Soc. 7[4] (2019) 417-425.
-

- 4. P. Wu, Y. Xu, Z. Huang, and J. Zhang, J. Ceram. Process. Res. 16[1] (2015) 102-106.
- 5. M. Samaei, S. Gato-Trinidad, and A. Altaee, Sep. Purif. Technol. 200 (2018) 198-220.
-

- 6. V. Gitis and G. Rothenberg, in “Ceramic membranes: New Opportunities and Practical Alpplications” (John Wiley and Sons, 2016)
- 7. S.K. Hubadillah, M.H.D. Othmman, T. Matsuura, A.F. Ismail, M.A. Rahman, Z. Harun, J. Jaafar, and M. Nomura, Ceram. Int. 44[5] (2018) 4538-4560.
-

- 8. S. Saja, A. Bouazizi, B. Achiou, M. Ouammou, A. Albizane, J. Bennazha, and S.A. Younssi, J. Environ. Chem. Eng. 6[1] (2018) 451-458.
-

- 9. J. Fang, G. Qin, W. Wei, and X. Zhao, Sep. Purif. Technol. 80 (2011) 585-591.
-

- 10. I. Jedidi, S. Saidi, S. Khemakhem, A. Larbot, N. Elloumi-Ammar, A. Fourati, A. Charfi, A.B. Salah, and R.B. Amar, J. Hazard. Mater. 172 (2009) 152-158.
-

- 11. Z. Harun, T.C. Ong, T. Matsuura, S.K. Hubadillah, M.H.D. Othman, and A. F. Ismail, Chem. Eng. Res. Des. 133 (2018) 111-125.
-

- 12. M. Arzani, H.R. Mahdavi, M. Sheikhi, T. Mohammadi, and O. Bakhtiari, Appl. Clay Sci. 161 (2018) 456-463.
-

- 13. B. Das, B. Chakrabarty, and P. Barkakati, Ceram. Int. 42[13] (2016) 14326-14333.
-

- 14. P. Iassonov, T. Gebrenegus, and M. Tuller, Water Resour. Res. 45 (2009) WO9415.
-

- 15. H. Singh, and A.M. Gokhale, Mater. Charact. 54[1] (2005) 21-29.
-

- 16. D. Samak, A. Fisher, and D. Rittel, CIRP ANN 56[1] (2007) 149-152.
-

- 17. O. Wirjadi, in Tech. Rep. Nr. 123, 2007, edited in Fraunhofer ITWM, Kaiserslautern, Germany.
- 18. T. Li, X. Lu, B Wang, Z. Wu, K. Li, D.J.L. Brett, and P.R. Shearing, J. Membr. Sci. 528 (2017) 24-33.
-

- 19. E. Gregorová, T. Uhlířová, W. Pabst, P. Diblíková, and I. Sedlářová, Ceram. Int. 44[11] (2018) 12315-12328.
-

- 20. H. Taud, R. Martinez-Angeles, J. F. Parrot, and L. Hernandez-Escobedo, J Petrol Sci Eng. 47[3-4] (2005) 209-217.
-

- 21. www.paraview.org
- 22. http://dream3d.bluequartz.net/
- 23. J. Davidovits, in 4th edition Geopolymer Chemistry and Application, November 2015, published by Institut Geo- polymemere, France.
- 24. M. Zyrkowski, R.C. Neto, L.F. Santos, and K. Witkovski, Fuel 174 (2016) 49-53.
-

 This Article
-
2020; 21(6): 712-724
Published on Dec 31, 2020
- 10.36410/jcpr.2020.21.6.712
- Received on Apr 20, 2020
- Revised on Jul 25, 2020
- Accepted on Aug 14, 2020
 Services
- Abstract
introduction
experimental
results and discussion
conclusion
- Acknowledgements
- References
- Full Text PDF
Shared
 Correspondence to
- Gembalová Lucie
-
nstitute of Clean Technologies of Extraction and Utilization of Energy Resources, Faculty of Mining and Geology VŠB-Technical University of Ostrava, 17.listopadu 2172/15, Ostrava – Poruba, 708 00 Czech Republic
Tel : +420 597 325 464 Fax: +420 596 918 589 - E-mail: lucie.gembalova@vsb.cz


 Copyright 2019 International Orgranization for Ceramic Processing. All rights reserved.