


- An automated longquan celadon glaze thickness measurement method based on optical coherence tomography
Yang Zhou*, Longjie Shi, Gang Ceng, Tiebing Liu, Yang Shi, Zhengwei Chen, Fenglin Wang and Yuefeng Ceng
School of Information and Electronic Engineering, Zhejiang University of Science and Technology, Hangzhou 310023, PR China
The thickness of glaze is one
of the important indicators in the quality evaluation of Longquan celadon. But
till now, there is no automatic and non-destructive method to measure it. In
order to satisfy this demand, an automated method has been proposed to measure
the glaze thickness based on optical coherence tomography (OCT) technique.
According to the morphological characteristics of celadon glaze in OCT image,
the proposed method locates the upper and lower boundaries of the glaze layer,
then the glaze thickness is automatically calculated after the axial resolution
calibration of the OCT images for different categories of Longquan celadon. In
the experiment, the glaze OCT images of 6 different categories of Longquan
celadon were applied in the glaze thickness estimation. By comparing with the
physical measuring result, this method is proved to be able to measure the
glaze thickness rapidly and non-destructively and the performance is enough to
meet the demand of the industrial application.
Keywords: Optical coherence tomography (OCT), Longquan celadon, Glaze, Thickness
Longquan celadon is the only Chinese ceramics listed to the world’s
intangible heritage, and its craftsmanship is a representative among Chinese
ceramics [1]. However, affected by composition of the ceramic body, temperature,
glaze and other factors during the firing process, the proportion of superior
grade products of Longquan celadon is relatively
small, which hinders the further development of the Longquan Celadon industry
[2]. Therefore, the non-destructive
inspection of the finished celadon products, especially the craftsmanship evaluation, is vital to the promotion of
Longquan celadon development.
The main phases in the ceramic body of the Longquan
celadon products are quartz (SO2), mullite, few glass phases and
pores, while the glaze consists of bubbles, glass phases and crystals. For
superior celadon products, there is no obvious boundary between the glaze and
the ceramic body, and the homogeneity of glaze layer is good [3, 4].
During the manufacture procedure, the factors that affect the quality of glaze
are complicated, including the characteristics of the ceramic body
and glaze themselves (body-glaze expansion coefficient,
glaze tensile strength, elastic modulus and etc.), tackiness of the body and
glaze (middle layer formation condition), thickness of glaze, cooling rate, and
etc. The thickness of glaze is a significant indicator to evaluate the quality
of the ceramics. For example, the glaze color saturation is stronger when the
glaze is thicker [5]. And the glaze thickness is also closely related to the
glaze stress. The precise control of the glaze thickness can keep the
glaze stress balance between tensile stress
and comprehensive stress, which is critical to prevent the glaze
cracking.6) Because the Longquan celadon products has high yield and
the glaze thickness of the individual products differs from each other, even
from the same batch, the destructive (physical) measurement of the celadon
glaze layer thickness does not meet the needs of the industrialization development.
However, there is still no related reports on the nondestructive measurement
methods so far.
Optical coherence tomography (OCT), which is an optical
image technique based on confocal microscope and Michelson interference theory,
has the advantages of high resolution and nondestructive examination [7]. At
present, the OCT imaging technique has been successfully applied to
ophthalmology [8-10], material analysis [11], archaeology [12], thickness
measurement of organizations and other fields [13]. In the meantime, OCT
imaging technique has also provided a new method for the nondestructive
analysis for structure of ceramics glaze [14]. Yang M et al. analyzed the size
and distribution of the bubbles in the Song dynasty ceramics glaze by OCT
technique and had proved that the radios of calcite and alumina in the glaze
can affect the texture and color of ceramics [15]. Yan X et al. have provided a
discrimination method of the ceramics glaze origin and kiln based on feature
difference in glaze OCT image [16, 17]. Zhong et al. have classified the glaze
layer according to OCT image texture feature combined with PCA method [18].
Those research achievements above have indicated the OCT imaging technique can
be possibly applied to the glaze layer planar reconstruction and observation of
the subsurface structure of Longquan celadon and be further used for the
measurement of the glaze thickness with the advantage of fast and easy
operation.
The possibility of revealing the internal structure characteristics
of Longquan celadon glaze and measuring the glaze
thickness non-destructively via OCT imaging technique has been studied. Also,
it has put forward an automated method to measure the glaze thickness through
OCT imaging technique realized by the automatic location of the upper and lower
boundaries of the glaze and calculation of the pixel distance between in the
OCT image.
Celadon
sample collection and image capture
Typical samples of Longquan celadon from Ge Kiln and Di
Kiln were collected. The sample from Ge Kiln was purchased in Longquan Lingqing
Ceramics Workshop and those from Di Kiln was purchased in Longquan
Kongshanxinyu Ceramics, both of which are local celadon manufacturing
enterprises. Both of the two categories of samples were teacups with lavender
gray glaze, plum green glaze and ivory glaze. All the OCT images were captured
by the OQ Labscope system manufactured by Lumedica and the scan area of celadon
glaze surface was randomly selected. The central wavelength, sensitivity, linear
scanning scope, axial resolution, lateral resolutions, imaging depth in the air
and image resolution of the system were 840 nm, 100 dB, 0-7 mm, 7 μm, 15 μm,
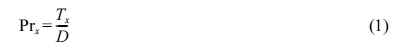
3.6 mm, 512*512 pixel, respectively. During the image capture, there was no
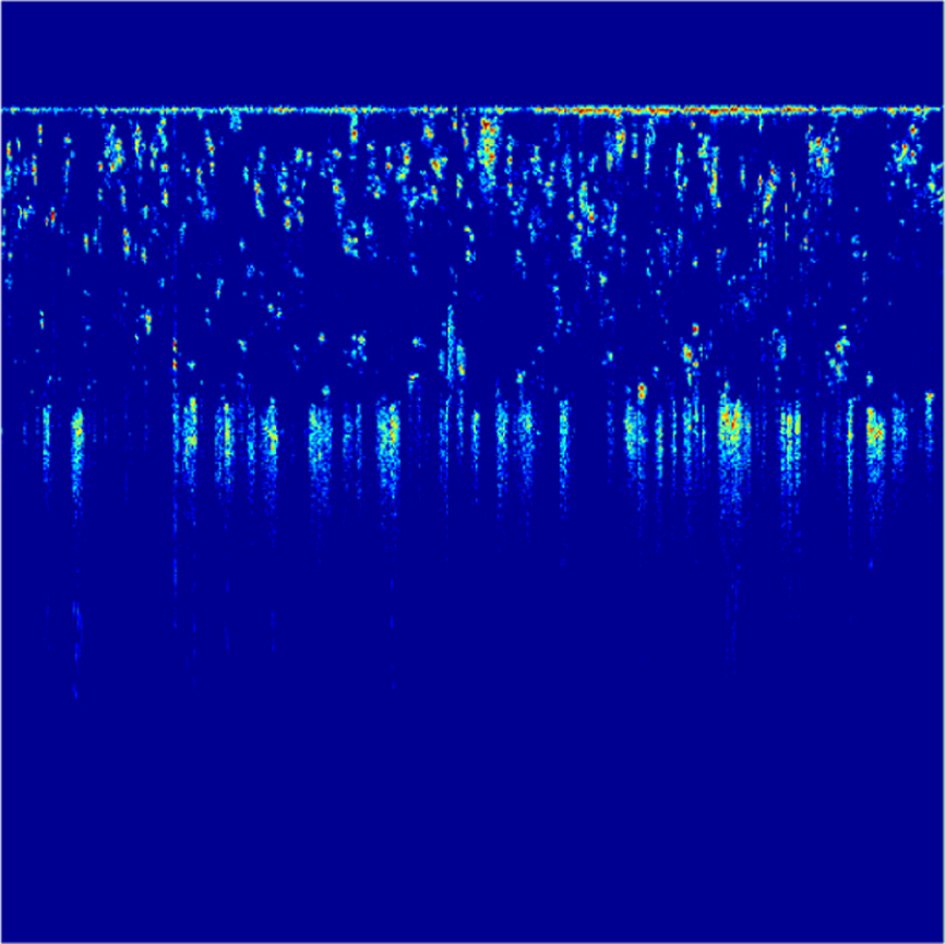
need to do the pretreatment and the Fig. 1 below shows the OCT images of 6
different categories of Longquan celadon glaze.
Boundaries
extraction and glaze thickness calculation
Through monitoring the ballistic and snaking photons of
the samples reflected from the scattering medium in samples and interfering
with the reference light, the OCT technique showed the luminance changes caused
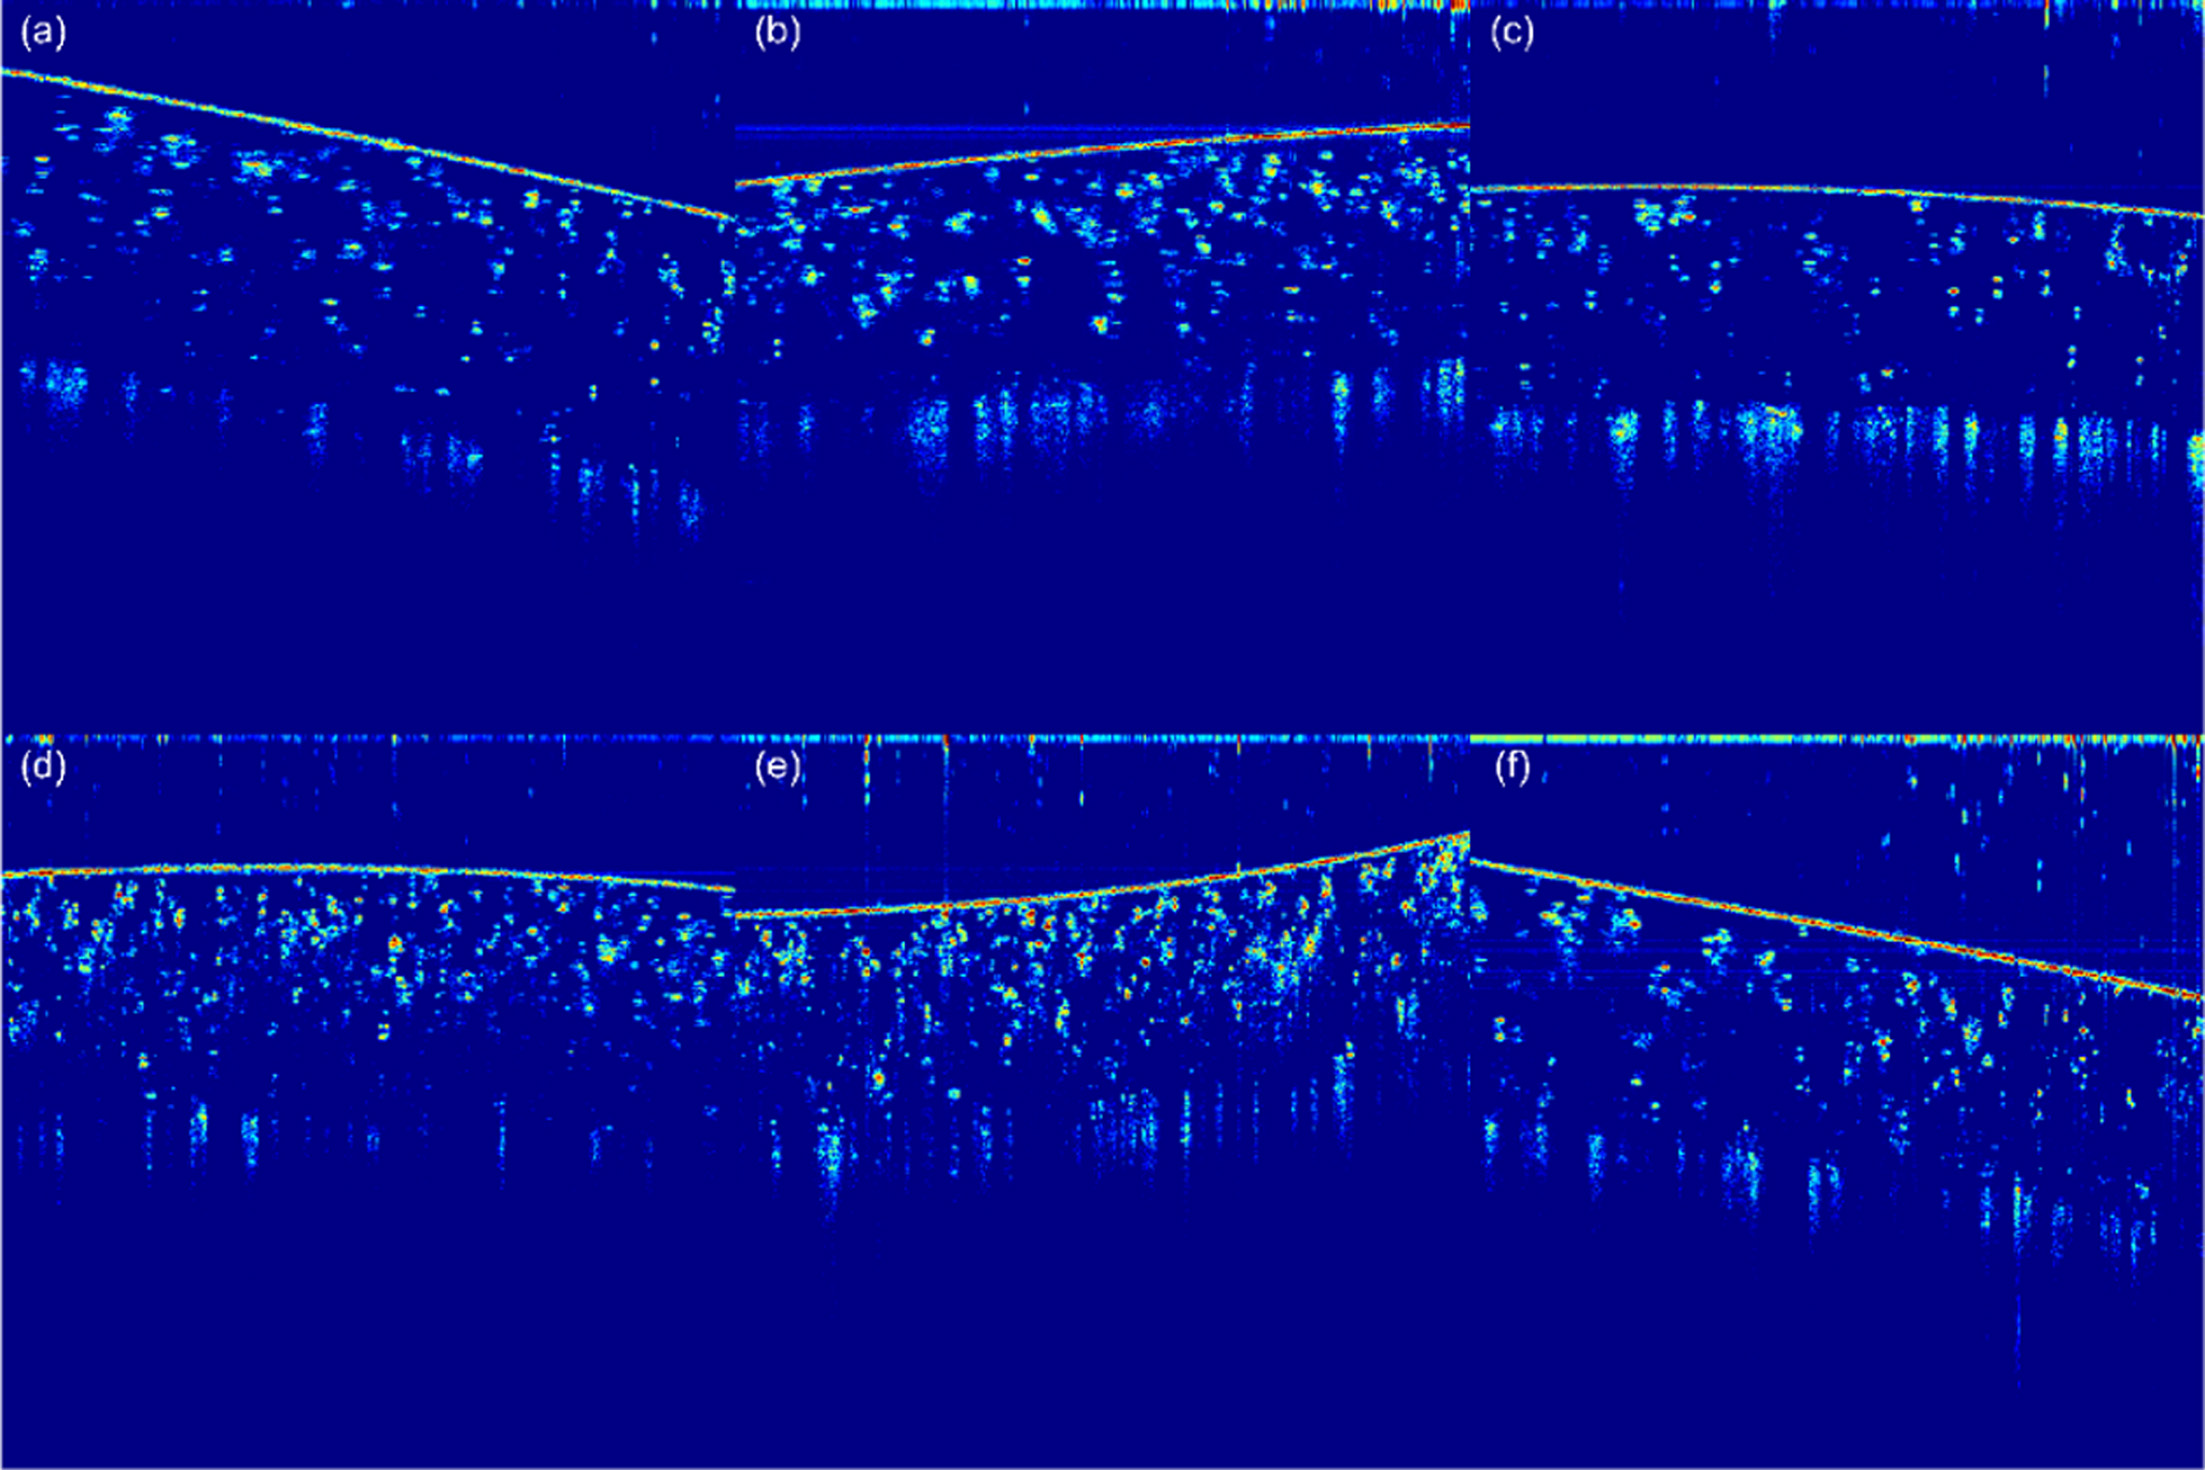
by different phases in the glaze as the change of the refractive index. Fig. 2
below is a typical cross-section view and its corresponding OCT image of
Longquan celadon glaze, and the area with higher grayscale value (ash
gray) in the OCT image was named scattering phase.
In the image capture procedure, the back scattering light
was intensified on the glaze upper boundary because of the refractive index
change on the boundary between the air and celadon glaze, therefore there was
an obvious bright scattering phase in the OCT image. The refractive indexes of
the crystal particles and bubbles were different, the light
intensity on the bubbles and crystal particles looked
different in glaze layer where large quantities of bubbles exited. In the OCT
image, a bubble was showed as two bright short parallel scattering phases and
the interior of the bubble was showed as blank space. Similarly, the crystal
particles were showed as clusters of
scattering phases with different
sizes and contrasts. In addition, scattering light got weaker in deeper depth, which was the reason why the
scattering phase close to the upper boundary was brighter than those far away
from the upper boundary. During the firing operations, the melted glaze
permeated into the body. As the refractive index of the glaze is different from
that of the body, the scattering of the whole penetrating area (the interface
between the glaze and the body) was strong, which was showed as bright ribbon
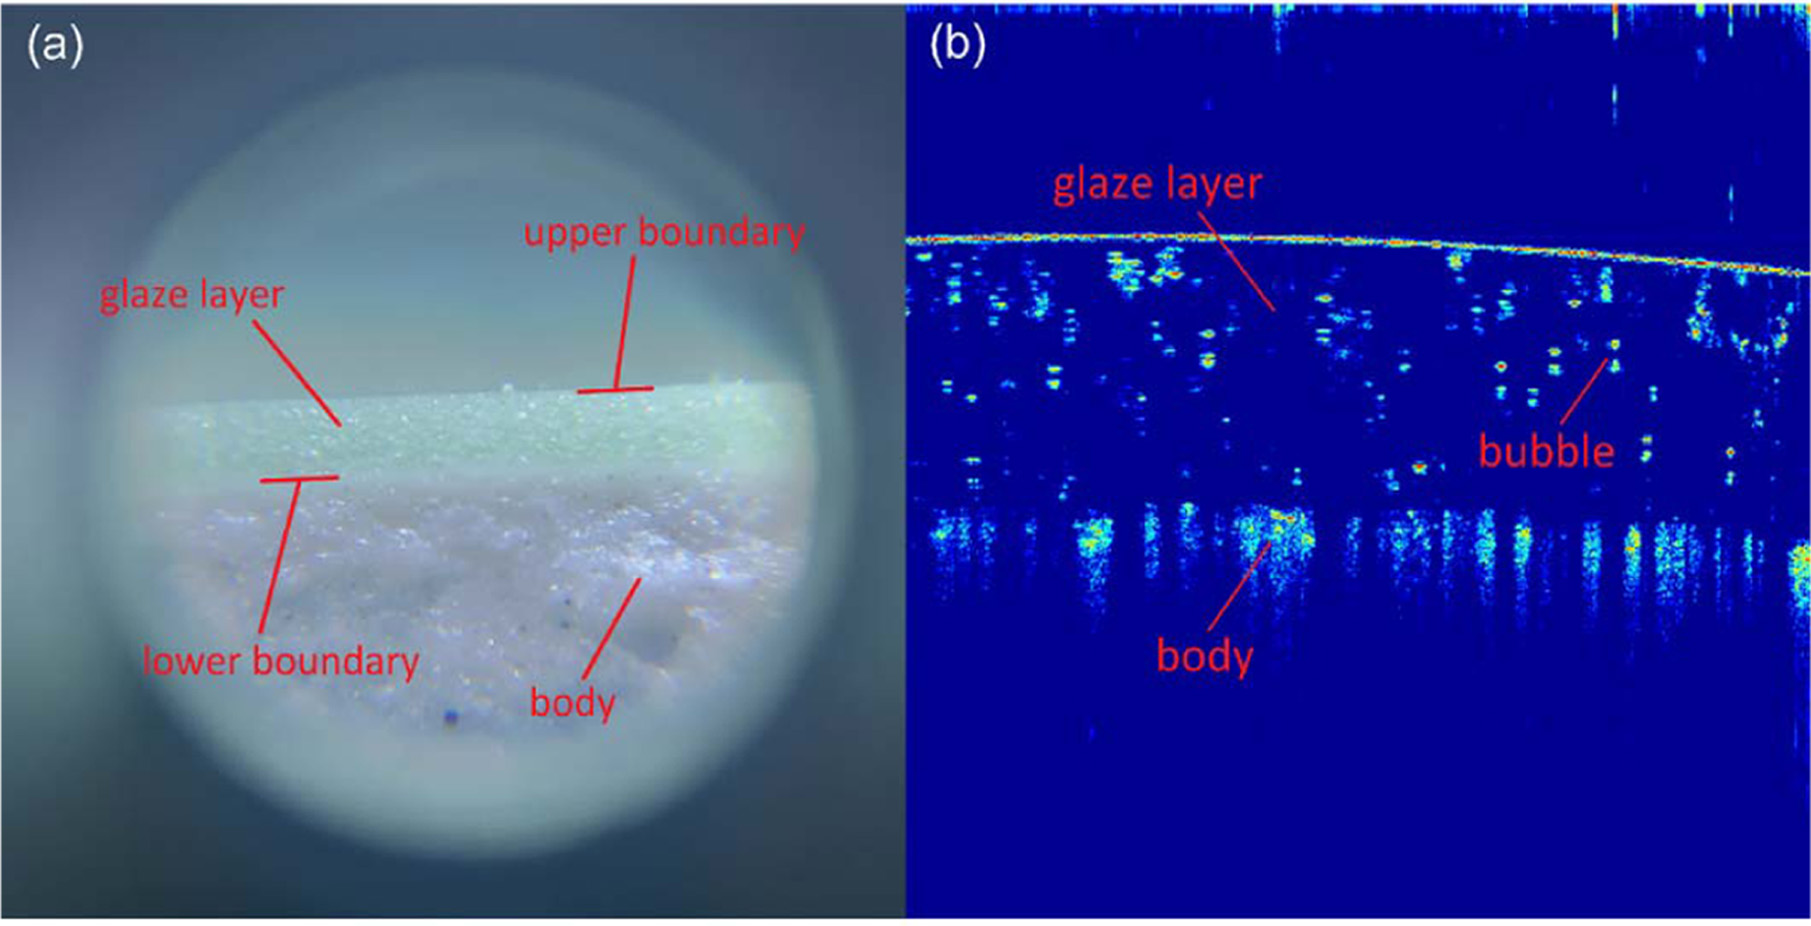
stretch defined as strip scattering phase in the OCT image. In our study, we
proposed the method to automated measure the glaze thickness by locating the
upper and lower boundaries according to the morphological characteristics of celadon glaze layer in the OCT image (Showed in
Fig. 3), and it was realized by a Matlab program (Mathworks, Massachusetts, USA).
Extraction of the glaze upper boundary
In the glaze OCT image, the scattering phases of upper
boundary, which were located at the top of all scattering phases and stretched
across the entire image were brighter than other phases. The following steps
have been taken to locate the upper boundary.
Step 1: To reduce the sparkle and conjugate noise in the
OCT image while locating the upper boundary of the glaze layer, median
filtering with [3*5] window was used according to pixel grayscale similarity.
Step 2: To increase the grayscale difference between the
glaze upper boundary and the background, OSTU was applied to determine the
threshold of the image binarization and the flitted image was changed to binary
image by canny operator [19]. The banalization reduced the image size and
enhanced the pixel grayscale contrast at the junction of the glaze upper
boundary and the air.
Step 3: The non-zero pixels belonging to the same 8
connected region in the binary image were gathered as one part of glaze. And in
order to smooth the profile of the glaze upper boundary and decrease influence
from non-glaze pixels, a disk structure element whose radius was 5 has been
adopted to do the closed operation. As a result, the grayscale values out of
the glaze were set to 0 (black).
Step 4: The top non-zero pixel of each column was
extracted as one point of the upper boundary.
Step 5: The Lagrange interpolation polynomial was used to
fit all the boundary points collected in the step 4. And the fitted boundary
was regarded as the final upper boundary of the glaze.
Background separation and image flattening
The air, background part of the image, was polluted by
speckle and conjugate noise. Based on the previous knowledge, clipping the
background from the image can directly clear the noise and reduce the noise
influence when locating the lower boundary. The grayscale of pixels above the
glaze upper boundary in the OCT image were set to zero as the background was
separated. Because the fitted glaze upper boundary was a smooth curve, in order
to reduce the error from the curvature when locating the lower boundary and
measuring the thickness, the highest point in the upper boundary was used as a
standard and every column was upward to make every boundary point at the same
horizontal. And then the row coordinate of the glaze upper
boundary was set as the location U for subsequent
calculation. Fig. 4 shows the image after background separation and image
flattening.
Extraction of the glaze lower boundary
According to the characteristics of glaze lower boundary
in the OCT image, the morphological manipulation was chosen to locate the
boundary. First, in order to highlight the grayscale difference
between the scattering phases and background in the image,
the CLAHE algorithm was adopted to strengthen the gray contrast of the flattened
image [20]. As every scattering phase occupied a very small space in the glaze,
there were short connections between them. Therefore the flat disk structure
element whose radius was 5 pixel was used for opening operation to increase the
contrast. As a result, the connections among the internal scattering phases in
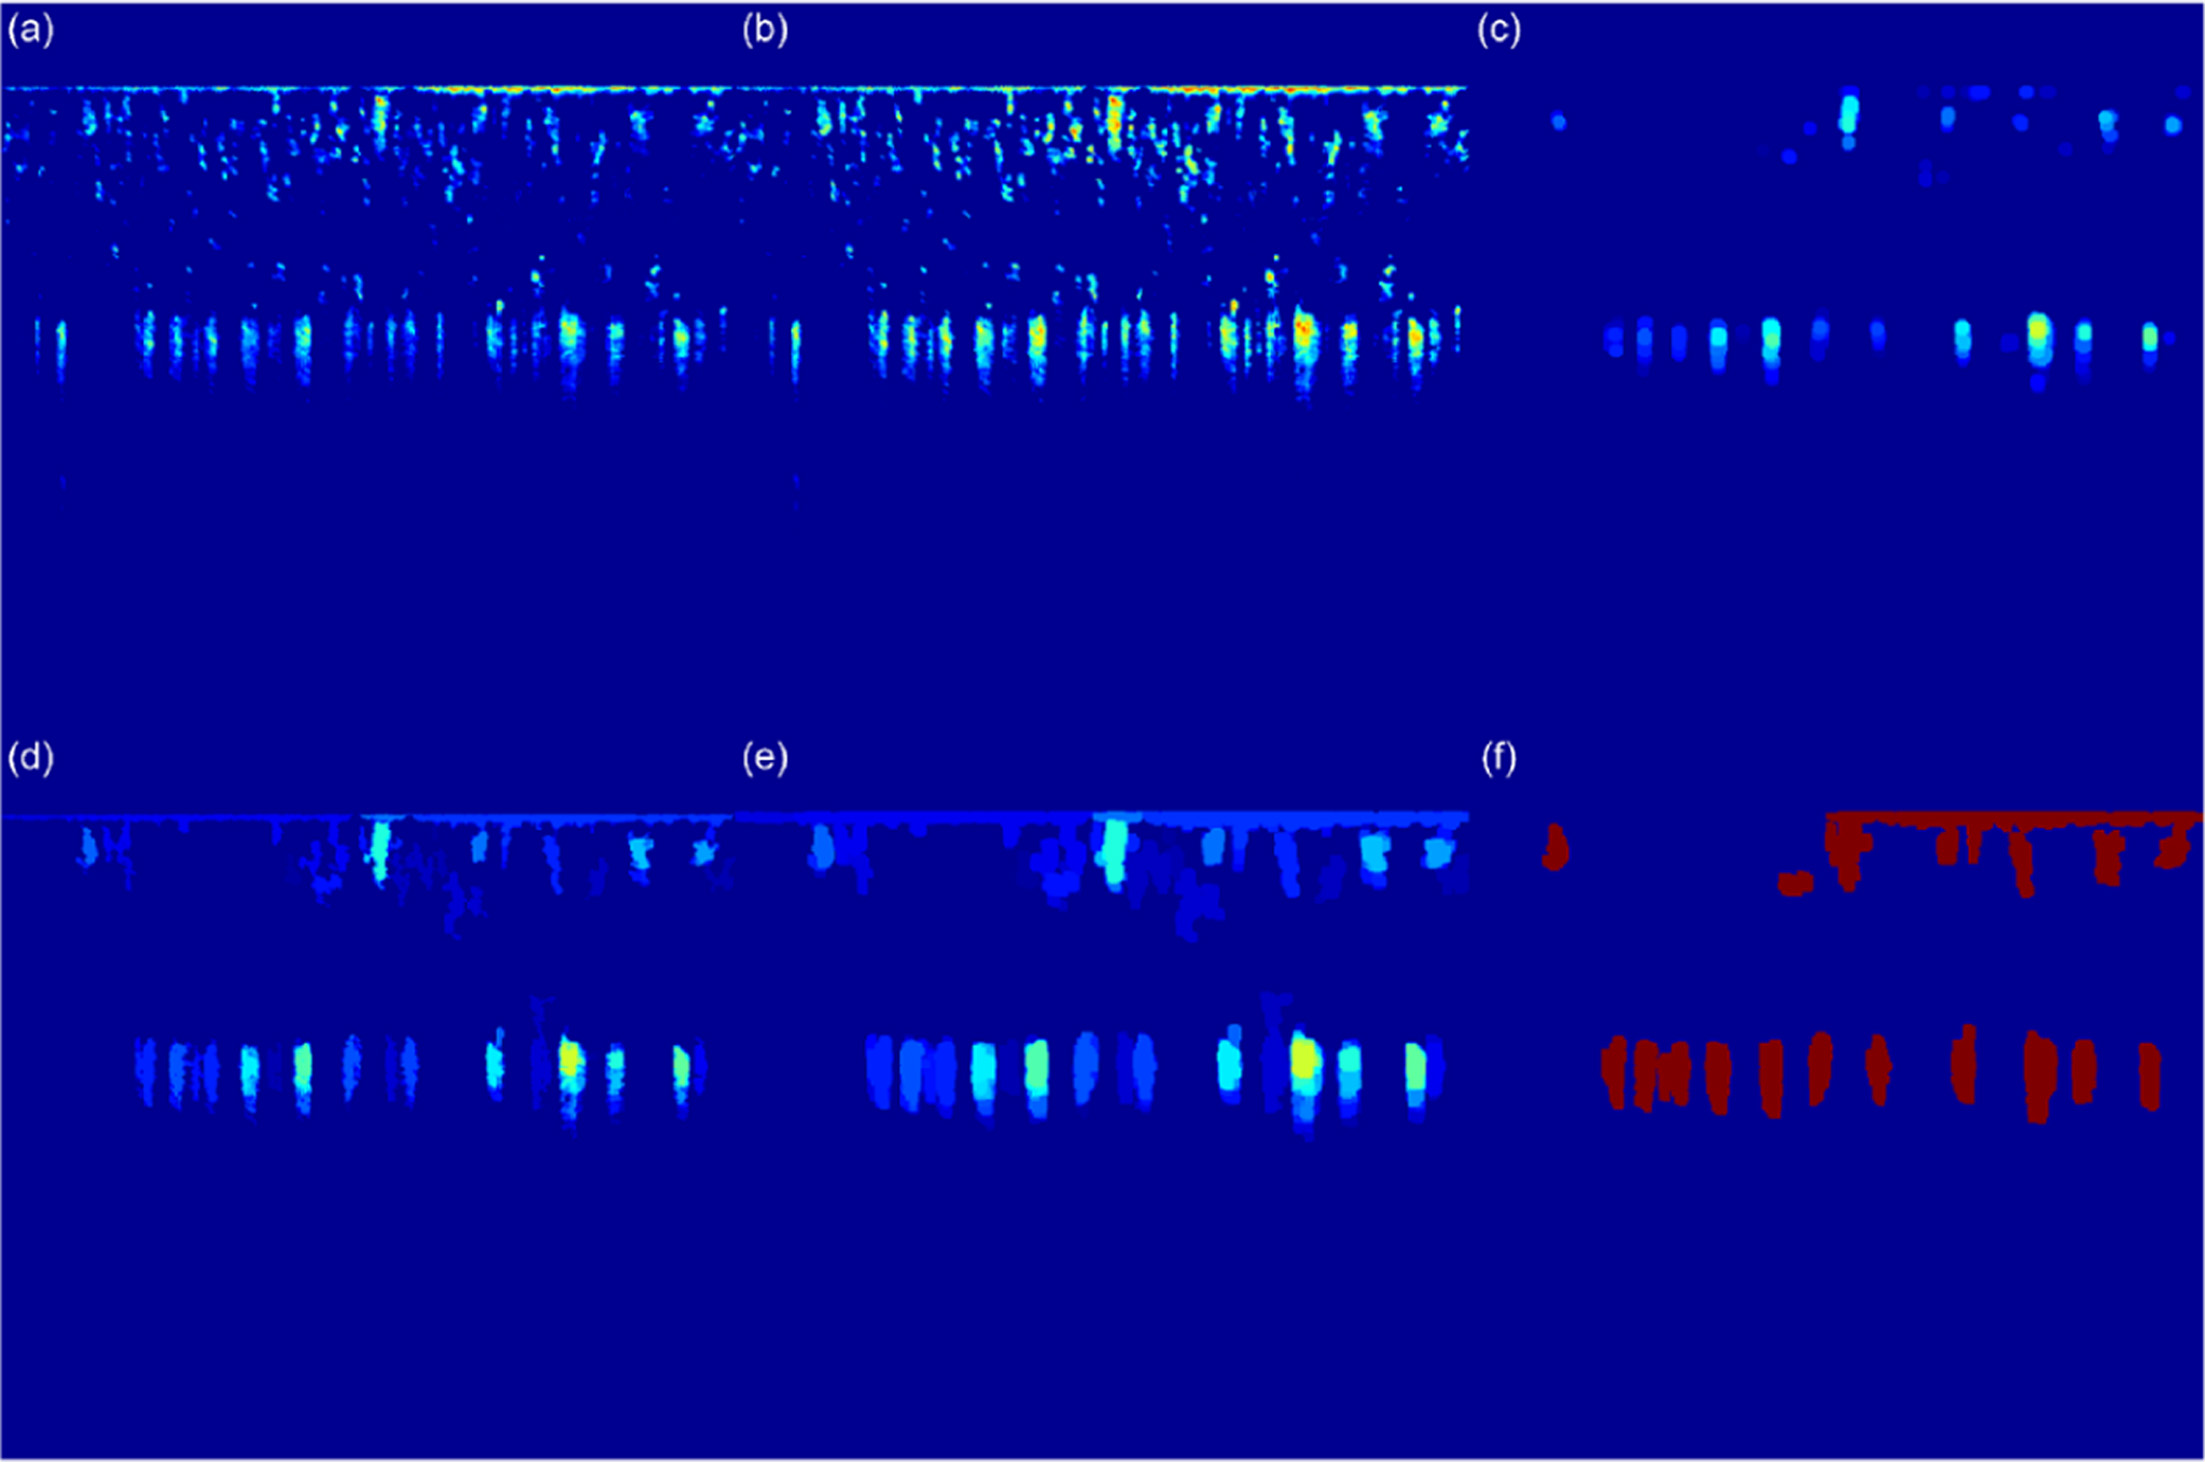
the glaze were disconnected. Secondly, in order to
highlight the location of the ceramic body, the flattened image was regarded as
the mask, then a con- tinuous dilation operation was conducted as
morphological image reconstruction after above opening operation
so that the contrast of the ceramic body and glaze was strengthened [21]. After
the steps above, there were holes left within the scattering phases of the
ceramic body part in the OCT image. Therefore, dilation operation based on flat
disk structure element whose radius was 3 pixel was used to refill the holes.
Finally, the OTSU method was applied to binarize the image. The lower part of
OCT image, shown as stripes, were regarded as the ceramic body, and the top of
every stripe target were the boundary between body and glaze, defined as glaze
lower boundary. Unfortunately, the stripe targets in the glaze part of OCT
image were discontinuous, so the mean value of upper boundary location
(ordinate) of the stripe targets was considered as the glaze lower boundary for
the glaze thickness measurement. The whole procedure of the glaze lower
boundary extraction is shown in Fig. 5.
Resolution
calibration and glaze thickness measurement
In the flattened OCT image, the product of the pixel
distance between the glaze upper and lower boundary and the axial resolution of
the pixel in the glaze was the thickness of the glaze. As the refractive index
of the air was different from that of the celadon glaze, the pixel axial
resolution in the air calibrated by the OCT system manufacturer was not
applicable to calculate the thickness. Therefore, the pixel axial resolution
needed to be re-calibrated for different type of celadon glaze. The calibration
process was followed: 1). Set the scanning parameters corresponding to the
parameters when capturing the samples; 2). Choose the typical celadon fragments
of every category sample and scan the cross-section of the fragments as
presented in Fig. 6; 3). The lateral resolution of OCT system was the same in
the air and the glaze, use the OCT self-equipped caliper to measure the celadon
glaze thickness Tx (distance between the 2 red lines shown in
Fig. 6; 4). For the same area, adjust the objective lens and vertical scan the
glaze of test sample in accordance with the scan mode of Fig. 3, 4, 5 to get
the glaze OCT image, then locate the upper and lower boundaries, and calculate
the pixel distance D between the upper and lower boundaries (D = Bavg - U, where Bavg
and U were respectively the mean coordinate of the glaze lower boundary
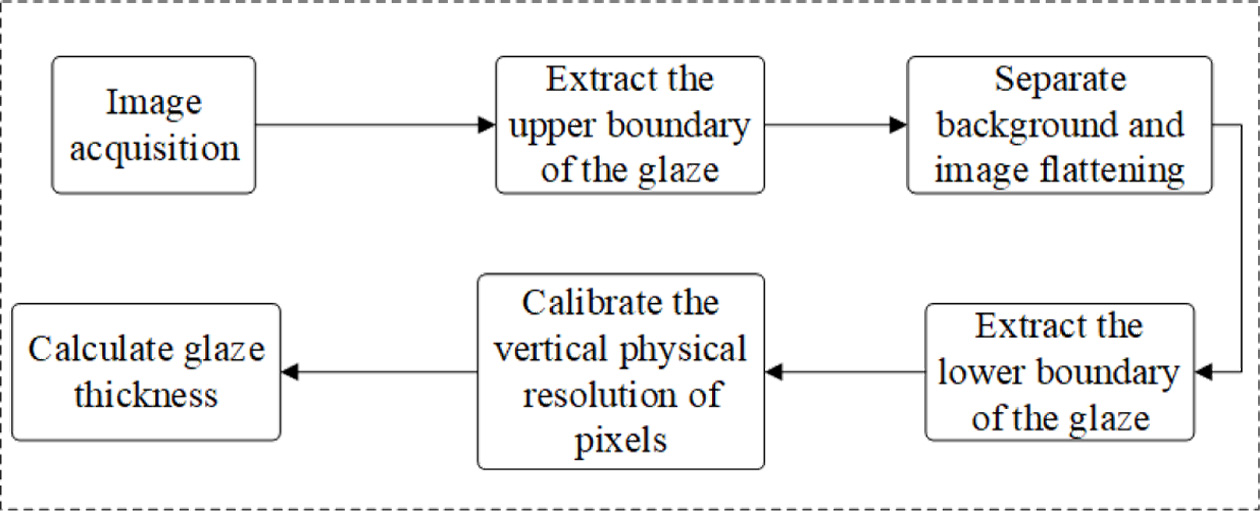
pixel points and the coordinate of the upper boundary); 5).Calculate the pixel
axial resolution (Prx) of the celadon glaze according to
formula (1);
For an unknown glaze thickness sample of Longquan celadon,
the glaze upper and lower boundaries were located, then the pixel distance D
between the boundaries was calculated (D = Bavg - U), finally the glaze
thickness was the product of the pixel distance D and the pixel axial
resolution (Prx) in the glaze.
|
Fig. 1 OCT images of 6 different categories of Longquan celadon teacup glaze. (a) Di Kiln lavender grey glaze; (b) Di Kiln plum green glaze; (c) Di Kiln ivory glaze; (d) Ge Kiln lavender grey glaze; (e) Ge Kiln plum green glaze; (f) Ge Kiln ivory glaze. |
|
Fig. 2 Typical Longquan celadon glaze. (a) Cross-Section view; (b) OCT image. |
|
Fig. 3 Flow chat of the method to measure the Longquan celadon glaze thickness. |
|
Fig. 4 Background separation and image flattening. |
|
Fig. 5 Extraction of celadon glaze lower boundary. (a) Image flattening; (b) Image contrast strengthening; (c) Morphological opening; (d) Image reconstruction; (e) Image dilation; (f) Image binarization. |

|
Fig. 6 Cross-sectional view of celadon glaze. |
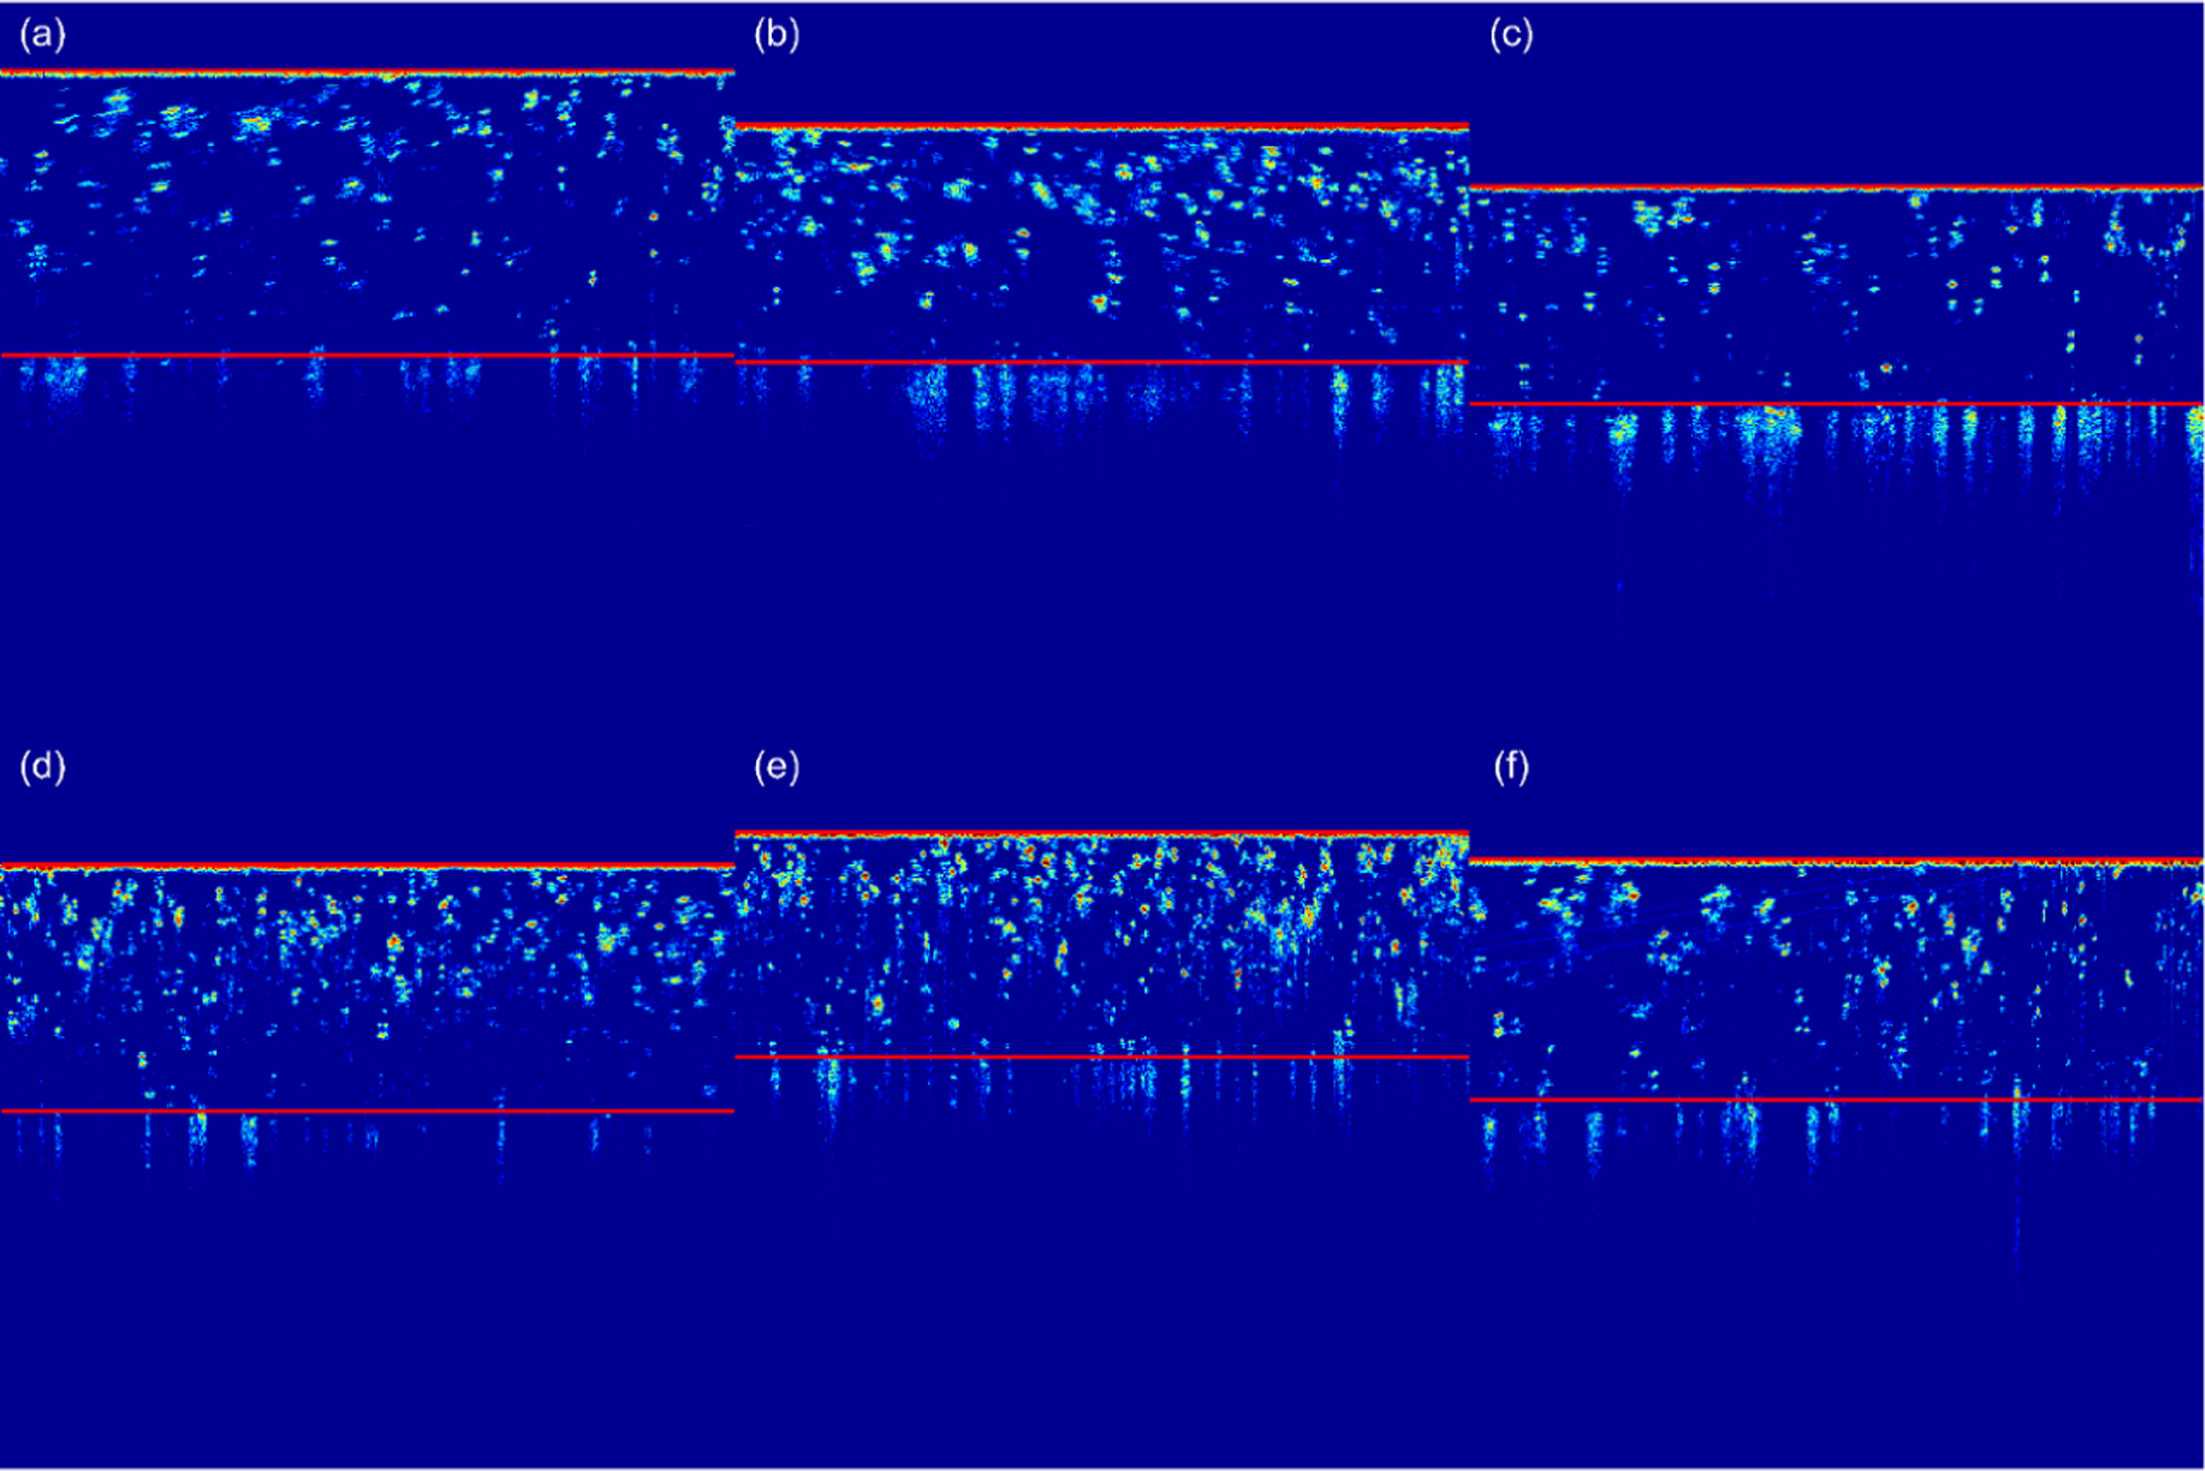
The glaze upper and lower boundaries of the typical
experiment samples of lavender gray glaze, plum green glaze and ivory glaze
respectively from Ge Kiln and Di Kiln are shown in Fig. 7. In Fig. 7, the glaze
upper boundary had higher grayscale than that of the background in the OCT
image and the fitted upper boundary well overlapped the real boundary which
proved that the proposed method can accurately locate the glaze upper boundary.
When flattening the glaze layer, taking the top point of the glaze upper
boundary for reference avoided the error while measuring the glaze thickness
caused by the curve profile. In addition, in the OCT images of all types of
celadon glaze, the scattering phases of the ceramic body were
discontinuous, which made it more difficult to locate the lower
boundary of the glaze layer. But from Fig. 7, it still can be seen that the
proposed method detected the lower boundary which was interfered by the bubbles
and with seriously weakened surface scattered light. Totally 60 samples of the
6 categories (10 for each category) have been tested, and the result showed
that the upper and lower boundaries of the glaze can be used for further
accurate measurement of the glaze thickness.
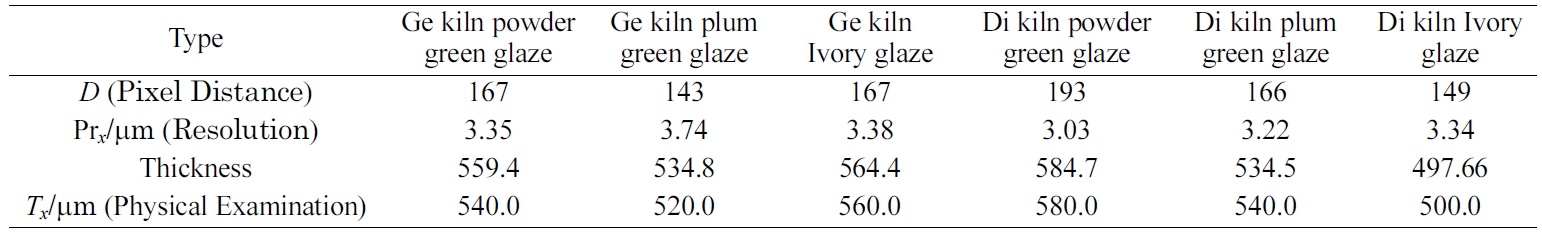
After calibrating the axial resolution, the glaze
thickness of 6 different categories of typical Longquan celadon
teacup samples have been measured. And in the meantime, the teacups have been
destructively cut and the glaze thickness has been measured artificially. For
reference, the comparison result is showed in Table 1. While calibrating the
resolution, accuracy of both OCT system and proposed method were at micrometer
level, which was suitable for industrial application. Compared
with the physical destruction method, the absolute error was less than 50
micrometer and the relative error was less than 5%, which has verified the
proposed method can be adopted for the rapid and nondestructive measurement of
the glaze thickness.
The glaze thickness of Longquan celadon is closely related
to its quality. On the one hand, the thickness of the celadon glaze affects the
color generation of the glaze, on the other hand, it also affects the glaze
stress between
the ceramic body and the glaze [22]. The precise control of the glaze thickness
can effectively prevent the glaze from cracking and improve the celadon quality. Overall, the glaze thickness of
high-quality celadon is almost uniform, more, by examining the uniformity of
the celadon glaze thickness, the quality of celadon can be judged.
The OCT imaging technique can present the internal organization structure
of the celadon glaze non-destructively at
micrometer resolution level. Before our study, the OCT imaging technique has
already been applied to the identification and classification of the different
categories of ceramics by discriminating the internal structure characteristics
of the glaze [23-26]. But on the measurement of the celadon glaze thickness,
there are few literature reports. In this study, the thickness of the celadon
glaze has been accurately measured, which has expanded the application of OCT
imaging technique to the celadon quality detection.
|
Fig. 7 Location of glaze upper and lower boundaries of the 6 categories of Longquan celadon. (a) Di Kiln lavender gray glaze; (b) Di Kiln plum green glaze; (c) Di Kiln ivory glaze; (d) Ge Kiln lavender gray glaze; (e) Ge Kiln plum green glaze; (f) Ge Kiln ivory glaze. |
|
Table 1 Thickness measurement results of different categories of longquan celadon glaze. |
In this study, an automated method for the Longquan
celadon glaze thickness measurement based on OCT technique has been put
forward. The upper boundary of the glaze was located by the characteristics of
its scattering phases and optimized by the Lagrange polynomial interpolation.
Then the image was treated by background separation and image flattening, and
the glaze lower boundary was located by the morphological
manipulation. After the calibration of the glaze axial resolution in
the OCT image, the rapid and non-destructive measurement
of glaze thickness was finished by calculation of the distance between the
upper and lower boundaries. The method proposed in this study fills the blank
of automated evaluation method for glaze thickness of the Longquan celadon
product, one of important quality indicators, and speeds up the
industrialization of the Longquan celadon.
In the experiment of this study, the approach was
essentially based on tomography of the glaze layer but not the
three-dimensional data. The glaze thickness will be more widely and accurately
measured if the algorithm utilizes the three-dimensional structure from OCT
technique. That is what we are planning to do in the future study.
This work was supported by National Key R&D Program of
China (No. 2018YFF0213400), the Inter-disciplinarily Pre-research Project of Zhejiang University of
Science and Technology (No. 2013JC07Y), and Public Basic
Research Program of Zhejiang Province (No. LGN19B050002).
- 1. X. Zhang, J. Zhang, Ceram. Stud. 33 (2018) 110-113.
-

- 2. Q. Shi and D.A. Hassan, JOM. 71 (2018) 1016-1023.
-
- 3. Q. Shi, J. Synth, Cryst. 46 (2017) 2527-2532.
-
- 4. H.B. Zghal, M. Medhioub, and T. Mhiri, J. Ceram. Process. Res. 13 (2012) 202-2091.
- 5. Q. Chen, Y. Zhou, and S. Zhou, J. Ceram. 47 (1996) 42-47.
-
- 6. Y. Gao and Q. Geng, Ceram. 5 (2003) 24-26.
-
- 7. D. Huang, E.A. Swanson, C.P. Lin, J.S. Schuman, W.G. Stinson, W. Chang, M.R. Hee, T. Flotte, K. Gregory, C.A. Puliafito, and J.G. Fujimoto, Sci. 254 (1991) 1178-1181.
- 8. O. Müller, M.G. Todorova, T. Schlote, and K. Mon, Augenh. 235 (2018) 436-444.
-
- 9. Y. Li, Y. Zhang, S. Chen, Vernon G, W.T. Wong, and H. Qian, Invest. Ophthalmol. Vis. Sci. 59 (2018) 1084-1094.
-
- 10. S. Philipp, W. Sebastian, K. Sophie, B. Hrvoje, S. Thomas, G. Bianca, D. Rene, S.E. Ursula, and L. Georg, IEEE Trans. Med. Imaging. 38 (2019) 1037-1047.
-
- 11. Y. Zhou, Y. Zhao, S. Kim, and A. Wax, Opt. Mater. Express. 8 (2018) 622-628.
-
- 12. S. Yang, R. Zhu, L. Mi, Y. Cao, and Q. Li, Acta Optica Sinica. 35 (2015) 147-152.
-
- 13. L.M. Heindl, W. Adler, and O. El-Malahi, J. Glaucoma. 27 (2018) 1086-1093.
-
- 14. J. Li, B. He, W. Liu, X. Yan, S. Li, and Q. Li, Spectrosc. Spect. Anal. 36 (2016) 1500-1507.
-
- 15. M. Yang, A.M. Winkler, J. Klein, and J.K. Bartong, Stud. Conserv. 57 (2012) 67-75.
-
- 16. X. Yan, J. Dong, Q. Li, G. Musen, and Y. Hu, CHIN. J. Lasers. 41 (2014) 195-200.
-
- 17. Xin Y, J.Q. Dong, Q.H. Li, M.S. Guo, and Y.Q. Hu, Spectrosc. Spect. Anal. 35 (2015) 2275-2280.
- 18. D.X. Zhong, M.S. Guo, Y.Q. Hu, S. Liu, J.Q. Dong, and Q.H. Li, CHIN. J. Lasers. 45 (2018) 140-151.
-
- 19. N. Otsu, IEEE Trans. Syst. Man. Cybern. SMC-9 (1979) 62-66.
-
- 20. N.M. Sasi and V.K. Jayasree, Eng. 5 (2013) 326-331.
-
- 21. L. Vincent, IEEE Trans. Image Process. 2 (1993) 176-201.
-
- 22. X.H. Xu, Z.G. Wang, J.F. Wu, G.H. Leng, and D.K. Deng, J. Wuhan. Univ. Technol. 31 (2009) 55-58.
-
- 23. A.G. Turk, M. Sabuncu, and M. Ulusoy, Braz. Oral. Res. 32 (2018) e5.
-
- 24. W. Li, J. Liu, and Z. Zhang, J. Biomed. Opt. 23 (2018) 1-5.
-
- 25. C. Lin, W. Kuo, Y. Chang, J. Yu, and Y. Lin, Dent. Mater. 30 (2014) 910-916.
-
- 26. R. Su, M. Kirillin, P. Ekberg, A. Roos, E. Sergeeva, and L. Mattsson, Opt. Express. 20 (2012) 4603-4618.
-
 This Article
-
2020; 21(3): 331-337
Published on Jun 30, 2020
- 10.36410/jcpr.2020.21.3.331
- Received on Dec 12, 2019
- Revised on Mar 20, 2020
- Accepted on Mar 24, 2020
Services
- Abstract
introduction
materials and methods
results and discussion
conclusion
- Acknowledgements
- References
- Full Text PDF
Shared
Correspondence to
- Yang Zhou
-
School of Information and Electronic Engineering, Zhejiang University of Science and Technology, Hangzhou 310023, PR China
Tel : +86 13868077650
Fax: +86 57185070300 - E-mail: zybuaa@163.com
Clean-Energy Research Institute(CRI), Hanyang University, 222, Wangsimni-ro, Seongdong-gu, Seoul, 04763, Korea
E-mail: jcpr@hanyang.ac.kr