- Thermoelectric properties of FeVSb1-xTex half-heusler alloys fabricated via mechanical alloying process
Rahidul Hasan and Soon-Chul Ur*
Department of Materials Science and Engineering/ReSEM, Korea National University of Transportation, 50 Daehak-ro, Chungju, Chungbuk 27469, Korea
FeVSb1-xTex (0.02 ≤ x ≤ 0.10)
half-Heusler alloys were fabricated by mechanical alloying process and
subsequent vacuum hot pressing. Near single half-Heusler phases are formed in
vacuum hot pressed samples but a second phase of FeSb2 couldn’t be
avoided. After doping, the lattice thermal conductivity in the system was shown
to decrease with increasing Te concentration and with increasing temperature.
The lowest thermal conductivity was achieved for FeVSb0.94Te0.06
sample at about 657 K. This considerable reduction of thermal
conductivities is attributed to the increased phonon scattering enhanced by
defect structure, which is formed by doping of Te at Sb site. The phonon
scattering might also increase at grain boundaries due to the formation of fine
grain structure. The Seebeck coefficient increased considerably as well,
consequently optimizing the thermoelectric figure of merit to a peak value of
~0.24 for FeVSb0.94Te0.06. Thermoelectric properties of
various Te concentrations were investigated in the temperature range of around
300~973 K.
Keywords: Thermoelectric, Thermal conductivity, Seebeck coefficient, Thermolectric figure of merit
Fossil fuel, the main source of energy today, is finishing
up very quickly. Thus, the energy scientists are giving priority to alternative
energy sources before the fossil fuels deposit run out. Moreover, fossil fuels
are spreading various greenhouse gases, which are the main cause of global
warming. A sustainable supply of clean energy is now in demand for
future energy solution. It is noted that, a lot of energy
is wasted in the form of heat during energy utilization process. Thermoelectric
(TE) power generators could be a possible solution because this can transform
the waste heat into useful electrical energy [1-3]. The
efficiency of a thermoelectric material is calculated by the
dimensionless figure of merit, ZT = S2sT/(kl + ke),
where S is the Seebeck coefficient, σ is the
electrical conductivity, T is the temperature, kl is the
lattice thermal conductivity, and ke is the thermal
conductivity due to electrons.
FeVSb half-Heusler (HH) materials are getting considerable
interest as potential TE materials due to its high power of conversion
efficiency and low cost of the elements [4]. In recent times, Fu et al. [5] and
Zou et al. [6] reported that FeVSb HH matrix can exhibit both n- and p-type TE
properties. Their studies suggest that large power factors could be achieved,
though high thermal conductivity limits the TE figure of merit. They proposed
that one of the effective ways to get high TE efficiency would be
nanostructuring. Nano-structuring produced ZT > 1.2 for n-type
MNiSn1-xSbx [7-9] and ZT = 0.9~1.0 for p-type
MCoSb1-xSnx [10, 11], where M = Ti, Zr and Hf.
TE figure of merit also can be upgraded by isoelectronic alloying, which is
capable of initiating phonon scattering [12]. There is strong evidence which
shows that increasing phonon scattering lowers the thermal conductivity
considerably [13, 14]. Solubility limits of the forming systems can also
be a factor which may bring ‘natural’ nanostructuring into the
crystal system. This nanostructuring is also capable of lowering the thermal
conductivity [9, 11]. TE efficiency can also be optimized by chemical
substitution, which may further improve the power factor
of the material system. Doping with electron donating or accepting elements
might help to optimize the carrier concentration [15].
Generally, doping establishes point defects in the host matrix,
which is innate in any material system. Doping elements act here as an exchange
corner between the distant reservoir and the host matrix
which could minimize the formation energy of
defect into the matrix by controlling the doping limits.
Mechanical alloying process is a well-known high energy
milling technique that can produce ultrafine microstructures [16]. It has
advantages over other traditional processes such as casting and forging [17,
18]. It may help to produce alloys which are difficult to produce
applying conventional metallurgical techniques. MA produces
fine-grained particles which improves the TE conversion efficiency by the
reduction of lattice thermal conductivity [19]. Fine-grained particles also
help to lower the diffusion path to enhance phase transformation
and homogenization. The high temperature process
such as arc-melting and levitation-melting were avoided to get rid of
evaporation of high vapor pressure elements (i.e., Sb, Sn) during processing.
In this study, TE performance of Te-doped FeVSb HH alloys
were described as a function of temperature at around 300~973 K. A group of
FeVSb1-xTex (0.02 £
x £ 0.10)
HH materials was synthesized by mechanical alloying (MA)
process followed by vacuum hot pressing (VHP). TE
properties were examined in the forms of Seebeck coefficient, electrical conductivity
and thermal conductivity. Transport properties were also
investigated in terms of Hall mobility, Hall coefficient and
carrier concentration.
For the synthesis of FeVSb1-xTex
(0.02 £ x £ 0.10) HH alloys, elemental powder
mixtures of Fe (99.9%, 63 µm), V (99.9%, 75 µm), Te (99.9%, 53 µm)
and Sb (99.9%, 45 µm) were used. A zirconia vial was used to carry out the
MA process using a high-energy vibrator mill (KMTech TMM 70, Korea) for 16 h.
The milling speed was kept constant at 1,080 rpm in this
experiment. 5 mm zirconia balls were used in this process, keeping
the ball-to-powder mixture ratio at 10꞉1. Consolidation of the powders was done
in VHP for 2 h under the pressure and temperature of 80 MPa and 1,073 K. A 10
mm graphite die was used in VHP for consolidation of powders.
Contamination during handling and processing of samples
throughout the process was avoided using Ar atmosphere.
A particle size analyzer (PSA) (Horriba LA-950, Japan) was
utilized to measure the particle size. X-ray diffraction
(XRD; Bruker AXS Advance D-8, Germany) of the MAed
and VHPed samples were carried out using Cu (Kα)
radiation. The microstructure was investigated using a scanning electron
microscopy (SEM) (FEI Quanta-400, Netherland). The Seebeck coefficient and
electrical conductivity were measured using ZEM3 (Ulvac-Riko, Japan) by 4-probe
method. 3×3×10 mm3 VHPed samples were used for the Seebeck
coefficient and electrical conductivity measurements and 10Φ × 1 mm
samples were used for thermal conductivity measurement.
Thermal diffusivity was captured using TC-9000H
(Ulvac-Riko, Japan) by a laser flash method. Density calculation was
done by the Archimedes principle. The Van
der Pauw method (modified Keithley
7065, USA) was applied to measure Hall measurement.
As-MAed powders are shown to be near spherical shape as in
typical MA process, and approximated particle sizes are of less than 10 µm as
shown in Fig. 1. Average particle sizes were measured using PSA are 7.0 µm, 6.2
µm, 5.9 µm, 5.3 µm and 5.2 µm for doping concentration,
x = 0.02~0.10, respectively. Particle size seems to
decrease with increasing doping concentration. The
collision of balls to the powder mixture might introduce lattice distortions
which could limit the particle size [20].
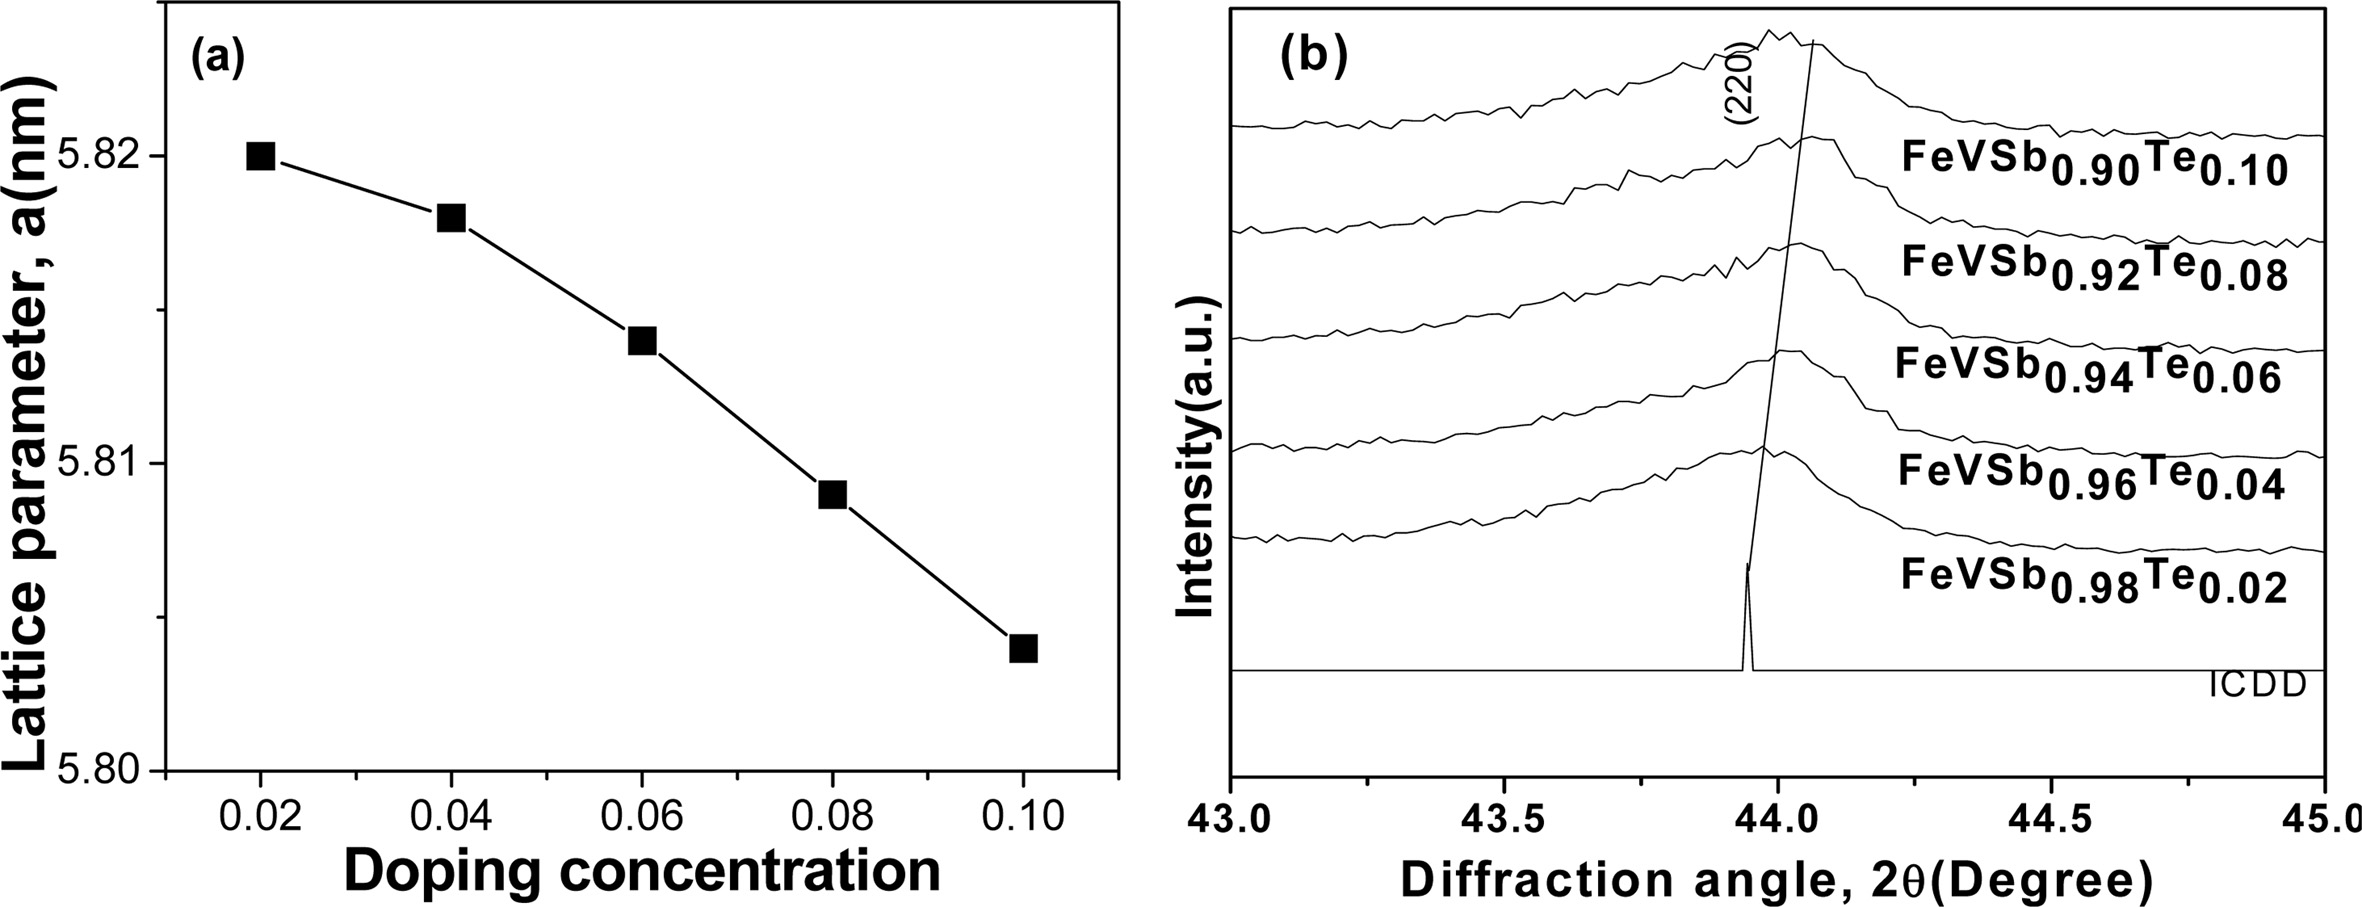
The lattice parameter decreased with increasing doping
elements according to Vegard’s law, which stated that lattice parameter varies
linearly with the atomic radii of the doping elements [21], as shown in Fig.
2(a). As the atomic size of the dopant decreased, the size of the lattice
also decreased. This decrease in lattice parameter might shift
the diffraction peak to the longer diffraction angle, which is represented by
(220) peak in Fig. 2(b). It is perhaps due to the replacement of larger Sb (atomic
radius = 1.45 Å) by smaller Te (atomic radius = 1.35 Å) atom shifts
the peak to the longer diffraction angle [22].
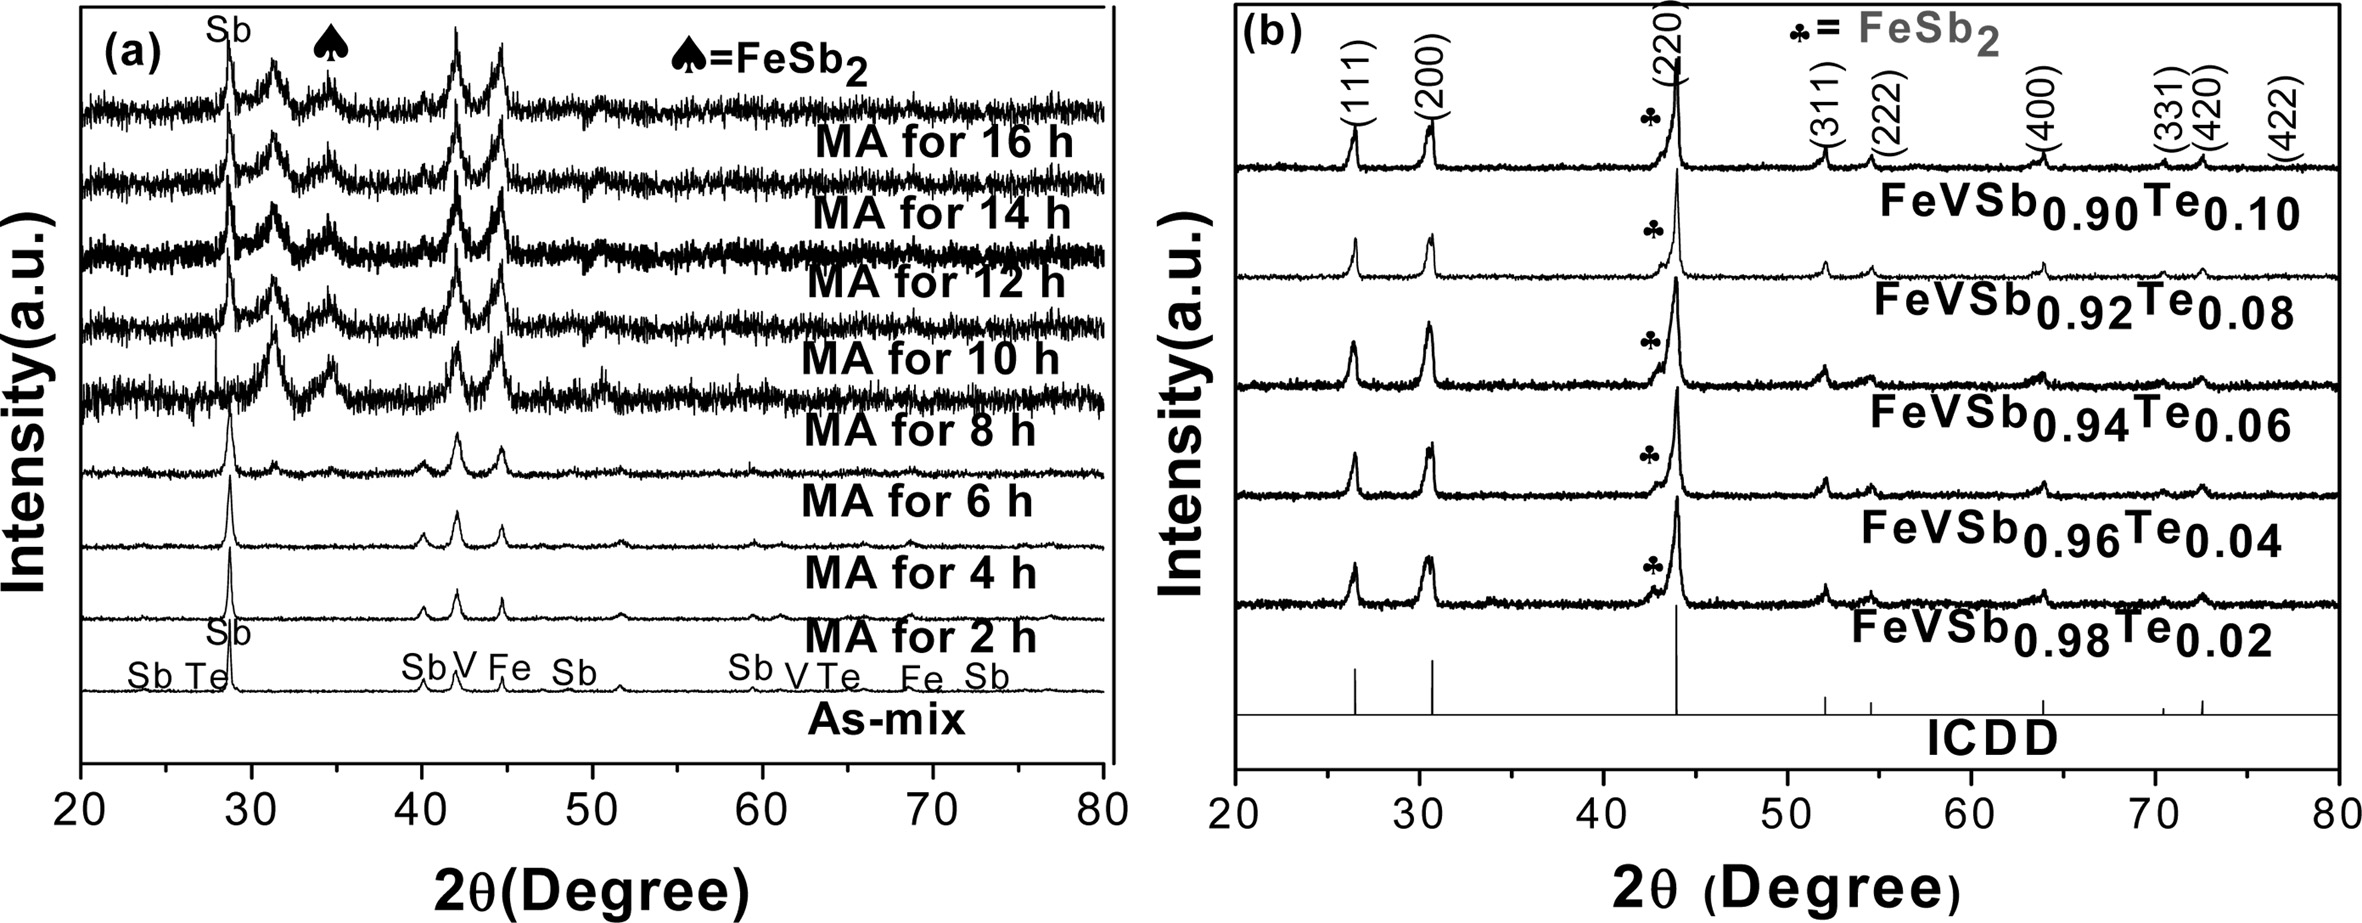
XRD patterns of the as-MAed powders are plotted in Fig.
3(a). The XRD patterns indicated that substitution of Sb by Te took place
slowly in FeVSb1-xTex and the HH phase formation
progressed during milling. Second phases of FeSb2and elemental Sb
were formed in the as-milled powder. The elemental peak of Sb is
completely disappeared but a trace of FeSb2 is still
remained after VHP, which is shown by Fig. 3(b). All the VHPed samples
contained HH phases as a dominant phase.
Fig. 4. shows the SEM images of the VHPed samples.
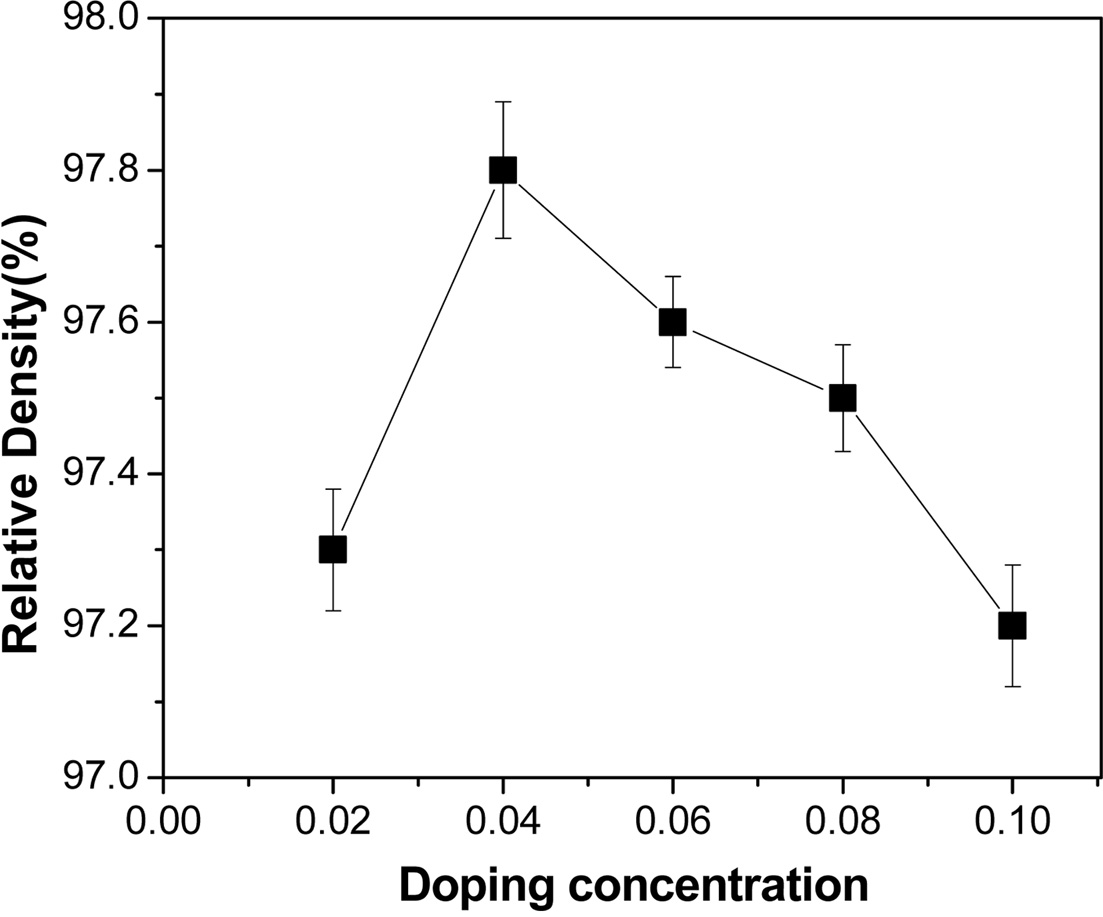
Relative density of the VHPed samples is found to be around 98% (Fig. 5.). The
grains seem to be densely packed, which could be induced from the relatively
high density of VHPed samples. The grain size of the sample measured was found
to be less than 10 µm.
Te is a low melting point element (meltingpoint-723 K,
boiling point-1261 K). It could be sublimated during VHP process over the melting point
temperature. However, sublimation was not
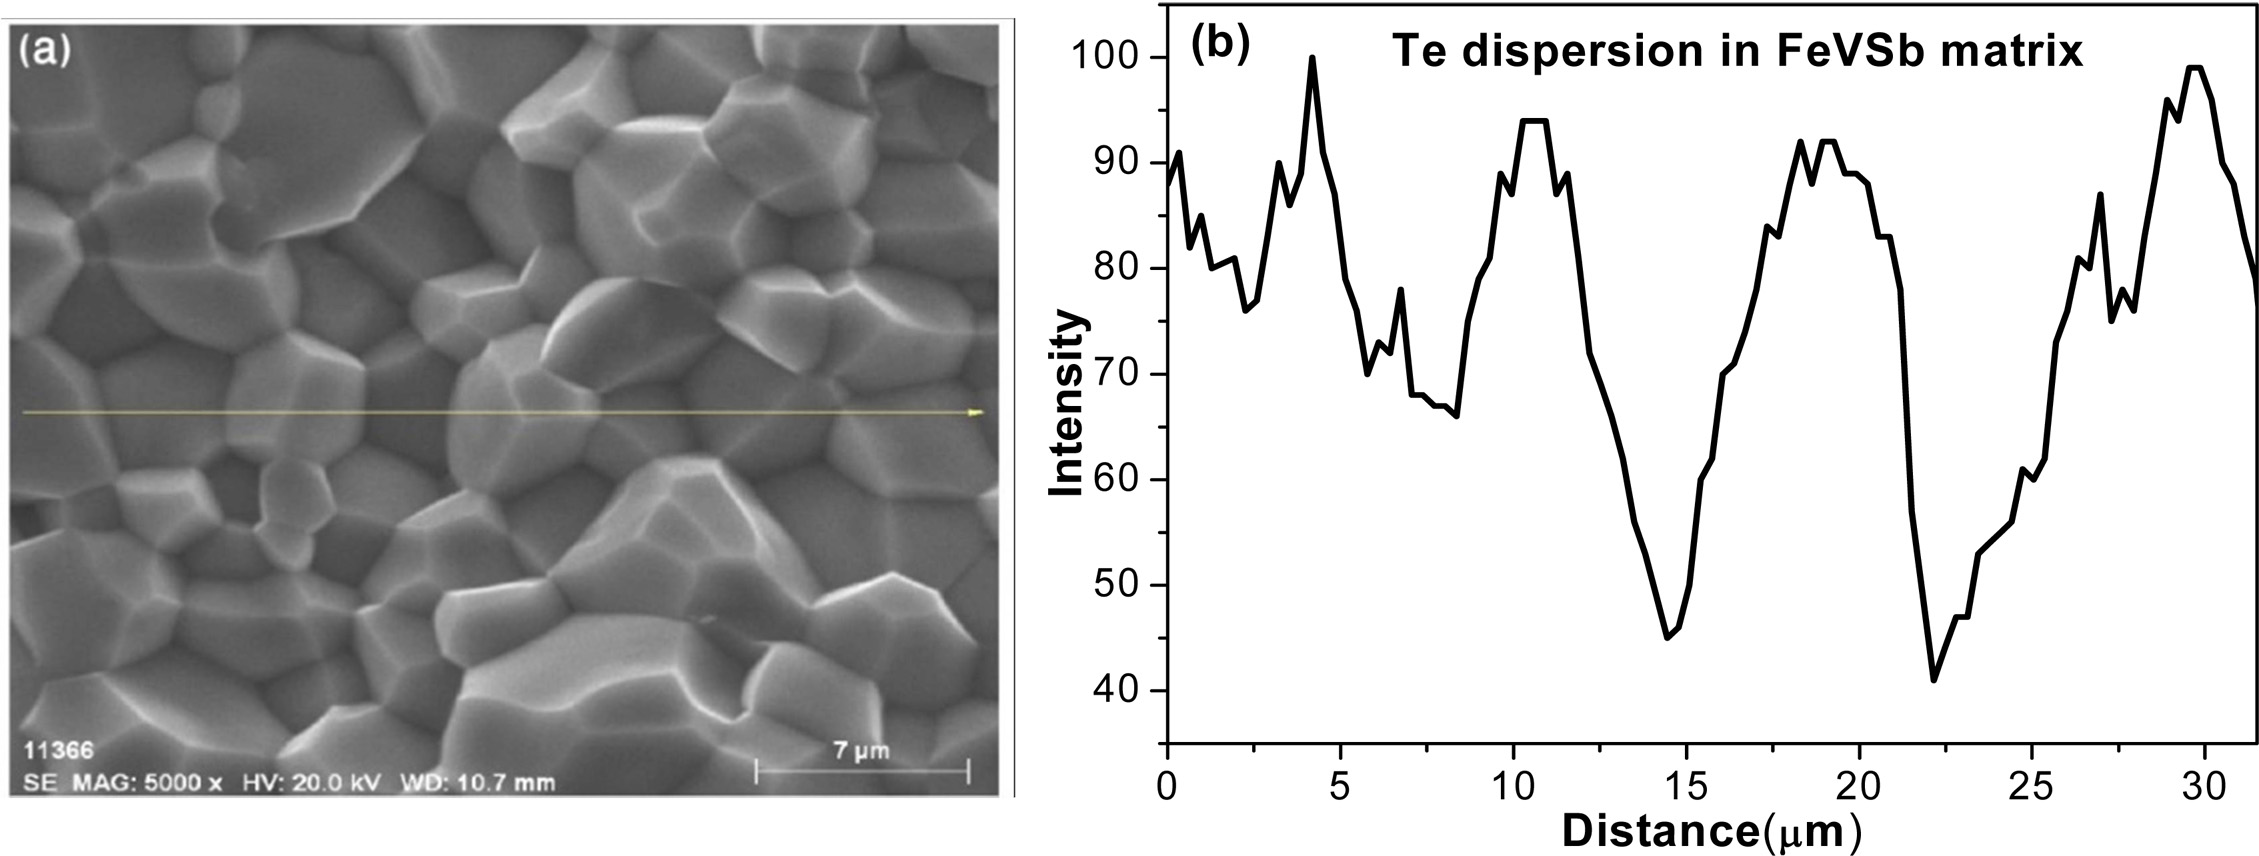
much in this measurement. EDS line
mapping was performed to find out the traces of Te after VHP. The EDS line
mapping of the sample showed that Te
was homogeneously dispersed throughout
the HH matrix (Fig. 6).
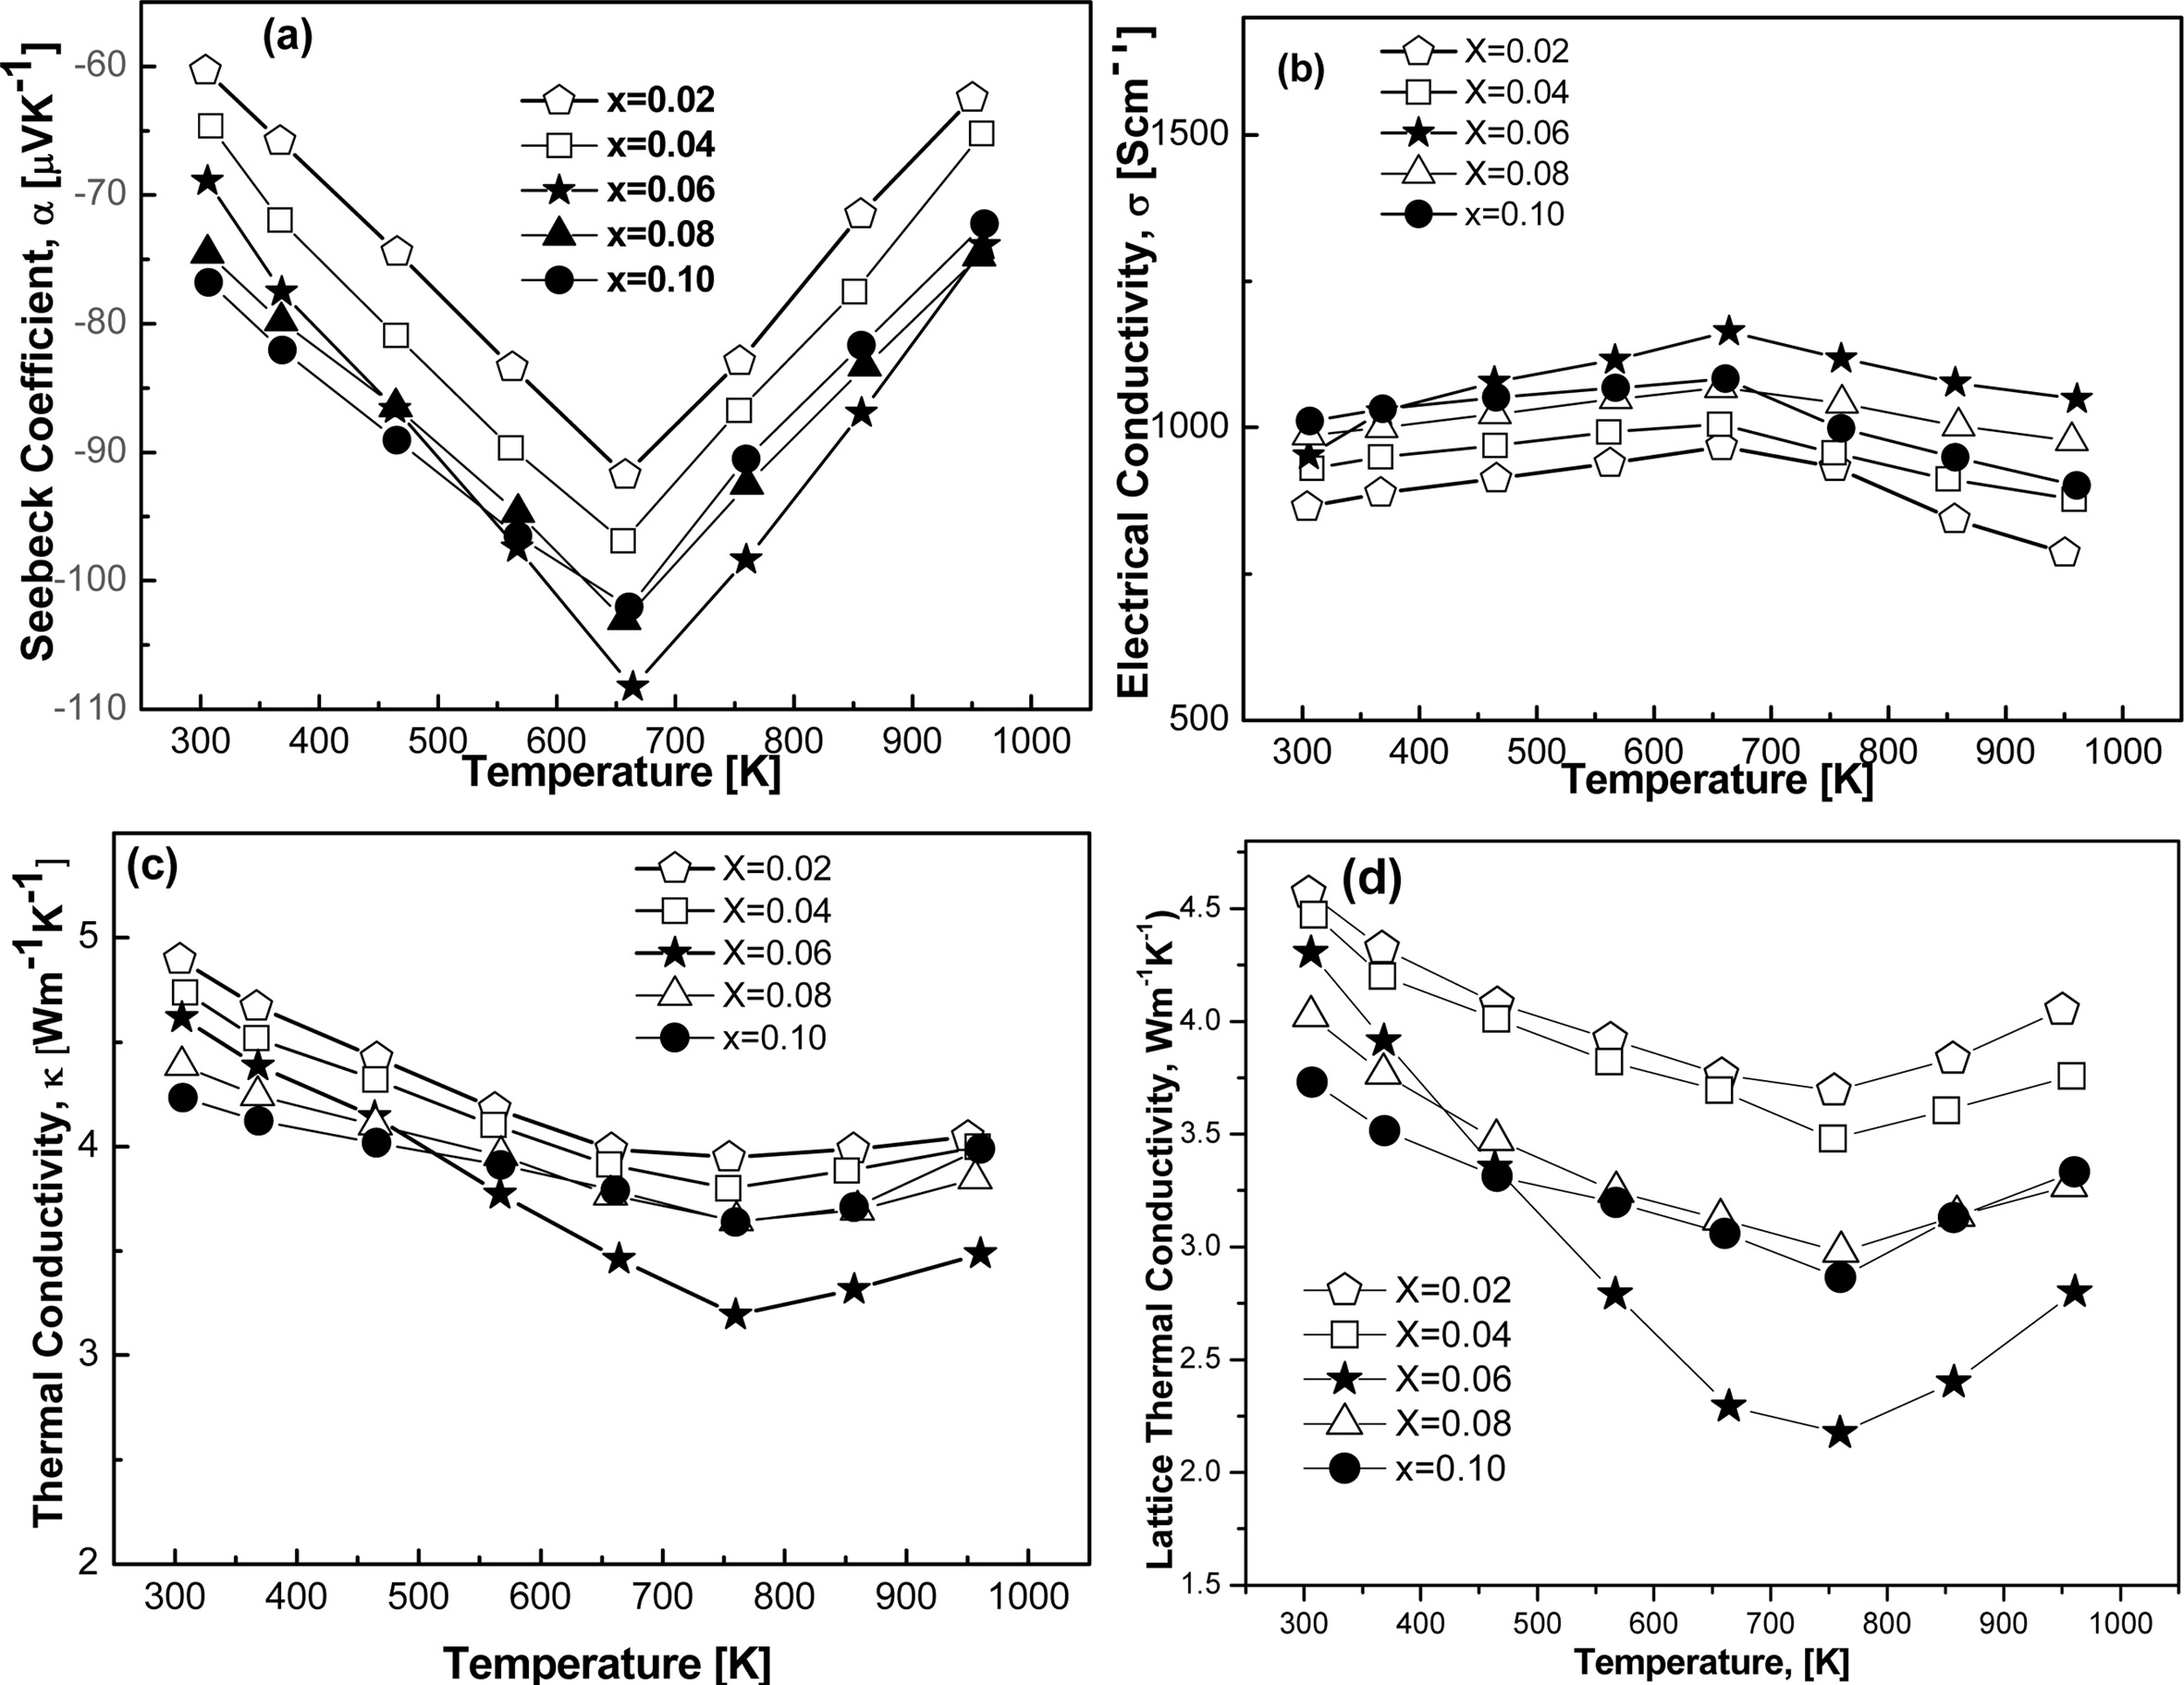
Fig. 7(a~d) shows the temperature dependence of Seebeck
coefficient, electrical conductivity, lattice thermal conductivity
and thermal conductivity, respectively. Fig. 7(a) reveals that Seebeck coefficient
is strongly dependent on Te concentration as it is varied with increasing
or decreasing temperature. The charge carriers for the
current system turned out to be electrons because the sign of the Seebeck
coefficient was found to be negative as can be seen in Fig. 7(a). The absolute
value of the Seebeck coefficient slightly increases with increasing Te
concentration at room temperature, reaching a maximum value of 77 µVK-1 for x = 0.06. The absolute
value of Seebeck coefficient is increased with the rise of temperature up to
650 K. This gradual increase of absolute Seebeck coefficient could be due to
the increase of effective mass of the charge carriers. As it is established
that Seebeck coefficient is directly proportional to the carriers effective mass
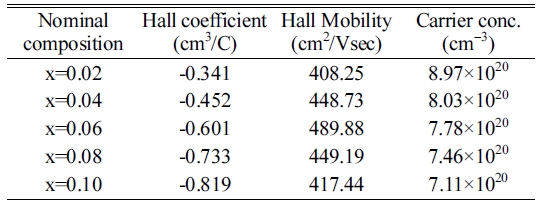
(S∞m*). Moreover, carrier concentration slightly decreased with the increasing
concentration of Te contents as shown in Table 2, which also enhances the
Seebeck coefficient as well. FeVSb0.94Te0.06 showed
strong temperature dependence of the Seebeck coefficient. A maximum value of
absolute Seebeck coefficient was found to be 107 µVK-1 for
x = 0.06 at 658 K. This suggests that the composition, FeVSb0.94Te0.06
holds great promise for enhanced figure of merit as the Seebeck
coefficient and electrical conductivity can be further increased via the
optimization of appropriate elemental doping at the Fe/V sites in the system
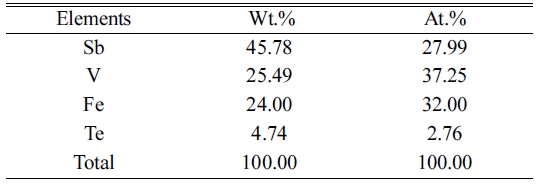
[23]. No incorporation of trace elements during milling was found which is
visualized in Table 1.
Temperature dependence of electrical conductivities in
FeVSb1-xTex HH samples are demonstrated by the Fig. 7(b).
At room temperature, electrical conductivity of all the samples climbed owing
to the semi-metallic behavior, which was resulted by the narrow band gap semiconductor
[24, 25]. Electrical conductivity increased again
for all the samples with the increasing temperature, which
indicated metallic behavior. This dependence of the
electrical conductivity on increasing Te concentration might be due
to the change of carrier concentration and mobility as a function of Te
concentration. The highest electrical conductivity of 1,164 Scm-1
was observed for the sample x=0.06, which also showed the considerable TE
efficiency as TE efficiency is directly proportional to electrical
conductivity and the degeneracy of electron band. This
increase in electrical conductivity could also be due to the easy
transformation of Fermi band to the higher conduction band by thermal elevation
of electrons within the band gap [26]. Eventually, electrical
conductivity slightly decreased at higher temperature range of around 660~973
K. It can be considered that all the samples displayed bipolar electrical
behavior over the temperature range of 300~973 K. Although a significant
improvement of the electrical conductivity of FeVSb1-xTex
alloys could be achieved by optimizing the Te concentration, the observed
values are still low for the expectation in TE material. Generally, to be used
in a device, ZT of a TE material should be ~1. However, the prospect of further
enhancement of the electrical conductivity of this family of compounds is
expected to be high through doping on Fe or V sites [26].
Temperature
dependence of thermal conductivity and lattice thermal conductivity are shown
in Fig. 7(c, d). Both of them markedly decreased at room temperature after
adding increasing order of dopants. The lattice thermal conductivity of FeVSb1-xTex
decreased considerably with increasing Te
contents. It could be due to the enhanced phonon scattering. Possibly,
effective hybridization of 5p orbitals of both the Sb and Te optimized the
carrier concentration [27]. This optimized concentration increased the
effective mass of the carriers, which took part in effective phonon scattering
process. In addition, because of the expected small grain size (≤10 μm) of the
synthesized FeVSb1-xTexHH materials, a high density of
grain boundaries might form. This
translates enhanced phonon scattering
at grain boundaries which may contribute significantly to the reduction of the
lattice thermal conductivity as well. Regardless of the composition, the
lattice thermal conductivity decreases considerably with rising temperature
(Fig. 7(d)) and lattice thermal conductivity as low as 2.22 Wm-1K-1
was achieved at 773 K for composition with x = 0.06. A similar trend
was observed for the total thermal conductivity of all FeVSb1-xTex
compounds (Fig. 7(c)). There is a marginal difference
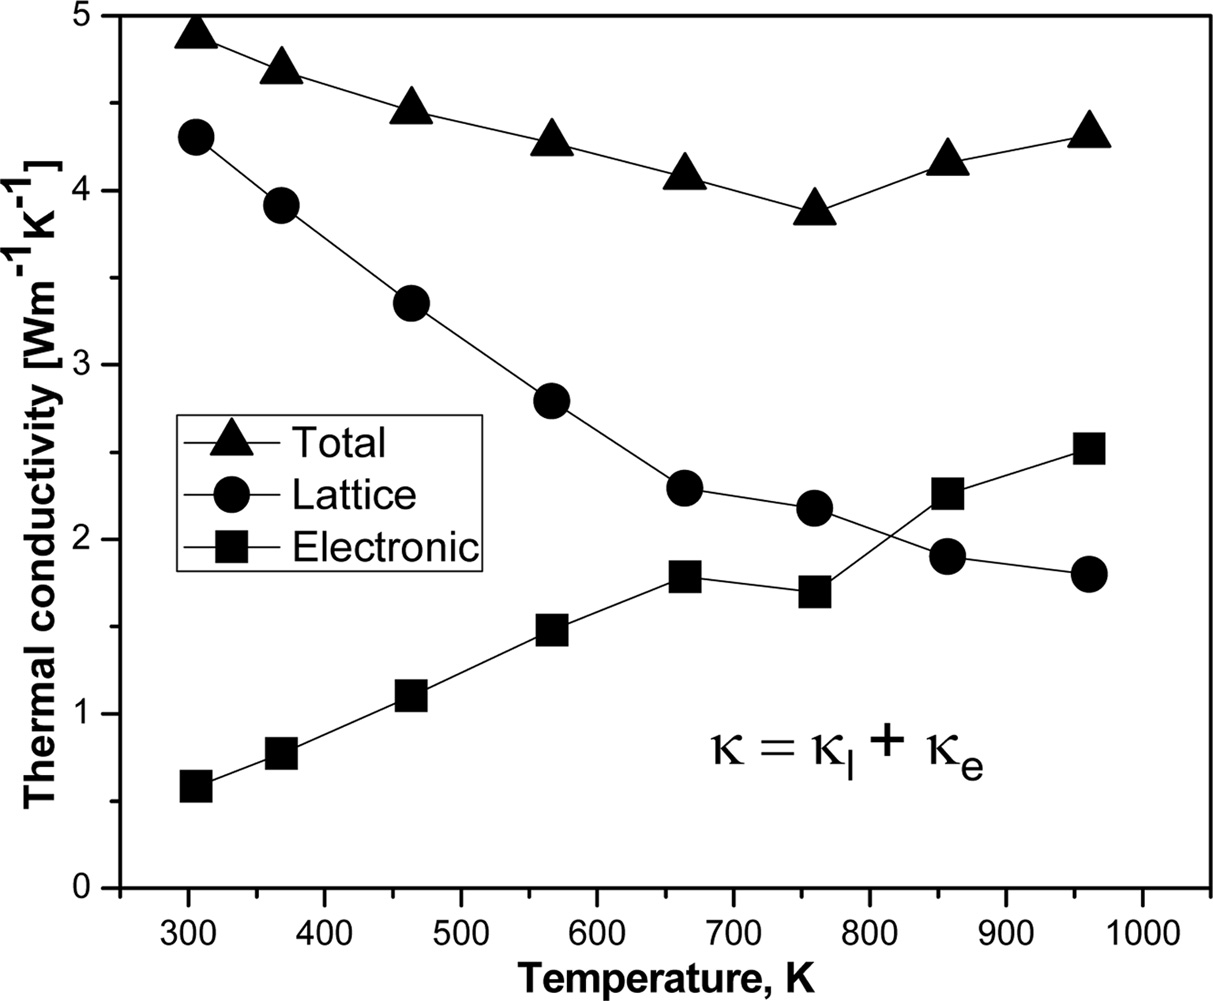
between the total thermal conductivity and the lattice contribution and is
observed for all the compositions due to the very low electronic thermal
conductivity of FeVSb1-xTex alloys (Fig. 8). No foreign
elements effect on thermal conductivity was observed, which was
confirmed by EDS analysis given in Table 1. The
electronic thermal conductivity is found considerably low;
however, it cannot be ignored for good TE devices. The maximum
thermal conductivity is found to be ~5 Wm-1K-1.
This thermal conductivity is considerably low compared to other material
system, and it is practically noticeable. Second phase could also be
responsible for this decreasing of thermal conductivity. Electronic thermal
conductivity can be calculated using the equation, κe = LσT,
where L is the Lorenz number (2×10⁻⁸ WΩK-2).
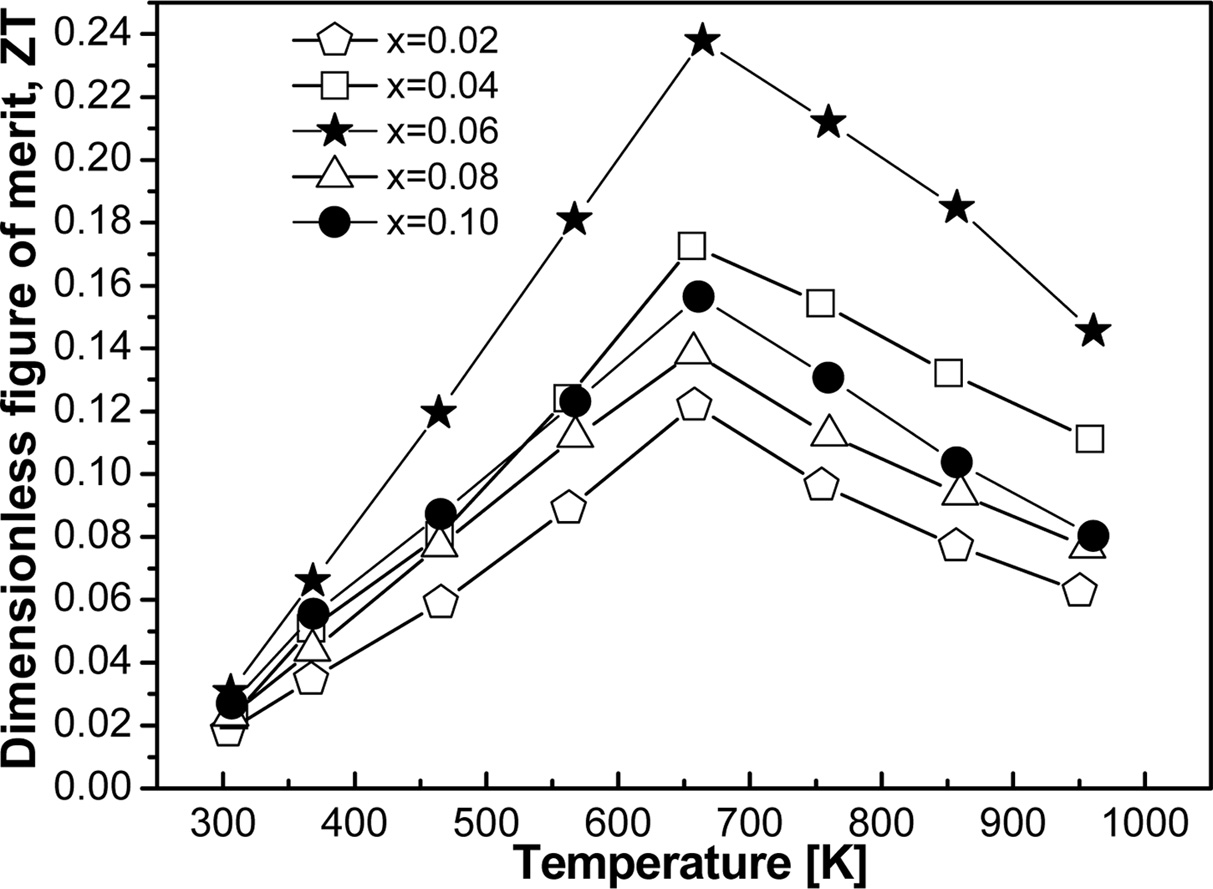
The dimensionless figure of merit (ZT) was calculated
from TE properties and shown in Fig. 9 as a function of temperature. The
maximum value of ZT is achieved for the sample x = 0.06 at 657 K.
This moderate value of ZT could not be enough to be used in a practical TE
device. Generally, denser material produced maximum ZT which is
evident in this experiment for FeVSb0.94Te0.06.
The resultant maximum ZT of 0.24 was found due to the impurities free material
formation and relatively low thermal conductivity with relatively high Seebeck
coefficient. This suggests that careful tuning of the appropriate dopant might
produce higher ZT than current experiment. Another way that might be fruitful
to improve ZT is multi-doping which could decrease the thermal conductivity to
a large fraction and enhance ZT significantly [28].

|
Fig. 1 Average particle size of as-MAed powders for 16 h; (a) x=0.02, (b) x=0.04, (c) x=0.06, (d) x=0.08, and (e) x=0.10. |
|
Fig. 2 Crystal structure variations of VHPed samples; (a) lattice parameter as a function of doping elements, and (b) peak shifting to lower diffraction angle for FeVSb1-xTex (x=0.02~0.10). |
|
Fig. 3 X-ray diffraction patterns of; (a) MAed powder samples which represent progress of milling, and (b) HH phase formation with a fraction of secondary phase. |

|
Fig. 4 SEM images of the VHPed samples of FeVSb1-xTex; (a) x=0.02, (b) x=0.04, (c) x=0.06, (d) x=0.08, and (e) x=0.10. |
|
Fig. 5 Relative density against the doping concentration. |
|
Fig. 6 EDS line mapping image of Te in VHPed FeVSb1-xTex HH phases as a representative. |
|
Fig. 7 Temperature dependent thermoelectric properties in the form of; (a) Seebeck coefficient, (b) electrical conductivity, (c) thermal conductivity, and (d) lattice thermal conductivity. |
|
Fig. 8 Temperature dependence of total thermal conductivity in the form of lattice thermal conductivity and electronic thermal conductivity. |
|
Fig. 9 Calculated temperature dependent ZT as a function of doping element. |
FeVSb1-xTex (0.02 ≤ x ≤ 0.10)
HH alloys synthesized by MA process and subsequent VHP were studied in the
temperature range of around 300 to 973 K. It was found that with the increase
of Te concentration, the lattice thermal conductivity decreased considerably.
The lowest value of lattice thermal conductivity is found to be 2.22 Wm-1K-1
at 773 K, which is relatively low for HH compounds. The lowest
thermal conductivity was obtained for the composition FeVSb0.94Te0.06.
This considerable reduction of the lattice thermal conductivity
of the FeVSb0.94Te0.06 HH alloys might be due to the enhanced phonon
scattering, increased effective mass of carriers and second phase interaction
by Te substitution at the Sb site in FeVSb matrix. The Seebeck coefficient and
electrical conductivity were found to be very sensitive to the Te concentration
throughout the process. Te substitution at the Sb site enhanced the ZT of FeVSb1-xTexHH
alloys and the maximum ZT was found to be 0.24 at 657 K for FeVSb0.94Te0.06.
Although the observed highest ZT value is relatively moderate to apply in a TE
device, further improvement maybe possible through enhancement of the electrical conductivity and Seebeck
coefficient via optimization of appropriate doping at the Fe/V sites and
formation of pure single phase.
This work was supported by the Regional Innovation Center
(RIC) Program, which was conducted by the Ministry of SMEs and Startups of the
Korean Government, and the Korea Basic Science Institute grant funded by the
Ministry of Education (grant no. 2019R1A6C1010047).
- 1. J.B. Neaton, Nature Nanotechnology. 9 (2014) 876-877.
-

- 2. X.F. Zheng, C.X. Liu, Y.Y. Yan, and Q. Wang, Renewable and Sustainable Energy Reviews. 32 (2014) 486-503.
-

- 3. G.J. Snyder and E.S. Toberer, Nature Materials. 7 (2008) 105-114.
-

- 4. K. Delime-Codrin, T. Yamada, A. Yamamoto, R. Sobota, M. Matsunami, and T. Takeuchi, Jpn. J. Appl. Phys. 56 (2017) 111202.
-

- 5. C. Fu, H. Xie, T. Zhu, J. Xie, and B.X. Zhao, J. Appl. Phys. 112 (2012) 124915.
-

- 6. M. Zou, J.F. Li, T. Kita, Sol. Stat. Chem. 198 (2013) 125-130
-

- 7. S. Sakurada and N. Shutoh, Appl. Phys. Lett. 86 (2005) 082105.
-

- 8. S. Populoh, M. Aguirre, O. Brunko, K. Galazka, Y. Lu, andA. Weidenkaff, Materials, 6 (2013) 1326-1332.
-

- 9. M. Schwalland B. Balke, Phys. Chem. Chem. Phys. 15 (2013) 1868-1872.
-

- 10. X. Yan, W. Liu, H. Wang, S. Chen, J. Shiomi, K. Esfarjani, H. Wang, D. Wang, G. Chen, and Z. Ren, Energy Environ. Sci., 5 (2012) 7543-7548.
-

- 11. E. Rausch, B. Balke, S. Ouardi, andC. Felser, Phys. Chem. Chem. Phys. 16 (2014) 25258-25262.
-

- 12. P. Qiu, X. Huang, X. Chen, andL. Chen, J. Appl. Phys. 106 (2009) 103703.
-

- 13. Z. Aksamijaand I. Knezevic, Phys. Rev. B. 88 (2013) 155318.
-

- 14. K. Kothariand M. Maldovan, Nanoscale and Microscale Thermophysical Engineering. 22 (2018) 1-15.
-

- 15. R. Stern, B. Dongre, andG.K.H. Madsen, Nanotechnology. 27 (2016) 334002.
-

- 16. S.-C. Ur, H. Choo, D. B. Lee, and P. Nash, Metals and Materials, 6 (2000) 435.
-

- 17. E.P. DeGarmo, J.T. Black, and R.A. Kohser, Solution Manuals to Accompany-Materials and Process in Manufacturing (9th Ed.), John Wiley and Sons Ltd, New York (2003).
- 18. M. Blair and T.L. Stevens, Steel Castings Handbook, ASM International, Ohio (1995).
- 19. D.M. Rowe and V.S. Shukla, J. Appl. Phys. 52 (1981) 7421.
-

- 20. W. Qin, T. Nagase, Y. Umakoshi, andJ.A. Szpunar, J. Phys.: Condens. Matter. 19 (2007) 236217.
-

- 21. A.R. Dentonand N.W. Ashcroft, Phys. Rev. A. 43 (1991) 3161-3164.
-

- 22. E. Atkins, Phys. Bull. 29 (1978) 572.
-

- 23. T. Sekimoto, K. Kurosaki, H. Muta, andS. Yamanaka, 24th International Conference on Thermoelectrics (ICT 2005).
-

- 24. G. S. Nolas, J. Sharp, andJ. Goldsmid, Thermoelectrics: Basic Principles and New Materials Development, Springer, USA, 2001.
-

- 25. P. Maji, N.J. Takas, D.K. Misra, H. Gabrisch, K. Stokes, and P.F.P. Poudeu, Solid State Chem. 183 (2010) 1120-1126.
-

- 26. C. Uher, J. Yang, S. Hu, D.T. Morelli, and G.P. Meisner, Phys. Rev. B. 59 (1999) 8615-8621.
-

- 27. J. Cui, G. Cai, and W. Ren, RSC Adv. 8 (2018) 21637-21643.
-

- 28. R. Hasan and S.-C. Ur, Trans. Electr. Electron. Mater. 19 (2018) 106-111.
-

 This Article
-
2019; 20(6): 582-588
Published on Dec 31, 2019
- 10.36410/jcpr.2019.20.6.58
- Received on Mar 8, 2019
- Revised on Aug 21, 2019
- Accepted on Sep 26, 2019
 Services
- Abstract
introduction
experiments
results and discussions
conclusion
- Acknowledgements
- References
- Full Text PDF
Shared
 Correspondence to
- Rahidul Hasan and Soon-Chul Ur
-
Department of Materials Science and Engineering/ReSEM, Korea National University of Transportation, 50 Daehak-ro, Chungju, Chungbuk 27469, Korea
Tel : +82-43-841-5385 - E-mail: scur@ut.ac.kr


 Copyright 2019 International Orgranization for Ceramic Processing. All rights reserved.