- Optical and scintillation properties of Tb-doped apatite single crystals
Takayuki Yanagida* and Noriaki Kawaguchi
Devision of Materials Science, Nara Institute of Science and Technology, 8916-5 Takayama-cho, Ikoma, Nara 630-0101, Japan
In the present study, we focus
on the Tb-doped Sr-based apatite materials which have a chemical composition of
Sr2RE8(SiO4)6O2 where RE
denotes the rare earth element. The target materials in this study were Tb 0.5%
doped Sr2Gd8(SiO4)6O2,
Sr2Y8(SiO4)6O2, Sr2(Gd0.5Lu0.5)8(SiO4)6O2
and Sr2(Gd0.4Lu0.6)8(SiO4)6O2
crystals, and they were synthesized by the floating zone method. When we checked
powder X-ray diffraction patter, we confirmed a single phase (JCPDS No:28-0212)
for all the samples. In photoluminescence (PL) and X-ray induced scintillation
spectra, some sharp emission lines appeared, and the emission origin was Tb3+
4f-4f transition. We investigated PL and scintillation decay time profiles, and
the main component was 1.8 and 1.3 ms, respectively. Among the samples prepared
here, Sr2Gd8(SiO4)6O2
showed the highest scintillation intensity.
Keywords: Scintillator, Scintillation detector, Ionizing radiation, Luminescence
Scintillators are one of the luminescent materials which
have a function to absorb the ionizing radiation and emit UV-Vis photons [1-4].
The spectrum of the application of scintillators are side, including medical imaging
[5], security [6], well-logging [7], environmental monitoring
[8], high energy physics [9]. In the recent trend, scintillator materials
consist of a host and an emission center, as same as the other
phosphor materials. The main function of the host is to absorb the
target ionizing radiation efficiently, and that of the emission center is to
emit UV-Vis photons. The combination (chemical composition) of the host and
emission center is important so many materials have been developed and examined
for scintillator uses.
Rare earth elements have been used both for the host and
the emission center in scintillation materials, and common examples for
scintillators are Ce-doped (Y,Gd,Lu)2SiO5
[10-12] and (Y,Gd,Lu)3(Al,Ga)5O12 [13-15].
In these materials, the combination of the host and emission centers is
efficient, and luminous scintillation can be achieved. In addition to Ce-doped
rare earth host materials, Pr3+ [16] and Tb3+ [17] are
sometimes selected as the emission centers in scintillators. In this work, we
focus Tb3+ as an emission center since the number of study of
Tb-doped scintillators is limited when we compare with Ce- or Pr-doped
materials.
As a host material, we focus on the apatite crystals. The
apatite crystals are represented as RE9.33(SiO4)6O2
and AE2RE8(SiO4)6O2,
where RE and AE denote rare earth and alkaline earth elements,
respectively. As can be seen in the composition, apatite crystals can contain a
certain amount of rare earth ions, and a high stopping power against high
energy photons can be expected if RE is Gd or Lu.
In general, apatite materials are applied in medicine
such as artificial born [18] and other applications [19-20]. Up to now, we have
synthesized and evaluated Ce-doped apatite crystals [21-25], and we think the
combination of apatite host and Tb3+ emission centers would be
interesting.
In the
present study, we focus on the Tb-doped Sr-based apatite materials which have a
chemical composition of Sr2RE8(SiO4)6O2
(RE = rare earth element). Up to now, we have investigated Ce-doped apatite
crystalline scintillators [21-25], and there still remains a large room for study for other emission centers. Tb
0.5 % doped Sr2Gd8(SiO4)6O2,
Sr2Y8(SiO4)6O2, Sr2(Gd0.5Lu0.5)8(SiO4)6O2
and Sr2(Gd0.4Lu0.6)8(SiO4)6O2
crystals were synthesized by the floating
zone method to investigate optical and scintillation properties. When we compare the floating zone method with other
common melt growth techniques, we do not have to use crucibles in the floating
zone method, and it is quite
advantageous in viewpoints of the growth cost and avoiding unexpected
contamination. Typical speed of the crystal growth is also attractive in the
floating zone method, and we can grow few mmf × few cm crystal in 6-8 hours. On the other hand, to grow a big crystal
is generally
difficult in this method, and if a big crystal is required, conventional
Czochralski or Bridgeman method will be better. Hereafter,
we call Sr2Gd8
(SiO4)6O2, Sr2Y8(SiO4)6O2,
Sr2(Gd0.5Lu0.5)8(SiO4)6O2
and Sr2(Gd0.4Lu0.6)8(SiO4)6O2
as SrGS, SrYS, SrGdLuS (Gd:Lu=1:1), and SrGdLuS (Gd:Lu=3:2).
0.5% Tb-doped SrGS, SrYS, SrGdLuS (Gd:Lu=1:1), and
SrGdLuS (Gd:Lu=2:3) apatite crystal of (Gd0.4Lu0.6)8 Sr2(SiO4)6O2
were synthesized by the floating zone method. First, raw material powders of Tb4O7,
Y2O3, Gd2O3, Lu2O3,
SrCO3 and SiO2 were mixed by using mortar and pestle.
Next, the mixture powder was heated at 1100 oC for 10 h so as
to remove CO2 from SrCO3. Then, the obtained mixture
powder was formed to a cylinder by a hydrostatic pressure. All the cylinder
rods of the powder mixtures were sintered at 1500 oC for 12 h
to make ceramic rods. Finally, a ceramic rod was loaded into an FZ furnace
(FZD0192, Canon Machinery Inc.) to synthesize a crystal under ambient atmosphere.
Here, the pull-down rate was approximately 3 mm/h, and
the rotation rate was 20 rpm.
The crystalline structures of the synthesized samples were
identified by XRD using a diffractometer (MiniFlex600, Rigaku). After we grew
crystal samples, the samples were partially crashed to obtain a powder to
investigate the phase of the samples. The XRD patterns were evaluated in the 2θ range from 20 to 60o.
As optical properties, PL excitation and emission contour
graphs were measured by using Quantaurus-QY (Hamamatsu), and at the same time,
we also evaluated the PL QY in all the samples. The PL decay times were
evaluated with Quantaurus-t (Hamamatss) with the time
correlated single photon counting technique. The
excitation and monitoring wavelengths were 265 and 540 nm, respectively. Since
the excitation source was pulsed white light source, we used an optical filter
which could transmit photons from 255 to 275 nm (the center wavelength was 265
nm). In the monitoring side, we put a bandpass filter of which transmitted
wavelength was from 510 to 570 nm (the center wavelength was 540 nm). In
addition, a short cut filter (< 470 nm) was automatically set in the
instrument to cut the excitation photons.
X-ray induced radioluminescence (RL), or scintillation,
spectra were measured using a lab-constructed set-up [26] as described below.
X-rays from the X-ray generator was delivered directly to the sample. The
consequent emission as RL was guided, through an optical fibre, monochromator
(SR163, ANDOR), and finally to the CCD (DU920-BU2NC, ANDOR) to measure the
spectrum. Here, the applied voltage and current to the X-ray tube was fixed to
60 kV and 1 mA, respectively. The scintillation decay time profile was measured
by using our original setup [27], which is equipped with a pulse X-ray tube.
Fig. 1 represents appearances of the grown
crystals. Although there have been many cracks in the grown crystals, we can
obtain partially transparent samples. If we increase the ratio of Lu in Lu and
Gd mixed materials, we could not obtain a single crystal sample. Therefore, the
maximum Lu ratio in this series would be around 60%, and this result was also
confirmed in our recent work about Ce-doped apatite crystals [22]. In order to
measure optical and scintillation properties, we cut relatively transparent and
less-crack part.
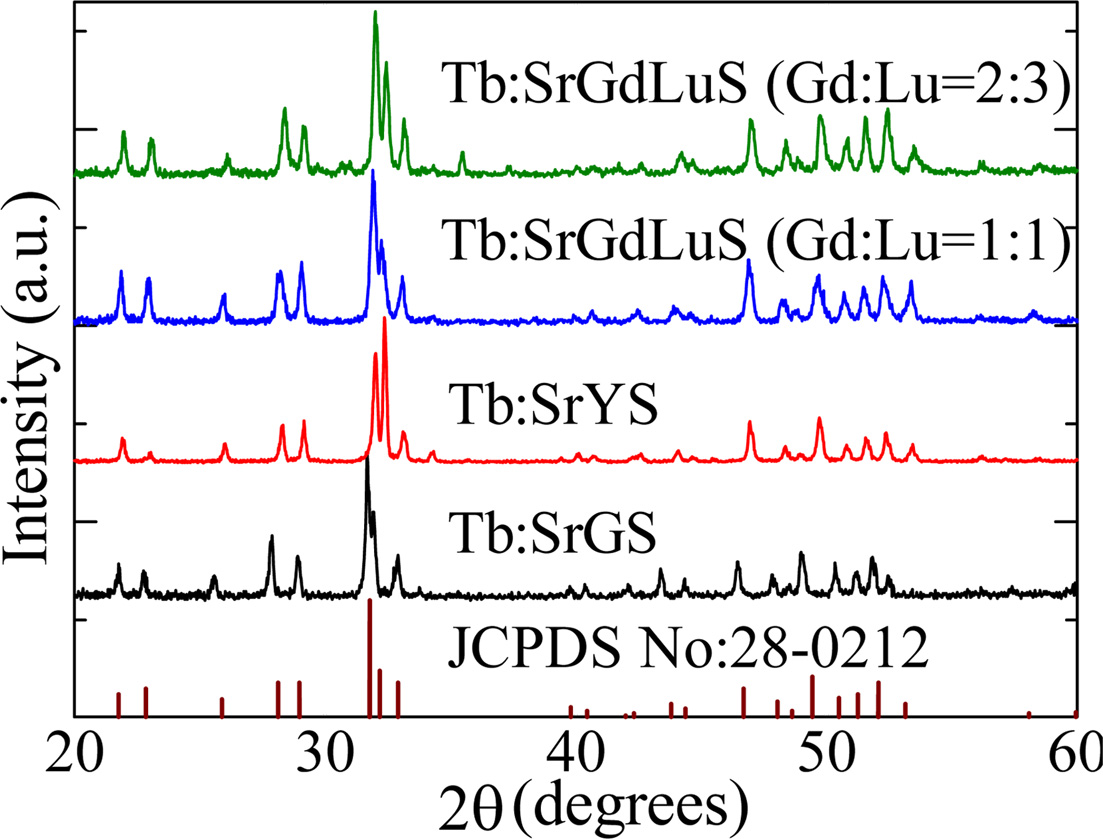
Fig. 2 represents powder XRD patterns of the samples. We
confirmed that all the crystals did not have any impurity phases within the
detection limit of XRD measurement, and the XRD patterns well coincided with
the standard data of Ca2Gd8(SiO4)6O2
(JCPDS No:28-0212). Peak angles of Tb:SrGdLuS, Tb:SrGdLuS, and Tb:SrYS were
higher than that of Tb:SrGS. It can be explained by the difference in the
lattice constants. When valences and coordination numbers of Lu, Y, and Gd are
the same, ionic radii of Lu and Y are smaller than that of Gd. Therefore, the
lattice constants of Tb:SrGdLuS, Tb:SrGdLuS, and Tb:SrYS, which contain Lu and
Y, could be smaller than that of Tb:SrGS.
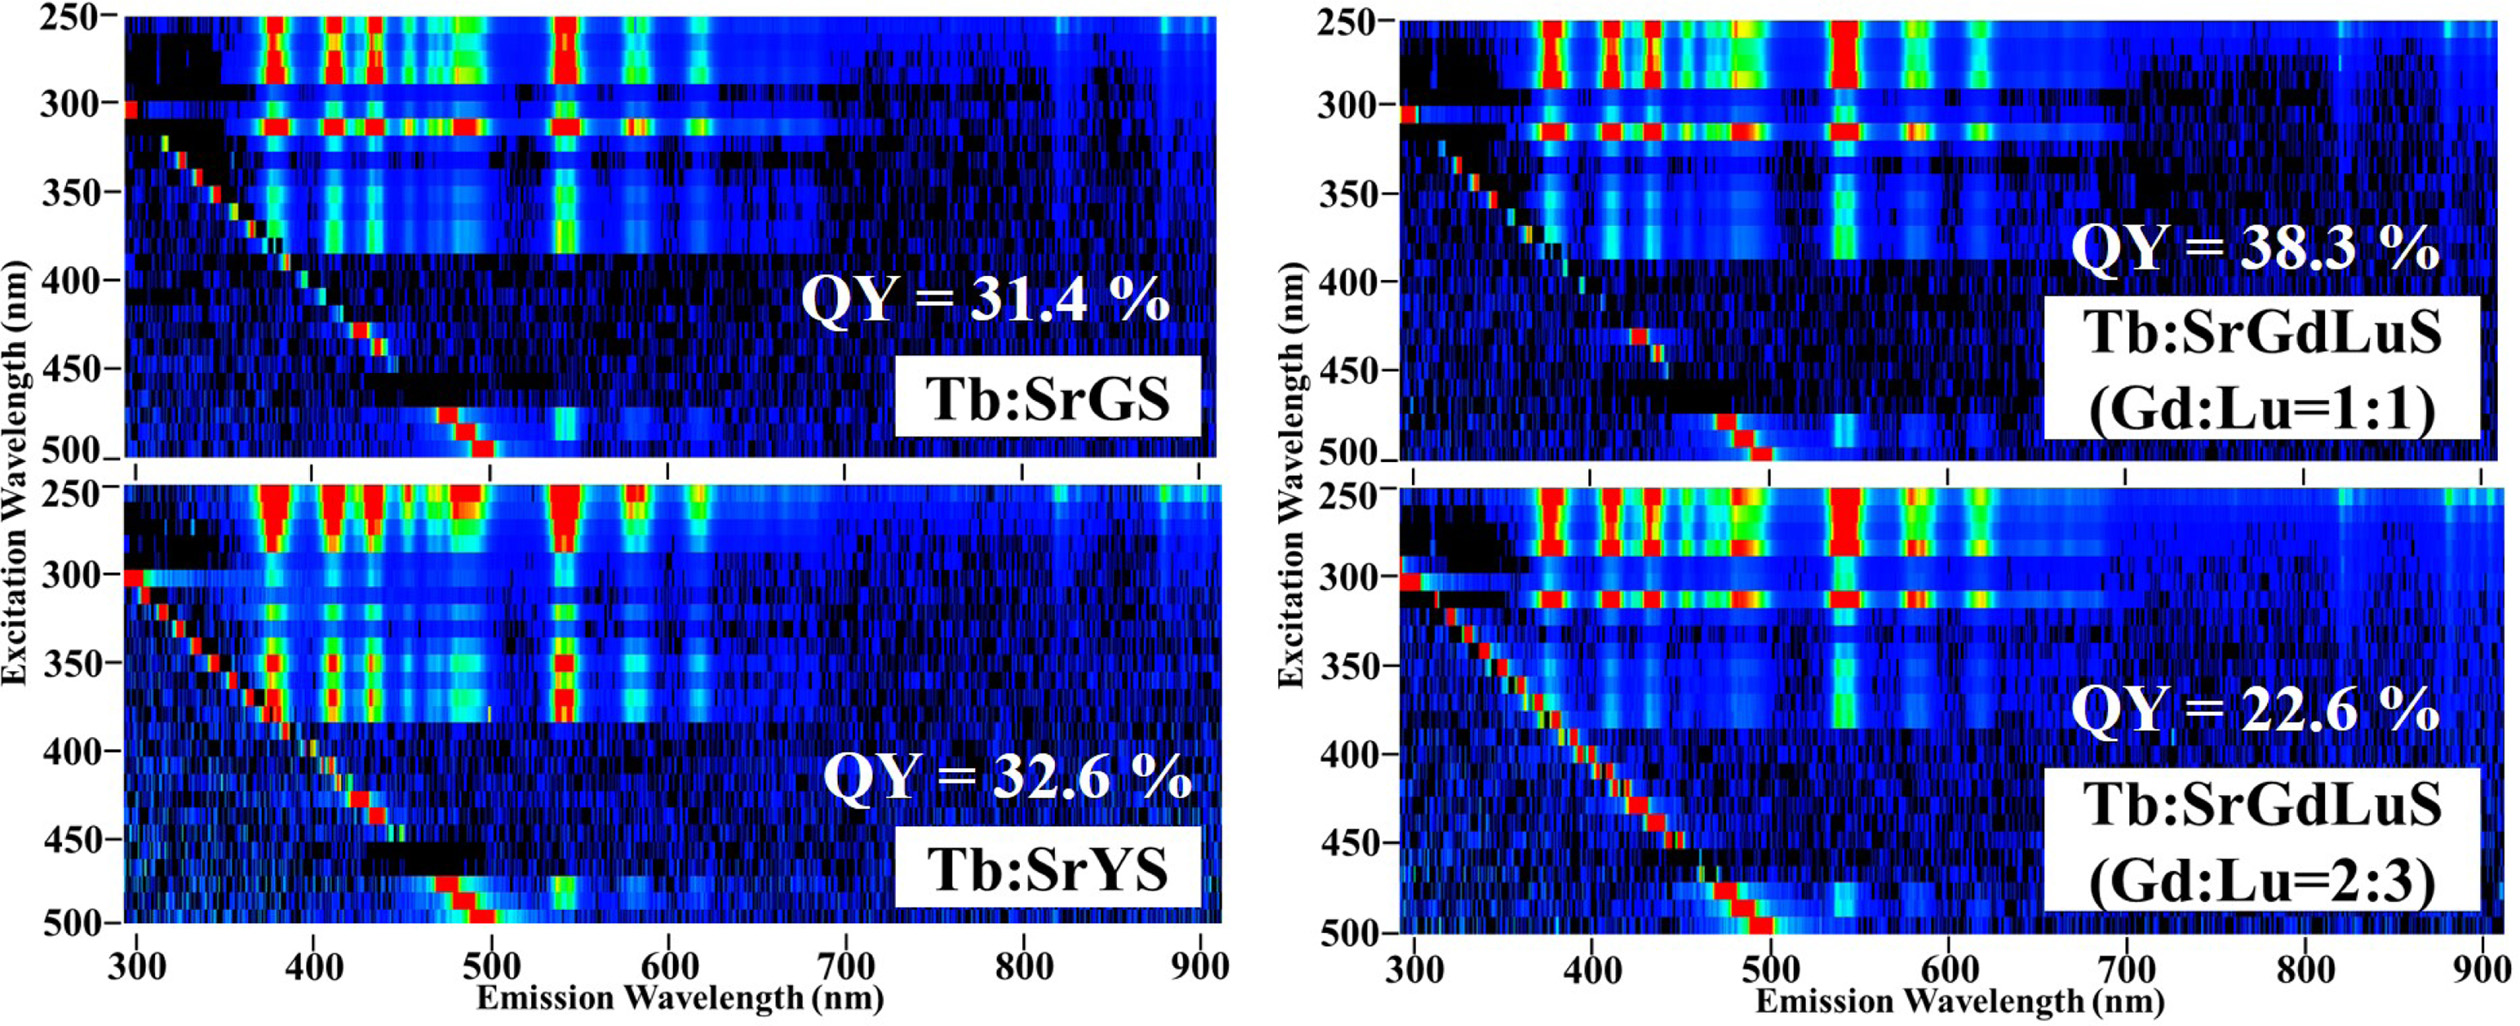
Fig. 3 represents PL excitation and emission contour
graphs of all the samples. In all the samples, some emission
lines due to Tb3+ 4f-4f transition were observed
from 350 to 650 nm. The excitation wavelengths were the same in all the
samples, and it was from 250 to 290 nm. The emission lines at UV and visible
lengths are caused by the electron transitions from 5D3,4
excited states to 7Fii ground states, and the observed
spectral feature was typical as Tb-doped phosphors [28-30]. The PL QY
are also written in the figure, and QY of SrGS, SrYS, SrGdLuS
(Gd:Lu=1:1), and SrGdLuS (Gd:Lu= 2:3)
were 31.4, 32.6, 38.3 and 22.6 %, respectively. All the samples had higher
PL QY than Ce-doped apatite crystals which were previously investigated.
Among the present samples tested here, SrGdLuS (Gd:Lu=1:1) showed the best PL QY,
and the tendency was the same with Ce-doped Sr2(GdxLu1-x)8(SiO4)6O2
crystals [22]. In this series of materials, the ratio of Gd:Lu = 1:1 may
be optimum for the PL-based phosphor application.
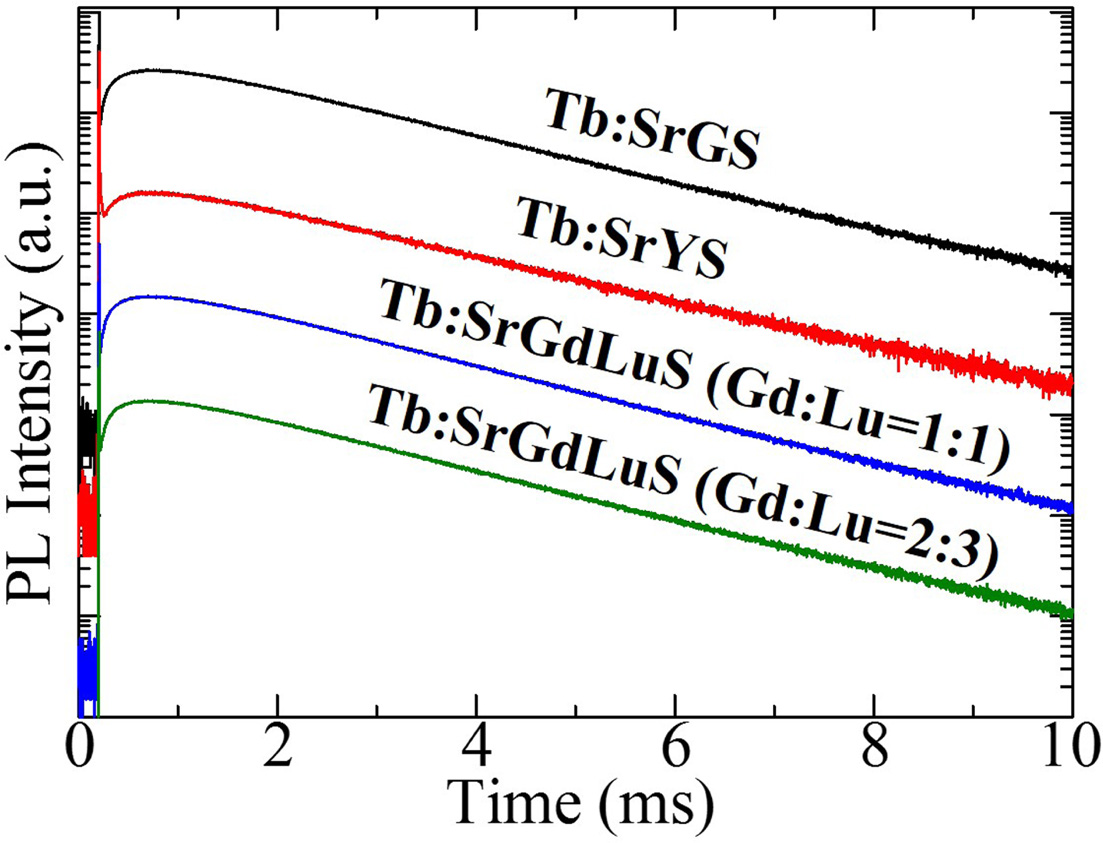
Fig. 4 demonstrates PL decay time
profiles of all the samples monitoring at 540 nm
under 265 nm excitation. In the decay part, all the curves were well approximated by a single exponential function, and the decay times
were typical for Tb3+ emission. The decay times of SrGS,
SrYS, SrGdLuS (Gd:Lu=1:1), and SrGdLuS (Gd:Lu=2:3) resulted 1.86, 1.92, 1.78
and 1.75 ms, respectively. These PL decay times are typical in Tb-doped materials
[31, 32]. On the other hand, if we focus on the rise part, all the samples
showed a slow rise time. Generally, such a slow rise suggests a sign of an
energy transfer phenomenon. Although there are several evaluation methodologies
for the rise time, here, we adopt the 10 %-90 % method to determine
the rise time by neglecting the spike like component which was due to the
instrumental response (excitation pulse). As a result, the rise time of SrGS,
SrYS, SrGdLuS (Gd:Lu=1:1), and SrGdLuS (Gd:Lu=2:3) were 0.25, 0.22, 0.24 and
0.25 ms, respectively. In Gd-containing samples, the energy transfer may be
possible since the PL decay of Gd3+ 4f-4f transition is generally a
few ms and excitation and emission wavelengths are ~270 and ~310 nm. In our
materials, Gd3+ is one of the main components of the host (in other
words, Gd 100 % doping), and some quenching would make the decay of Gd3+
faster (sub-ms). But such an interpretation is impossible for SrYS since it
does not contain Gd3+. The remaining possibility will be the energy
transfer from the host-based emission to Tb3+. In the past study, we
observed the host luminescence of this series of apatite crystals with a broad
band from 300 to 600 nm in X-ray induced RL spectrum [22-24], and the host
emission overlapped with the excitation bands of Tb3+ (Fig. 3). Up
to now, we have not succeeded to observe clear PL of the host emission due to
the low emission intensity of undoped samples. From the present results, the
excitation of the host emission of AE2RE8(SiO4)6O2
may be around 265 nm. The other possible scenario is a multi-phonon relaxation
which has been observed in the other Tb-doped materials [33].
Fig. 5 shows X-ray excited RL spectra
of all the samples. As same as the PL spectra, some sharp lines due to 4f-4f
transitions of Tb3+ appeared from 350 to 650 nm, and the electron
transitions were from 5D3,4 excited states to 7Fii
ground states. In this observation, the emission
around 540 nm (5D4 → 7F5) showed
the highest intensity in all the lines, and the same tendency was observed in
the scintillation of Tb-doped some other materials such as BaY2F8
[34], 45SiO2–10Al2O3–25BaO–(20−x)BaF2
glass [35], LuBO3 [36] and some other materials. Although the RL is
not a quantitative but a qualitative study, we can compare the emission
intensity with the other AE2RE8(SiO4)6O2
type apatite crystals with a similar size since the stopping power against
X-rays is similar in materials with similar chemical composition. Among the present samples, Tb:SrGS exhibited the highest
scintillation intensity, and when we
compare with Ce-doped AE2RE8(SiO4)6O2
type apatite crystals qualitatively, the scintillation intensity of present
samples were higher.
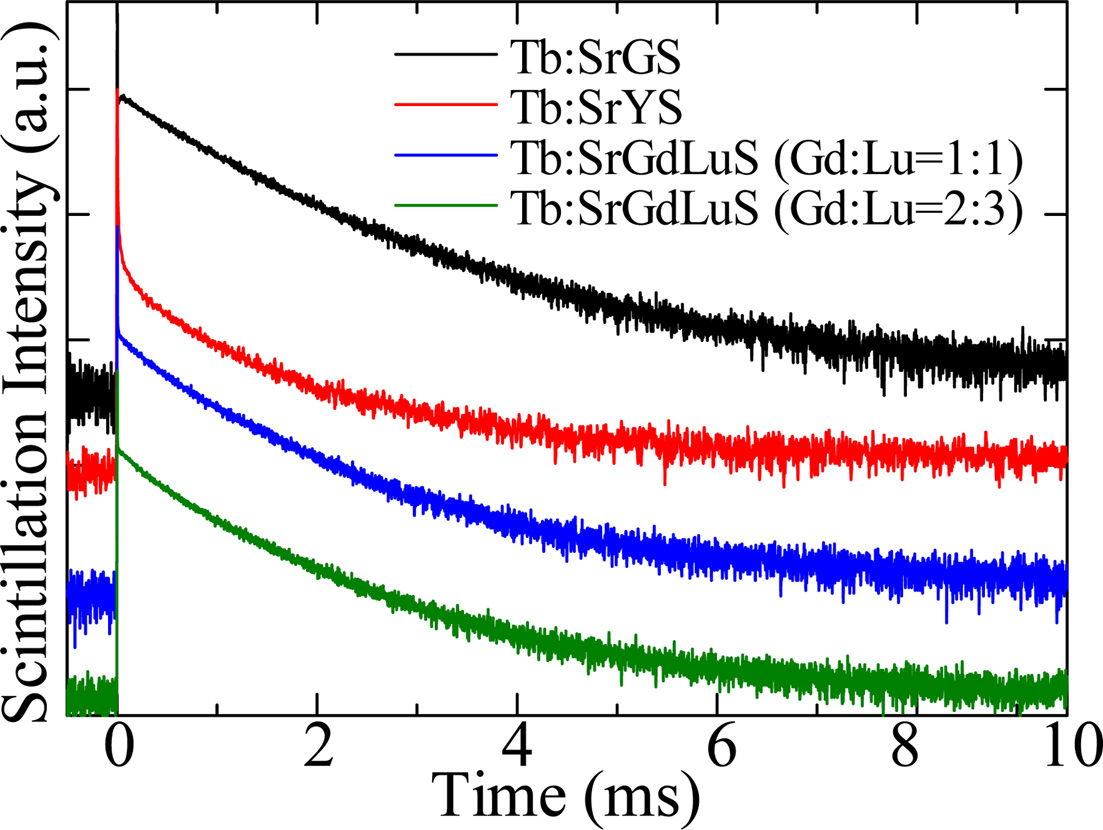
Fig. 6 shows scintillation decay time profiles of all the samples. In
the scintillation decay, all the curves were well approximated by a single
exponential function, and the decay times were typical for Tb3+
emission. The scintillation decay times of SrGS, SrYS, SrGdLuS (Gd:Lu=1:1), and SrGdLuS
(Gd:Lu=2:3) were 1.33, 1.28, 1.23, and 1.24, respectively. The scintillation
decay was faster than PL decay, and the reason will be blamed for the quenching
among the excited states. In scintillation, a large number of secondary
electrons are excited, and the spatial scale of the dispersion of secondary
electrons is around 100 nm [37]. In PL, we observe an excitation and relaxation
of one electron within the bandgap, and we generally do not consider such an
interaction between electrons except for the case of semiconductor materials.
In such a case, interactions among excited electrons cannot be negligible, and
such interactions sometimes arise a quenching phenomenon. Such a phenomenon is
called a linear energy transfer (LET) effect or excitation density effect.
Unlike PL, the slow rise was not observed, and the emission origin of the
scintillation did not relate to the energy transfer.
|
Fig. 1 Appearances of samples synthesized in this work. |
|
Fig. 2 Powder XRD patterns of the samples. |
|
Fig. 3 PL excitation (horizontal axis) and emission (vertical axis) contour graphs of all the samples. The calculated QY is also shown in each |
|
Fig. 4 PL decay time profiles of all the samples monitoring at 540 |
|
Fig. 5 X-ray induced RL spectra of all the samples. |
|
Fig. 6 X-ray induced scintillation decay time profiles of all the |
We synthesized Tb-doped SrGS, SrYS, SrGdLuS (Gd:Lu=1:1),
and SrGdLuS (Gd:Lu=2:3) by the floating zone method.
In PL and scintillation, we observed some sharp emission lines due to Tb3+
4f-4f transition from 350 to 650 nm. All the samples showed higher PL QY
than those observed in Ce-doped apatite crystals which were previously
reported. In the scintillation upon X-ray excitation, Tb-doped SrGS showed the
highest emission intensity among the samples tested in this work. In PL and
scintillation, decay times due to Tb3+ 4f-4f transition were
1.75-1.86 ms and 1.23-1.33 ms, respectively.
This work was supported by Grant-in-Aid for Scientific
Research (A) (17H01375) and (B) (18H03468) from the Ministry of Education,
Culture, Sports, Science and Technology of the Japanese government (MEXT),
A-STEP from Japan Science and Technology Agency (JST). The Cooperative Research
Project of Research Institute of Electronics, Shizuoka University, Terumo
Foundation for Life Sciences and Arts, Izumi Science and Technology Foundation,
The Kazuchika Okura Memorial Foundation, and The Iwatani Naoji Foundation are
also acknowledged.
- 1. P. A. Rodniy, in “Physical Processes in Inorganic Scintillators” (CRC Press, 1997) p. 18.
- 2. G. Knoll, in “Radiation Detection and Measurement” (Wiley & Sons Hoboken Press, 2000) p. 223.
- 3. C.W.E. van Eijk, Nucl. Instrum. Methods Phys. Res. A 392[1-3] (1997) 285-290.
-

- 4. T. Yanagida, Proc. Jpn. Acad. B 94[2] (2018) 75-97.
-

- 5. K. Nakanishi, S. Yamamoto, H. Watabe, S. Abe, N. Fujita, andK. Kato, Nucl. Inst. and Meth. A 880 (2018) 118-124.
-

- 6. D. Mannes, F. Schmid, J. Frey, K. Schmidt-Ott, and E. Lehmann, Physics Procedia 69 (2015) 653-660.
-

- 7. T. Yanagida, Y. Fujimoto, S. Kurosawa, K. Kamada, H. Takahashi, Y. Fukazawa, M. Nikl, and V. Chani, Jpn. J. Appl. Phys. 52 (2013) 076401.
-

- 8. K. Watanabe, T. Yanagida, K. Fukuda, A. Koike, T. Aoki, and A. Uritani, Sens. Mater. 27 (2015) 269-275.
-

- 9. H. Takahashi, T. Yanagida, D. Kasama, T. Ito, M. Kokubun, K. Makishima, T. Yanagitani, H. Yagi, T. Shigeta, and T. Ito IEEE Trans. Nucl. Sci. 53[4] (2006) 2404-2408.
-

- 10. P.A. Cutler, C.L. Melcher, M.A. Spurrier, P. Szupryczynski, and L.A. Eriksson, IEEE Trans. Nucl. Sci. 56[3] (2009) 915-919.
-

- 11. C.L. Melcher and J.S. Schweitzer, IEEE Trans. Nucl. Sci. 39[4] (1992) 502-505.
-

- 12. P.L. Reeder, Nucl. Instrum. Methods Phys. Res. A 353[1-3] (1994) 134-136.
-

- 13. M. Moszynski, M. Kapusta, M. Mayhugh, D. Wolski, and S.O. Flyckt, IEEE Trans. Nucl. Sci., 44[3] (1997) 1052-1061.
-

- 14. A. Lempicki, M.H. Randles, D. Wisniewski, M. Balcerzyk, C. Brecher, and A.J. Wojtowicz, IEEE Trans. Nucl. Sci. 42[4] (1995) 280-284.
-

- 15. S. Yamamoto, J. Kataoka, T. Oshima, Y. Ogata, T. Watabe, H. Ikeda, Y. Kanai, and J. Hatazawa, Nucl. Instrum. Methods Phys. Res. A 821 (2016) 28-33.
-

- 16. Y. Wu and G. Ren, Opt. Mater. 35[12] (2013) 2146-2154.
-

- 17. I. Kandarakis and D. Cavouras, Applied Radiation and Isotopes 54[5] (2001) 821-831.
-

- 18. W. Brigitte and D.P. Jill, Mater. Sci. Eng. C 25 (2005) 131-143.
-

- 19. S. Qingle and H. Zhang, J. Rare Earths 30[12] (2012) 1235-1239.
-

- 20. X. Han, J. Lin, Z. Li, X. Qi, M. Li, and X. Wang, J. Rare Earths 26[6] (2008) 904-906.
-

- 21. T. Igashira, N. Kawano, G. Okada, N. Kawaguchi, and T. Yanagida, Optik 155 (2018) 36-42.
-

- 22. T. Igashira, N. Kawano, G. Okada, N. Kawaguchi, and T. Yanagida, Opt. Mater. 79 (2018) 232-236.
-

- 23. T. Igashira, N. Kawano, G. Okada, N. Kawaguchi, and T. Yanagida, J. Mater. Sci. Mater EL 28[24] (2017) 18630-18636.
-

- 24. T. Igashira, M. Mori, G. Okada, N. Kawaguchi, and T. Yanagida, Opt. Mater. 64 (2017) 239-244.
-

- 25. T. Igashira, M. Mori, G. Okada, N. Kawaguchi, and T. Yanagida, J. Rare Earths 35[11] (2017) 1071-1076.
-

- 26. T. Yanagida, K. Kamada, Y. Fujimoto, H. Yagi, and T. Yanagitani, Opt. Mater. 35[12] (2013) 2480-2485.
-

- 27. T. Yanagida, Y. Fujimoto, T. Ito, K. Uchiyama, and K. Mori, Appl. Phys. 7[6] (2014) 062401.
-

- 28. D. Sztolberg, B. Brzostowski, and P. J. Dereń, Opt. Mater. 78 (2018) 292-294.
-

- 29. A. Mendoud, L. Guerbous, A. Boukerika, B. Boudine, and N. Benrekaa, Opt. Mater. 75 (2018) 802-808.
-

- 30. S. Mahlik, F. Diaz, and P. Boutinaud, J. Lumin. 191 (2017) 18-21.
-

- 31. J.F.M. dos Santos, N.G.C. Astrath, M.L. Baesso, L.A.O. Nunes, and T. Catund, J. Lumin. 202 (2018) 363-369.
-

- 32. N. Wada and K. Kojima, Opt. Mater. 35 (2013) 1908-1913.
-

- 33. Q. Shi, F. You, S. Huang, H. Peng, Y. Huang, and Y. Tao, Chem. Phys. Lett. 601 (2014) 21-25.
-

- 34. A.C.S. de Melloa Adriano, B.A. Gerson, H.G. Nakamura, S.L. Baldochib Mário, and E.G. Valerio, Opt. Mater. 32[10] (2010) 1337-1340.
-

- 35. S. Jia, L. Huang, D. Ma, Z. Tai, S. Zhao, D. Deng, H. Wang, G. Jia, Y. Hua, Q. Yang, and S. Xu, J. Lumin. 152 (2014) 241-243.
-

- 36. C. Mansuy, J. M. Nedelec, C. Dujardin, and R. Mahiou, Opt. Mater. 29[6] (2007) 697-702.
-

- 37. M. Koshimizu, K. Asai, and H. Shibata, J. Lumin. 94-95 (2001) 407-411.
-

 This Article
-
2019; 20(6): 577-581
Published on Dec 31, 2019
- 10.36410/jcpr.2019.20.6.577
- Received on Nov 14, 2018
- Revised on Jan 17, 2019
- Accepted on May 9, 2019
 Services
- Abstract
introduction
experimental
results and discussion
summary and conclusions
acknowledgement
- References
- Full Text PDF
Shared
 Correspondence to
- Takayuki Yanagida
-
Devision of Materials Science, Nara Institute of Science and Technology, 8916-5 Takayama-cho, Ikoma, Nara 630-0101, Japan
Tel : +81-743-72-6144 Fax: +82-743-72-6147 E-mail: t-yanagida@ms.naist.jp - E-mail: t-yanagida@ms.naist.jp


 Copyright 2019 International Orgranization for Ceramic Processing. All rights reserved.