- Surface-enhanced Raman scattering of reduced graphene coated with silver nanoparticles
Shivi Rathorea, Dinesh Kumar Patelb and Po-Da Honga,*
aDepartment of Materials Science and Engineering, National Taiwan University of Science and Technology, Taipei, 10607, Taiwan
bDepartment of Physics, National Taiwan University, Taipei, 10617, Taiwan
Recently carbon based materials such as graphene and silver nanoparticles hybrid become very important for a variety of applications including bio-medical, waste water treatment, solar energy, chemical sensors, electronics etc. We have studied the Surface Enhanced Raman Spectroscopy (SERS) of reduced graphene oxide modified with silver nanoparticles. First, graphene oxide was synthesized by oxidation of graphite powder using KMnO4, NaNO3, H2SO4 and H2O2 and then silver nitrate along with graphene oxide were reduced chemically using Hydrazine Hydrate and the mixture is known as graphene- silver NPs hybrid. The structural and morphological properties of prepared samples were characterized by means of scanning electron microscope (SEM), UV-visible spectroscopy and Raman spectroscopy. We found that the D peak, G peak and 2D peak intensity of Raman spectra has been amplified many times with silver nanoparticles as well as silver nanoparticles intercalate between the layers of graphene oxide, therefore it is also helpful in reduction of graphene oxide.
Keywords: graphene, silver nanoparticles, surface-enhanced Raman spectroscopy
Graphene is a single atomic layer sheet of hexagonally-arranged, sp2 bonded carbon atoms having a honeycomb structure [1]. It has good thermal conductivity (about 5000 Wm-1K-1), electrical conductivity (0.96 × 10⁶ Ω-1 cm-1), high mechanical strength, and desirable optical properties [2]. The list of its potential applications is correspondingly vast, ranging from uses in the field of composites [3], nanoelectronics [4], energy storage devices [5], transparent electrode for display [6], solar cells, thin film transistors, touch panels, foldable computers, and photo detectors [7, 8]. Nowadays, intense research is being carried out for the integration of graphene and specific metallic nanoparticles like silver, gold and copper, to produce a new generation of hybrid materials, and much of it is driven by such materials’ prospects as sensors, energy storage devices, and general catalysis and super capacitors [9-14].
Metal nanoparticles like Au, Ag, and Cu have unique magnetic, electronic, and optical properties. With a high surface-to-volume ratio, their electronic properties change exceptionally, because the spatial length scale of the electronic motion and the density of the electronic states reducing with decreasing size [15]. Metallic nanoparticles show interesting optical and electronic effects on the 10 nm to 100 nm length scales, primarily because the corresponding mean free path of an electron in metals [16].
In addition, Ag nanoparticles and Au nanoparticles have excellent antibacterial activity and low cytotoxicity as compared to other nonorganic materials, so these can be used in clinical, biomedical, and water filtration fields [17-20]. For instance, graphene-Ag nanoparticle hybrid sheets are able to remove heavy metals like Hg (II) from water [21, 22] while preventing the Ag nanoparticles from accumulating in the filtered water [23].
Metallic nanoparticles (Ag, Au, and Cu) play an important role in wide number of applications such as surface enhanced Raman scattering (SERS), display devices catalysis, microelectronics, light emitting diodes, photovoltaic cells and also in medical or biological applications [24]. Moreover, metal nanoparticles decorated on graphene can alter its electronic, optical and catalytic properties substantially by changing the band gap. This is because of the strong interaction between light and metal nanoparticles due to the localized surface Plasmon resonance (LSPR) leading to a large local electromagnetic field. This electromagnetic field capable of enhancing Raman scattering signal enabling single molecule SERS [25]. Insertion of the nanoparticles on the graphene-based matrix is an important study for the exploration of their properties and application [24].
Graphite powder, KMnO4, 98% H2SO4 and 30% H2O2 aqueous solution were purchased from Qualigens. 25% ammonia solution and Hydrazine Hydrate solution (reagent grade) were purchased from LOBA Chemie and Silver Nitrate (AgNO3) 99.9% (metal basis) was obtained from RFCL Limited.
Preparation of graphite oxide
Graphite oxide was prepared by modified Hummer and Offeman method. The details are as follow: 1 g of natural graphite powder was taken in a 250 mL beaker placed in ice bath 0.5 g of NaNO3 and 30 mL of sulfuric acid were added subsequently to the graphite powder and stirred continuously, 3 g of KMnO4 was then slowly added into the beaker under stirring condition and the temperature of the solution was controlled at 20 ℃. After 30 minutes the ice bath was removed and the mixture was heated at 35 ℃ for about 30 minutes. Then 45 mL of distilled water was slowly added into the solution and stirred for 30 minutes. This was followed by addition of 40 mL hot distilled water and 10 mL of 30% of H2O2 aqueous solution till the bubbles disappeared. The colour of the solution turned to yellow. Finally the solution was centrifuged at 8000 rpm for 10 minutes to remove un-exfoliated graphite oxide. The residue was washed with warm water until it becomes neutral (pH = 7). Finally the residue was dried at 65 ℃ in oven [26-28].
Preparation of graphene oxide
For the preparation of graphene oxide (GO), the 0.01 g powder of prepared graphite oxide was mixed in 100 ml distilled water in a 50 mL round bottom flask. The solution was ultrasonicated for 2 hours. A yellow brown suspension of graphene oxide was obtained [27].
Preparation of reduced graphene oxide
The 100 mL of graphene oxide solution was first taken in a 250 mL round bottom flask. 315 µL of 25% ammonia solution was then added through micro piped and mixture was stirred up to 5 minutes, then 35 mL of hydrazine hydrate was added into it and solution was stirred for 15 minutes. Whole mixture was placed in oil bath at 90 ℃ for 2 hours under the condition of constant with water cooled condenser attached to it Finally we got black coloured solution of reduced graphene oxide (rGO).
Preparation of silver coated reduced graphene oxide
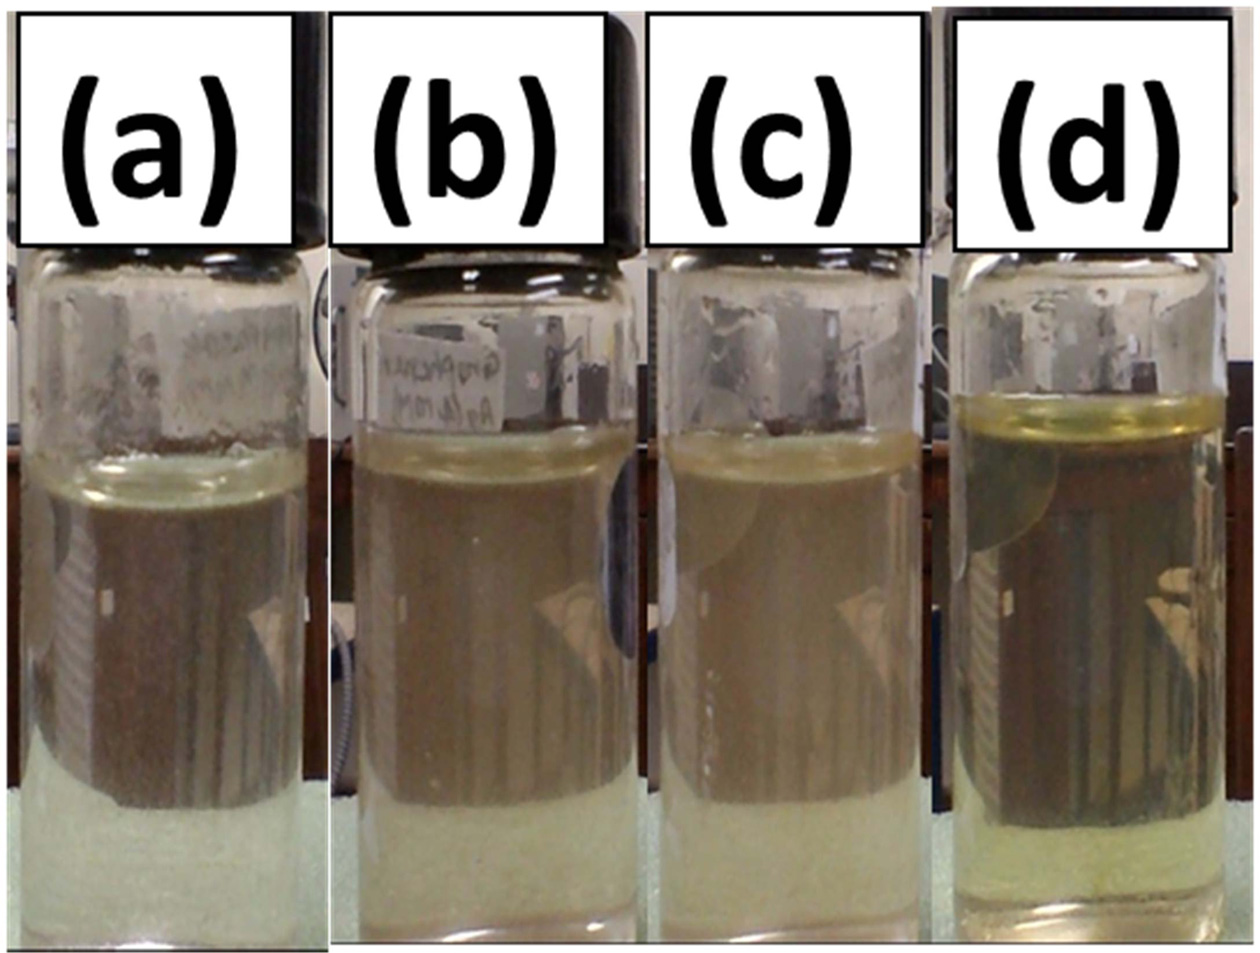
First, took the 100 mL of prepared graphene oxide in 250 mL round bottom flask and then 150 µL of hydrazine hydrate solution was added into it and mixture was stirred for 5 minutes. The pH of mixture was adjusted to 10 by adding 200 µL of ammonia solution (25% in water). The whole mixture was placed in oil bath at 90 ℃ for two hours under constant stirring condition. After 2 hour AgNo3 aqueous solution was added drop wise into graphene oxide dispersion and stirred for 20 minutes to obtained black coloured reduced graphene oxide and silver nanoparticles hybrid dispersion [29]. The volume ratio of AgNo3 solution to reduced graphene oxide dispersion was (1:1). Similarly three more samples in the ratio 2:1, 4:1 and 8:1 of silver nitrate and reduced graphene oxide was synthesized. In Fig. 1 different colour contrast shows the different concentration of Silver nanoparticles with reduced graphene oxide.
|
Fig. 1 Silver and reduced graphene oxide hybrid of the volume ratio (a) 1:1, (b) 2:1, (c) 4:1, (d) 8:1. |
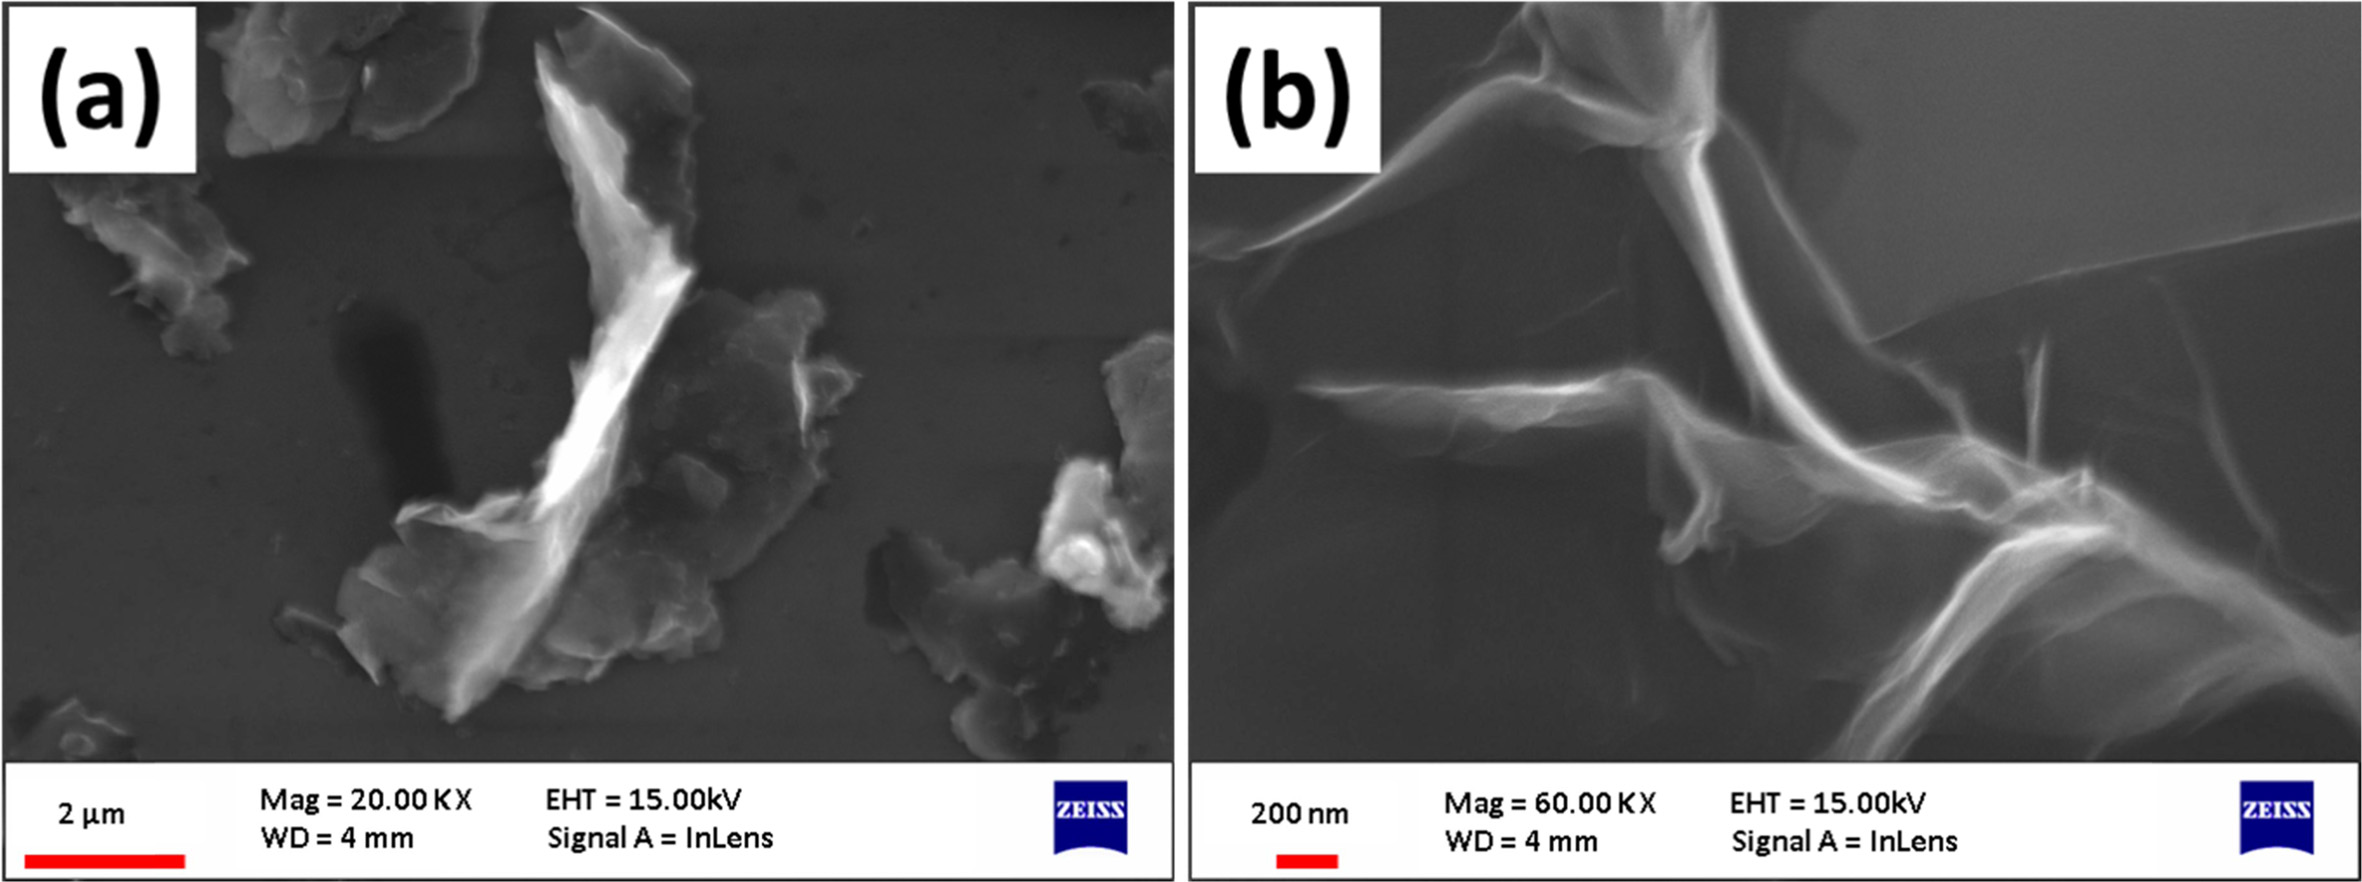
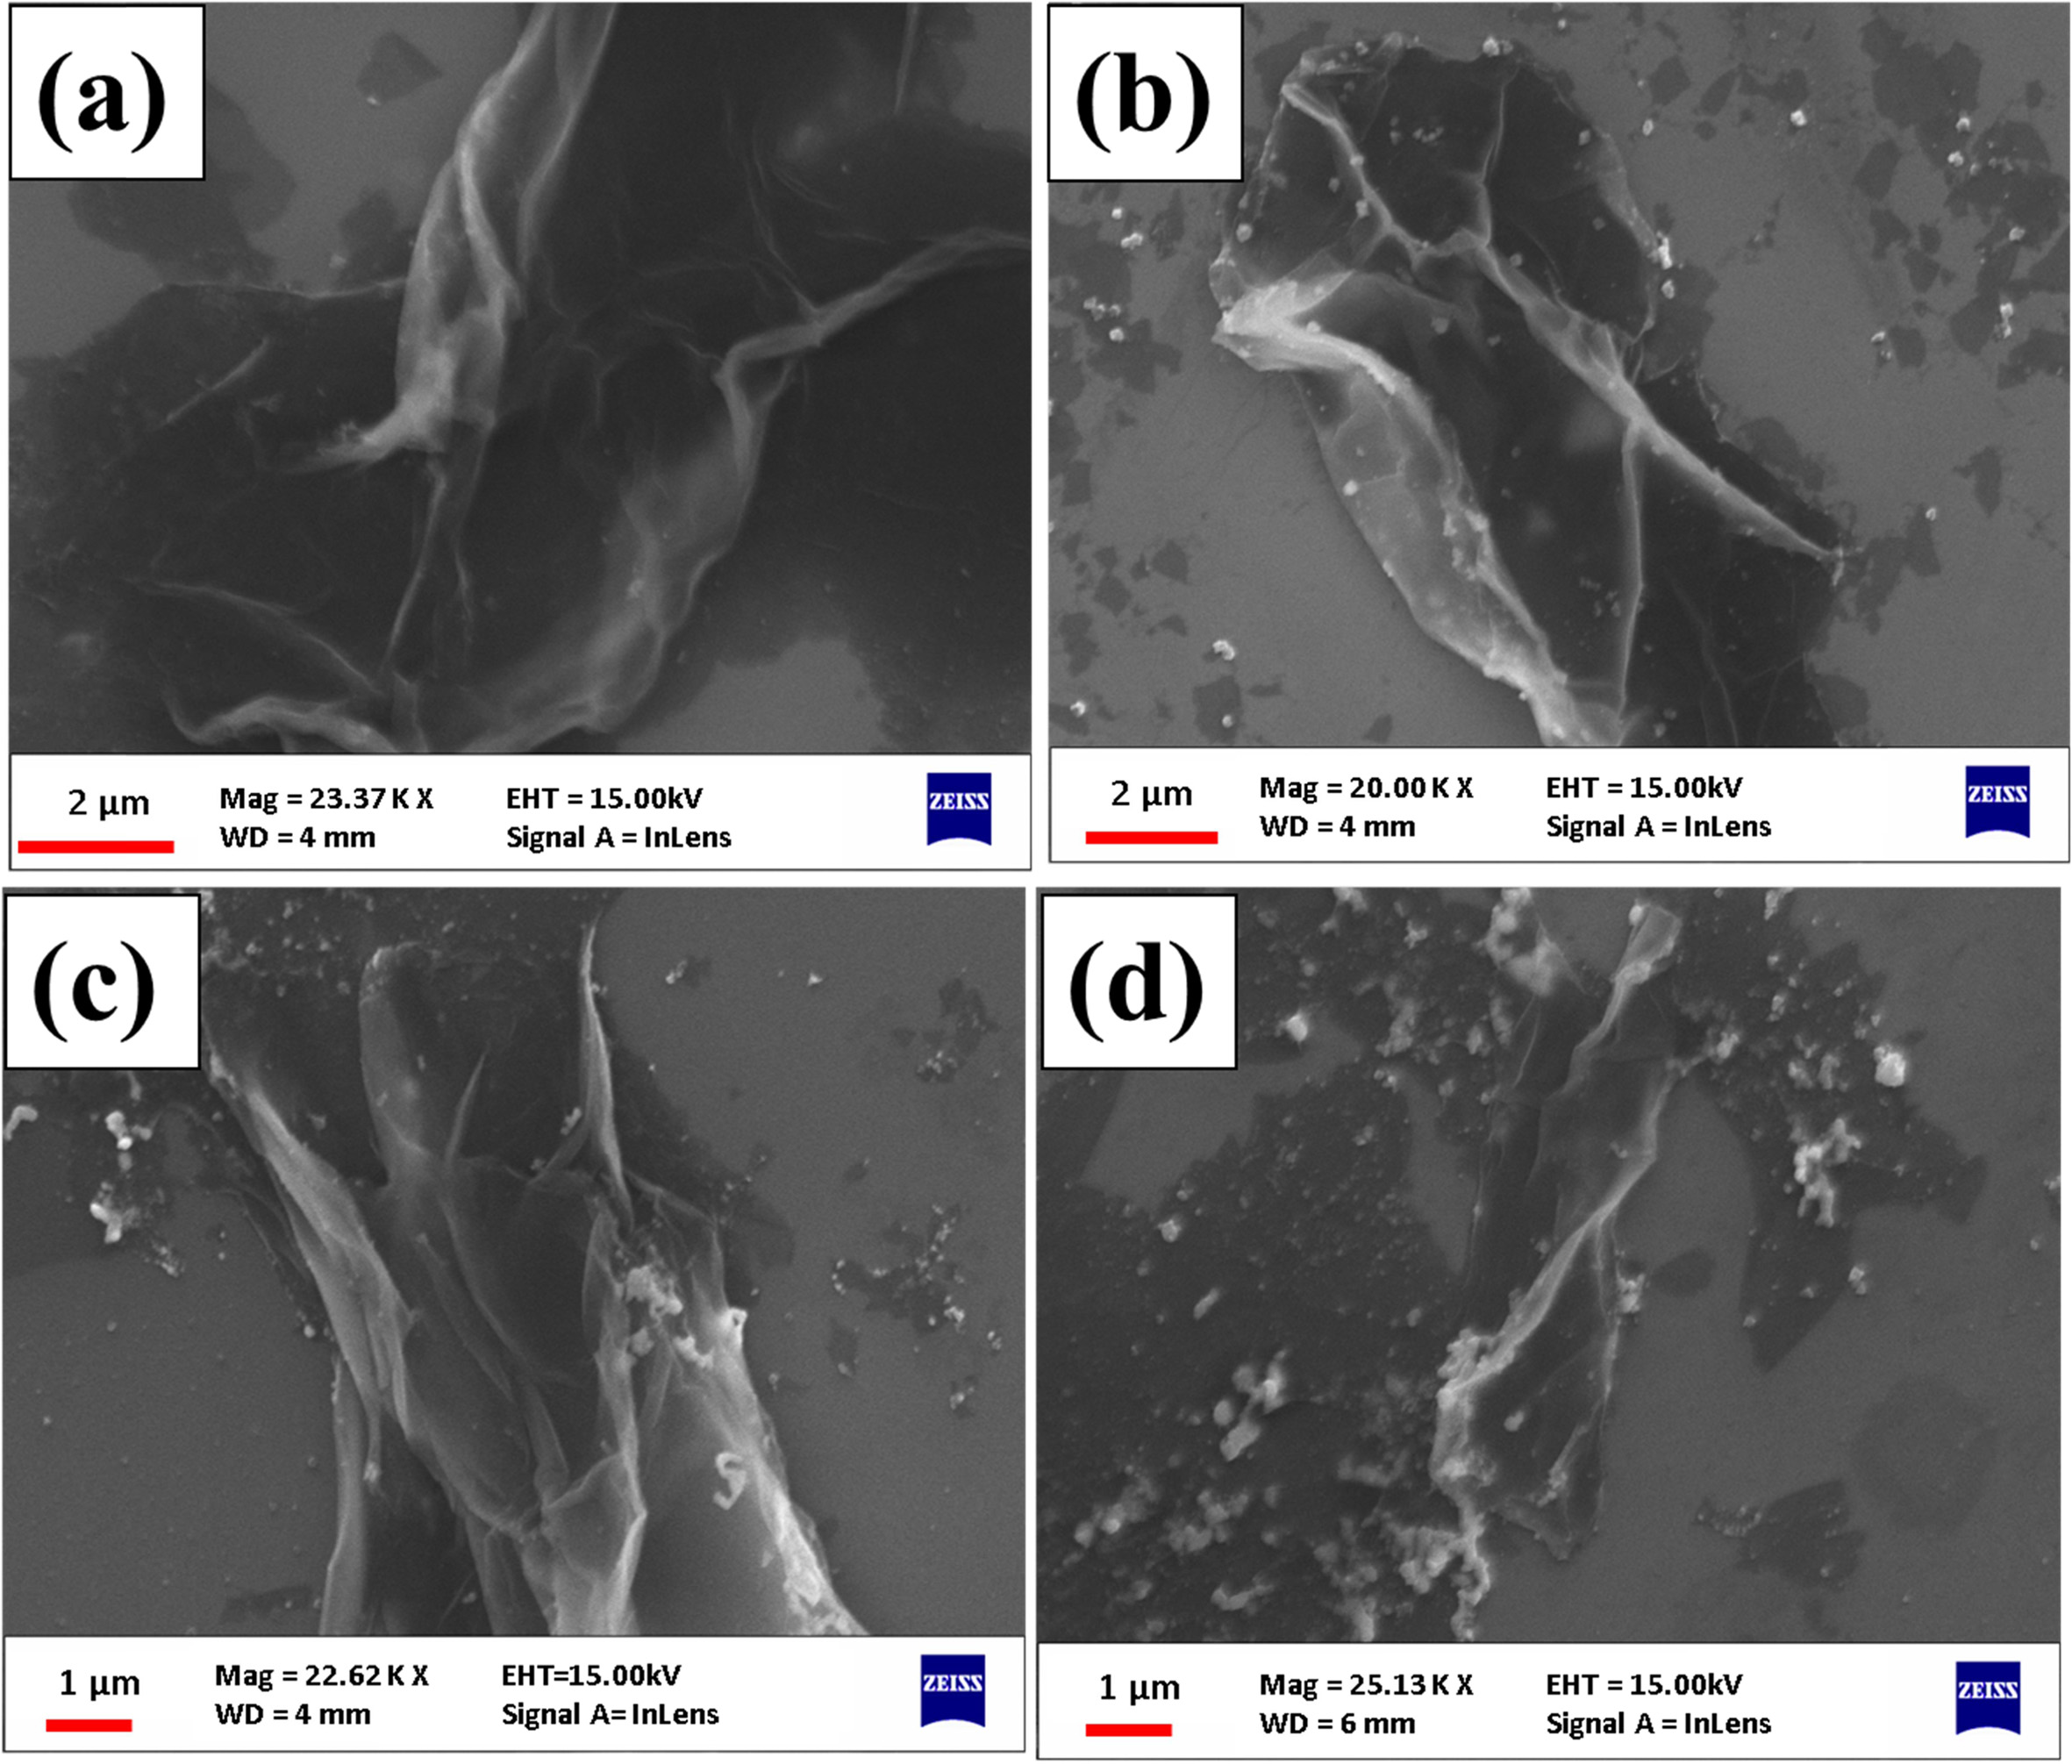
The detail of SEM image has shown in Fig. 2(a). In which Graphene oxide was synthesized by the Hummers Method. We used Hydrazine Hydrates as a reducing agent to reduce the graphene oxide which is shown in Fig. 2(b). And reduced graphene oxide-silver hybrids with increasing concentration of silver nanoparticles are shown in Fig. 3. The discrete bright dots of silver nanoparticles are uniformly distributed on the reduced graphene oxide sheets. Some silver nanoparticle aggregations are also seen on the reduced graphene oxide surface. Therefore the results indicate the formation of reduced graphene oxide-silver nanoparticles hybrids.
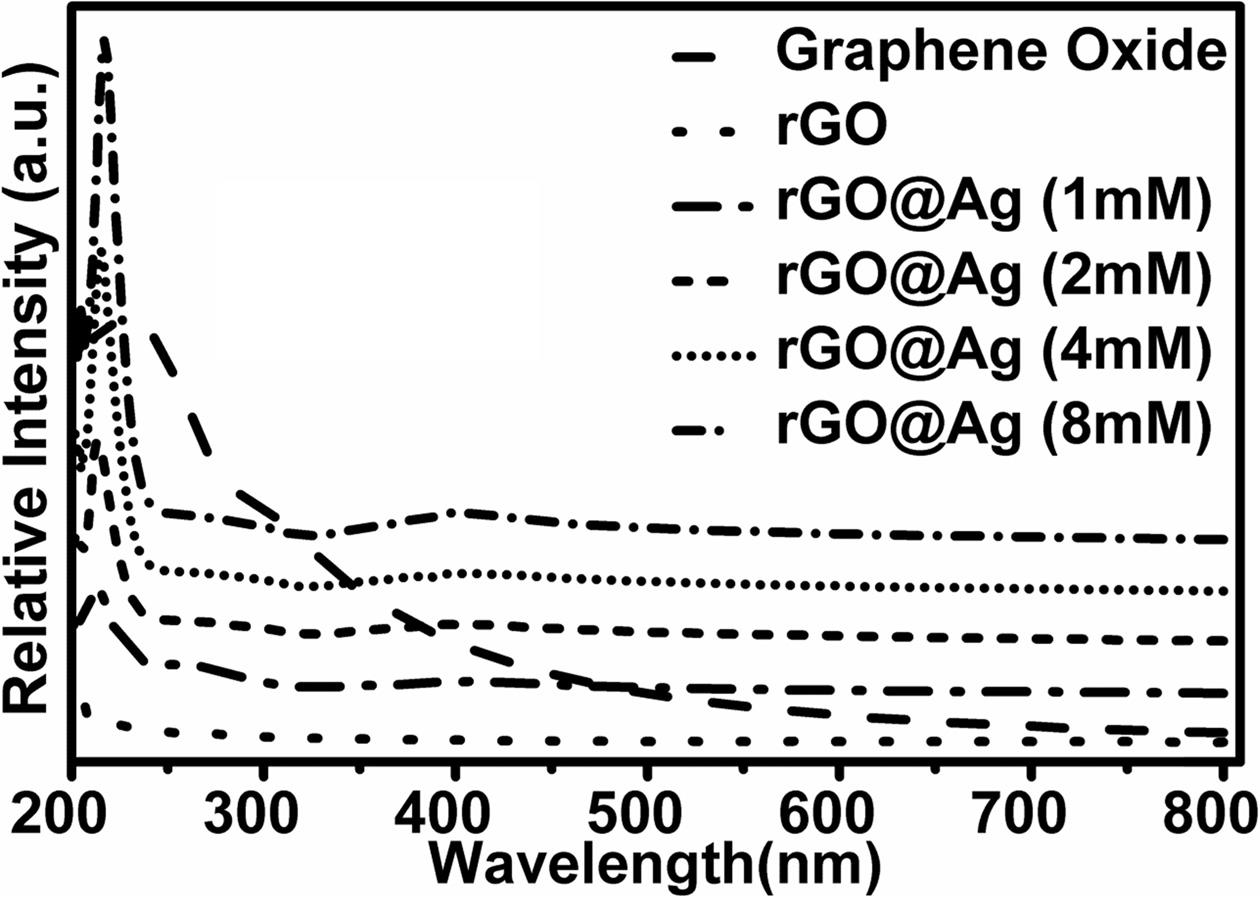
The ultra-violate visible (UV-V) absorption spectra of silver doped reduced graphene oxide are shown in Fig. 4. It shows that there are only two prominent peaks at 216 nm and 400 nm. The 400 nm peak arises due to the surface Plasmon resonance (SPR) of silver nanoparticles and the peak at 216 nm belongs to the graphene.
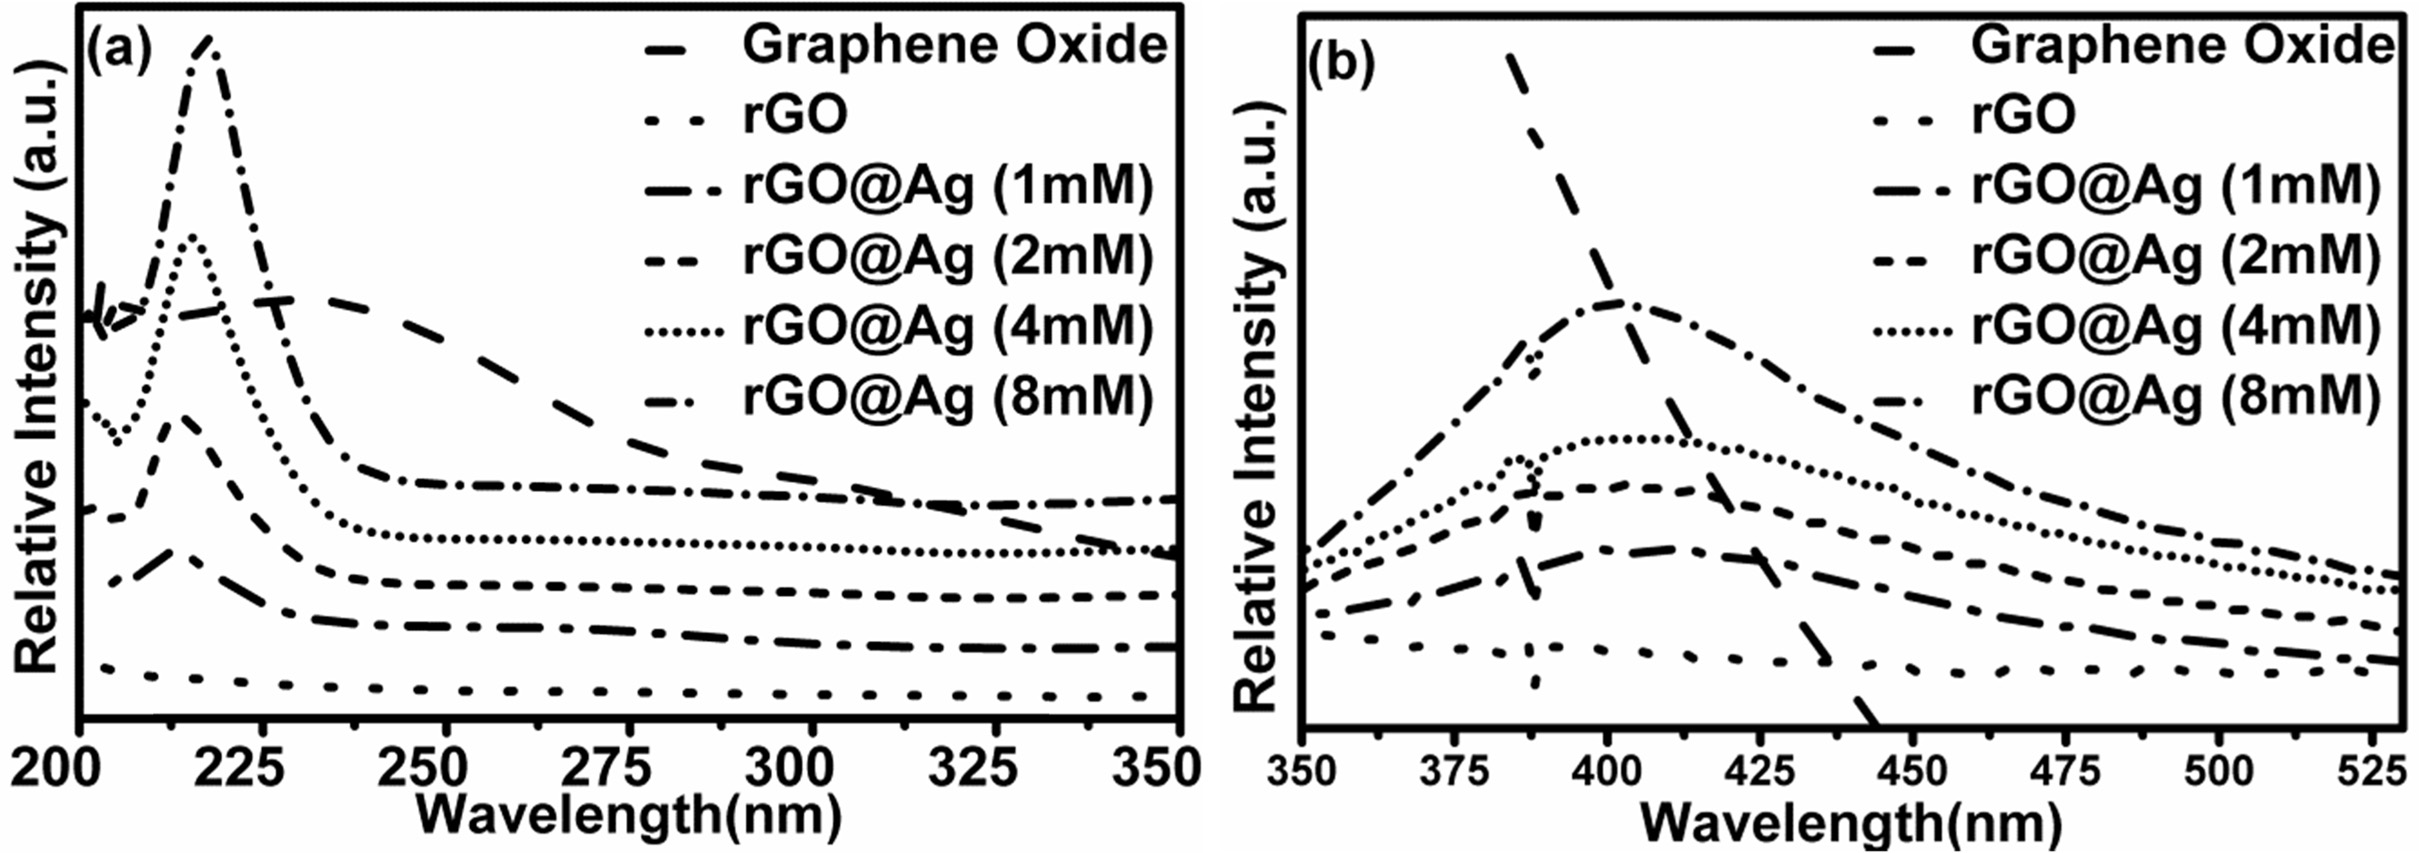
Fig. 5(a), is the zoom of Fig. 4 from 200 to 350 nm range. It shows graphene peak without silver doped is around 206 nm and silver doped rGO around 216 nm, which is blue shifted by 10 nm. This blue shift occurs due to the charge transfer interaction between rGO and silver nanoparticles. Also, the position of silver decorated rGO shifted from 216 nm to higher wave number due to some reaction between graphene and silver nanoparticles. Therefore, silver nanoparticles have some effect on the rGO absorption peak. Fig. 5(b) is UV visible spectra of rGO and silver nano-particles hybrid with various Ag concentrations. There is no change in peak position at 400 nm with all concentration of silver nanoparticles. It indicates that all silver nanoparticles have nearly same size and shape [24].
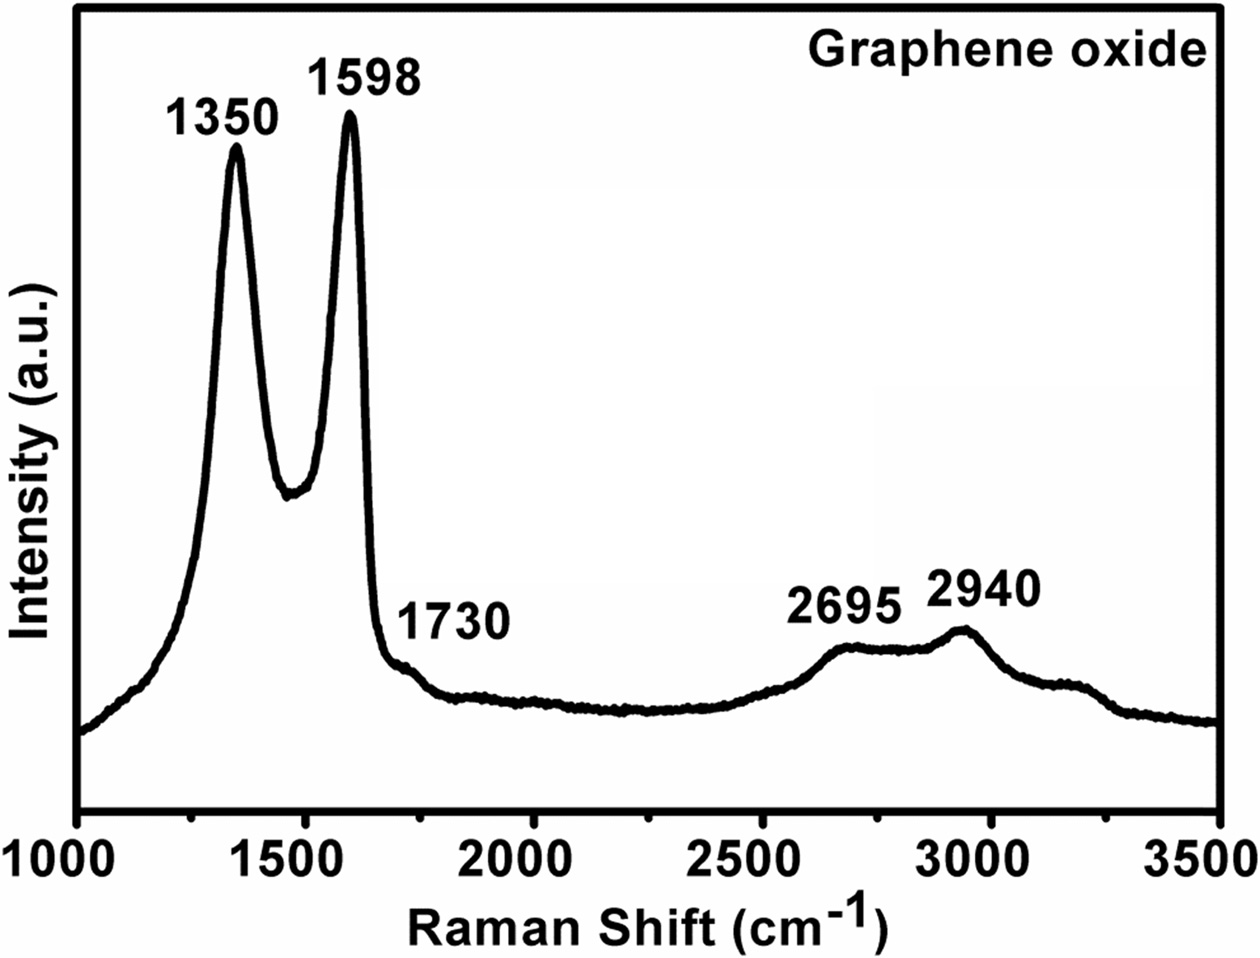
Horiba LabRam HR, Micro Raman tool was used with a high-resolution spectrometer with excitation laser wavelength 514.5 nm. Fig. 6 shows a set of typical Raman spectra of as prepared graphene oxide. The strong Raman spectra show the presence of D band and G band as well 2D band. The strong G band at 1598 cm-1 is the E2g mode arises due to in-plane stretching of sp3 bonded carbon atoms in the hexagonal lattice which indicate the graphitic nature and D band at 1350 cm-1, arises from vibrations of sp2-hexagonal carbon ring due the presence of defect. This D mode originates from the transverse optical phonon due to the intervalley double resonance process at Brillouin zone corner K, such as vacancy or grain boundaries [25, 26, 30]. There is also D' peak at 1730 cm-1 which comes from double resonance in an intervalley process. It means connecting two points belong to the same Dirac cone around K or K'. The 2D peak at 2695 cm-1 is the D peak overtone (second order). It originated from a process where momentum conservation is satisfied by two phonon process with opposite wave vectors. The peak around 2940 cm-1 is the combination of D and Dꞌ peak which is a result of double resonance from intervalley process [25, 26].
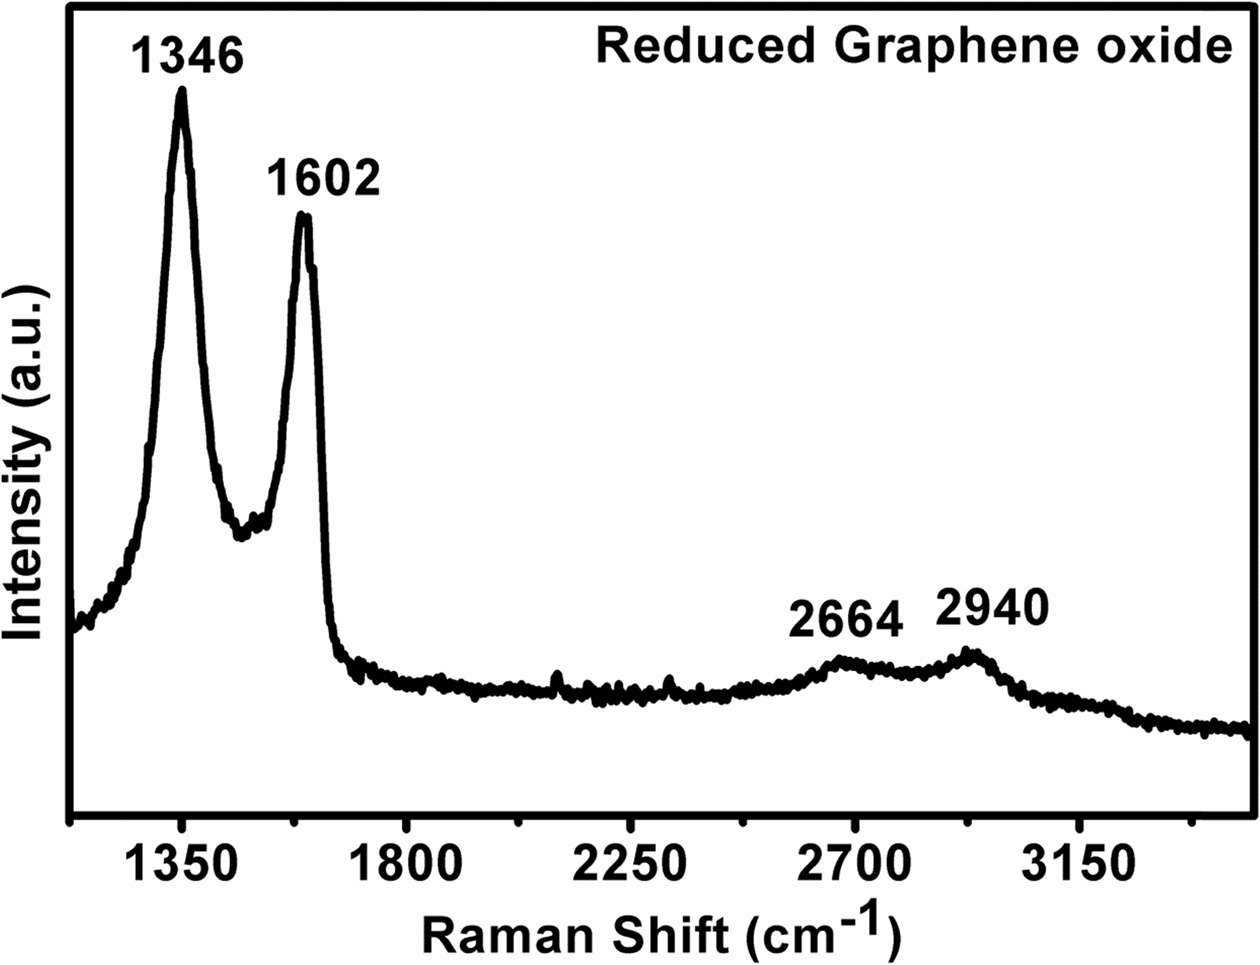
Fig. 7 show the Raman spectra of reduced graphene oxide, which was reduced by hydrazine hydrate from graphene oxide. It shows a significant shift in the position of D band, G band and 2D band of reduced graphene oxide and the position of D peak at 1346 cm-1 and 2D band at 2664 cm-1. The shift of D band in reduced graphene oxide is mainly due to the restoration of conjugated double bonds and the increase in number of sp2-bonded carbon atoms in the graphene during the reduction of graphene oxide. The peak for rGO (1602 cm-1) at the G-band was up-shifted compared with that of GO (1598 cm-2) due to the chemical doping. This shift was attributed to the presence of isolated double bonds that resonate at frequencies higher than that of the G-band of the GO [31-33]. The shift in 2D peak position and higher intensity of D peak with G peak indicates the number of graphene layer reduces from graphene oxide to reduced graphene oxide.
Analysis the Raman data by fitting the Lorentzian curve in each peak, we can correctly and easily calculate the details about intensity and full width half maxima (FWHM). Table 1 shows the ratio of the intensities of D and G bands (ID/IG) in the graphene oxide and reduced graphene oxide. It is to be noted that the ratio, (ID/IG) also measure of disordered carbon and normally expresses (sp2/sp3) carbon ratio. It can be observed that ID/IG value increases from graphene oxide to reduced graphene oxide. The increase in the value indicates the relative increase of sp2 domains and decrease of average crystallite size [34, 35].
The ratio is found to be inversely proportional to the crystallite size [34], which is given below:
La = (2.4 × 10⁻¹⁰)λ4laser(ID/IG)-1
Increase in the value of ID/IG also means restoration of numerous graphitic domains from the amorphous regions of graphite oxide, which in turn give rise to a strong D band signal in the reduced graphene oxide with respect to graphene oxide as the number of defects increases during reduction. ID/IG value is also a measure of number of layers in a graphene sample and its overall stacking behaviour. High ID/IG value means high degree of exfoliation. The broad 2D band in graphene is due to the presence of multiple layers of graphene. The FWHM value of D band and G band shows the decreasing of number of layers from graphene oxide to reduced graphene oxide.
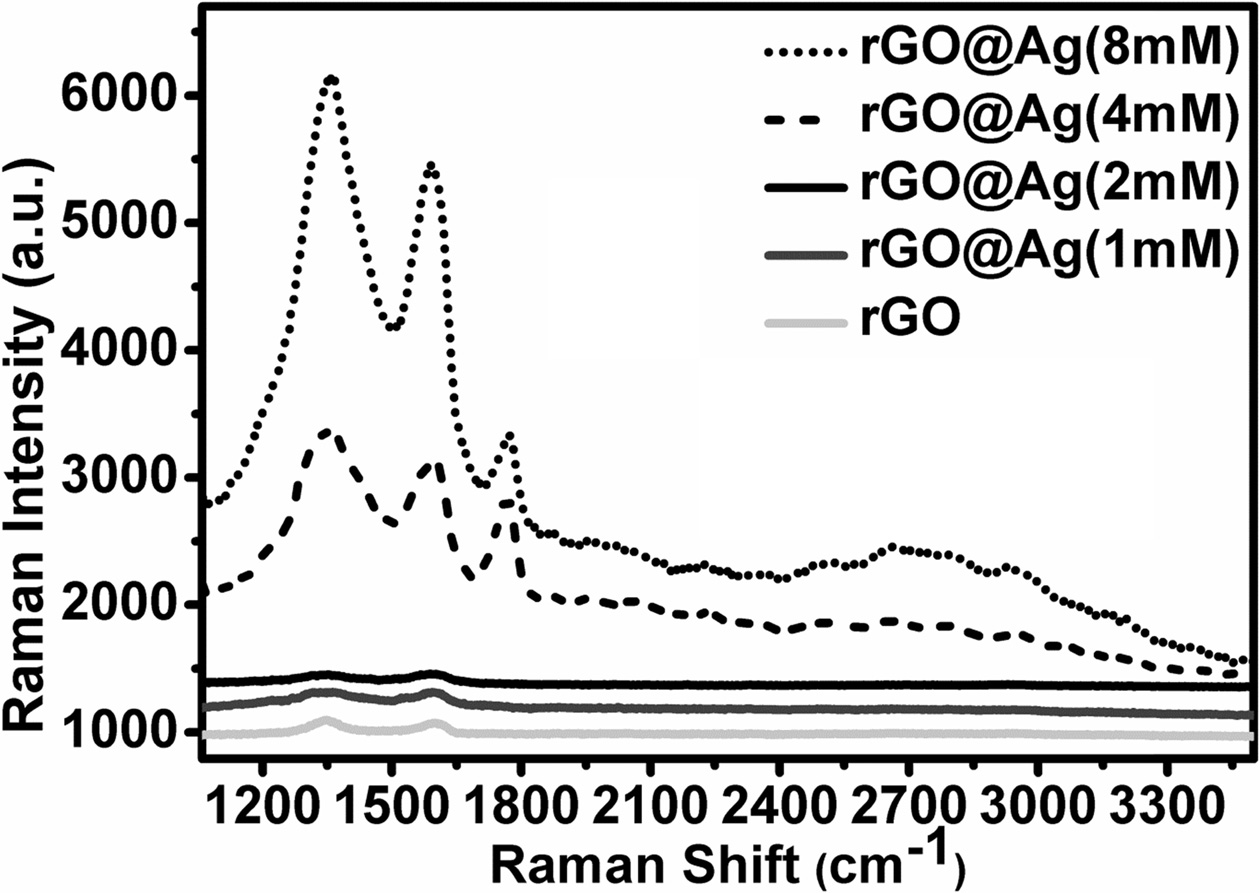
Fig. 8, shows the Raman spectra of silver doped reduced graphene oxide, in which D band (defect band), G band (graphite band) are present. After combination of silver nanoparticles with reduced graphene oxide, both the intensity and the peak location of D and G band changed drastically. The D peak position is shifted to lower wavenumber side with increasing concentration of silver nanoparticles. Change in D peak position indicates that the change in vibrational energy due to the stretching of sp2-bonded carbon atoms has increased due to the incorporation of silver nanoparticles. Alternatively, G peak shifted towards higher wavenumber side with concentration of silver nanoparticles because of the isolation of double bonds in carbon atoms by the intercalation of silver nanoparticles and that isolated double bonds resonate at higher frequencies [33]. The overall intensities of D and G peaks increase with increase in the concentration of silver nanoparticles. This Raman enhancement may have two reasons, one caused by the surface plasmon resonance of silver nanoparticles near defect in graphene and the second one due to the enhanced defect density in silver-graphene composite. Surface plasmon resonance became more intense when the contact area between reduced graphene oxide and silver nanoparticles increases with the concentration of silver nanoparticles. As the contact area increases, charge transfer complex between silver nanoparticles and graphene also increases. And each accelerated charge emitted the radiation. Therefore, scattering increases after silver nanoparticles deposition on graphene. Interestingly notice that the D' peak became more prominent with increasing of silver nanoparticles concentrations. It indicts that may be higher concentration of silver nanoparticles helpful in intervalley process.
Lorentzian analysis is helpful for analysis of all type of Raman data, so we use again this Lorentzian fitting for all silver decorated reduced graphene oxide. Table 2 indicate the ID/IG value increases with increasing concentration of silver nanoparticles, because the increasing number of sp2 domain and decrease in the average crystalline size of the sp2 domains. The FWHM of D band and G band decreases with increasing the concentration of silver nanoparticles. It suggests that the silver nanoparticles also intercalate in between the layer of reduced graphene oxide and helpful to make thinner layer of reduced graphene oxide.
|
Fig. 2 SEM image of (a) graphene oxide (b) reduced graphene oxide. |
|
Fig. 3 (a), (b), (c) and (d) are the SEM image of reduced graphene oxide coated with 1 mM, 2 mM, 4 mM, and 8 mM concentration of silver nanoparticles respectively. |
|
Fig. 4 UV absorption spectra of graphene oxide, reduced graphene oxide and silver doped reduced graphene oxide with 1 mM, 2 mM, 4 mM, and 8 mM concentrations. |
|
Fig. 5 Enlarged view of Fig. 4. |
|
Fig. 6 Raman spectra of graphene oxide. |
|
Fig. 7 Raman Spectra of reduced Graphene oxide. |
|
Fig. 8 Raman spectra of silver doped reduced graphene oxide with different concentration of Ag. |
|
Table 2 Raman data of Silver doped reduced graphene oxide with different concentration of Silver nanoparticles. |

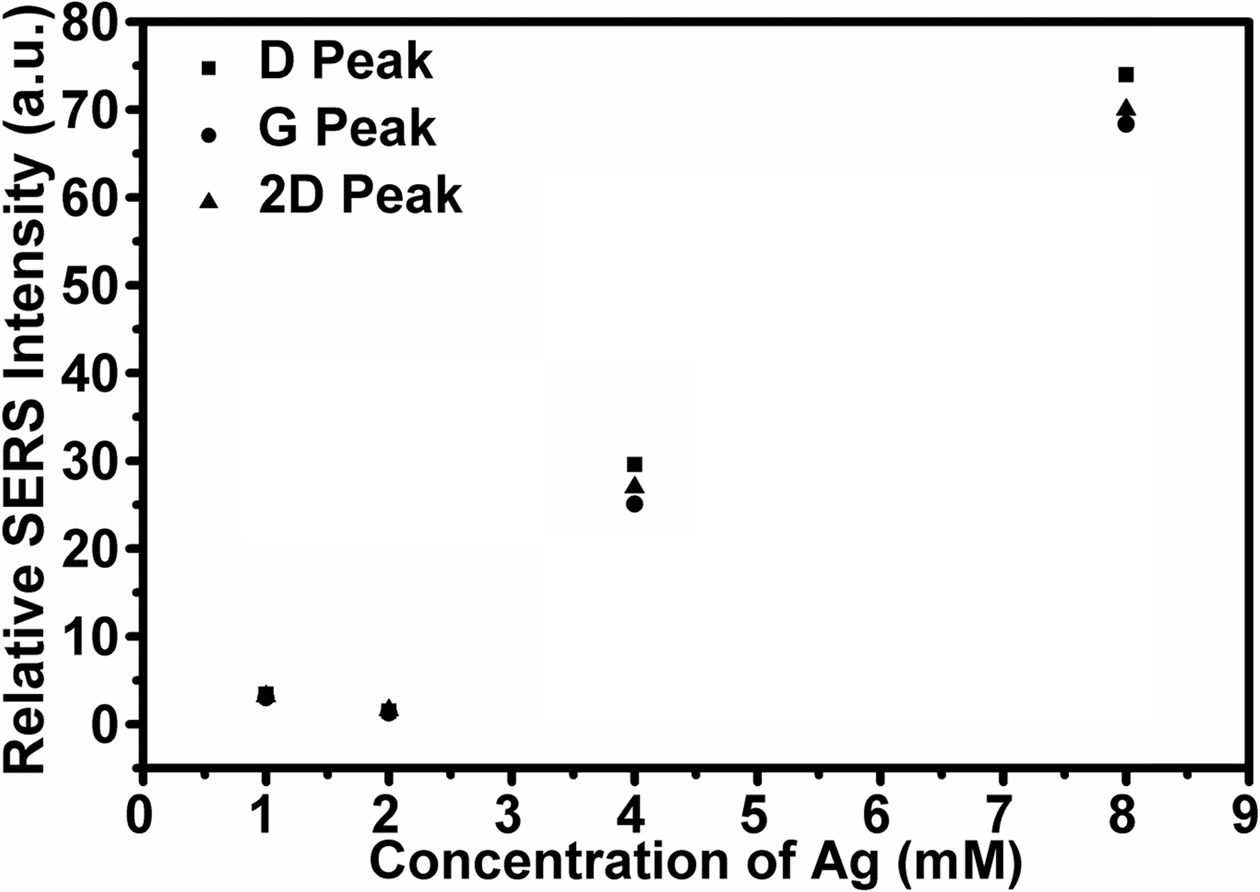
In conclusion, we synthesized silver nanoparticles graphene oxide composite and mainly perform Raman experiment to analyse the enhancement in Raman signal with silver and without silver decorated reduced graphene oxide. Fig. 9, shows the variation of relative SERS intensity with concentration of silver nanoparticles. The SERS intensity of D, G and 2D band increases with concentration of silver nanoparticles due to the more charge transfer from silver to the graphene sheet. All resonance bands of graphene can be modified extensively by the incorporation silver nanoparticles also surface Plasmon resonance of the graphene can be altered by incorporation of silver nanoparticles on the surface graphene. Results also indicates that the silver nanoparticles have ability to reduce the graphene flake.
|
Fig. 9 The variation of relative SERS intensity with concentration of Silver nanoparticles. |
- 1. A.K. Geim, and K.S. Novoselov, Nature Materials, 6 (2007) 183-191.
-

- 2. The Royel Swedish Academy of science, Scientific Background on the Nobel Prize in Physics, (2010) 1-10.
- 3. U. Khan, P. May, A. O’Neill, and J.N Coleman, Carbon, 48[14] (2010) 4035-4041.
-

- 4. D.A. Areshkin, and C.T. White, Nano Lett., 7[11] (2007) 3253-3259.
-

- 5. M.D. Stoller, S. Park, Y. Zhu, J. An, and R.S. Ruoff, Nano. Lett., 8[10] (2008) 3498-3502.
-

- 6. S.J. Wang, Y. Geng., Q. Zheng, and J.K. Kim, Carbon, 48[6] (2010) 1815-1823.
-

- 7. X. Wang., L. Zhi, and K. Mullen, Nano Lett, 8[1] (2008) 323-327.
-

- 8. A.K.M.M. Haque, T.J. Lee, H.M. Jeong, and H.S. Chung, in 7th International Conference on Cooling & Heating Technologies, 2014, IOP Conf. series: material science and engineering, 88 (2015) 012050.
-

- 9. M. Song, J. Xu, and C. Wu, Journal of Nanotechnology, 12 (2012).
-

- 10. J. Li, and C.Y. Liu, Eur. J. Inorg. Chem., 2010[8] (2010) 1244-1248.
-

- 11. N. Tian, Z.Y. Zhou, S.G. Sun, and Y. Ding, Z.L. Wang, Science, 316[5825] (2007) 732-735.
-

- 12. R. Ferrando, in “Elsevier”, 10, (2016) 2-337.
- 13. B. Lim, M. Jiang, P.H.C. Camargo, E.C. Cho, J. Tao, X. Lu, Y. Zhu, and Y. Xia, Science, 324[5932] (2009) 1302-1305.
-

- 14. J. Zhang., K. Sasaki, E. Sutter, and R.R. Adzic, Science, 315[5809] (2007) 220-222.
-

- 15. A. Henglein, J. Phys. Chem, 97[21] (1993) 5457-5471.
-

- 16. U. Kreibig, and M. Vollmer, in Springer Heidelberg, (1995) 1-436
- 17. Y. Zhou, Y. Kong, S. Kundu, JD. Cirillo, and H. Liang, Journal of Nano-bio-technology, 10[19] (2012) 1-9.
-

- 18. J. Jain, S. Arora, J.M. Rajwade, P. Omray, S. Khandelwal, and K.M. Paknikar, Mol pharmaceuticals, 6[5] (2009) 1388-1401.
-

- 19. J. Liu, and R.H. Hurt, Environ. Sci. Technol, 44[6] (2010) 2169-2175.
-

- 20. B.D. Gusseme, L. Sintubin, L. Baert, E. Thibo, T. Hennebel, G. Verstracete, and N. Boon, Appl. Envirion. Microbiol, 76[4] (2010) 1082-1087.
-

- 21. W. Hu, C. Peng, W. Luo, M. Lu, X. Li, D. Li, Q. Huang, and C. Fan, ACS Nano 4[7] (2010) 4317-4323.
-

- 22. A.K. Meena, G.K. Mishra, P.K. Rai, C. Rajagopal, and P.N. Nagar, Journal of Hazardous Materials B, 122[1-2] (2005) 161-170.
-

- 23. T. Wu, J. Ma, X. Wang, Y. Liu, H. Xu, J. Gao, W. Wang, Y. Liu, and J. Yan, Nanotechnology, 24[12] (2013) 125301.
-

- 24. J. Wu, P. Wang, F. Wang, and Y. Fang, Nanomaterials. 8[10] (2018) 864.
-

- 25. A.C. Ferrari, and D.M. Basko, Nature Nanotechnology 8 (2013) 235-246
-

- 26. W.S. Hummers Jr., and R.E. Offeman, Jour. J. Am. chem. Soc. 80[6] (1958) 1339-1339.
-

- 27. K. Krishnamoorthy, M. Veerapandian, K. Yun and S.J. Kim, Carbon, 53 (2013) 38-49.
-

- 28. J. G. Contreras and F. C. Briones, Mater. Chem. Phys., 153 (2015) 209-220.
-

- 29. Z. Xu, H. Gao, and H. Guoxin, Carbon, 49[14] (2011) 4731-4738.
-

- 30. A.C Ferrari, Solid State Communications, 143[1-2] (2007) 47-57.
-

- 31. R. Voggu, B. Das and C. S. Rout, J. Phys. Condens. Matter, 20 (2008) 472204-472208.
-

- 32. A.C Ferrari and J. Robertson Phys. Rev. B., 61 (2000) 14095-14107.
-

- 33. I. K. Moon, J. Lee, R. S. Ruoff and H. Lee, Nature Communication, 73 (2010) 1-6.
- 34. M. A. Pimenta, G. Dresselhaus, M.S. Dresselhaus, L. G. Cancado, A. Jorio and R. Saito, Phys. Chem. Chem Phys, 9[11] (2007) 1276-1290.
-

- 35. A. Wroblewska, A. Duzynska, J. Judek, L. Stobinski, K. Zeranska, A.P. Gertych. And M. Zdrojek, J. Phys.: Condensed, Matter 29[47] (2017) 475201.
-

 This Article
-
2019; 20(4): 442-448
Published on Aug 31, 2019
- Received on Apr 30, 2019
- Revised on Jul 30, 2019
- Accepted on Aug 2, 2019
 Services
- Abstract
introduction
materials and experiment
results and discussion
conclusions
- References
- Full Text PDF
Shared
 Correspondence to
- Po-Da Hong
-
Department of Materials Science and Engineering, National Taiwan University of Science and Technology, Taipei, 10607, Taiwan
Tel : +886-2-27376539 - E-mail: poda@mail.ntust.edu.tw


 Copyright 2019 International Orgranization for Ceramic Processing. All rights reserved.